
Demon_Trader
474 Posts

Demon_Trader
I'm just a technical analysis trader. I don't claim to be better than anyone else, but these are the lessons and habits I've built through my trading journey.
9 Following
1.5K+ Followers
1.3K+ Liked
Posts
All
Quotes
Demon_Trader
·
--
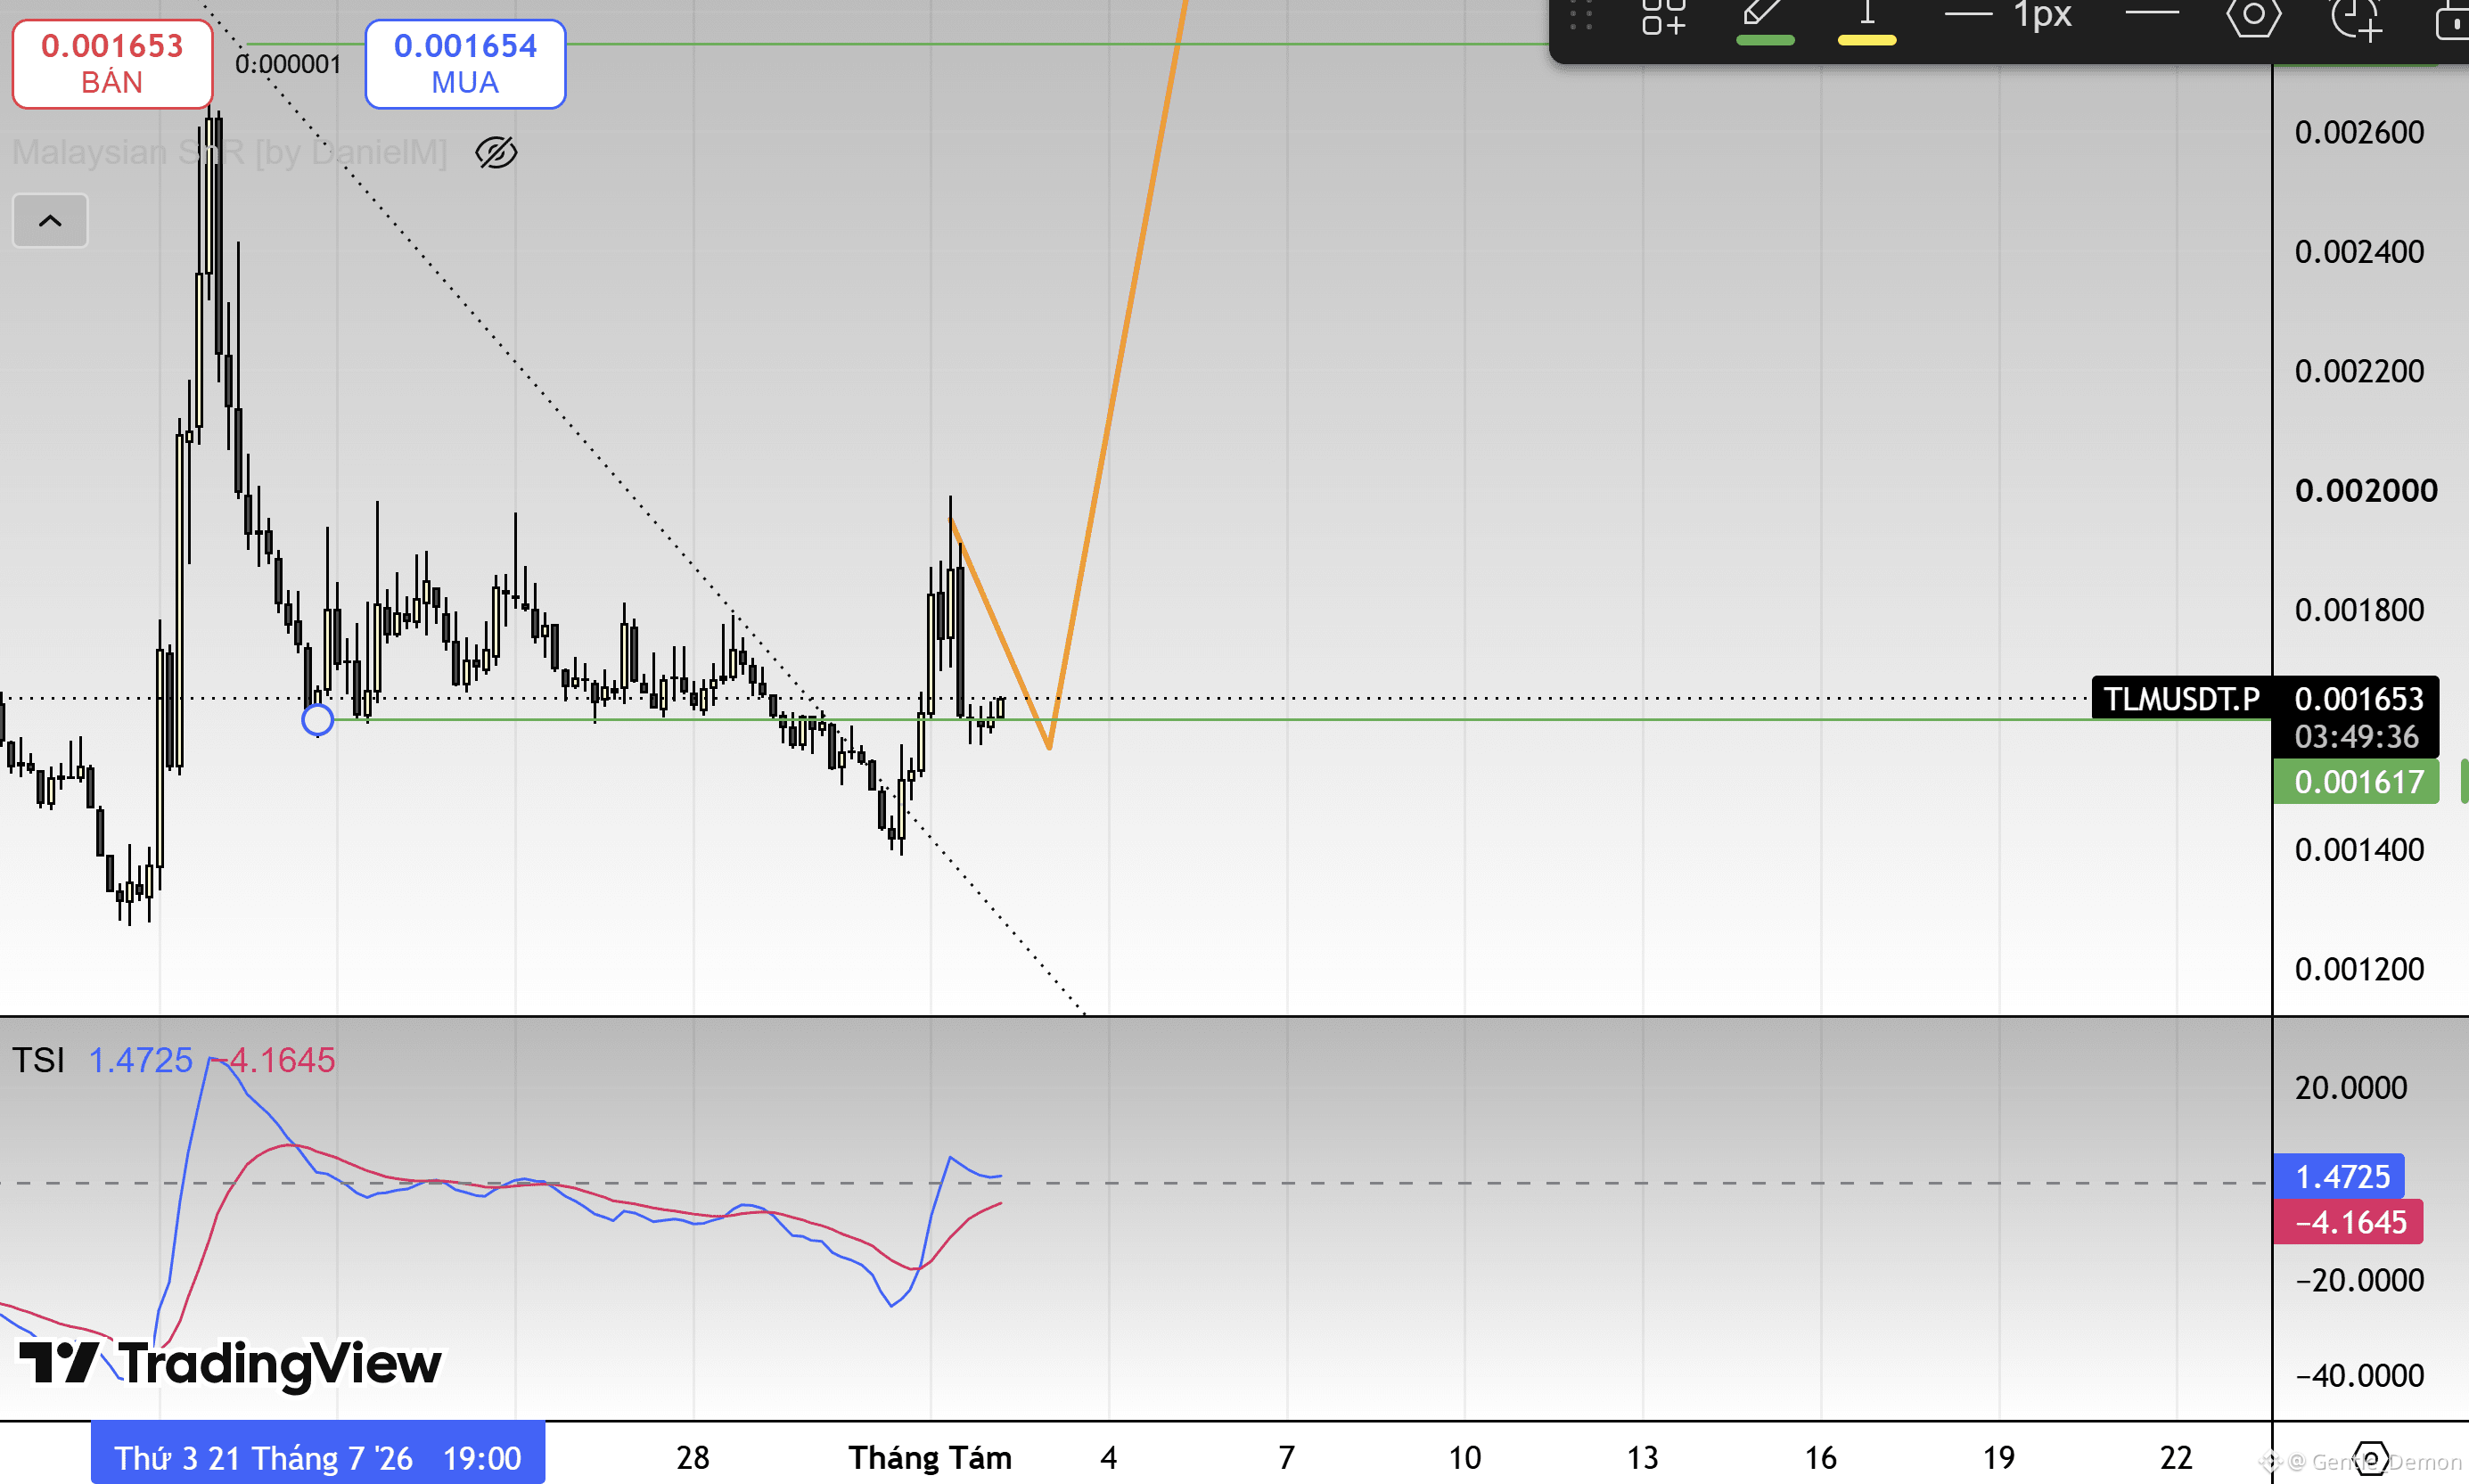
Bullish$TLM đã nổ volume và break trendline, liệu nó có quay lại cho ae lên tàu không, target của anh em cho con này là bao nhiêu?

ARMY TRADER
·
--
Can it be turned on today, I wonder?
Demon_Trader
·
--
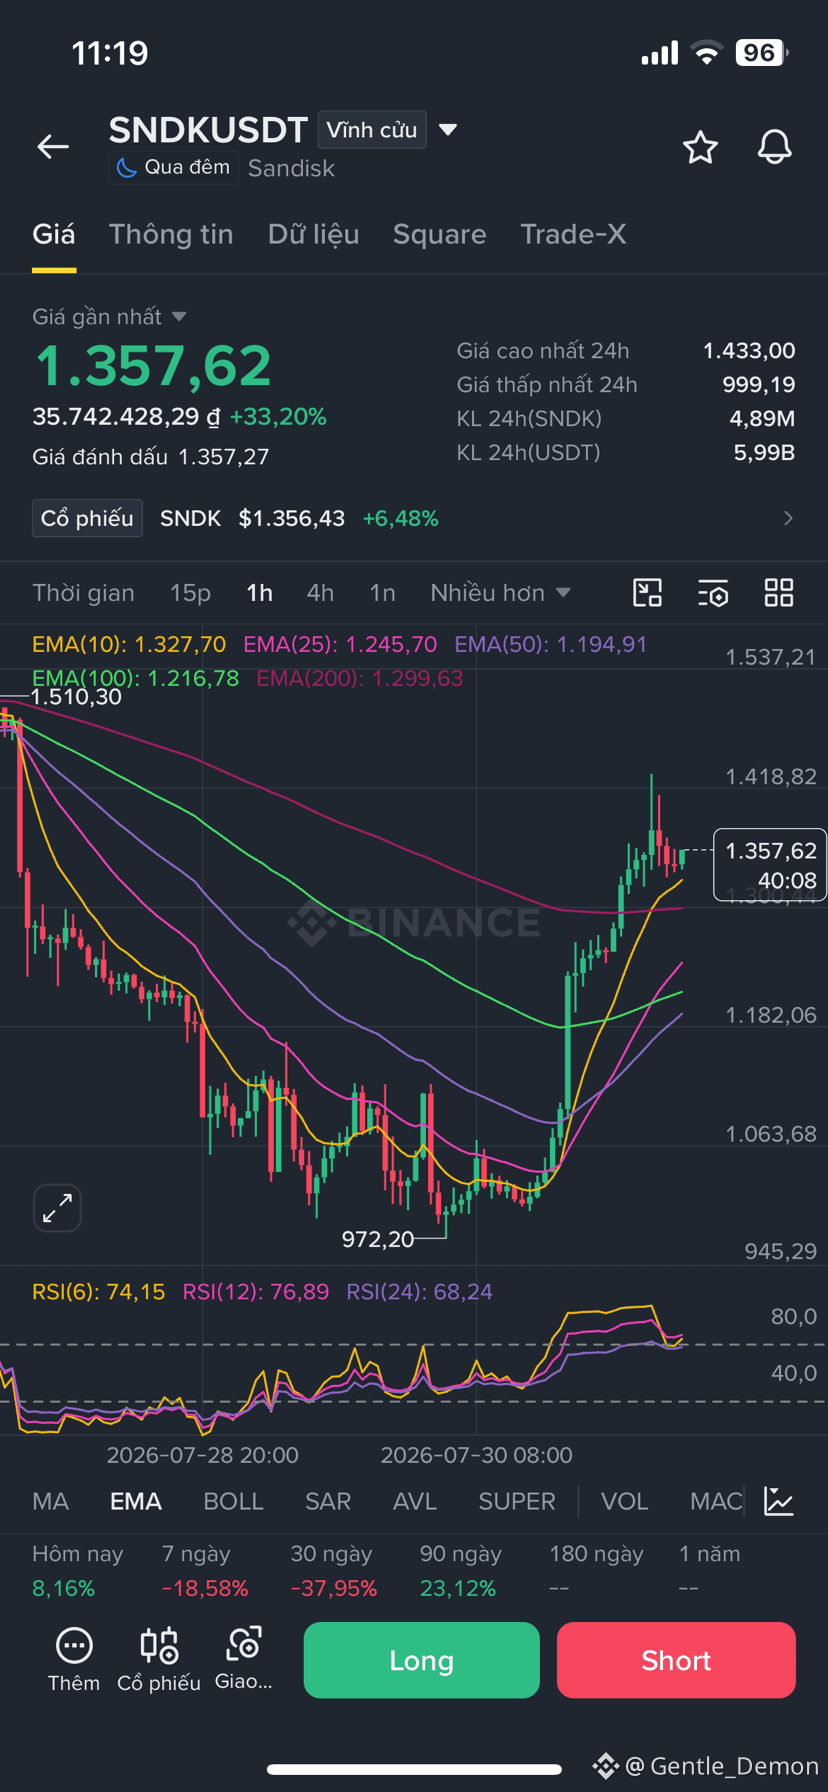
$SNDK có dấu hiệu of forming a base, price is beneath the EMA. Short-term trend is towards the EMA 50, 100, 200 zones. Where do you think this token can go?
Demon_Trader
·
--
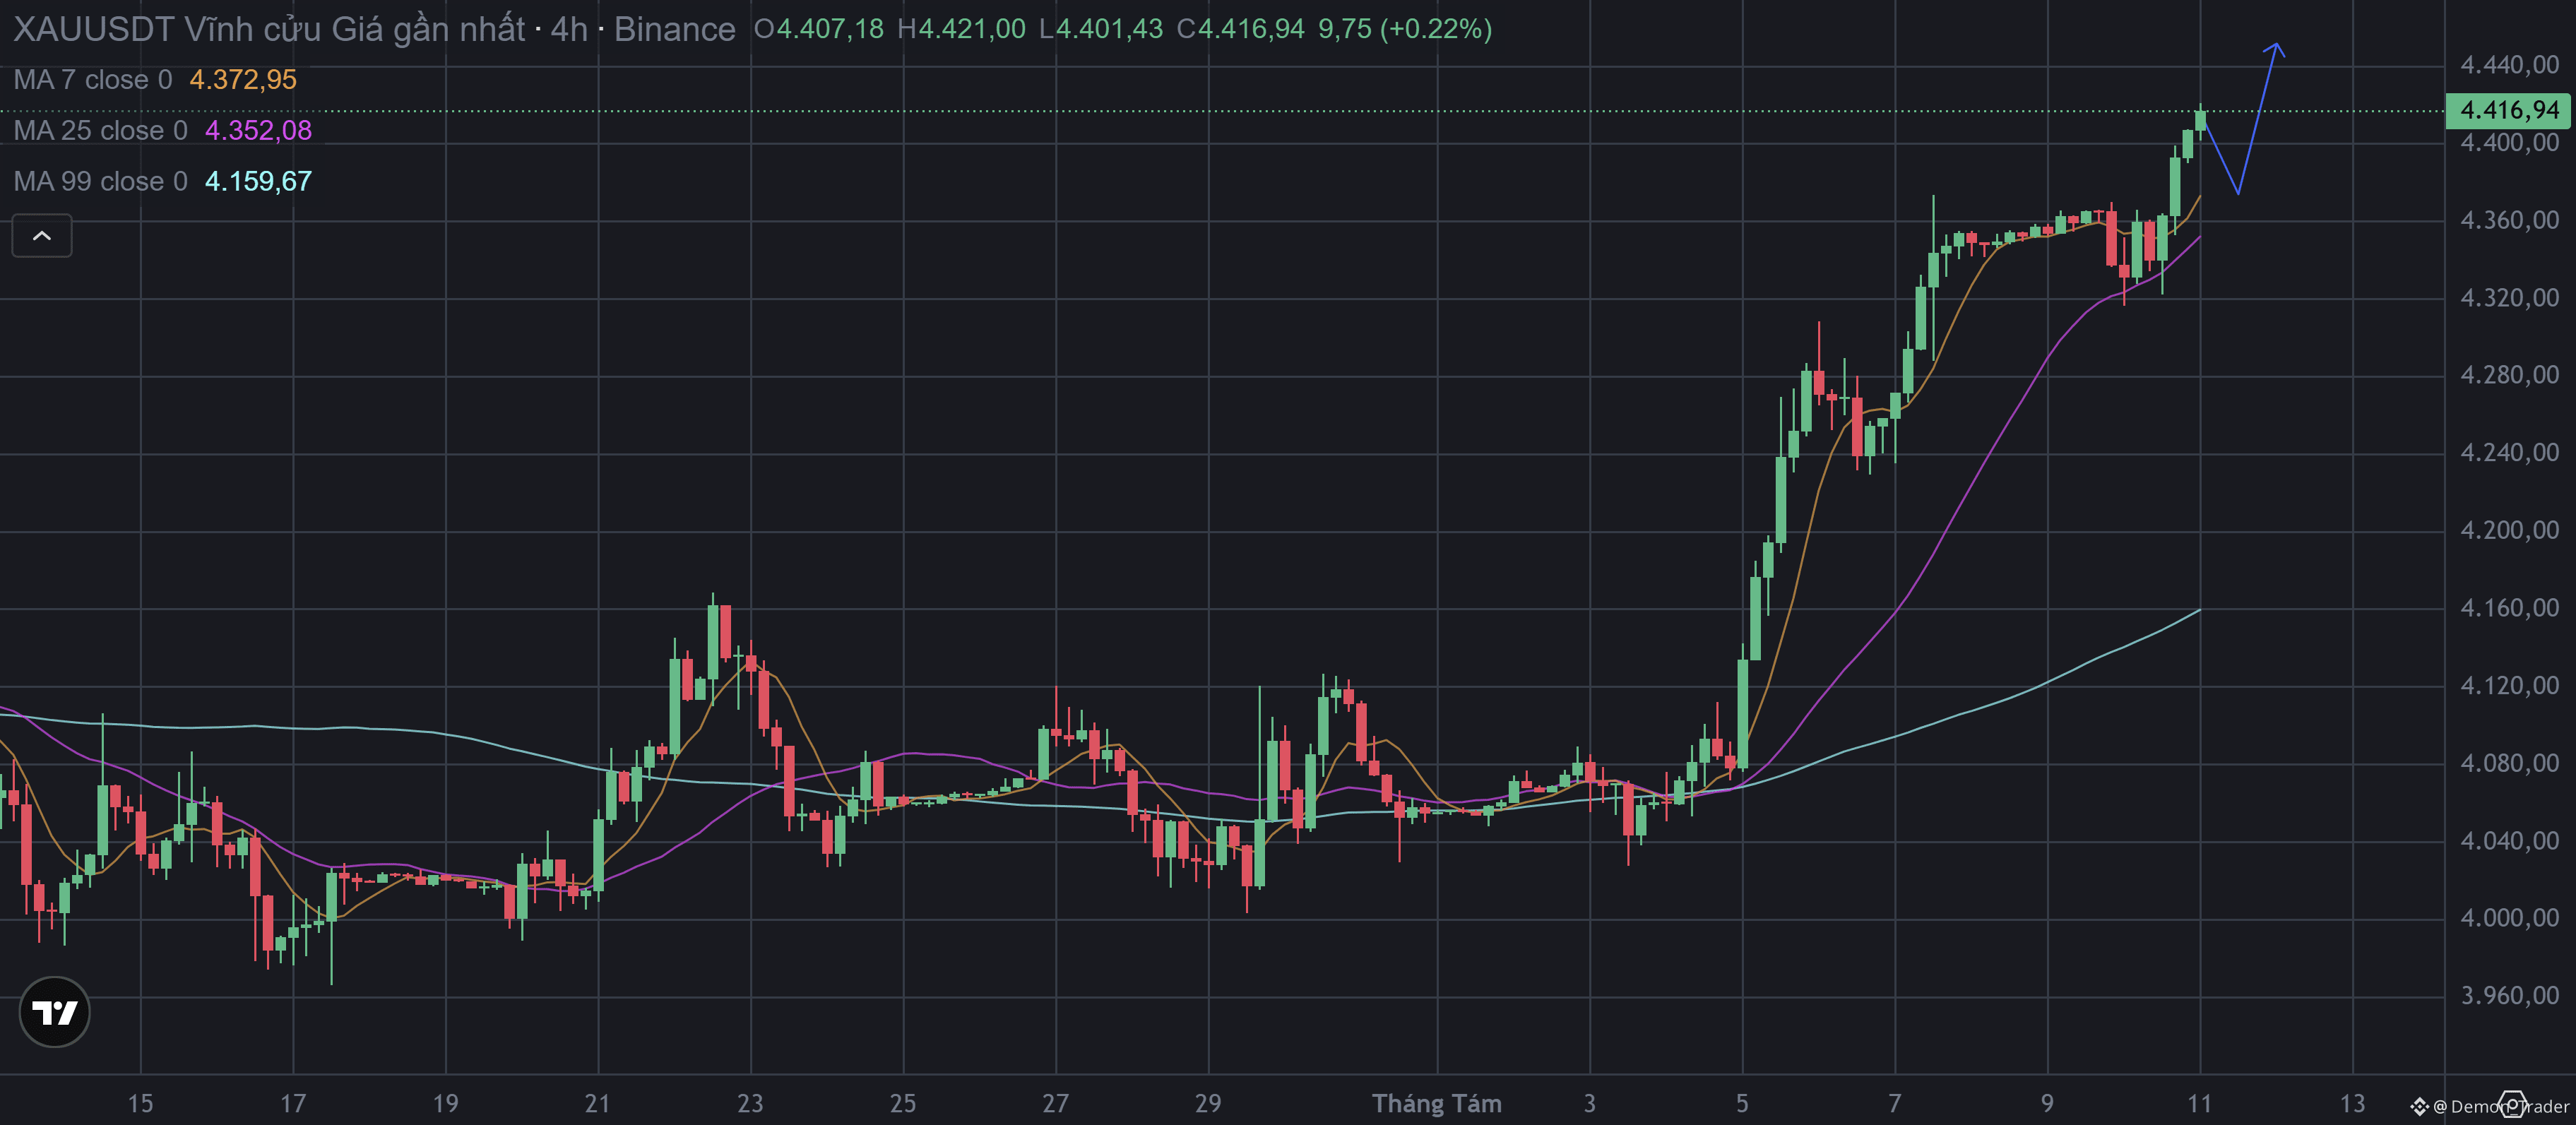
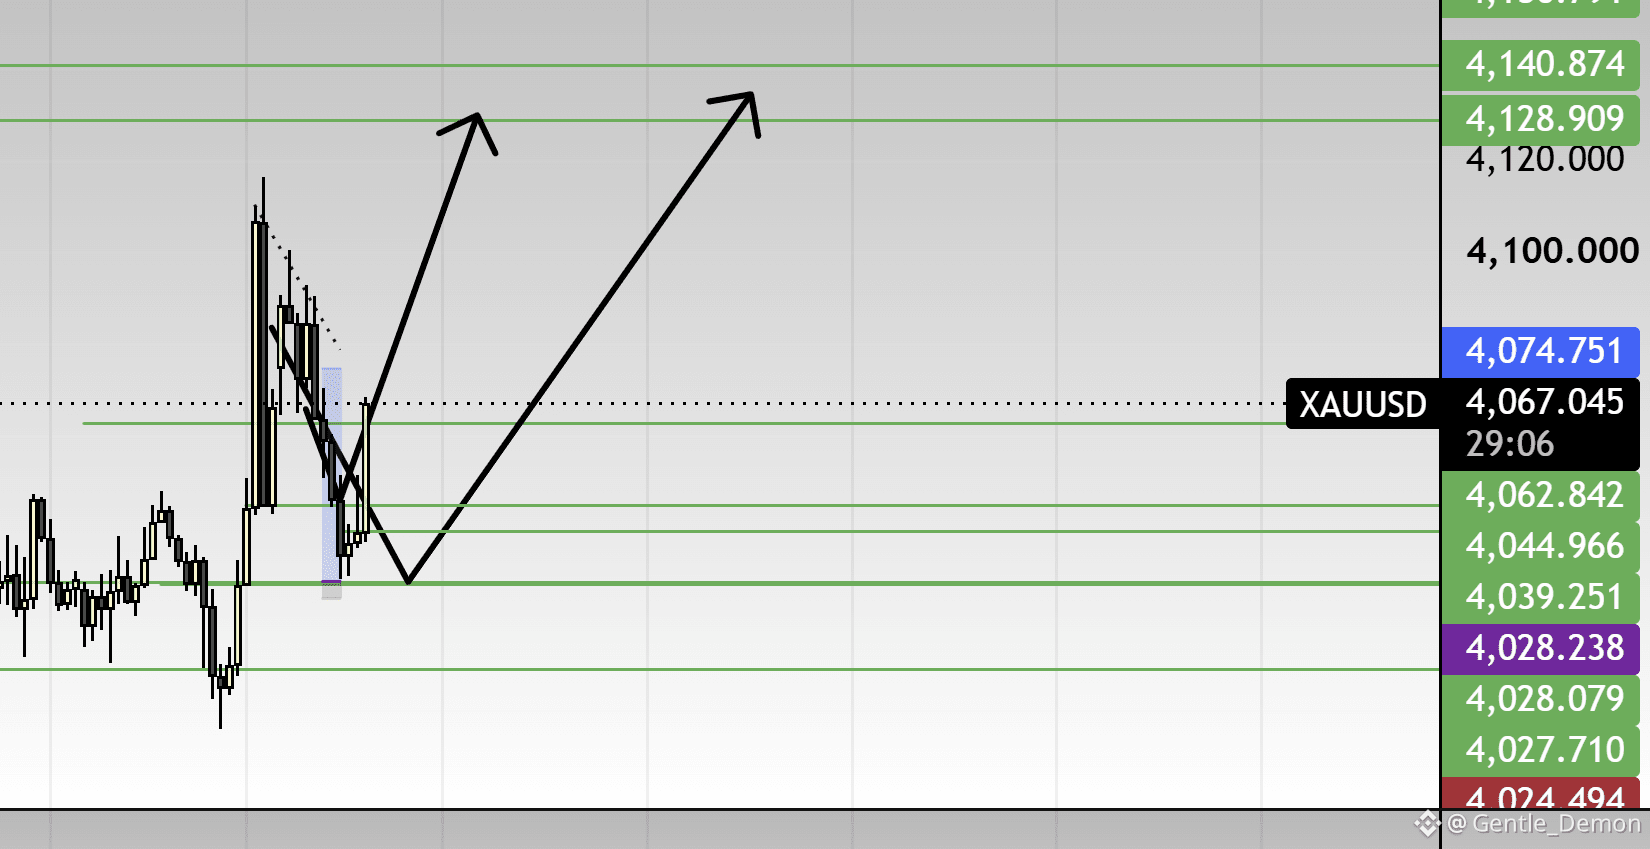
Bullish$XAUT đ there has been a very strong fluctuation after the FOMC meeting, rising by nearly 100 points within a short time. This shows that money flow is reacting decisively to macroeconomic information, and market volatility remains very high.
In today’s trading session, it is likely that the price will continue to sweep both ends of the range before confirming the next trend. This is a rather uncomfortable trading environment, so entering positions based on emotion or using high leverage will carry significant risks.
From my personal perspective, 4.045 and 4.028 are two notable support zones to look for Long Swing opportunities, provided that the price shows confirmation signals in these areas.
No matter which strategy you choose, always remember that trading Futures always comes with risk. Proper capital management and placing a Stop Loss for every position are key factors that help you stay in the market for the long term.
Which scenario are you leaning toward for gold today: continued breakout or a deeper pullback? Leave your thoughts in the comments so we can discuss!
In today’s trading session, it is likely that the price will continue to sweep both ends of the range before confirming the next trend. This is a rather uncomfortable trading environment, so entering positions based on emotion or using high leverage will carry significant risks.
From my personal perspective, 4.045 and 4.028 are two notable support zones to look for Long Swing opportunities, provided that the price shows confirmation signals in these areas.
No matter which strategy you choose, always remember that trading Futures always comes with risk. Proper capital management and placing a Stop Loss for every position are key factors that help you stay in the market for the long term.
Which scenario are you leaning toward for gold today: continued breakout or a deeper pullback? Leave your thoughts in the comments so we can discuss!
Demon_Trader
·
--
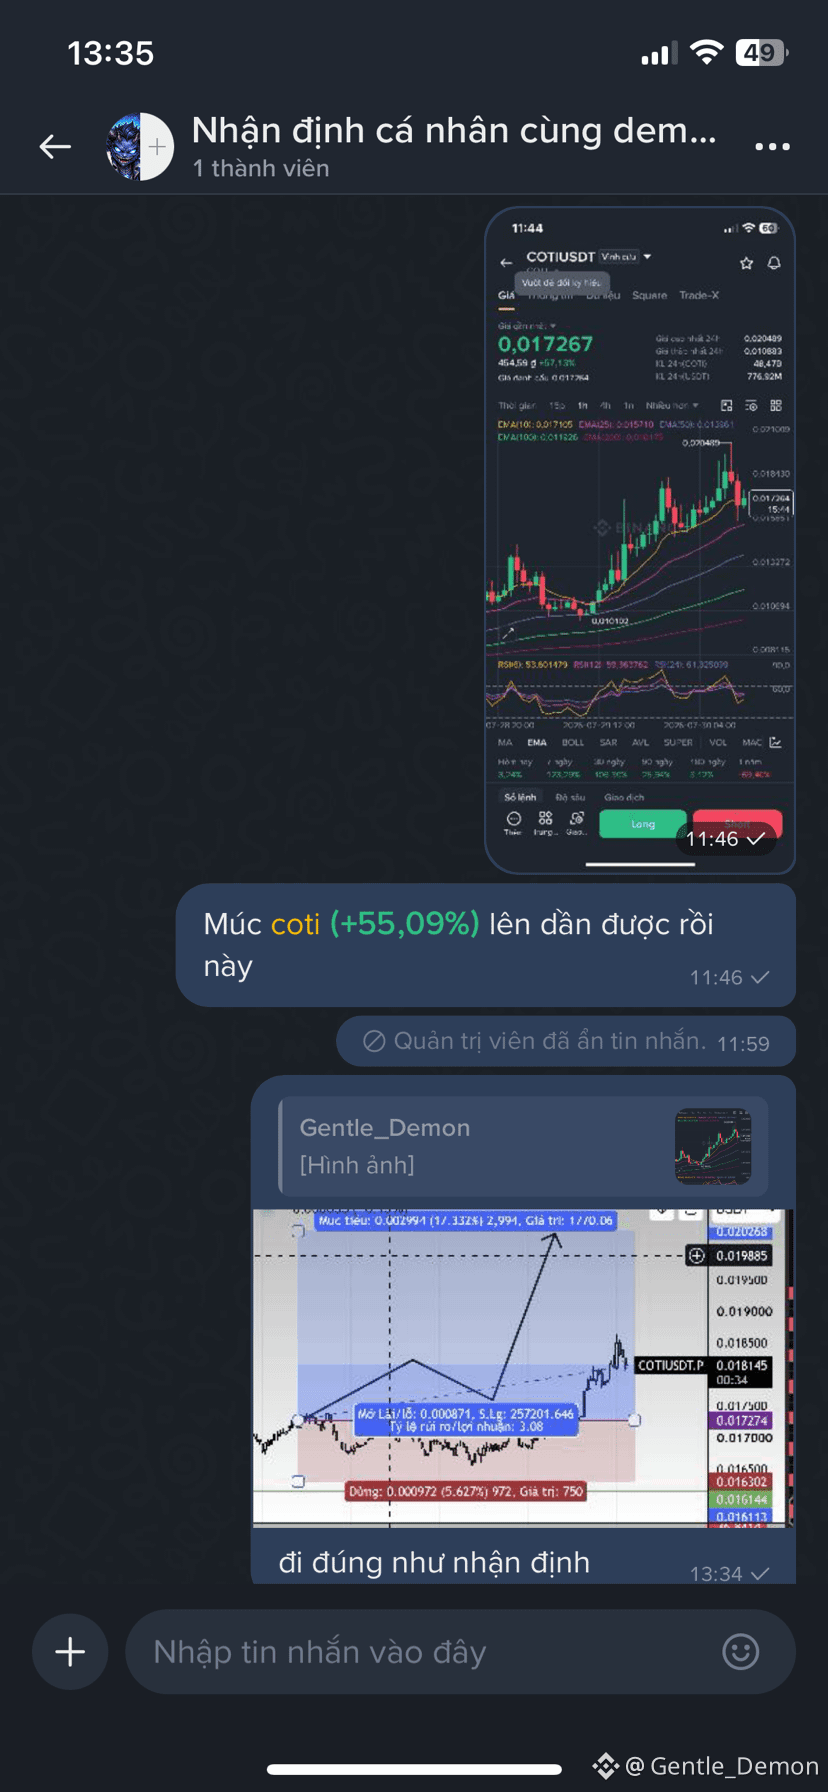
$COTI is in a strong uptrend, but what matters is not FOMO—it’s waiting for the right entry point.
During periods of low market liquidity, the Market Maker’s (MM) funds often shift toward low-cap coins to create a ripple effect and attract money back into the market. The recent sharp rallies of $BANK and $LAB are clear proof of this scenario.
This is an opportunity for us to look for profits not only from the asset’s price increase, but also to take advantage of Funding fees if we choose an appropriate trading strategy.
However, don’t let FOMO emotions drive your investment decisions. Be patient and wait for the price to pull back into key support zones before placing orders. A good entry point provides a much better profit-to-risk ratio than chasing.
The market always rewards traders who have enough patience and discipline.
Are you watching any low-cap coins besides COTI? Share your perspective in the comments.
During periods of low market liquidity, the Market Maker’s (MM) funds often shift toward low-cap coins to create a ripple effect and attract money back into the market. The recent sharp rallies of $BANK and $LAB are clear proof of this scenario.
This is an opportunity for us to look for profits not only from the asset’s price increase, but also to take advantage of Funding fees if we choose an appropriate trading strategy.
However, don’t let FOMO emotions drive your investment decisions. Be patient and wait for the price to pull back into key support zones before placing orders. A good entry point provides a much better profit-to-risk ratio than chasing.
The market always rewards traders who have enough patience and discipline.
Are you watching any low-cap coins besides COTI? Share your perspective in the comments.
Log in to explore more content