
Sr_Max
685 Posts

Sr_Max
Report
Block User
Coin analysis | Trend trading | Levels, structure, setups | Top Volume Assets, Daily charts, Price action.
Open Trade
High-Frequency Trader
4.2 Years
4 Following
57 Followers
172 Liked
Posts
Portfolio
All
Quotes
·
--
Bearish
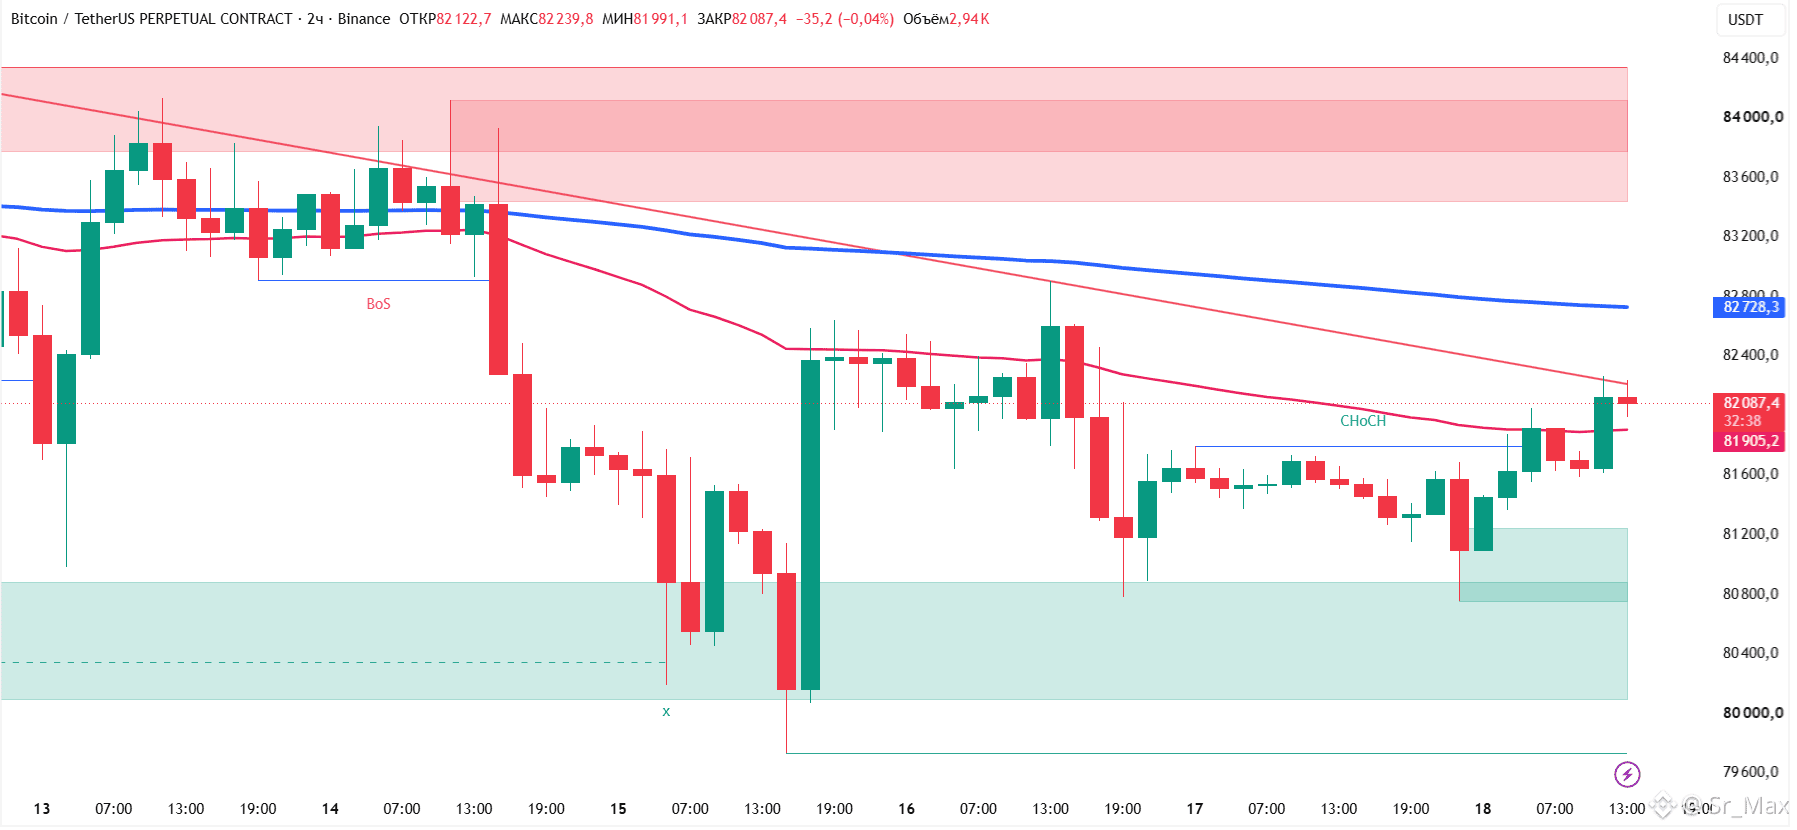
$BTC MONDAY OPENING WILL EXPOSE THE TRAP
Bitcoin is heavily compressed around $82,100, sitting directly under a major descending trendline and key EMA resistances. While the weekend brought a local market structure flip (CHoCH) following an aggressive bounce from the $80,000 - $80,800 demand zone, the overall volume remains unconvincing.
The macro backdrop is clearly acting as a headwind. Sticky U.S. inflation data (CPI/PPI) has severely dampened expectations for upcoming Fed rate cuts, turning institutional sentiment risk-off. This weekend's upward drift feels entirely artificial - a textbook liquidity manufacture ahead of Monday’s traditional market open, designed to trap late FOMO buyers.
Are you long here, or waiting for the Monday morning fakeout to clear?
{future}(BTCUSDT)
$BTC MONDAY OPENING WILL EXPOSE THE TRAP
Bitcoin is heavily compressed around $82,100, sitting directly under a major descending trendline and key EMA resistances. While the weekend brought a local market structure flip (CHoCH) following an aggressive bounce from the $80,000 - $80,800 demand zone, the overall volume remains unconvincing.
The macro backdrop is clearly acting as a headwind. Sticky U.S. inflation data (CPI/PPI) has severely dampened expectations for upcoming Fed rate cuts, turning institutional sentiment risk-off. This weekend's upward drift feels entirely artificial - a textbook liquidity manufacture ahead of Monday’s traditional market open, designed to trap late FOMO buyers.
Are you long here, or waiting for the Monday morning fakeout to clear?
Bitcoin is heavily compressed around $82,100, sitting directly under a major descending trendline and key EMA resistances. While the weekend brought a local market structure flip (CHoCH) following an aggressive bounce from the $80,000 - $80,800 demand zone, the overall volume remains unconvincing.
The macro backdrop is clearly acting as a headwind. Sticky U.S. inflation data (CPI/PPI) has severely dampened expectations for upcoming Fed rate cuts, turning institutional sentiment risk-off. This weekend's upward drift feels entirely artificial - a textbook liquidity manufacture ahead of Monday’s traditional market open, designed to trap late FOMO buyers.
Are you long here, or waiting for the Monday morning fakeout to clear?
68
·
--
Bullish
Verified
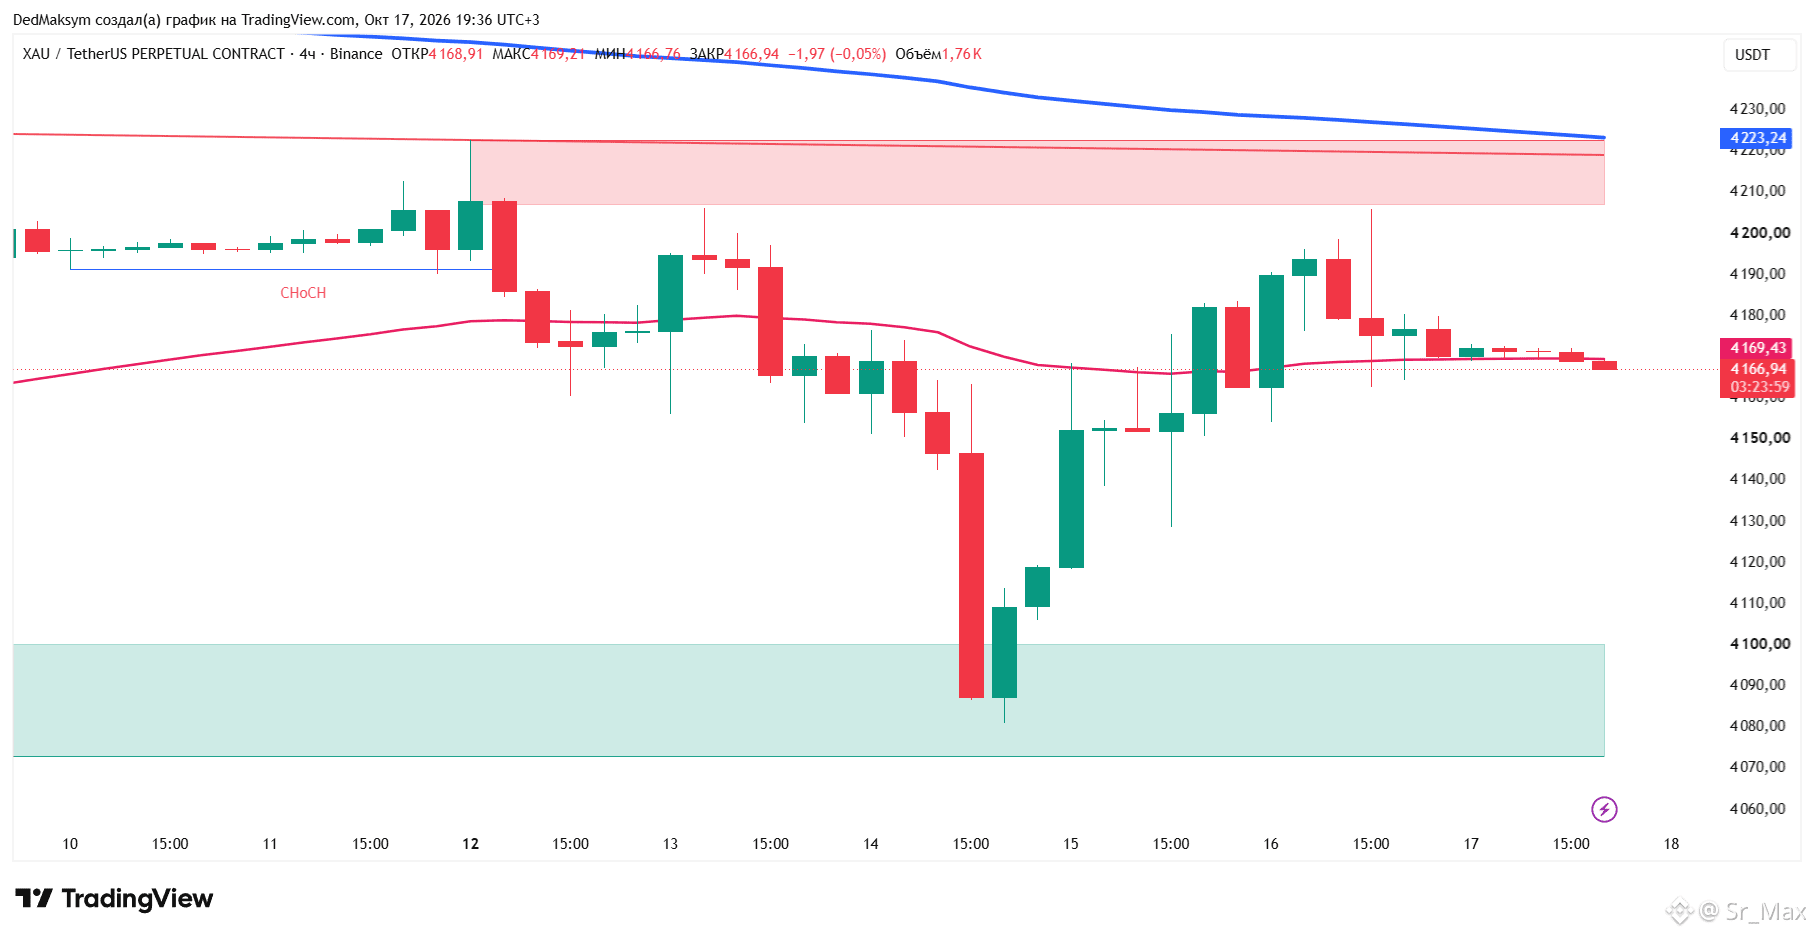
$XAU is trading around $4,167 on the 4H chart. The asset remains compressed within a key decision zone after a massive volatility spike.
Technicals:
Sellers aggressively swept liquidity into the $4,080 - $4,100 demand zone (green block), triggering a rapid V-shaped recovery.
The bullish momentum got heavily rejected at the strong bearish resistance block near $4,200 - $4,220 (red block).
Price is currently consolidating under moving average pressure. Bulls need a decisive breakout to regain control.
Two Scenarios:
Bullish: A clean break above $4,223 invalidates the bearish structure, opening the doors to new highs driven by safe-haven macro demand.
Bearish: Failure to hold current support will trigger a retest of the $4,100 baseline.
Are we heading for a breakout or a deeper correction?
$XAU is trading around $4,167 on the 4H chart. The asset remains compressed within a key decision zone after a massive volatility spike.
Technicals:
Sellers aggressively swept liquidity into the $4,080 - $4,100 demand zone (green block), triggering a rapid V-shaped recovery.
The bullish momentum got heavily rejected at the strong bearish resistance block near $4,200 - $4,220 (red block).
Price is currently consolidating under moving average pressure. Bulls need a decisive breakout to regain control.
Two Scenarios:
Bullish: A clean break above $4,223 invalidates the bearish structure, opening the doors to new highs driven by safe-haven macro demand.
Bearish: Failure to hold current support will trigger a retest of the $4,100 baseline.
Are we heading for a breakout or a deeper correction?
Technicals:
Sellers aggressively swept liquidity into the $4,080 - $4,100 demand zone (green block), triggering a rapid V-shaped recovery.
The bullish momentum got heavily rejected at the strong bearish resistance block near $4,200 - $4,220 (red block).
Price is currently consolidating under moving average pressure. Bulls need a decisive breakout to regain control.
Two Scenarios:
Bullish: A clean break above $4,223 invalidates the bearish structure, opening the doors to new highs driven by safe-haven macro demand.
Bearish: Failure to hold current support will trigger a retest of the $4,100 baseline.
Are we heading for a breakout or a deeper correction?
120
·
--
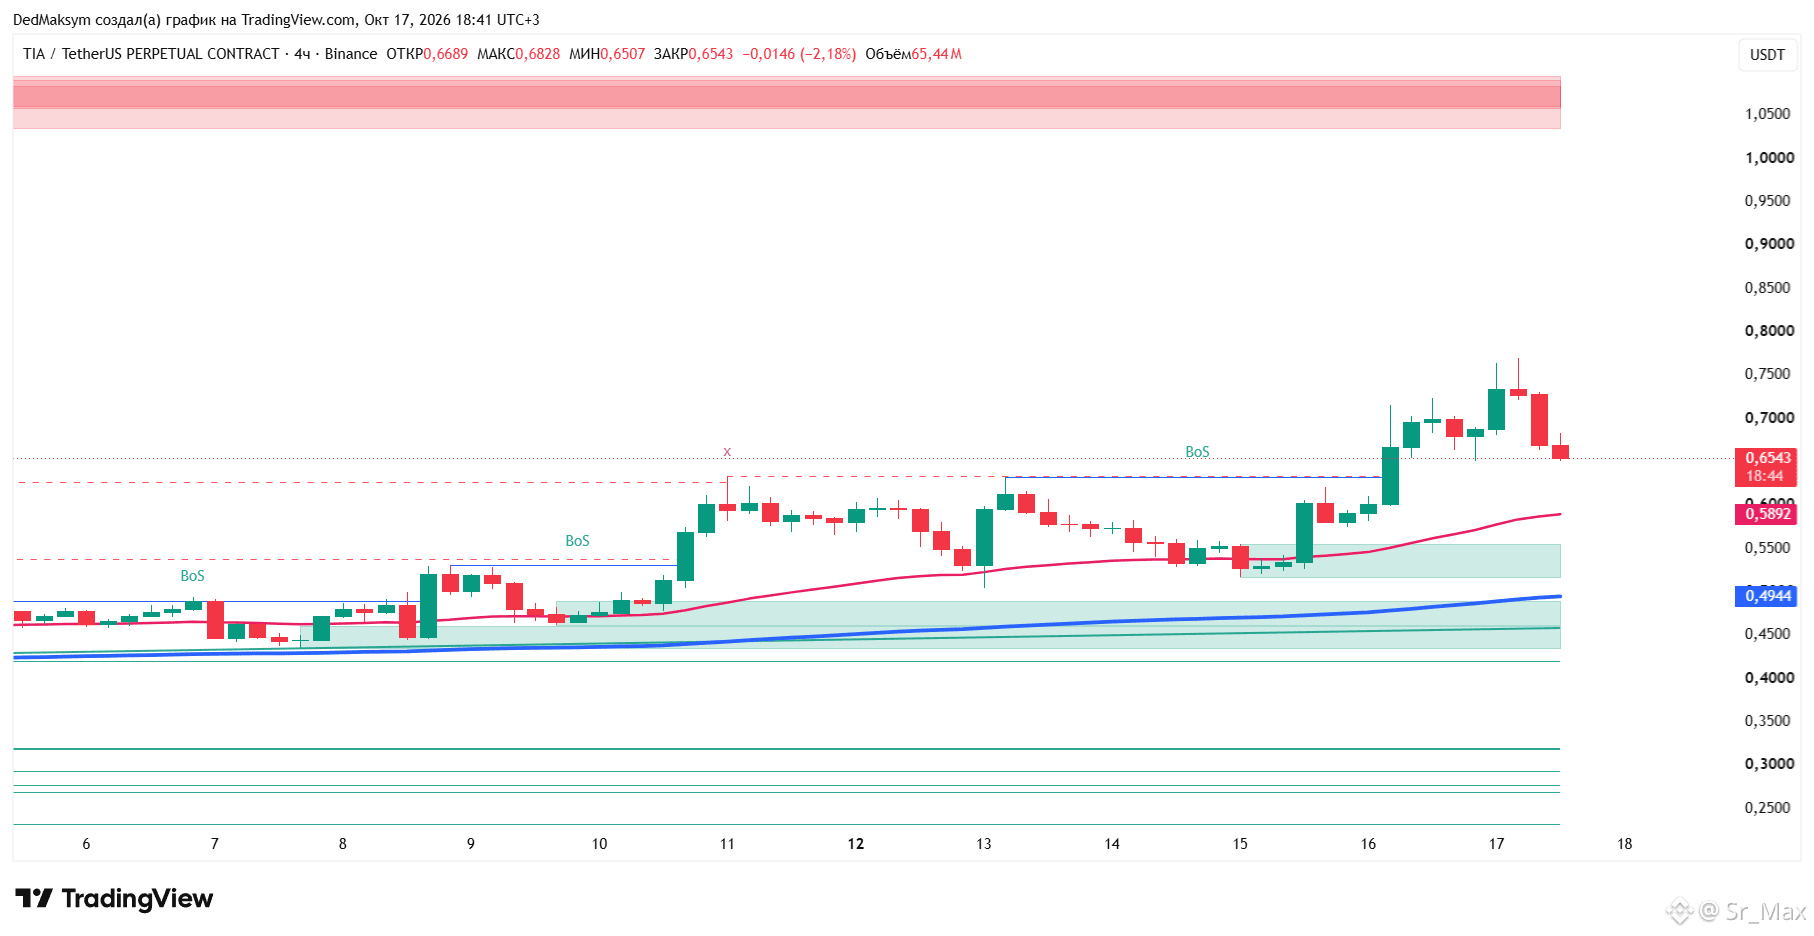
$TIA BOUNCES FROM SUPPORT - WHAT TRIGGERED THE RALLY?
Celestia’s TIA broke above the $0.63 resistance zone and surged toward $0.75, fueled by strong altcoin momentum and a short squeeze.
What’s behind the move?
The broader altcoin rally, short liquidations, and renewed attention following Celestia’s Eden launch helped push buying pressure higher.
Key levels to watch:
Resistance: $0.70-0.75
Support: $0.63-0.65
Major support: $0.42-0.47
TIA is now pulling back after a sharp rally. Holding the breakout zone could keep bulls in control, while losing it may trigger a deeper correction.
Is TIA heading for $1.05 next? #CelestiaRises16%To2026High
{future}(TIAUSDT)
$TIA BOUNCES FROM SUPPORT - WHAT TRIGGERED THE RALLY?
Celestia’s TIA broke above the $0.63 resistance zone and surged toward $0.75, fueled by strong altcoin momentum and a short squeeze.
What’s behind the move?
The broader altcoin rally, short liquidations, and renewed attention following Celestia’s Eden launch helped push buying pressure higher.
Key levels to watch:
Resistance: $0.70-0.75
Support: $0.63-0.65
Major support: $0.42-0.47
TIA is now pulling back after a sharp rally. Holding the breakout zone could keep bulls in control, while losing it may trigger a deeper correction.
Is TIA heading for $1.05 next? #CelestiaRises16%To2026High
Celestia’s TIA broke above the $0.63 resistance zone and surged toward $0.75, fueled by strong altcoin momentum and a short squeeze.
What’s behind the move?
The broader altcoin rally, short liquidations, and renewed attention following Celestia’s Eden launch helped push buying pressure higher.
Key levels to watch:
Resistance: $0.70-0.75
Support: $0.63-0.65
Major support: $0.42-0.47
TIA is now pulling back after a sharp rally. Holding the breakout zone could keep bulls in control, while losing it may trigger a deeper correction.
Is TIA heading for $1.05 next? #CelestiaRises16%To2026High
123
·
--
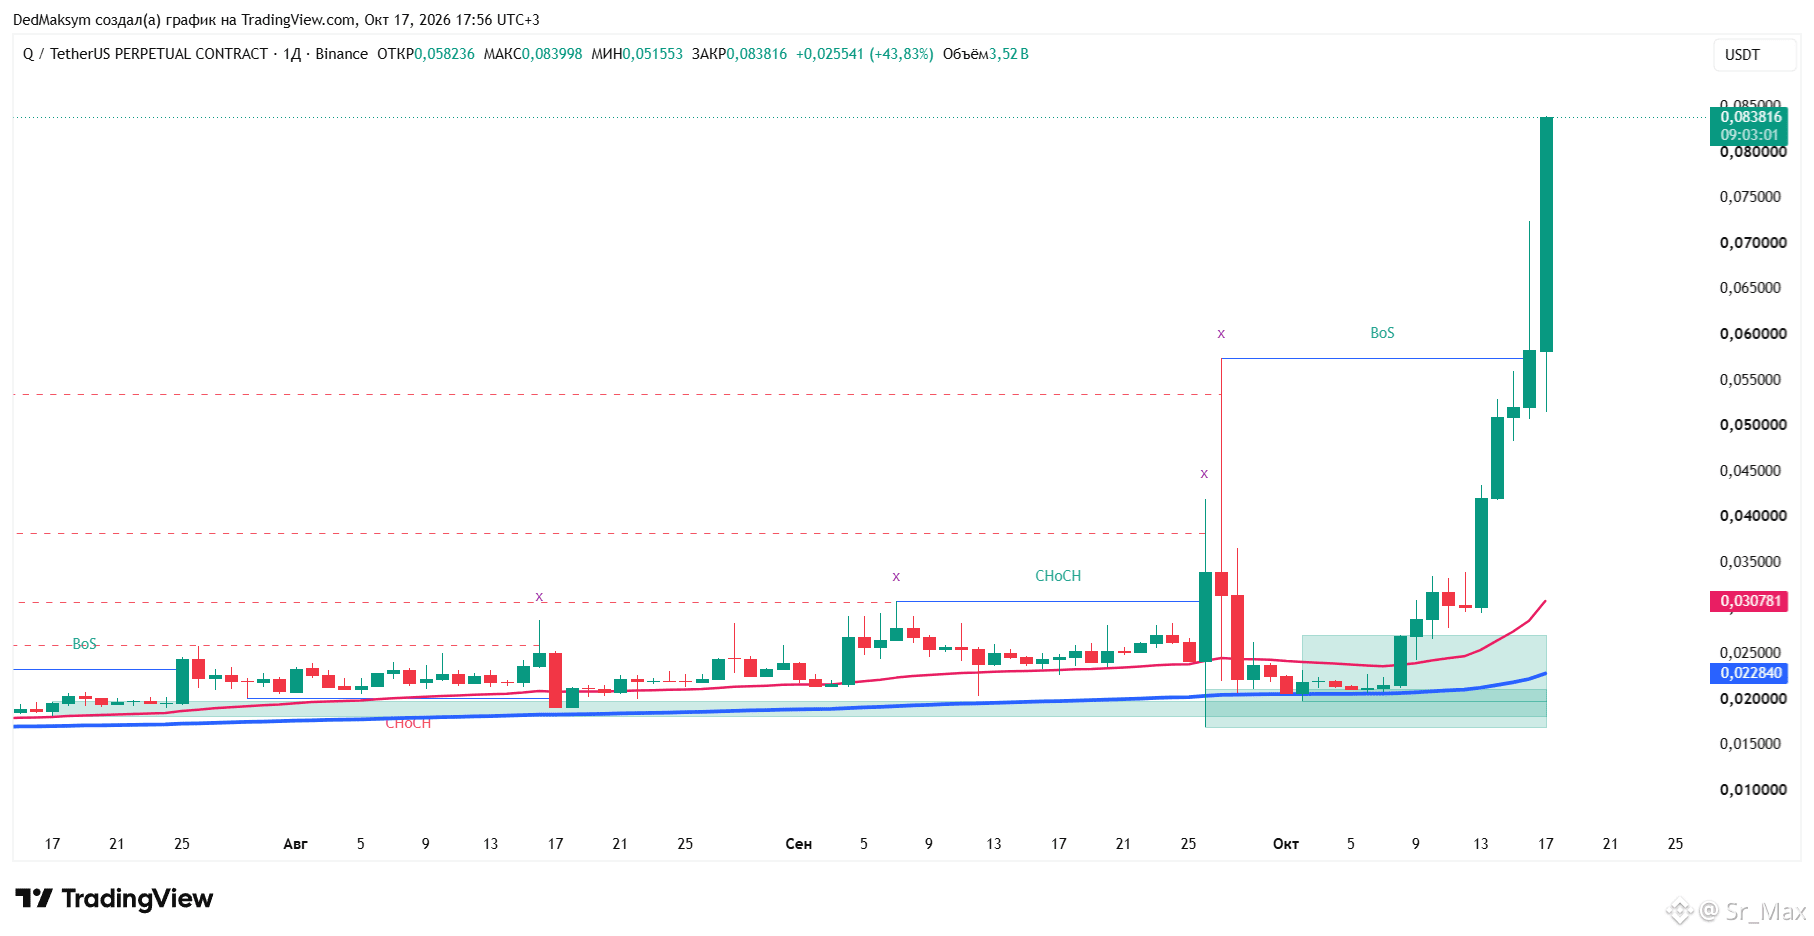
$Q SURGES 50% - IS ANOTHER LEG UP COMING?
After months of accumulation around $0.02-0.03, Q has finally broken out of its range, pushing toward $0.0837 on explosive momentum.
What's driving the move? A strong technical breakout and aggressive buying. Speculative demand may be adding fuel, although no confirmed catalyst has been established.
Key levels to watch:
Resistance: $0.085-0.1 Psychological level
Support: $0.049-0.052
The trend is bullish, but after such a sharp rally, a pullback wouldn't be surprising.
Chasing vertical candles is risky. Will $Q keep flying or cool off first?
{future}(QUSDT)
$Q SURGES 50% - IS ANOTHER LEG UP COMING?
After months of accumulation around $0.02-0.03, Q has finally broken out of its range, pushing toward $0.0837 on explosive momentum.
What's driving the move? A strong technical breakout and aggressive buying. Speculative demand may be adding fuel, although no confirmed catalyst has been established.
Key levels to watch:
Resistance: $0.085-0.1 Psychological level
Support: $0.049-0.052
The trend is bullish, but after such a sharp rally, a pullback wouldn't be surprising.
Chasing vertical candles is risky. Will $Q keep flying or cool off first?
After months of accumulation around $0.02-0.03, Q has finally broken out of its range, pushing toward $0.0837 on explosive momentum.
What's driving the move? A strong technical breakout and aggressive buying. Speculative demand may be adding fuel, although no confirmed catalyst has been established.
Key levels to watch:
Resistance: $0.085-0.1 Psychological level
Support: $0.049-0.052
The trend is bullish, but after such a sharp rally, a pullback wouldn't be surprising.
Chasing vertical candles is risky. Will $Q keep flying or cool off first?
333
·
--
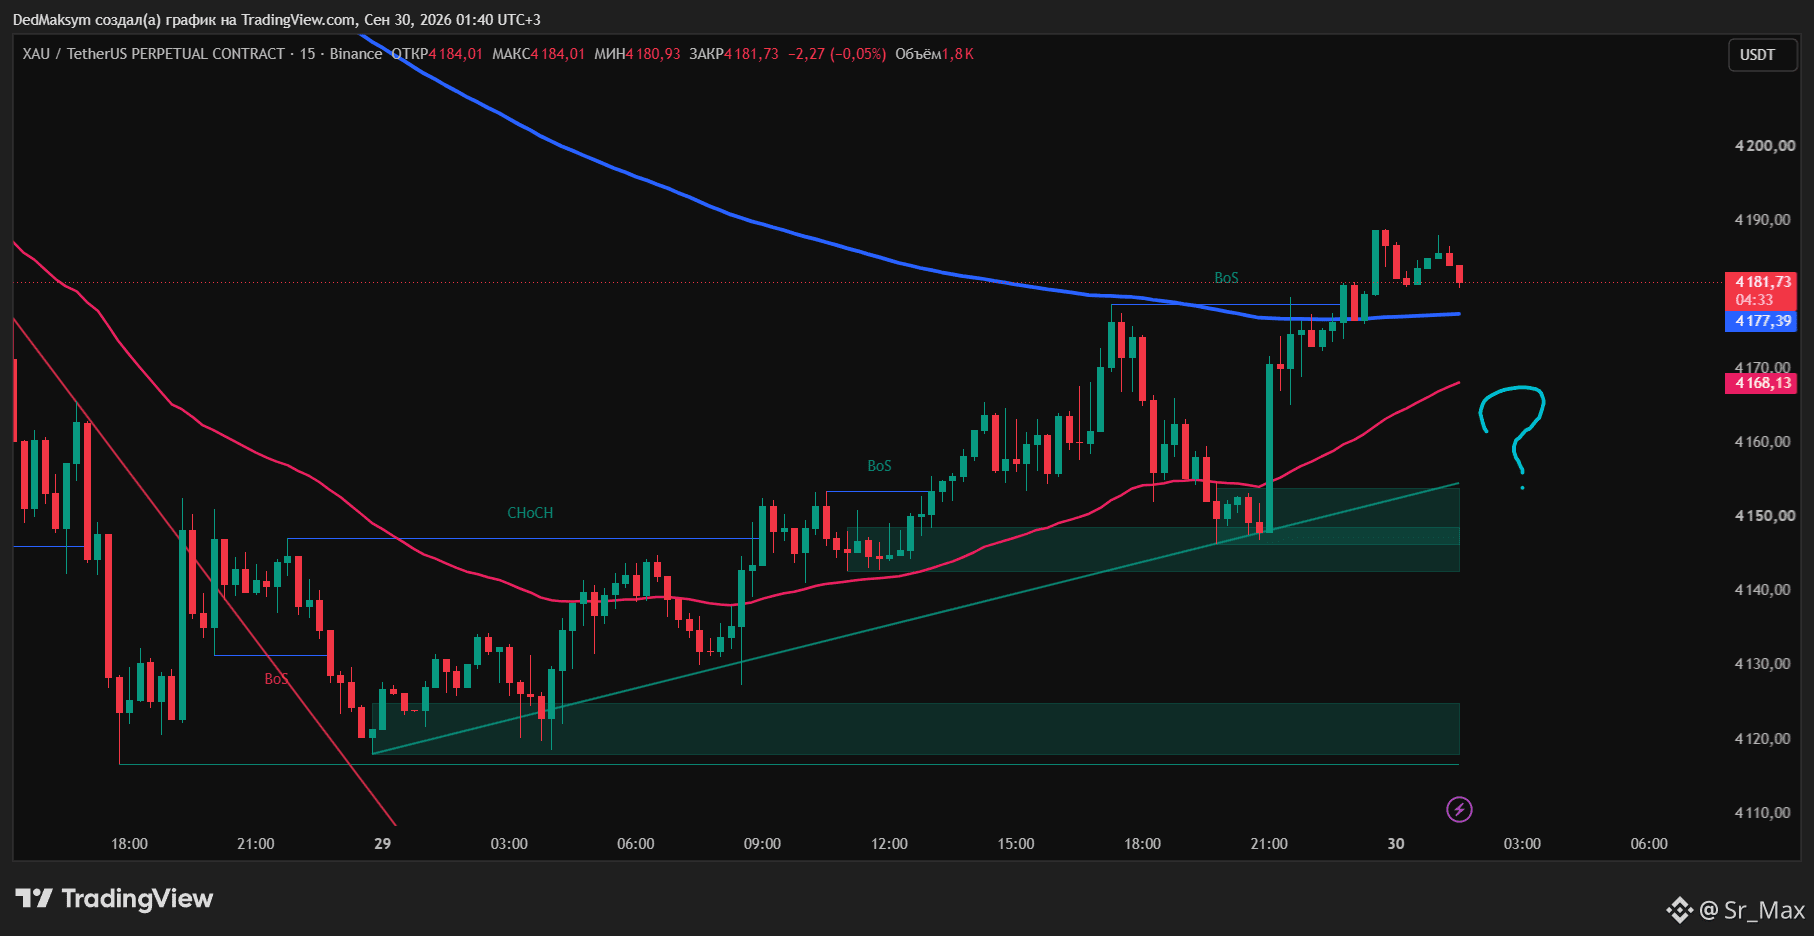
$XAU If bulls lose EMAs, might retest ascending trendline which aligns with support. Breaking below this level puts further upside in question. Massive overhead resistance zones remain problematic for bulls, but let's take it step by step for now.
$XAU If bulls lose EMAs, might retest ascending trendline which aligns with support. Breaking below this level puts further upside in question. Massive overhead resistance zones remain problematic for bulls, but let's take it step by step for now.
Sr_Max
·
--
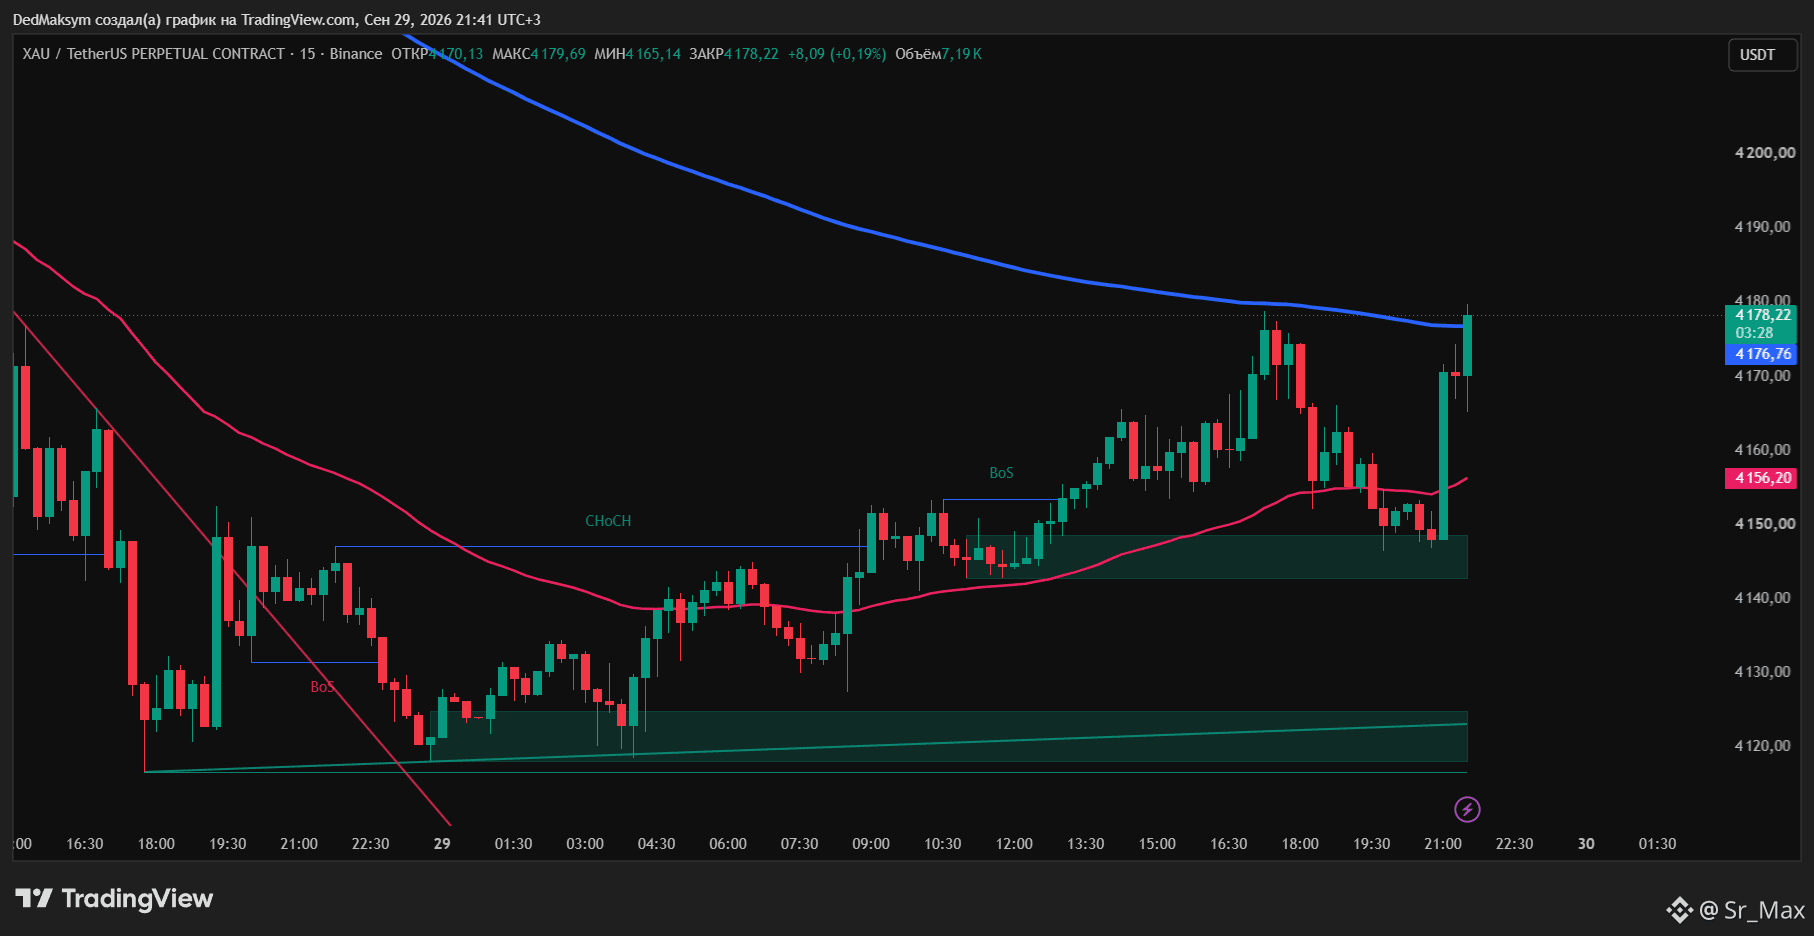
$XAU Just as expected, failed to break EMA200 on first try. Pulled back to fuel up at support, watching attempt №2.
119
·
--
$XAU Just as expected, failed to break EMA200 on first try. Pulled back to fuel up at support, watching attempt №2.
$XAU Just as expected, failed to break EMA200 on first try. Pulled back to fuel up at support, watching attempt №2.
1
169
·
--
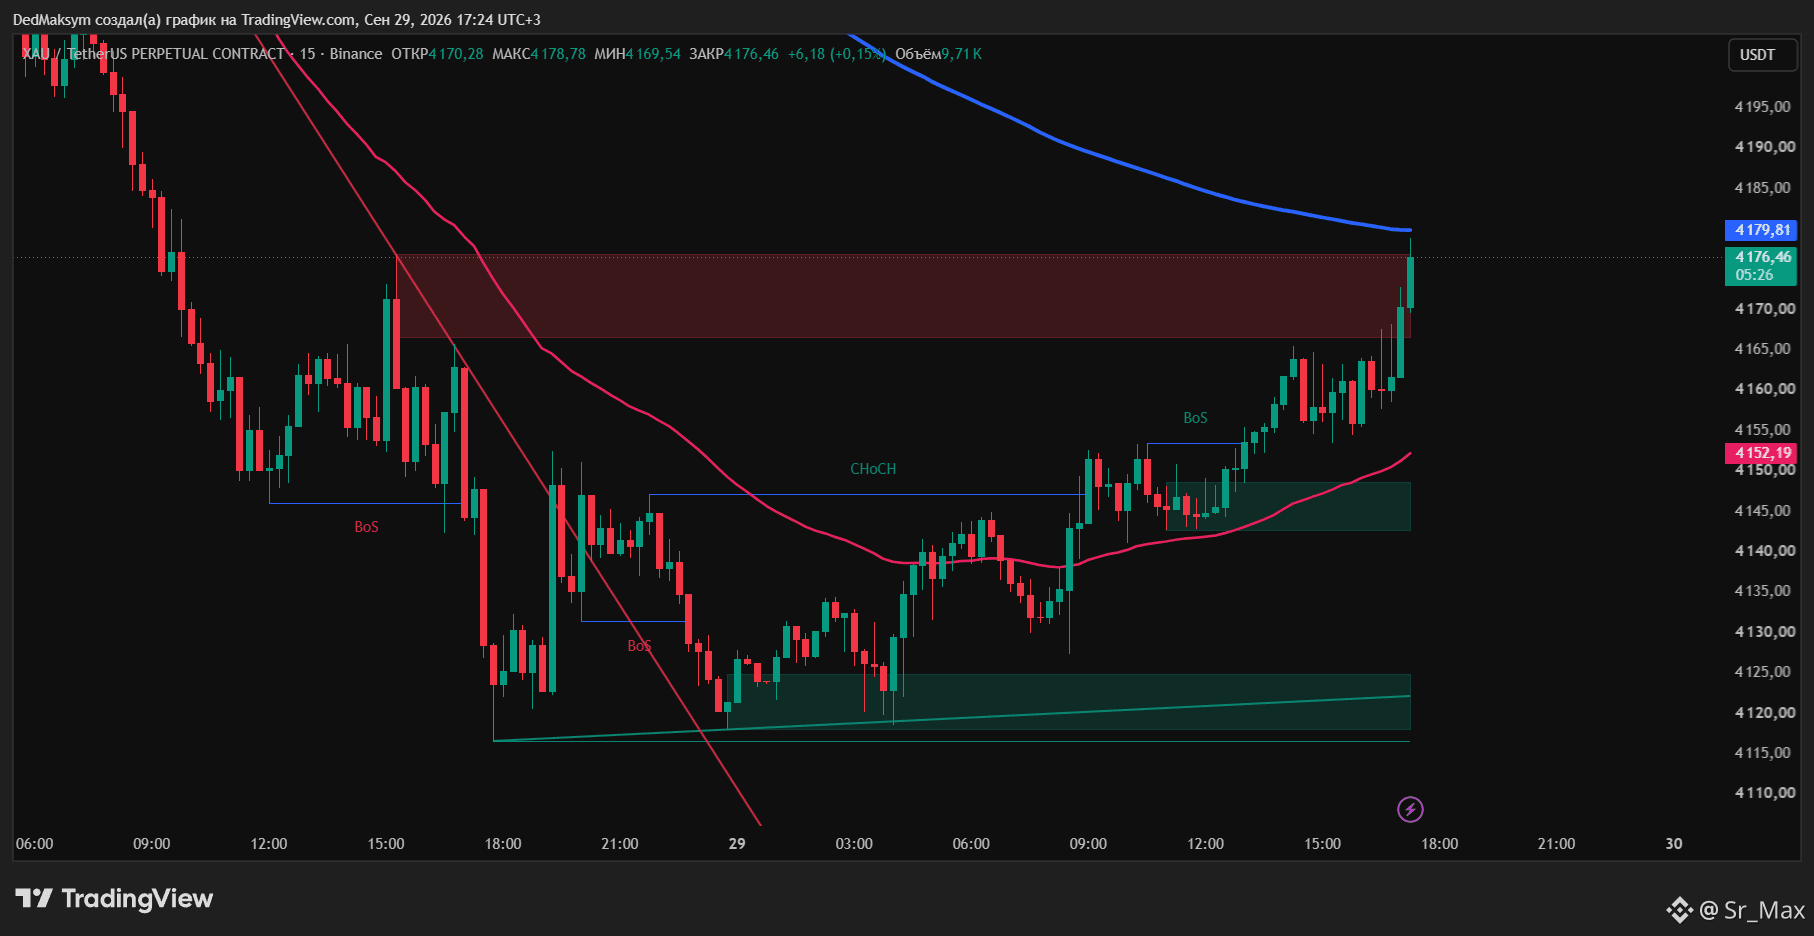
$XAU UPD. Now closely watching reaction at EMA200. If bulls fail to break MA, expecting pullback to downside support level. 👇
$XAU UPD. Now closely watching reaction at EMA200. If bulls fail to break MA, expecting pullback to downside support level. 👇
167
·
--
Bullish
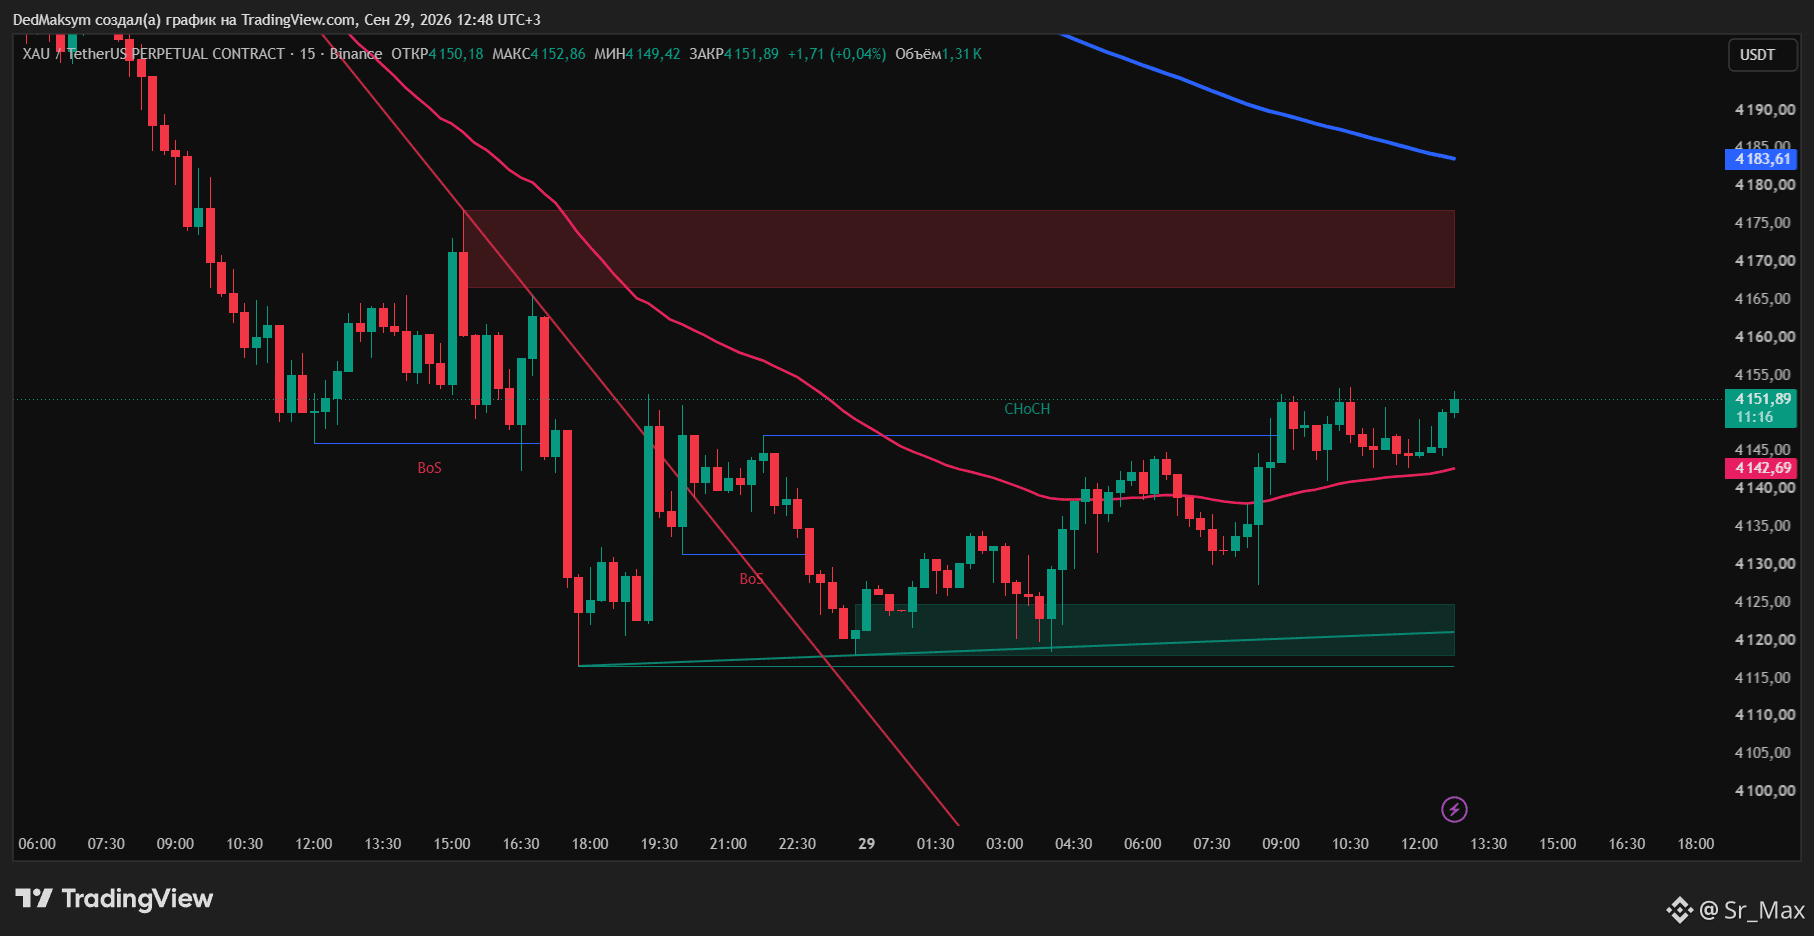
$XAU Post-strong dump, bulls managed to form local support aligning with ascending trendline. Will we clear resistance on first attempt? Also, price reclaimed and closed above EMA50.
$XAU Post-strong dump, bulls managed to form local support aligning with ascending trendline. Will we clear resistance on first attempt? Also, price reclaimed and closed above EMA50.
163
Log in to explore more content
Join global crypto users on Binance Square
⚡️ Get latest and useful information about crypto.
💬 Trusted by the world’s largest crypto exchange.
👍 Discover real insights from verified creators.
Email / Phone number
Trending Topics
BinanceReopensWithdrawalsForMoreAssets
27,847 views
745 Discussing
Security Incident | Recovery Update #6: Withdrawals Reopen for More Assets (2026-11-03)
Binance Announcement
·171 Likes
·477.7k views
AppleReportsMixedResults
18,536 views
540 Discussing
BinanceHourlyDepositsExceedWithdrawals
5,462 views
209 Discussing