
DCA Every Week
91 Posts

DCA Every Week
Report
Block User
https://youtube.com/@dcaeveryweek
Open Trade

BTC Holder
High-Frequency Trader
5.5 Years
5 Following
49 Followers
46 Liked
Posts
Portfolio
All
Quotes
See my returns and portfolio breakdown. Follow for investment tips
See my returns and portfolio breakdown. Follow for investment tips
Portfolio PreviewSee my returns and portfolio breakdown. Follow for investment tips
Portfolio Preview
See my returns and portfolio breakdown. Follow for investment tips
1
No good news on the market
But still had a rally
Short Until below 90K $BTC
No good news on the market
But still had a rally
Short Until below 90K $BTC
But still had a rally
Short Until below 90K $BTC
36
·
--
Bullish
Guys you buy at ath and lose %90. Buy low sell high. I have been accumulating $400 every week regardless of price..But 2 things are very important for me.
1-Max Supply (Some has, some doesn't)
2-Real Utility/Risk free of delisting
Aaaaand $AVAX
Guys you buy at ath and lose %90. Buy low sell high. I have been accumulating $400 every week regardless of price..But 2 things are very important for me.
1-Max Supply (Some has, some doesn't)
2-Real Utility/Risk free of delisting
Aaaaand $AVAX
1-Max Supply (Some has, some doesn't)
2-Real Utility/Risk free of delisting
Aaaaand $AVAX
1
361
Still in dip.
Very long investment for me.(until 2030,DCAing)
Price Target 7-9$ within 2025
Still in dip.
Very long investment for me.(until 2030,DCAing)
Price Target 7-9$ within 2025
Very long investment for me.(until 2030,DCAing)
Price Target 7-9$ within 2025
1
#BSCTradingTips A real Trading Tip for you guys: RSI
Think of it like this: if a stock price keeps going up, up, up really quickly, it might be getting "overbought." It's like everyone's rushing in to buy, and the price might be artificially inflated. The RSI would show a high number, usually above 70, signaling that it might be due for a pullback or a drop.
On the other hand, if the stock price keeps falling, falling, falling, it might be getting "oversold." Everyone's panicking and selling, and the price might be unfairly low. The RSI would show a low number, usually below 30, suggesting it might be ready for a bounce back up.
So, the RSI is basically measuring how strong the recent price moves have been. It doesn't tell you exactly when the price will change direction, but it gives you a heads-up that it might be getting overextended in one direction or the other.
It's important to remember that the RSI isn't perfect on its own. It's usually used along with other tools and analysis to make more informed decisions about buying or selling.
#BSCTradingTips A real Trading Tip for you guys: RSI
Think of it like this: if a stock price keeps going up, up, up really quickly, it might be getting "overbought." It's like everyone's rushing in to buy, and the price might be artificially inflated. The RSI would show a high number, usually above 70, signaling that it might be due for a pullback or a drop.
On the other hand, if the stock price keeps falling, falling, falling, it might be getting "oversold." Everyone's panicking and selling, and the price might be unfairly low. The RSI would show a low number, usually below 30, suggesting it might be ready for a bounce back up.
So, the RSI is basically measuring how strong the recent price moves have been. It doesn't tell you exactly when the price will change direction, but it gives you a heads-up that it might be getting overextended in one direction or the other.
It's important to remember that the RSI isn't perfect on its own. It's usually used along with other tools and analysis to make more informed decisions about buying or selling.
Think of it like this: if a stock price keeps going up, up, up really quickly, it might be getting "overbought." It's like everyone's rushing in to buy, and the price might be artificially inflated. The RSI would show a high number, usually above 70, signaling that it might be due for a pullback or a drop.
On the other hand, if the stock price keeps falling, falling, falling, it might be getting "oversold." Everyone's panicking and selling, and the price might be unfairly low. The RSI would show a low number, usually below 30, suggesting it might be ready for a bounce back up.
So, the RSI is basically measuring how strong the recent price moves have been. It doesn't tell you exactly when the price will change direction, but it gives you a heads-up that it might be getting overextended in one direction or the other.
It's important to remember that the RSI isn't perfect on its own. It's usually used along with other tools and analysis to make more informed decisions about buying or selling.
1
Everybody lost %90 of Capital(very cheap now)
Sitting at bottom
Great Partnership with Companies
2x-5x Potential in 12 months' time
Has Max Supply
Sustainable tokenomics
Worth buying at these prices
Everybody lost %90 of Capital(very cheap now)
Sitting at bottom
Great Partnership with Companies
2x-5x Potential in 12 months' time
Has Max Supply
Sustainable tokenomics
Worth buying at these prices
Sitting at bottom
Great Partnership with Companies
2x-5x Potential in 12 months' time
Has Max Supply
Sustainable tokenomics
Worth buying at these prices
Sitting At bottom
Long token release(until 2040s)
Real life utility
Only $35m Market Cap
I have been accumulating...
Sitting At bottom
Long token release(until 2040s)
Real life utility
Only $35m Market Cap
I have been accumulating...
Long token release(until 2040s)
Real life utility
Only $35m Market Cap
I have been accumulating...
3
·
--
Bullish
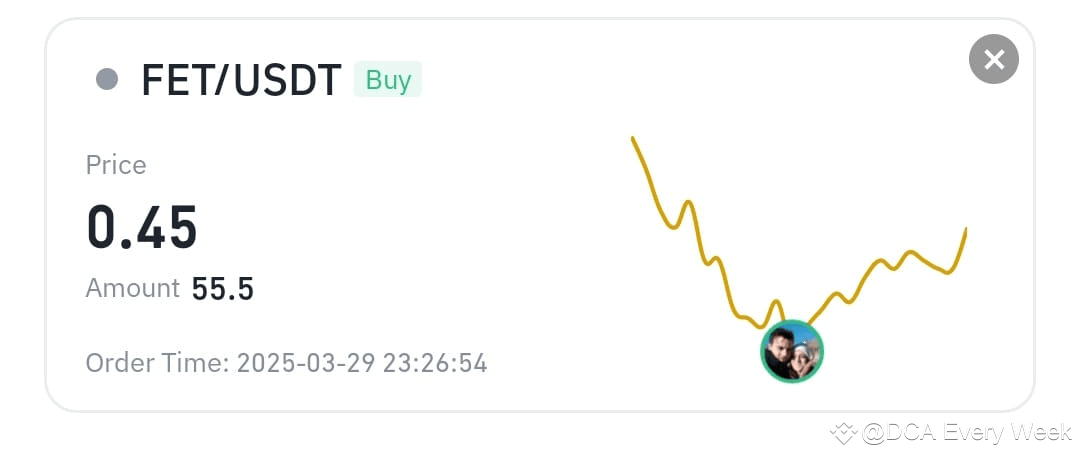
$FET
§Nvidia related AI Coin
§Relatively Low Market Cap
§Great Tokenomics
I keep accumulating
$FET
§Nvidia related AI Coin
§Relatively Low Market Cap
§Great Tokenomics
I keep accumulating
§Nvidia related AI Coin
§Relatively Low Market Cap
§Great Tokenomics
I keep accumulating
5
4.2k
Log in to explore more content
Join global crypto users on Binance Square
⚡️ Get latest and useful information about crypto.
💬 Trusted by the world’s largest crypto exchange.
👍 Discover real insights from verified creators.
Email / Phone number
Trending Topics
BitcoinCrosses$78000
408 views
53 Discussing
$BTC urgent Update 🚨 Big Opportunity ‼️Get Ready for Short 📉
BTC is bouncing as expected .Now you can scale your entry upto 78000 because this bounce can extend upto 78,000 ..
Stop-loss: 79,200
Targets 🎯
TP1: 77,150
TP2: 76,450
TP3: 75,750
TP4: 75,000
$SOL and $ETH will follow Bitcoin..And then dump as predicted 🔥
Always DYOR and never invest all in one trade
short here 👇
#SECReceivesGrayscaleLitecoinTrustETFFiling #ClarityActFacesProceduralVoteSept15 #US10YearTreasuryYieldNears5%
Panda Traders
·13 Likes
·5.8k views
AnthropicCEOCallsForAISlowdown
139,752 views
2,349 Discussing
RevolutDataLeakReportedlyPostedAttackersThreatenDailyReleases
1,433 views
53 Discussing