

CRYPTOVISION _BNB
5.7k Posts

CRYPTOVISION _BNB
Report
Block User
Perspectivas del mercado. Configuraciones de trading. Oportunidades en criptomonedas.
Open Trade
Frequent Trader
2.8 Years
17 Following
3.7K+ Followers
6.7K+ Liked
Posts
Portfolio
All
Quotes
PINNED
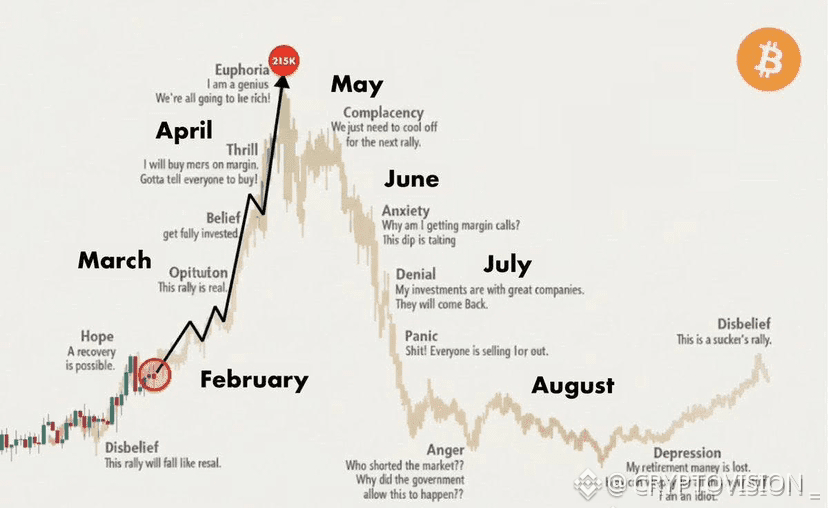
Predictions on the Bull Run of $BTC in 2026: A possible trajectory🎢
- February: Bear trap
- March: Gold/Silver drop -> Bitcoin skyrockets
- April: Altcoin season
- May: New All-Time High (ATH)
- June: Bull trap
- July: Mass liquidation
- August: Start of bear market
👉 These are speculative predictions and the market changes fast. Do you agree with this trajectory? 😂
trade down here ⬇️ with $BTC
{future}(BTCUSDT)
Predictions on the Bull Run of $BTC in 2026: A possible trajectory🎢
- February: Bear trap
- March: Gold/Silver drop -> Bitcoin skyrockets
- April: Altcoin season
- May: New All-Time High (ATH)
- June: Bull trap
- July: Mass liquidation
- August: Start of bear market
👉 These are speculative predictions and the market changes fast. Do you agree with this trajectory? 😂
trade down here ⬇️ with $BTC
4
1
12
20.5k
·
--
Bullish
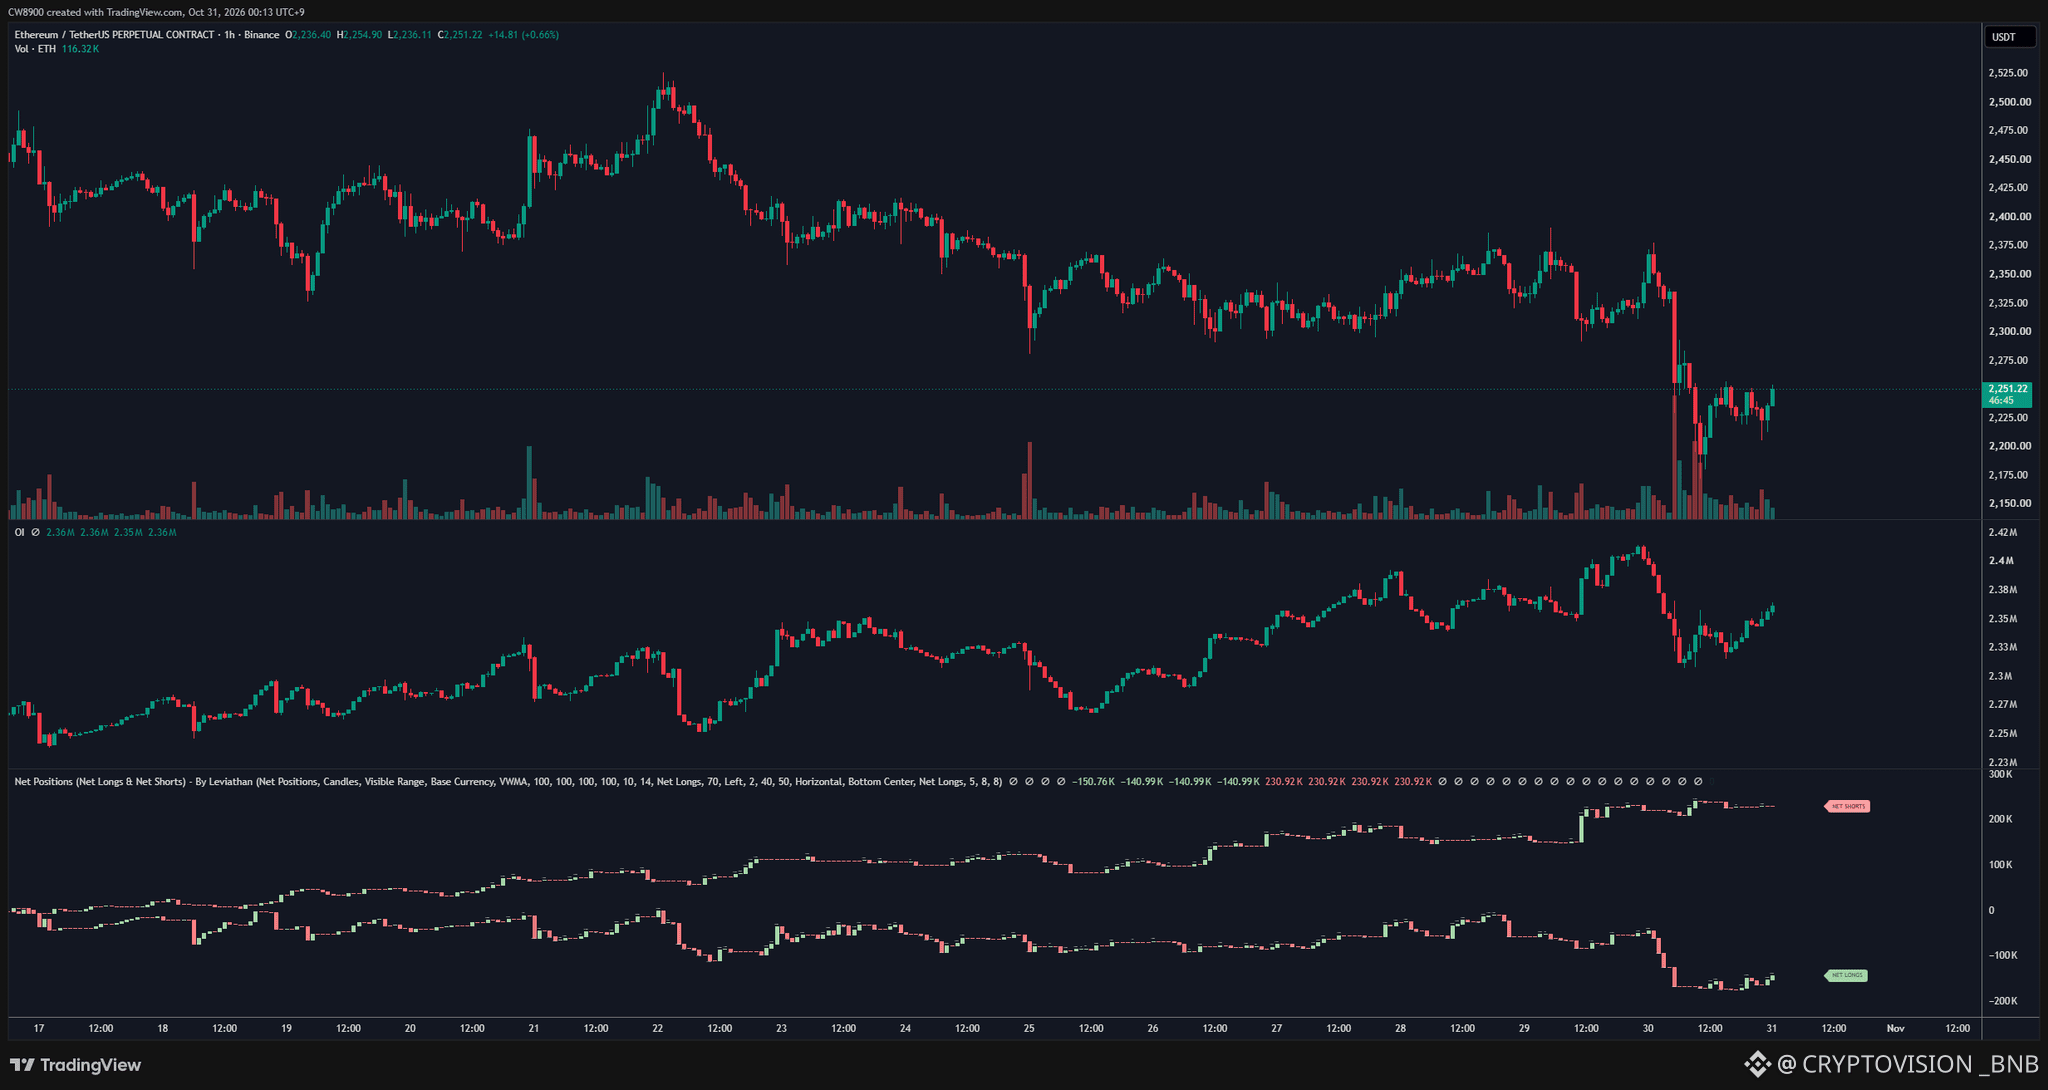
After a drop, buying pressure from long positions has resurfaced in $ETH.
There is some bullish pressure, while short positions remain steady at certain levels. However, short positions still have the advantage.
$ETH
{spot}(ETHUSDT)
After a drop, buying pressure from long positions has resurfaced in $ETH .
There is some bullish pressure, while short positions remain steady at certain levels. However, short positions still have the advantage.
$ETH
There is some bullish pressure, while short positions remain steady at certain levels. However, short positions still have the advantage.
$ETH
2
·
--
Bullish
$ASTER: COULD IT BE THE NEXT TO WAKE UP?
HYPE has shown how a new wave of attention can fuel a strong move. Now, ASTER is on my radar because of its connection to a similar narrative.
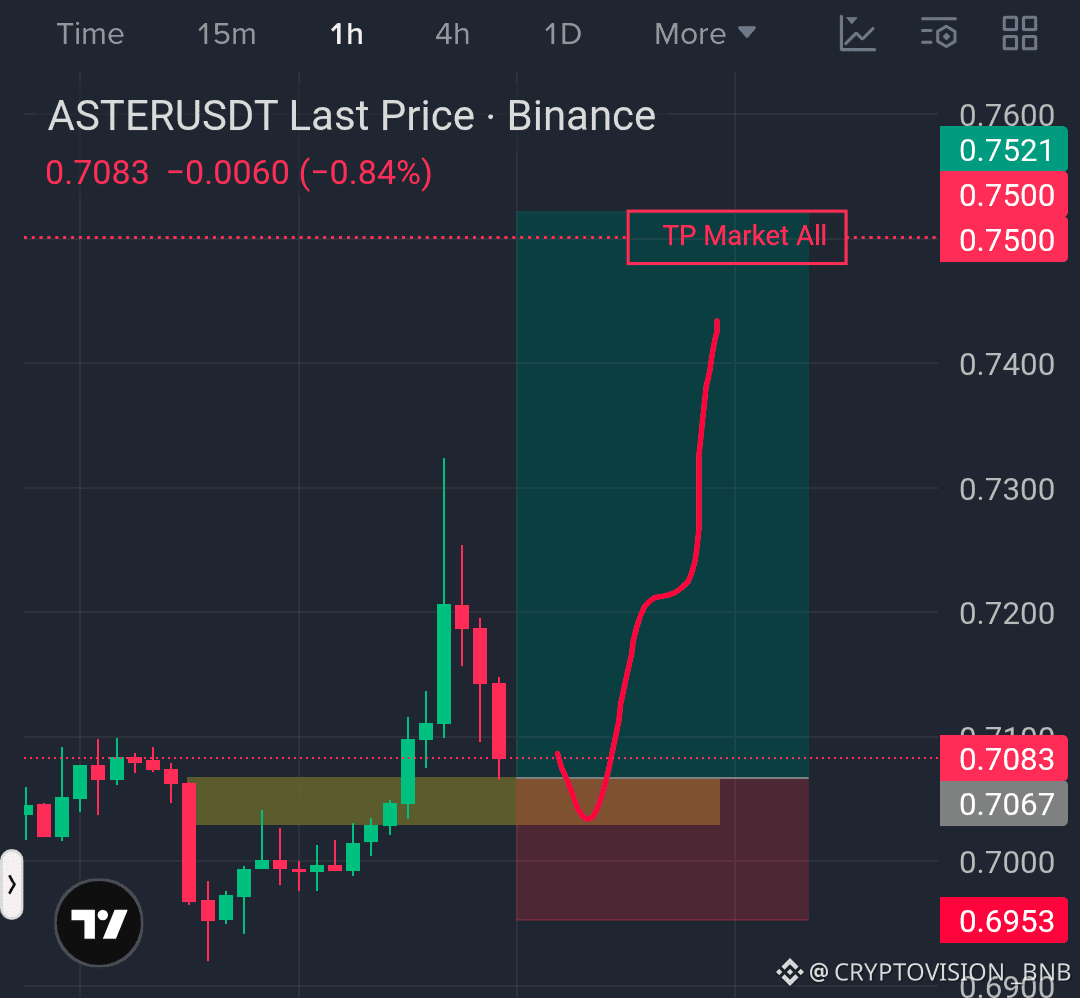
ASTER LONG
- Entry: wait for confirmation in the support zone
- TP: $0.750
- SL: $0.695
- Key zone to watch: $0.705–$0.708
If buyers defend support and market interest increases, ASTER could attempt a recovery toward $0.750. However, sharing a narrative doesn’t guarantee it will repeat HYPE’s move.
The key will be to confirm the price reaction and manage risk before entering.
Do you think $ASTER will follow in HYPE’s footsteps, or does it need another correction?
Follow my posts for more market analysis and signals.
$ASTER
{spot}(ASTERUSDT)
$ASTER : COULD IT BE THE NEXT TO WAKE UP?
HYPE has shown how a new wave of attention can fuel a strong move. Now, ASTER is on my radar because of its connection to a similar narrative.
ASTER LONG
- Entry: wait for confirmation in the support zone
- TP: $0.750
- SL: $0.695
- Key zone to watch: $0.705–$0.708
If buyers defend support and market interest increases, ASTER could attempt a recovery toward $0.750. However, sharing a narrative doesn’t guarantee it will repeat HYPE’s move.
The key will be to confirm the price reaction and manage risk before entering.
Do you think $ASTER will follow in HYPE’s footsteps, or does it need another correction?
Follow my posts for more market analysis and signals.
$ASTER

183
·
--
Bullish
$ETH HTF Update 📉
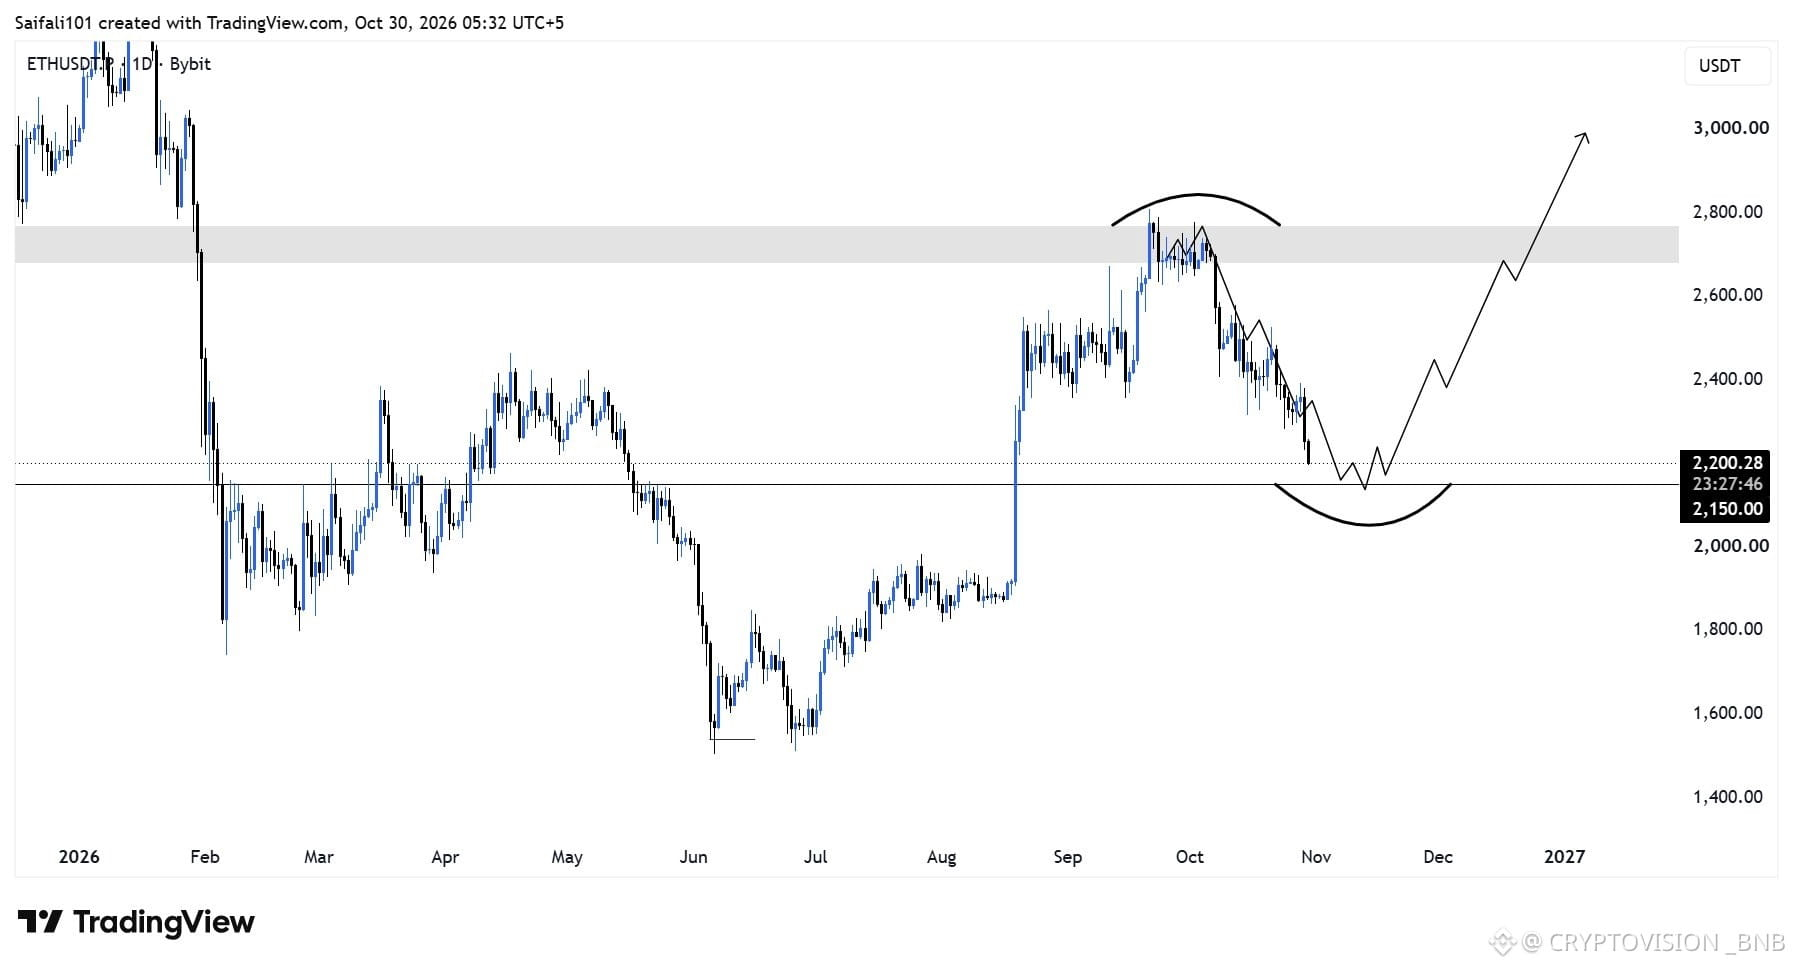
ETH is falling sharply and approaching our main HTF buy zone.
I shared the whole plan when ETH was around 2,800, expecting further downside, and now the price is trading around 2,200.
I’ve already started accumulating ETH on spot and will add more when the price reaches our main HTF POI at 2,150.
That’s also where I’ll look for confirmation to enter a long swing trade, targeting the next HTF leg toward 3K+
$ETH
{spot}(ETHUSDT)
$ETH HTF Update 📉
ETH is falling sharply and approaching our main HTF buy zone.
I shared the whole plan when ETH was around 2,800, expecting further downside, and now the price is trading around 2,200.
I’ve already started accumulating ETH on spot and will add more when the price reaches our main HTF POI at 2,150.
That’s also where I’ll look for confirmation to enter a long swing trade, targeting the next HTF leg toward 3K+
$ETH
387
·
--
Bearish
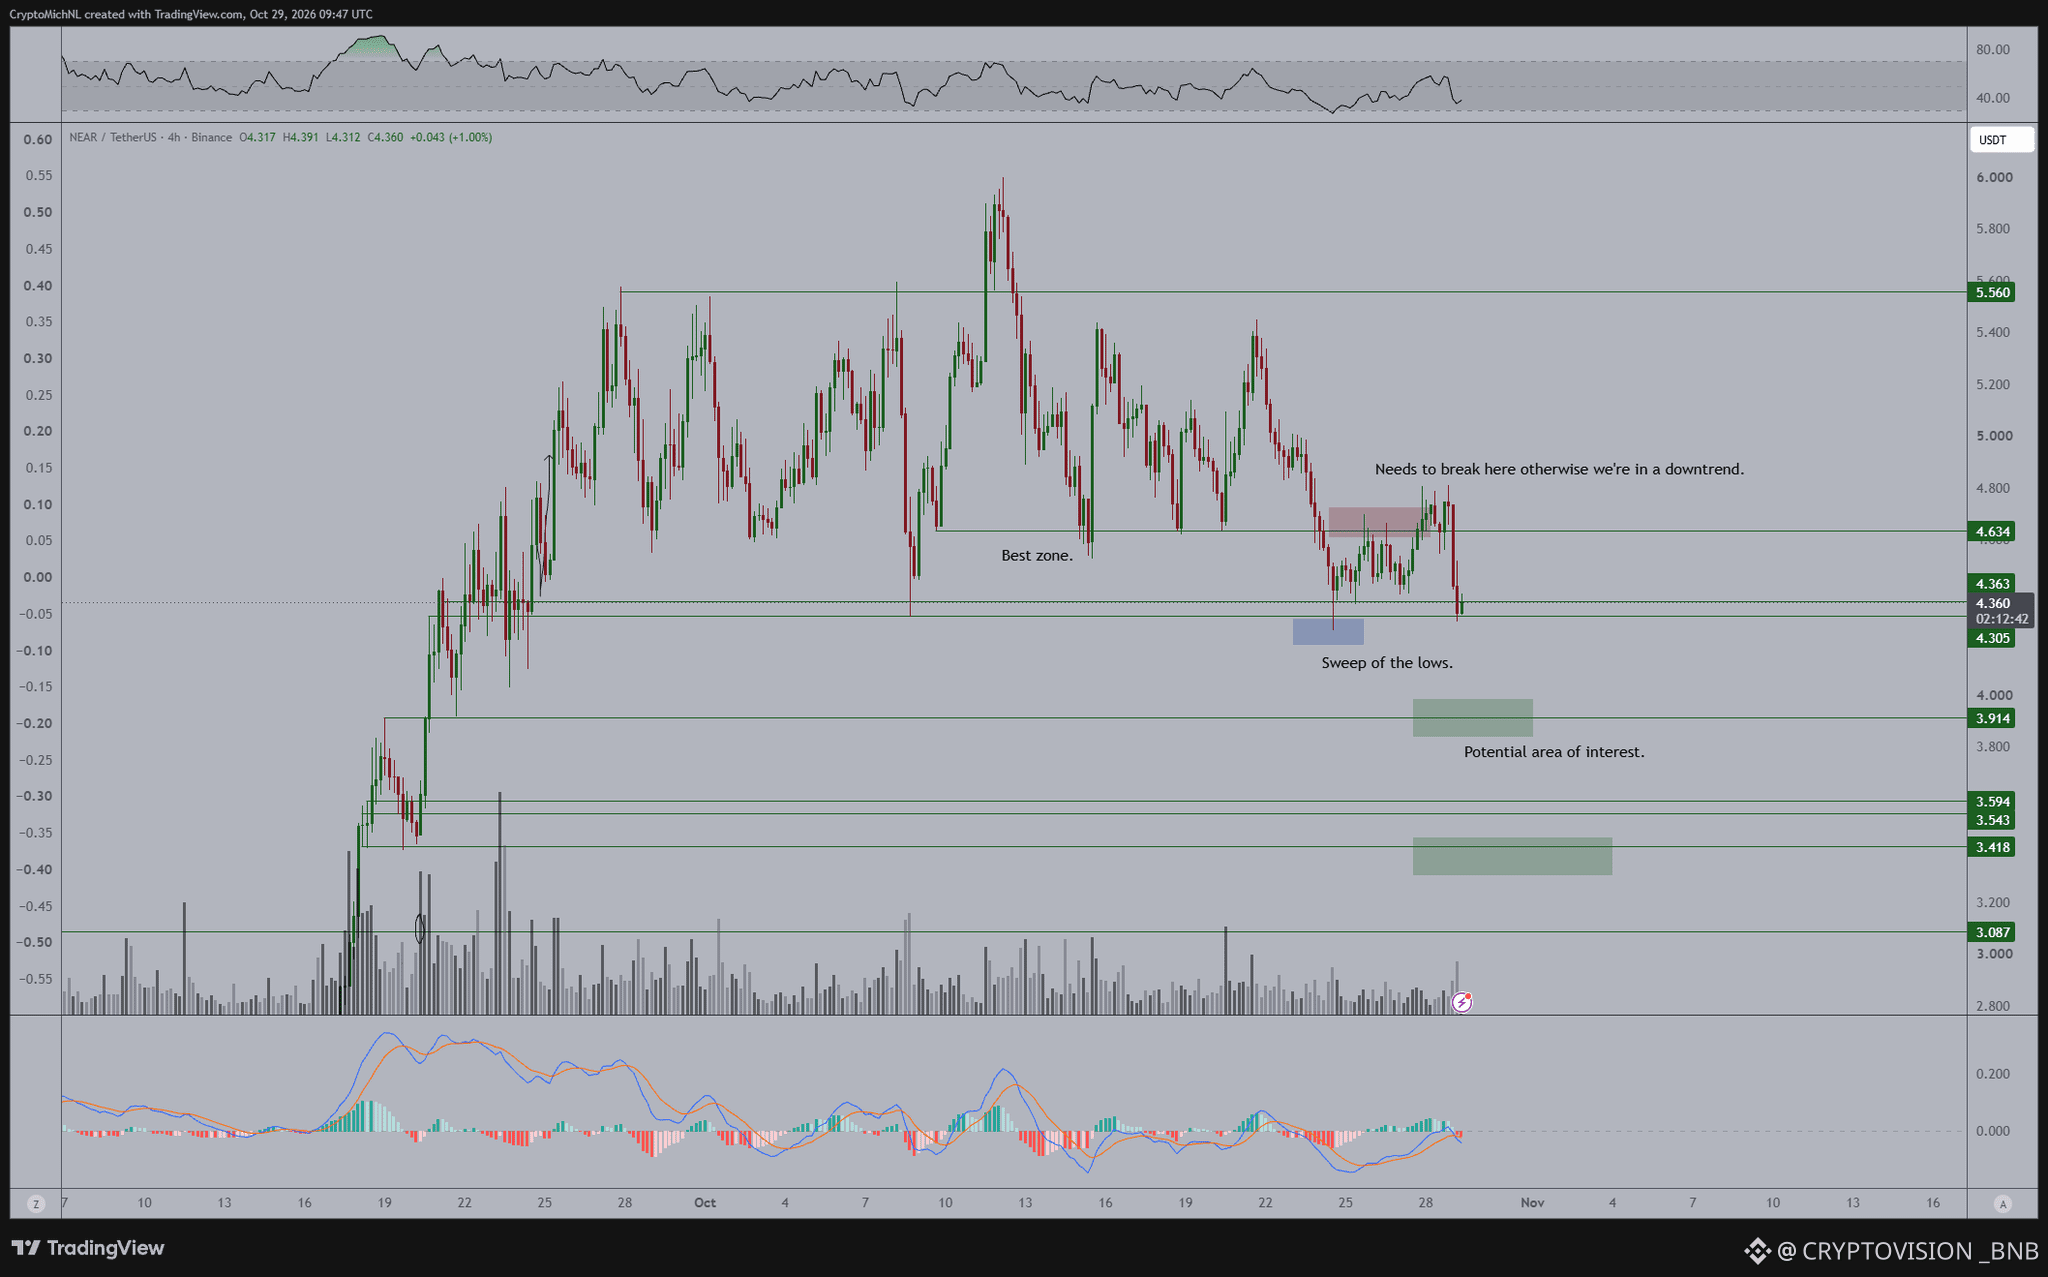
$NEAR needs to break a crucial resistance at $4.60 to become bullish again.
Or, we are getting a tremendous opportunity to pick up some positions at lower levels with this one.
Clear rejection at $4.60, it couldn't break that level and is on the verge of making new lows.
What are the levels we are looking at for potential buying opportunities?
If it were up to me:
- $3.40-3.50
- $3.90
If people are wondering "why doesn't this keep going up?"
That's how markets work.
At some point, the hype and excitement become so heavy that it simply can't keep going up and needs to pause a bit.
That is the current phase.
Buy the dip.
$NEAR
{spot}(NEARUSDT)
$NEAR needs to break a crucial resistance at $4.60 to become bullish again.
Or, we are getting a tremendous opportunity to pick up some positions at lower levels with this one.
Clear rejection at $4.60, it couldn't break that level and is on the verge of making new lows.
What are the levels we are looking at for potential buying opportunities?
If it were up to me:
- $3.40-3.50
- $3.90
If people are wondering "why doesn't this keep going up?"
That's how markets work.
At some point, the hype and excitement become so heavy that it simply can't keep going up and needs to pause a bit.
That is the current phase.
Buy the dip.
$NEAR
201
·
--
Bullish
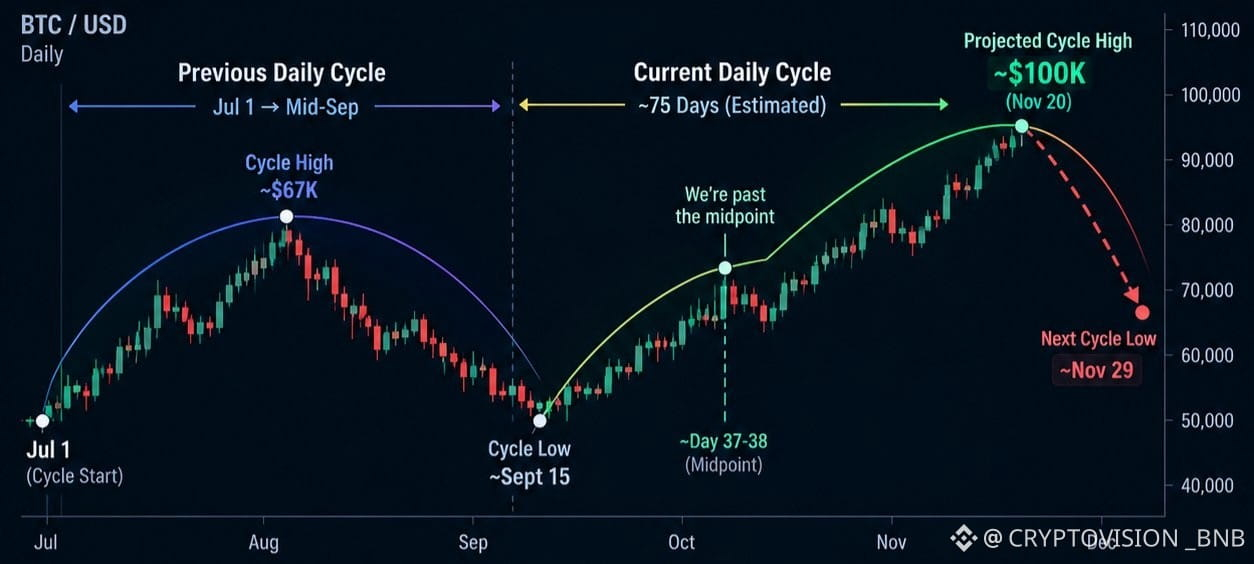
$BTC continues tracking the previous daily cycle with notable precision.
The previous cycle ran from July 1 to mid-September. The current cycle bottom occurred around September 15, and we are now past the midpoint of an estimated ~75-day cycle.
The structure remains right-translated, suggesting that the cycle high should form in the second half of the cycle. If the pattern continues to rhyme, BTC could make one final push toward $100K around November 20, followed by a drop toward the next daily cycle low around November 29.
For now, the trend remains firmly bullish.
Stay patient. Zoom out.
$BTC
{spot}(BTCUSDT)
$BTC continues tracking the previous daily cycle with notable precision.
The previous cycle ran from July 1 to mid-September. The current cycle bottom occurred around September 15, and we are now past the midpoint of an estimated ~75-day cycle.
The structure remains right-translated, suggesting that the cycle high should form in the second half of the cycle. If the pattern continues to rhyme, BTC could make one final push toward $100K around November 20, followed by a drop toward the next daily cycle low around November 29.
For now, the trend remains firmly bullish.
Stay patient. Zoom out.
$BTC
1
217
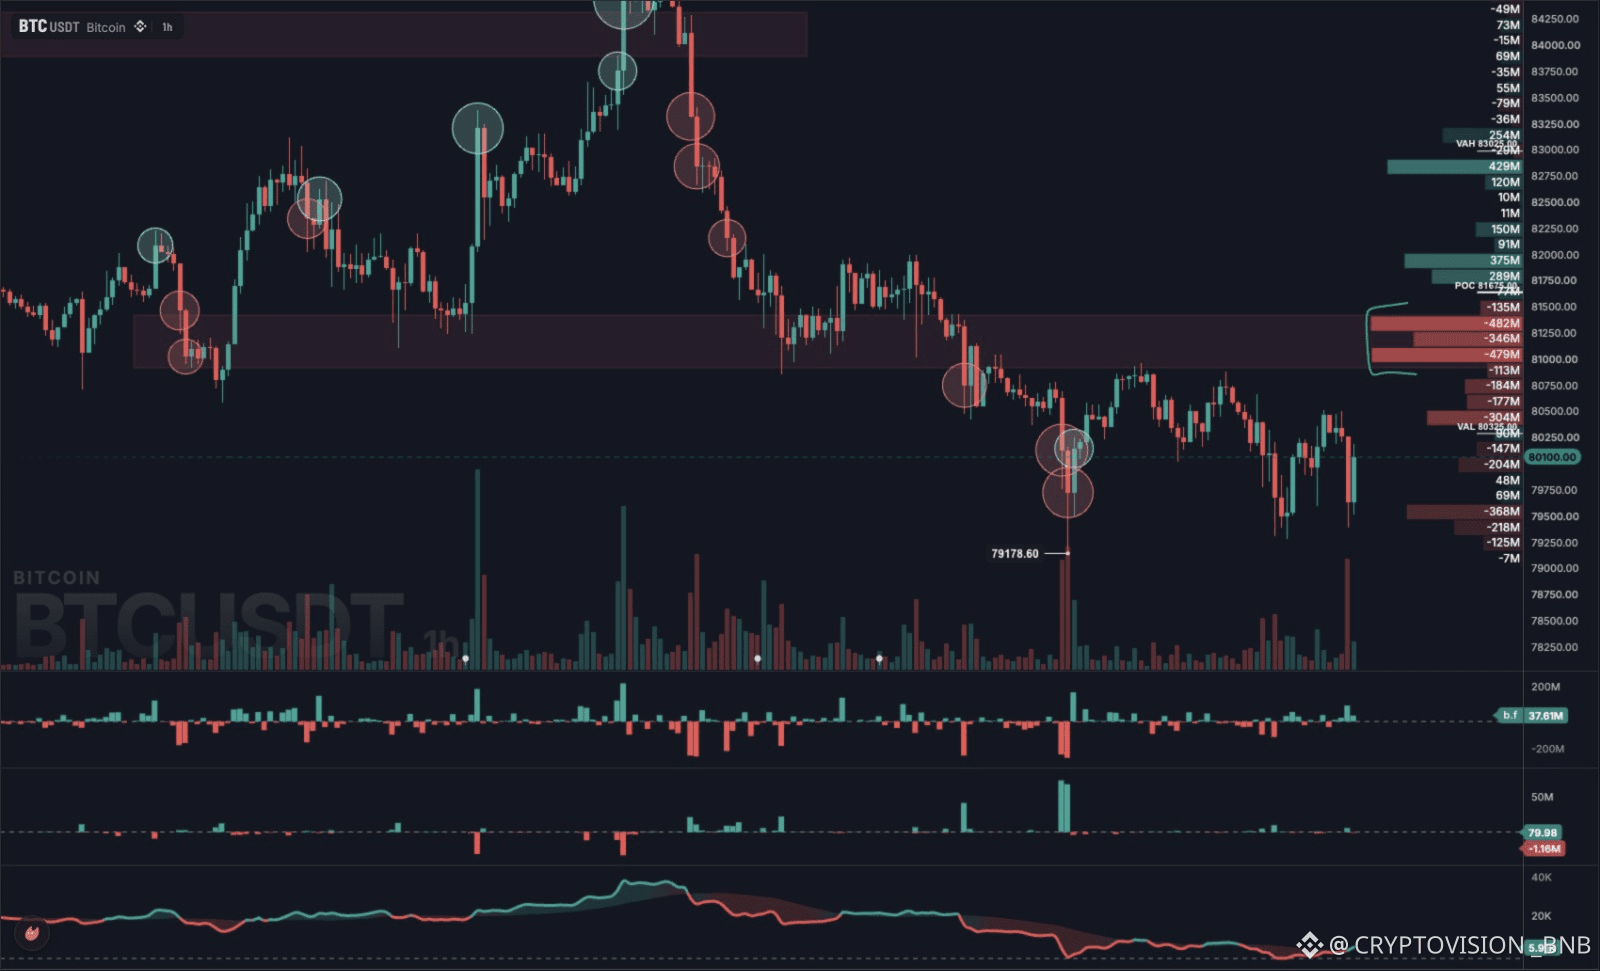
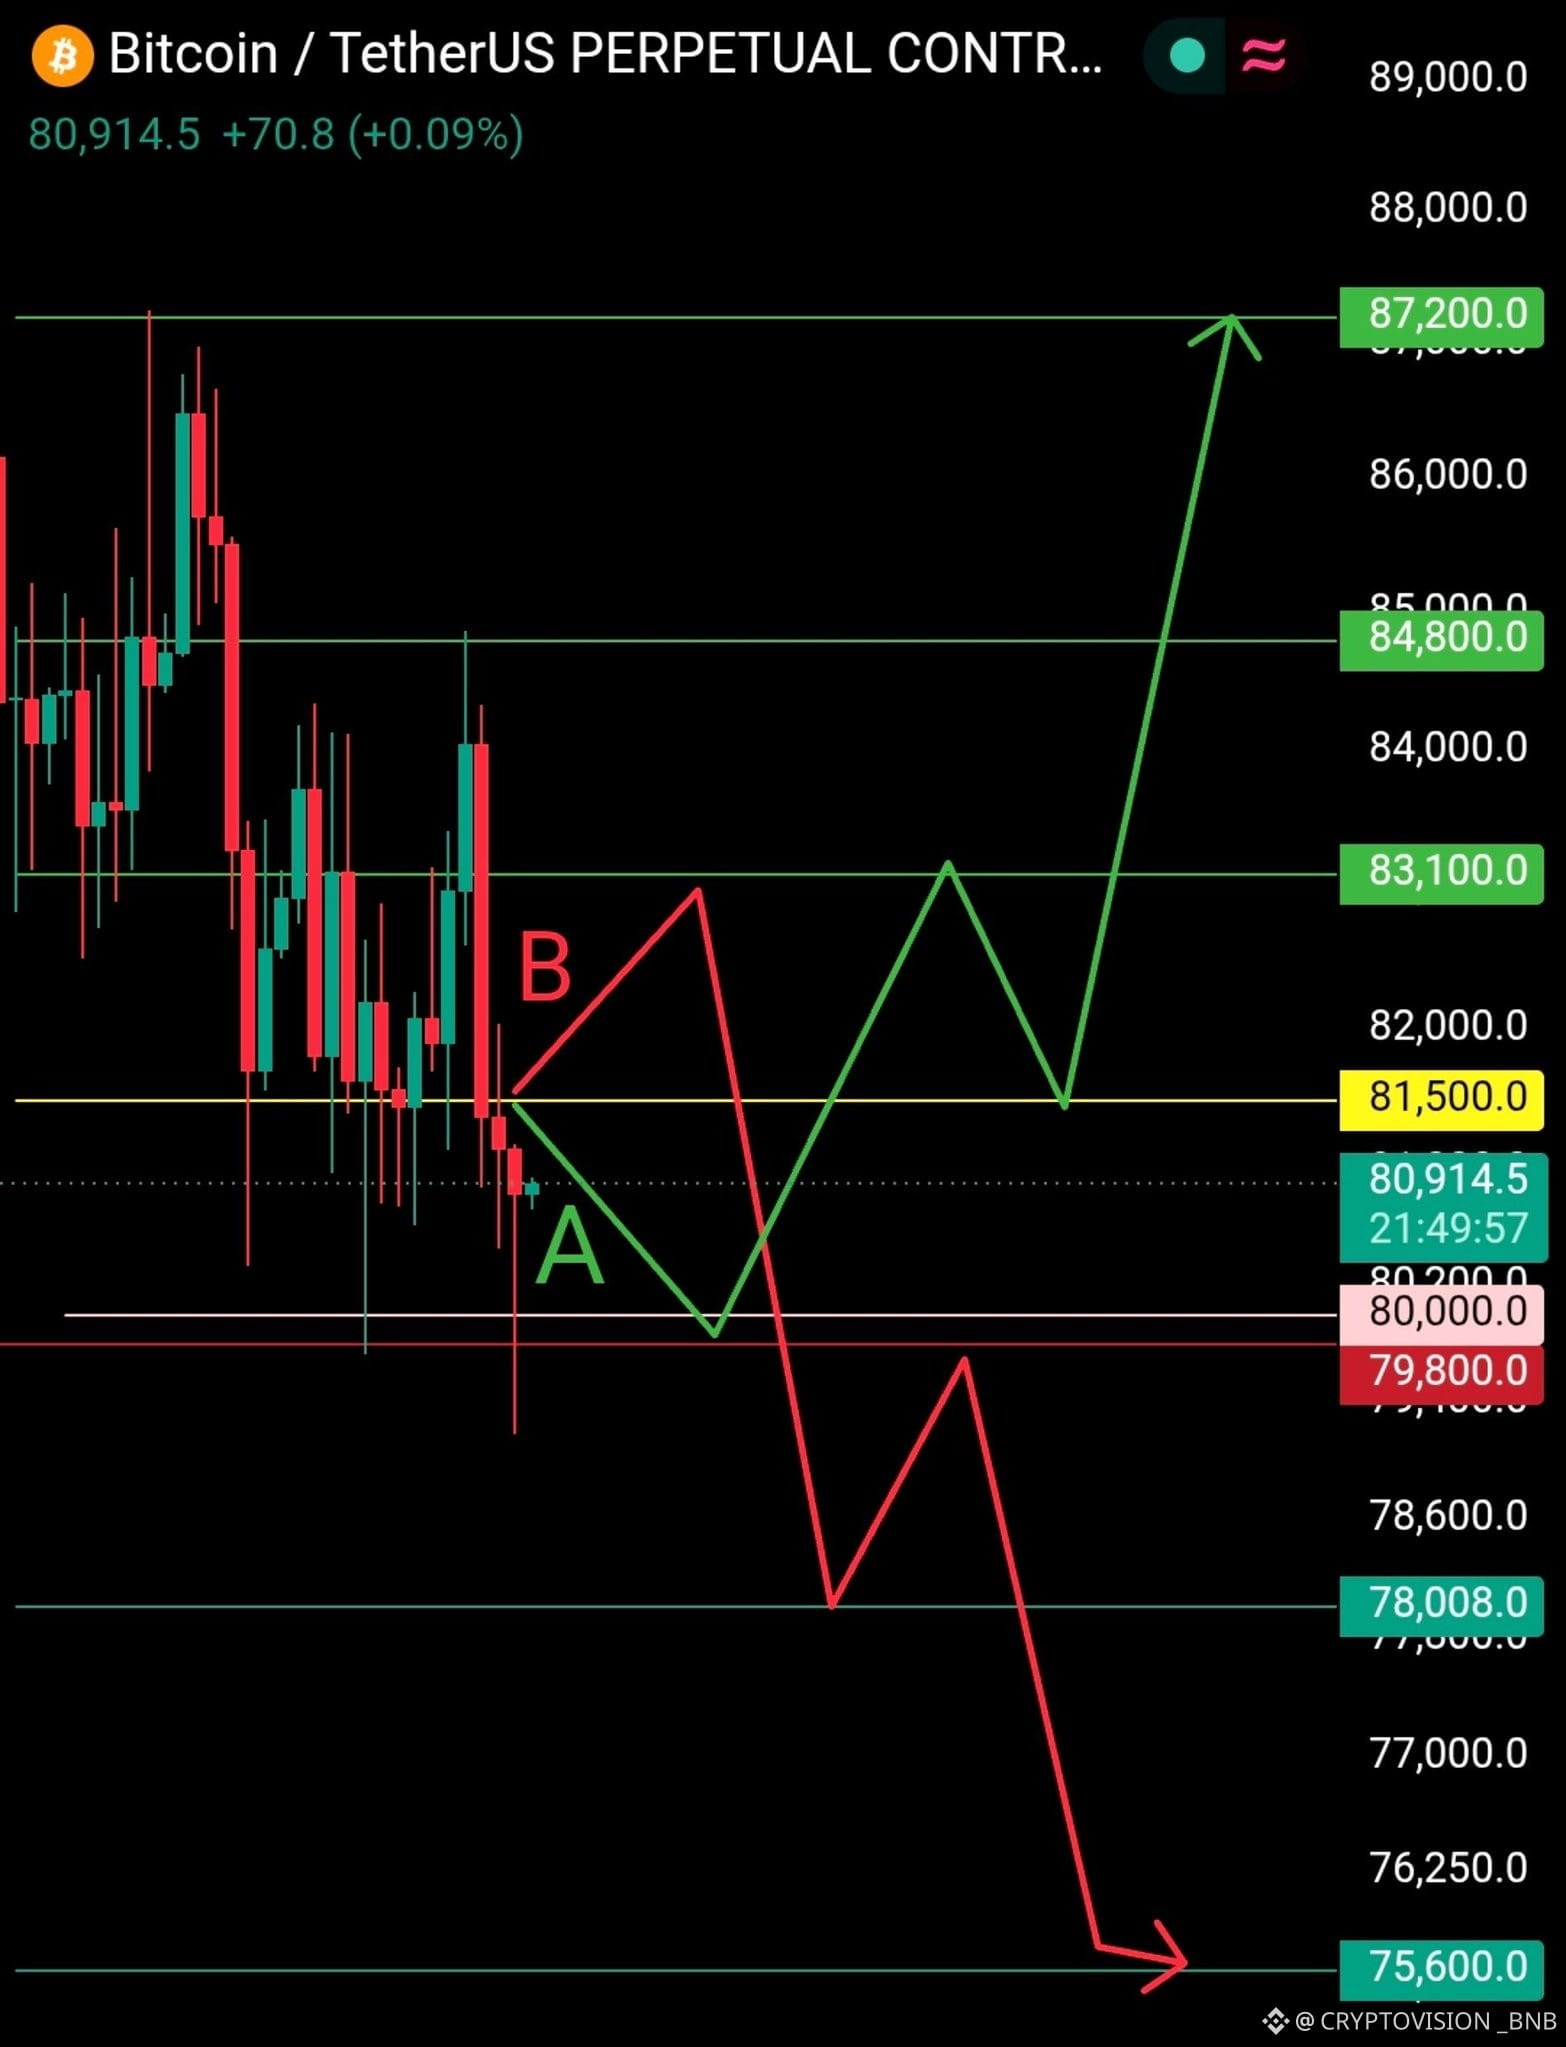
$BTC | $80,000 IS UNDER PRESSURE
Bitcoin is trying to stay above $80,000, but sellers continue to exert strong pressure on the price.
Here are the key levels I’m watching:
- $80,000: support that bulls need to defend.
- $81,500–$82,000: resistance zone where sellers are taking control.
If buyers manage to reclaim the $81,500–$82,000 zone, the possibility of bears getting trapped could increase, and BTC may try to continue moving higher.
However, as long as that resistance remains intact, Bitcoin continues to show weakness on shorter time frames.
The key is to see whether bulls manage to regain control or sellers end up breaking support.
Will BTC reclaim $82,000 or fall below $80,000?
$BTC
{spot}(BTCUSDT)
$BTC | $80,000 IS UNDER PRESSURE
Bitcoin is trying to stay above $80,000, but sellers continue to exert strong pressure on the price.
Here are the key levels I’m watching:
- $80,000: support that bulls need to defend.
- $81,500–$82,000: resistance zone where sellers are taking control.
If buyers manage to reclaim the $81,500–$82,000 zone, the possibility of bears getting trapped could increase, and BTC may try to continue moving higher.
However, as long as that resistance remains intact, Bitcoin continues to show weakness on shorter time frames.
The key is to see whether bulls manage to regain control or sellers end up breaking support.
Will BTC reclaim $82,000 or fall below $80,000?
$BTC
1
105
·
--
Bullish
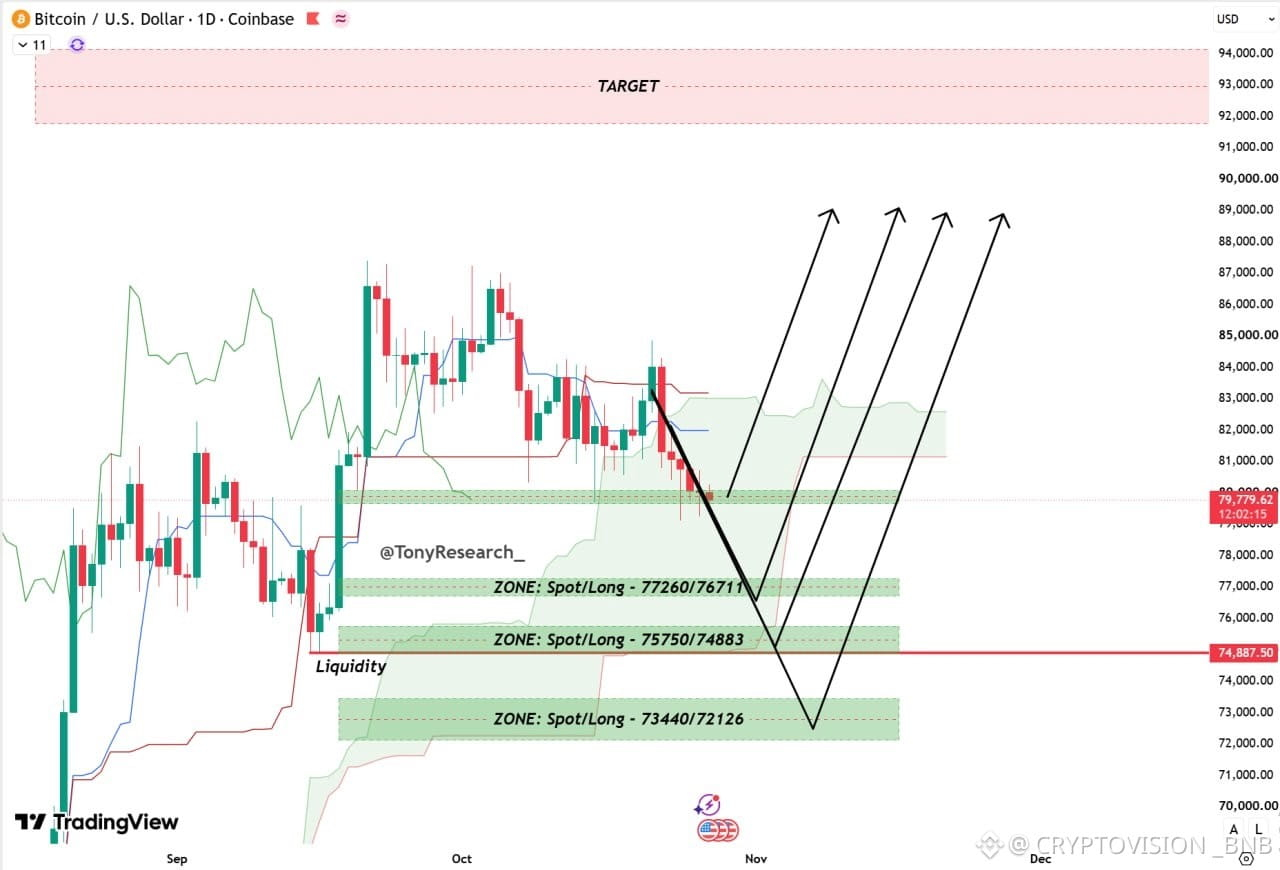
$BTC BUYING ZONES
Previously, I highlighted a broad zone for accumulating positions. Now I’ve decided to narrow it down and mark more specific zones for spot buys and long entries.
Important: these zones don’t mean you should go all in at the first level. It’s better to divide your capital into several parts and build positions gradually across the different zones.
We may not reach all of these levels, or we may end up testing every one of them.
I’m also watching these same zones for buying opportunities in altcoins like $SOL, $ETH, and others.
I’ll record a more detailed market analysis video in the coming days, so make sure to turn on notifications!
REMINDER: In May, I warned about the bull trap at $82K. In July/August, I called the long position from $62K. In August/September, I predicted the drop from $80K to $74K. In September, I called the rally to $85K/$88K, and in October, the correction toward $72K/$80K.
$BTC
{spot}(BTCUSDT)
$BTC BUYING ZONES
Previously, I highlighted a broad zone for accumulating positions. Now I’ve decided to narrow it down and mark more specific zones for spot buys and long entries.
Important: these zones don’t mean you should go all in at the first level. It’s better to divide your capital into several parts and build positions gradually across the different zones.
We may not reach all of these levels, or we may end up testing every one of them.
I’m also watching these same zones for buying opportunities in altcoins like $SOL, $ETH, and others.
I’ll record a more detailed market analysis video in the coming days, so make sure to turn on notifications!
REMINDER: In May, I warned about the bull trap at $82K. In July/August, I called the long position from $62K. In August/September, I predicted the drop from $80K to $74K. In September, I called the rally to $85K/$88K, and in October, the correction toward $72K/$80K.
$BTC
113
·
--
Bullish
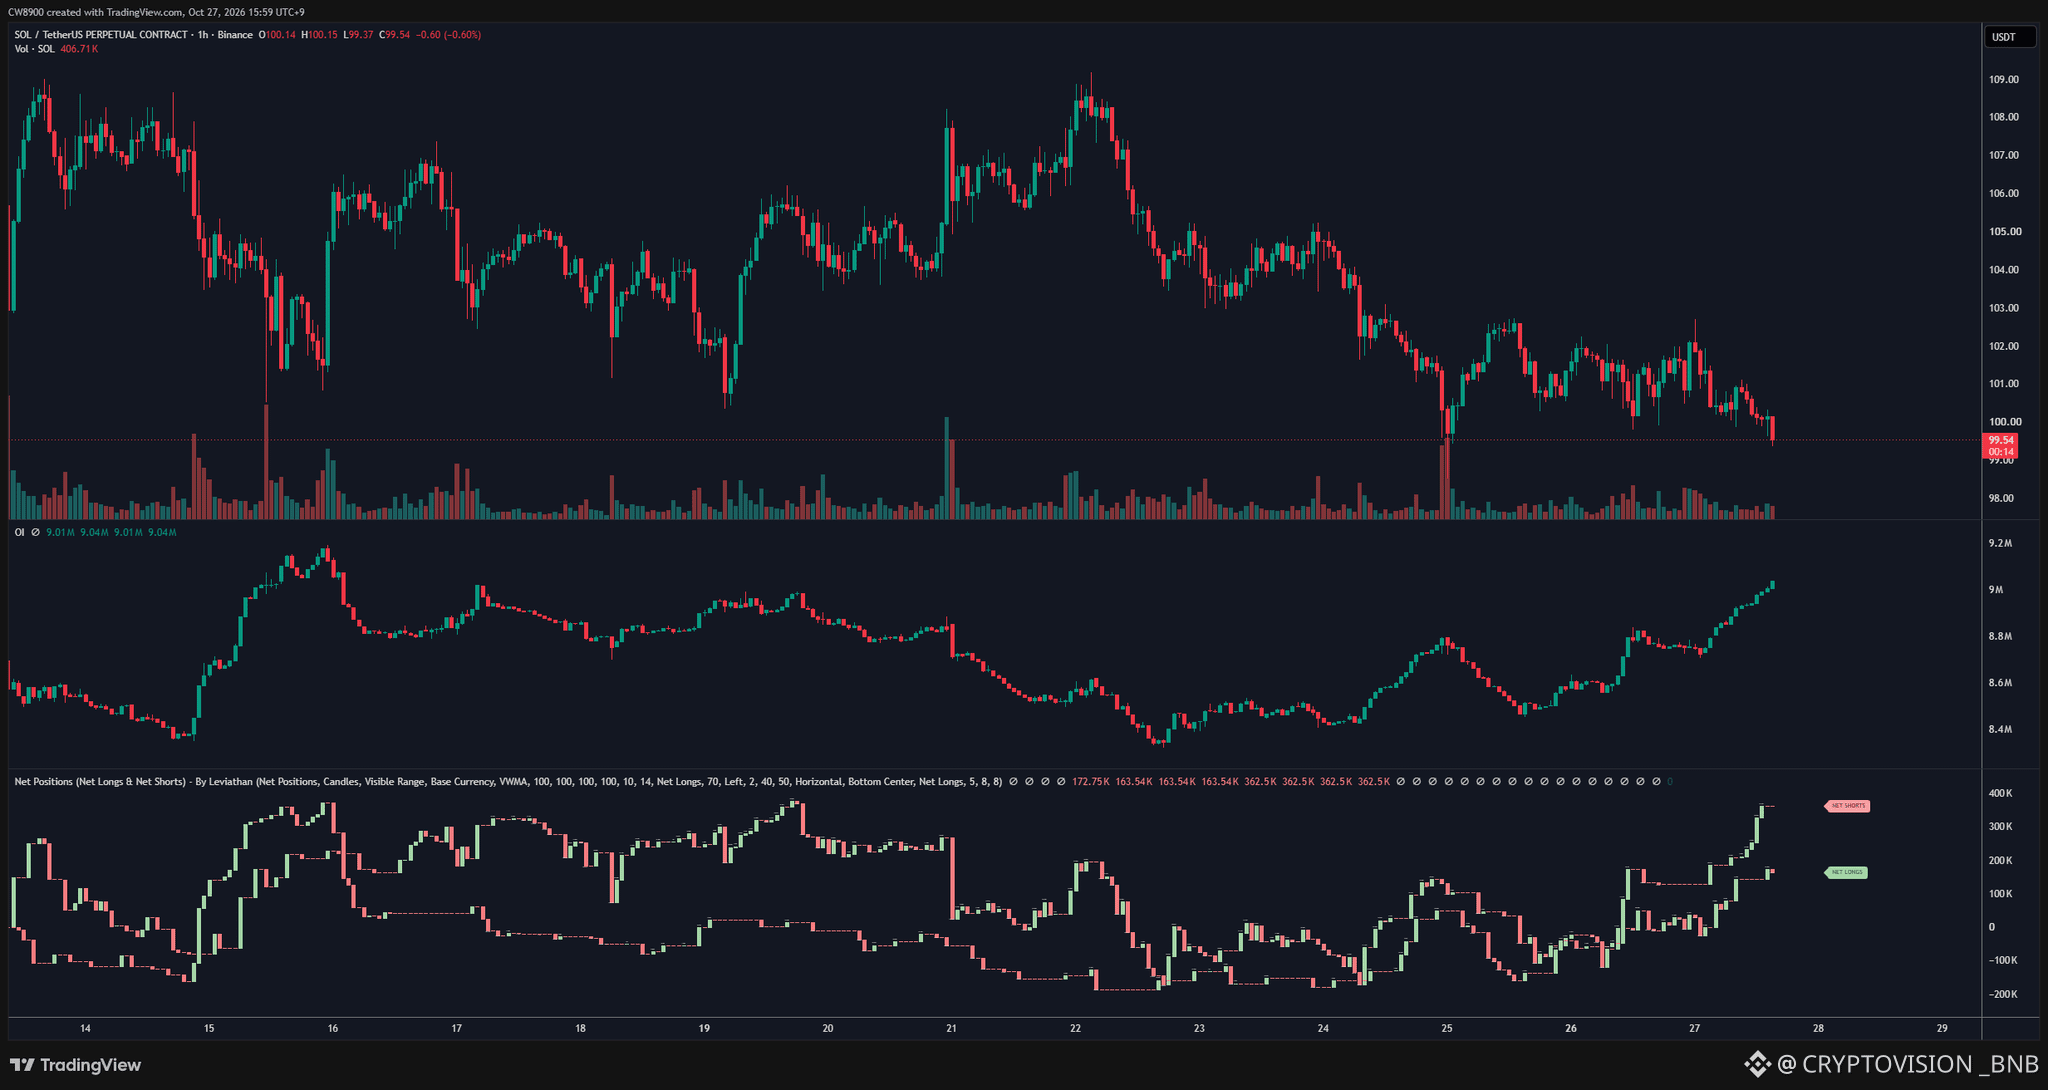
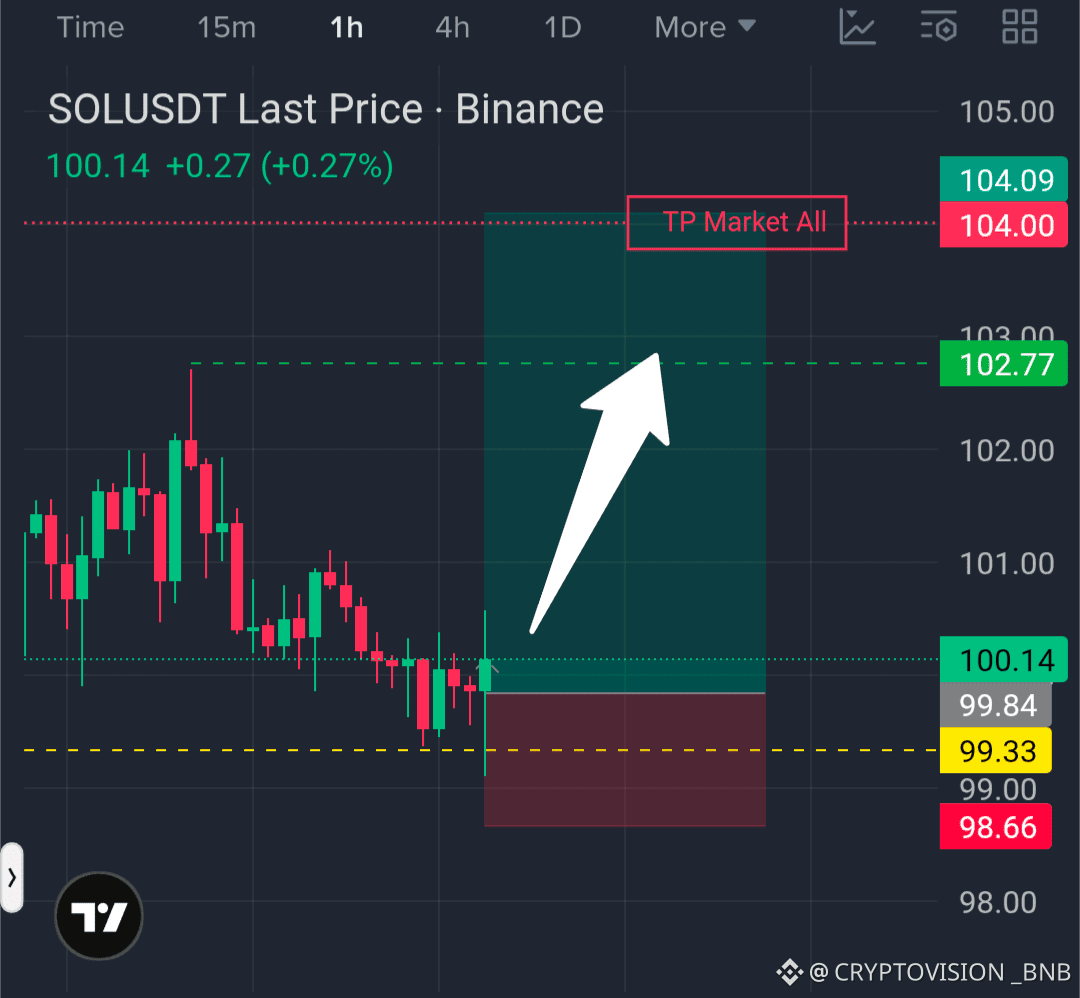
$SOL BOUNCE TOWARD $104?
SOLUSDT Perp
Price: $100.16
Solana is defending the support zone between $99 and $100. Although the price remains under pressure, buyers are beginning to show signs of a reaction.
Key trade levels:
Entry: $100
TP: $104
SL: $98.50
The first resistance is near $102.7. If SOL manages to break above that level with strength, the way could open toward $104.
What’s interesting is that sellers still haven’t managed to clearly break through support. If buyers take advantage of this opportunity, we could see a recovery.
The key is to confirm the move and not enter blindly.
Do you think SOL will recover to $104 or lose support at $99?
$SOL
{spot}(SOLUSDT)
$SOL BOUNCE TOWARD $104?
SOLUSDT Perp
Price: $100.16
Solana is defending the support zone between $99 and $100. Although the price remains under pressure, buyers are beginning to show signs of a reaction.
Key trade levels:
Entry: $100
TP: $104
SL: $98.50
The first resistance is near $102.7. If SOL manages to break above that level with strength, the way could open toward $104.
What’s interesting is that sellers still haven’t managed to clearly break through support. If buyers take advantage of this opportunity, we could see a recovery.
The key is to confirm the move and not enter blindly.
Do you think SOL will recover to $104 or lose support at $99?
$SOL
106
·
--
Bullish
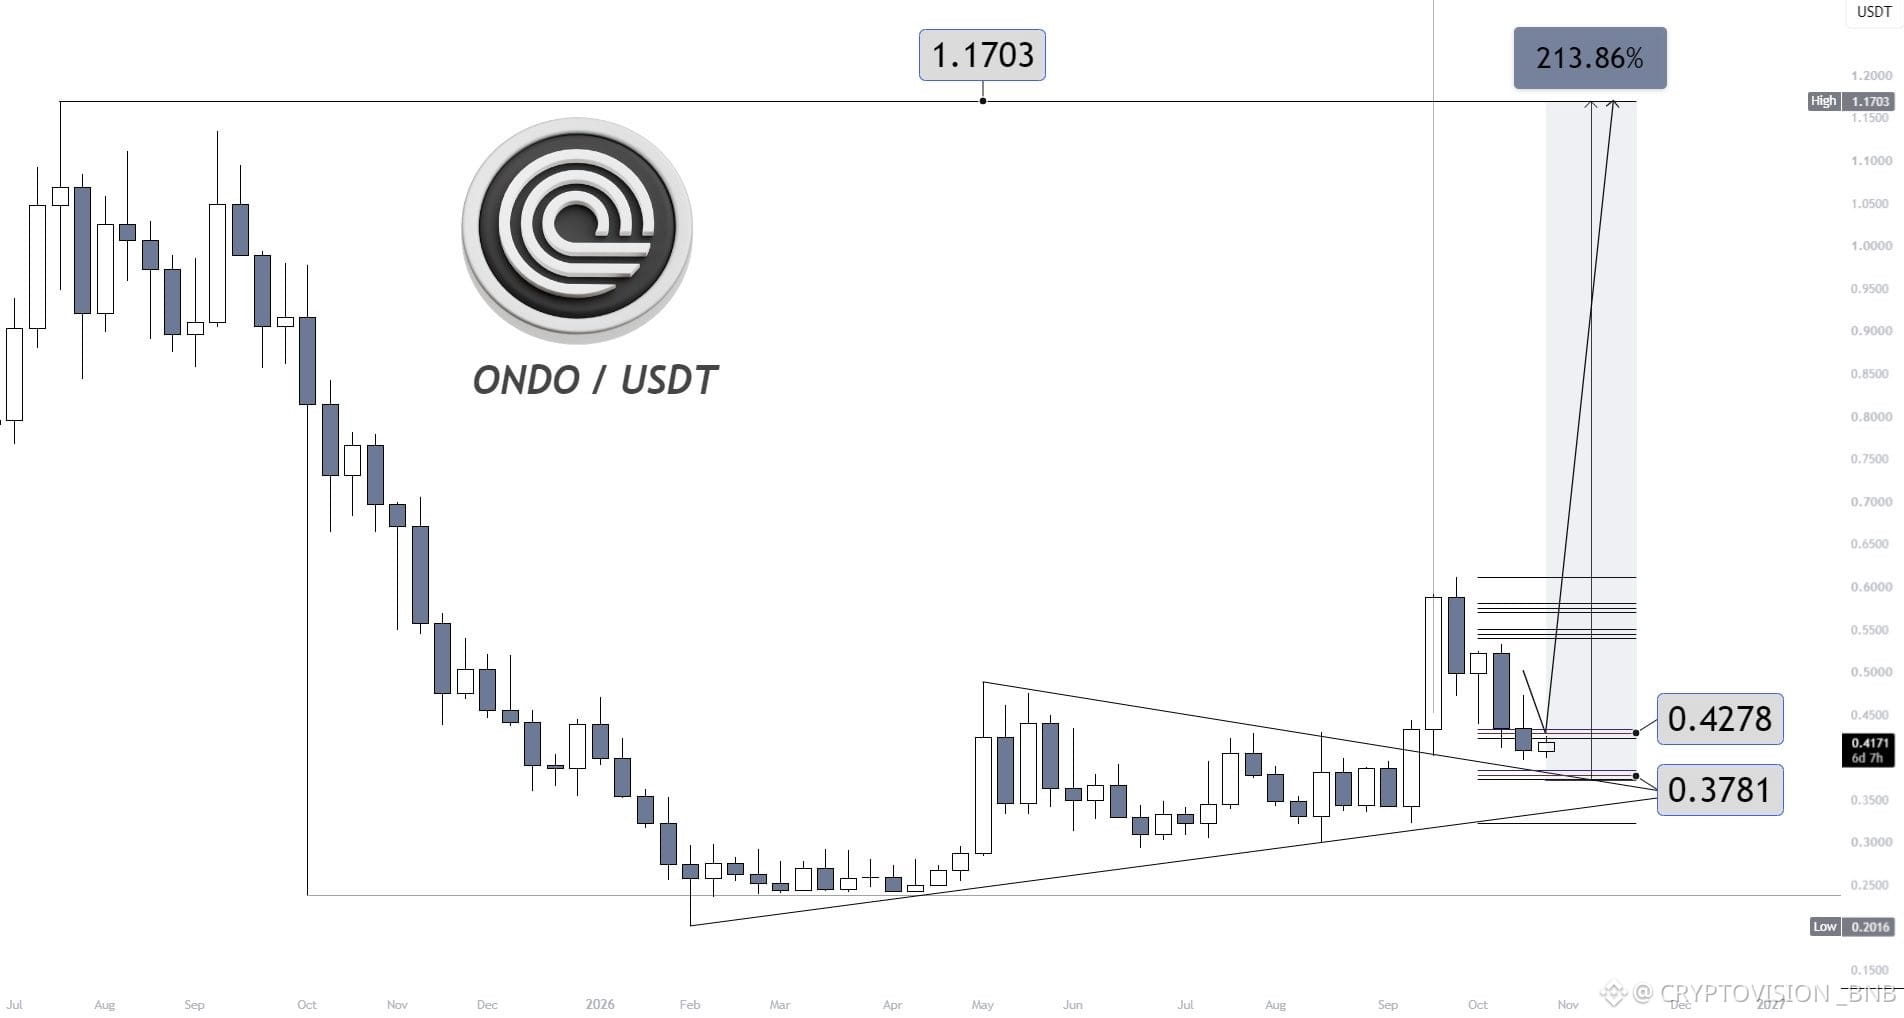
$ONDO
The limit order at 0.4278$ has now been triggered!
There’s still another good entry at 0.3781$! From this zone, we could potentially move upward!
Potential move: 213%, with liquidity at 1.170$ to take.
$ONDO
{spot}(ONDOUSDT)
$ONDO
The limit order at 0.4278$ has now been triggered!
There’s still another good entry at 0.3781$! From this zone, we could potentially move upward!
Potential move: 213%, with liquidity at 1.170$ to take.
$ONDO
The limit order at 0.4278$ has now been triggered!
There’s still another good entry at 0.3781$! From this zone, we could potentially move upward!
Potential move: 213%, with liquidity at 1.170$ to take.
$ONDO
293
·
--
Bullish
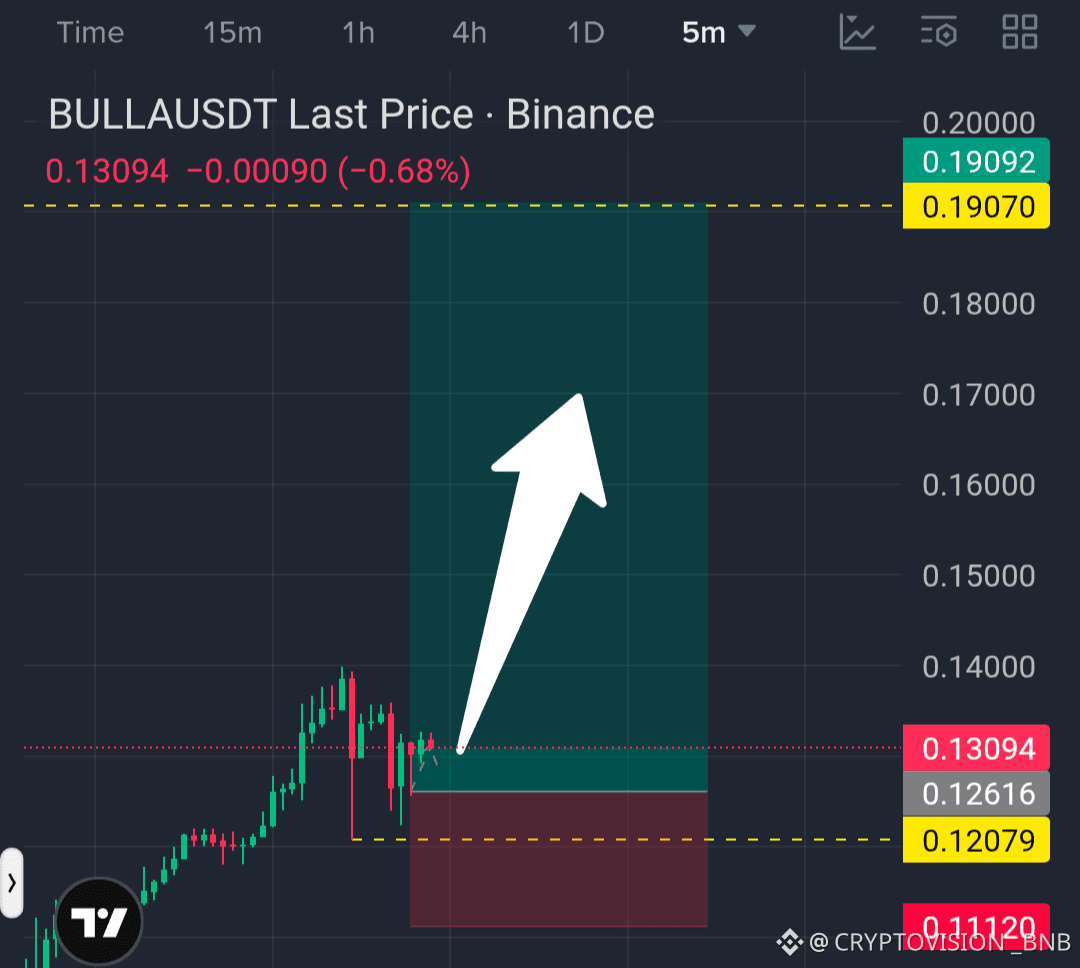
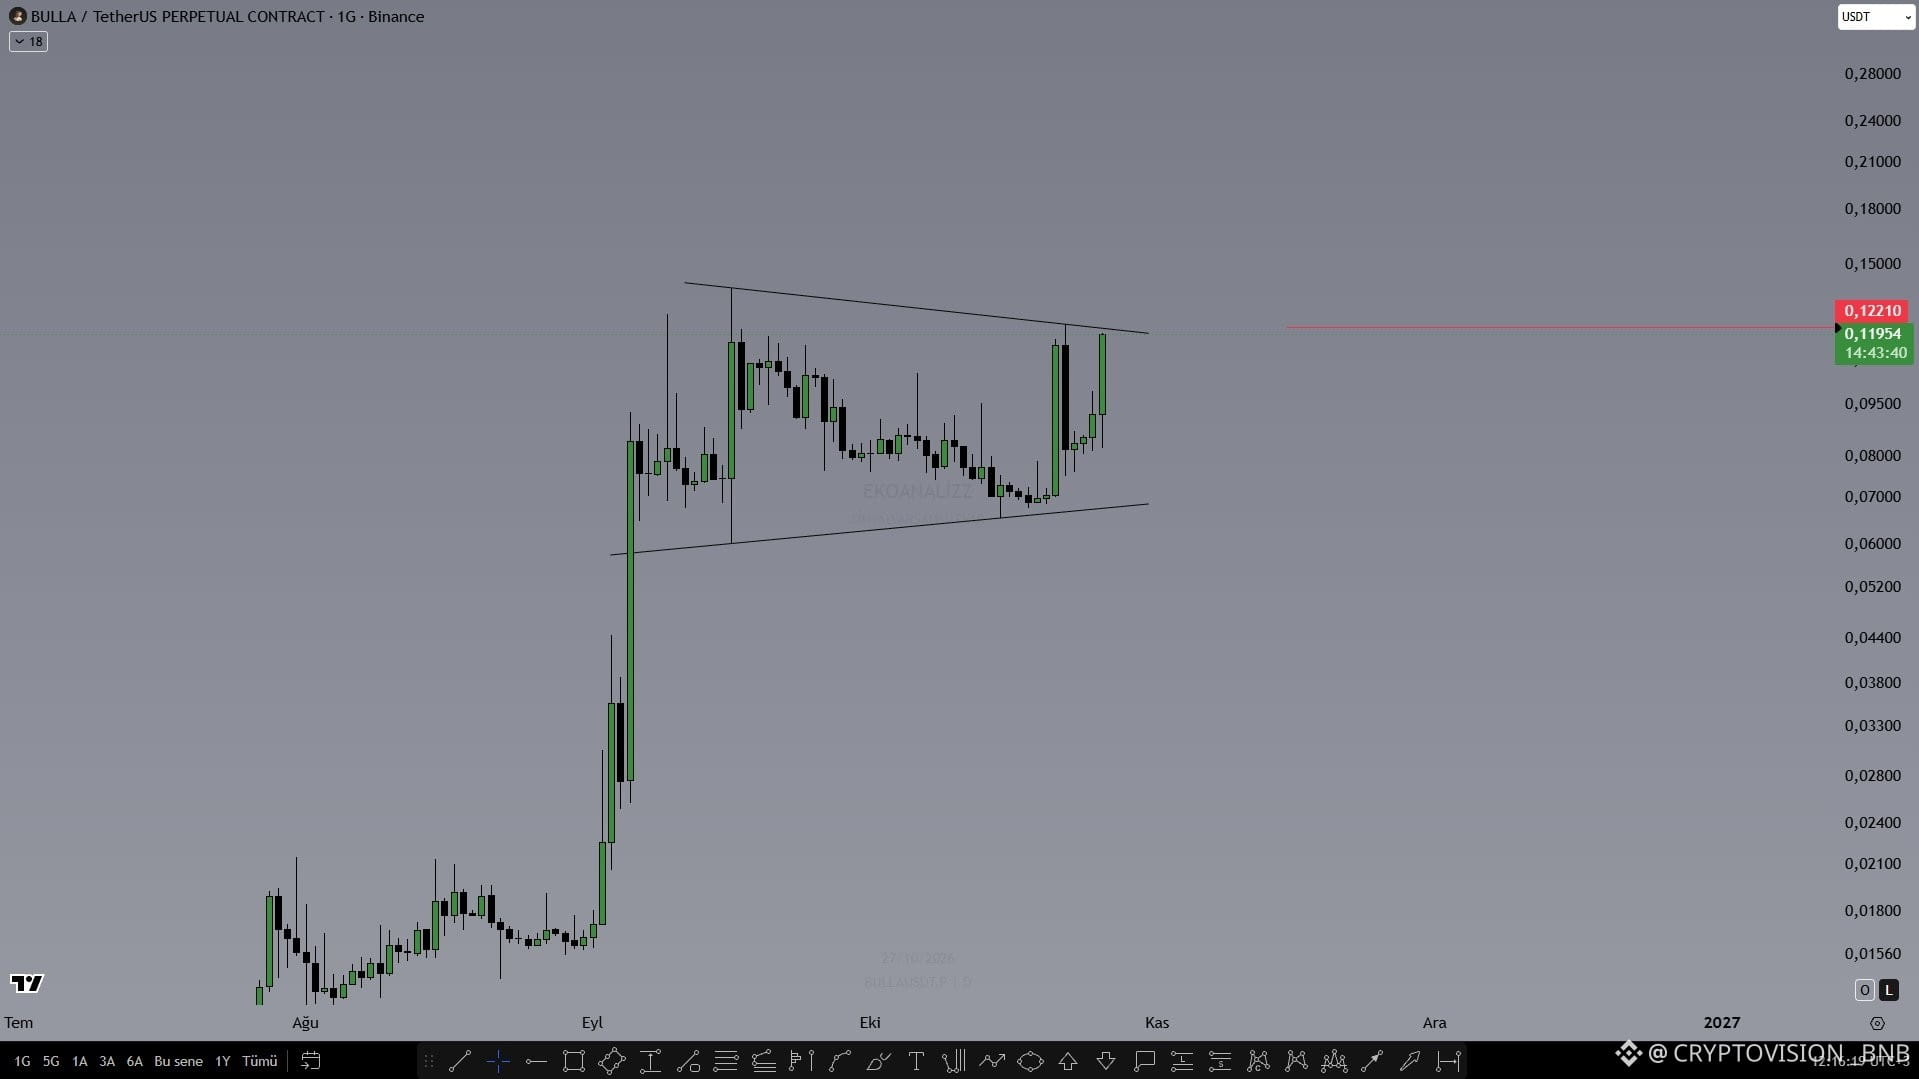
$BULLA CAN THE RALLY CONTINUE?
BULLAUSDT Perp
Price: $0.15157
Gain: +66.72%
$BULLA continues to gain strength after a long consolidation. Now the question is whether buyers can maintain the momentum and push the price to new levels.
TP: $0.1950
SL: $0.1110
What’s interesting is that if the price stays above the breakout zone, short positions could fuel another upward move.
However, after a 66.72% rally, there’s also a risk of a sharp correction. That’s why risk management is key.
Do you think $BULLA will reach $0.1950, or will we see a drop first?
{future}(BULLAUSDT)
$BULLA CAN THE RALLY CONTINUE?
BULLAUSDT Perp
Price: $0.15157
Gain: +66.72%
$BULLA continues to gain strength after a long consolidation. Now the question is whether buyers can maintain the momentum and push the price to new levels.
TP: $0.1950
SL: $0.1110
What’s interesting is that if the price stays above the breakout zone, short positions could fuel another upward move.
However, after a 66.72% rally, there’s also a risk of a sharp correction. That’s why risk management is key.
Do you think $BULLA will reach $0.1950, or will we see a drop first?
122
·
--
Bullish
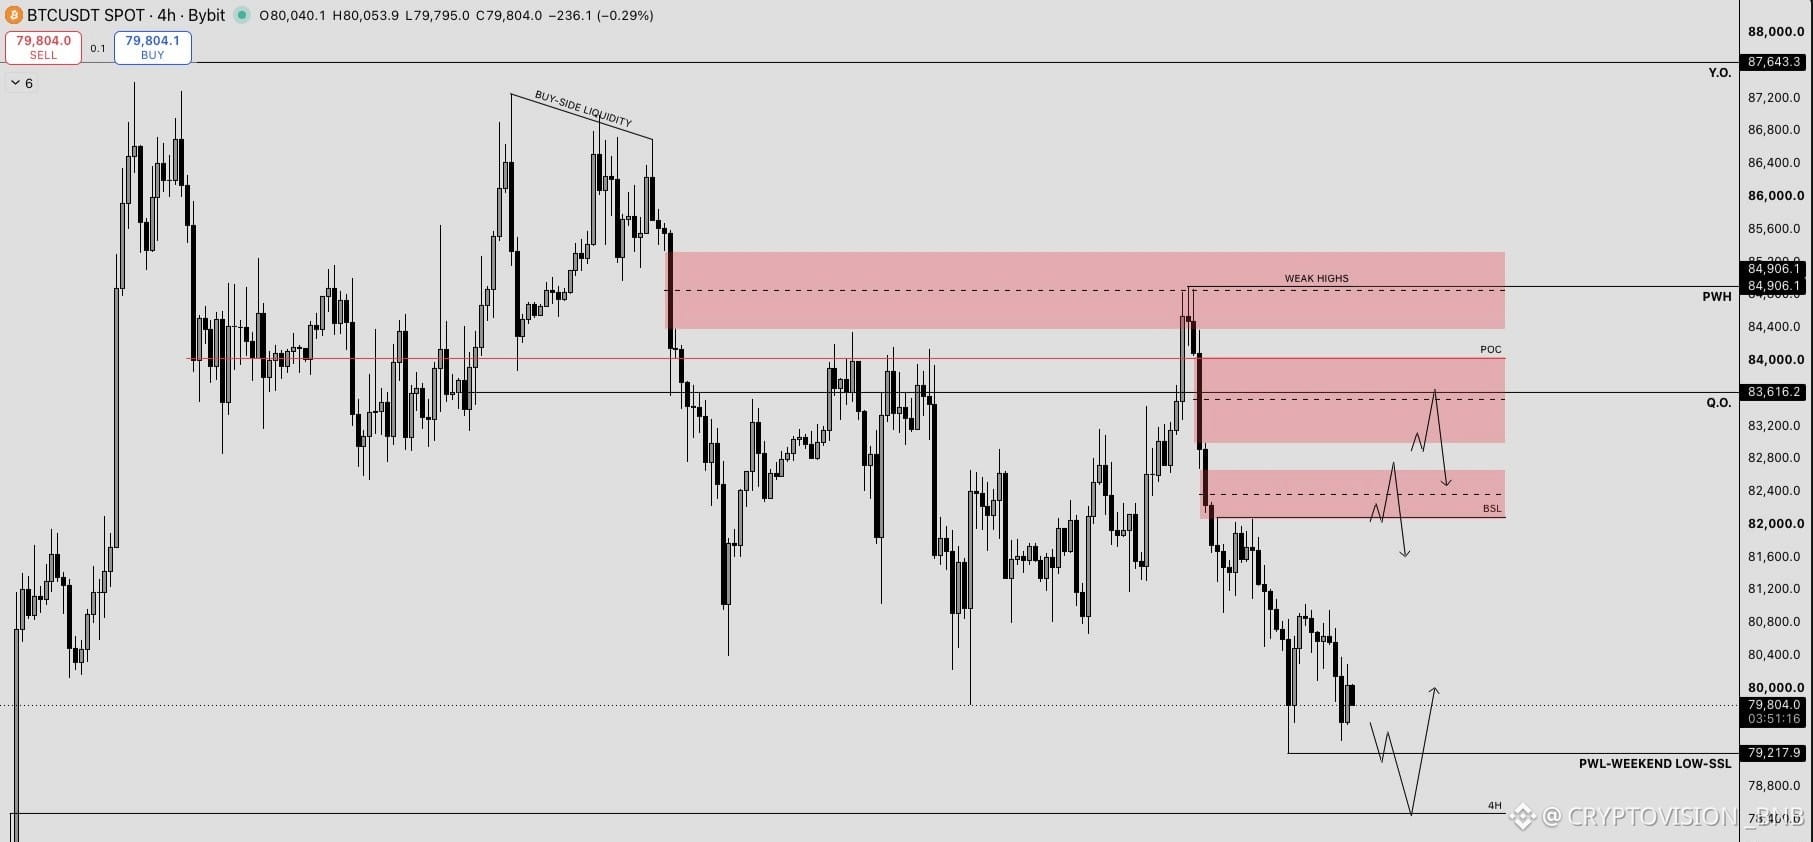
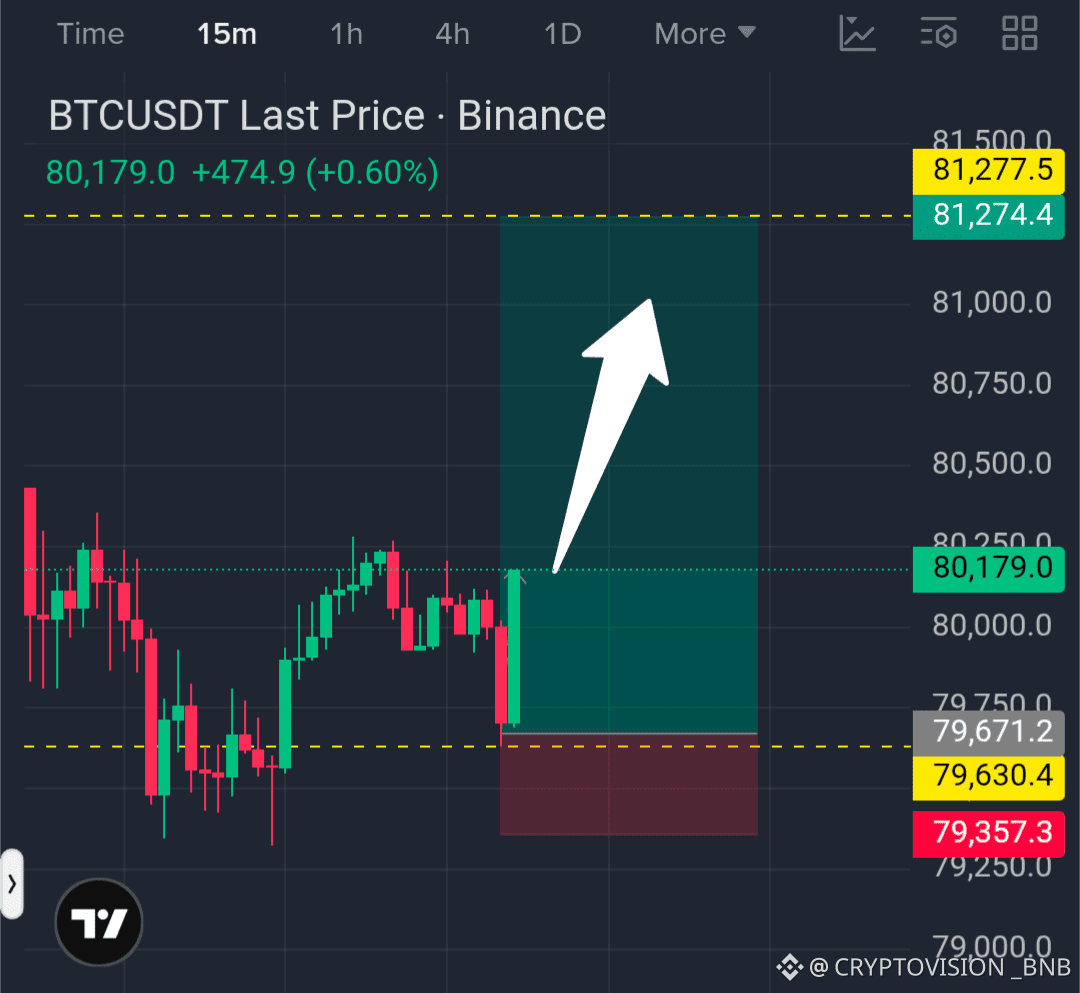
$BTC | BUYERS ARE DEFENDING SUPPORT
Bitcoin bounced strongly from the lower zone and quickly regained ground. Attention is now focused on the liquidity above the price.
BTCUSDT Perp
Entry: $80,361.8
TP: $81,274
SL: $79,357
The idea is to look for an upward move as long as the price stays above support. If buyers maintain their momentum, BTC could head toward the target zone and trigger the closure of short positions.
This isn't about chasing every green candle, but about watching the price reaction and the strength of the buyers.
If support fails, the bullish scenario loses strength.
Do you think BTC will reach $81,274?
$BTC
{spot}(BTCUSDT)
$BTC | BUYERS ARE DEFENDING SUPPORT
Bitcoin bounced strongly from the lower zone and quickly regained ground. Attention is now focused on the liquidity above the price.
BTCUSDT Perp
Entry: $80,361.8
TP: $81,274
SL: $79,357
The idea is to look for an upward move as long as the price stays above support. If buyers maintain their momentum, BTC could head toward the target zone and trigger the closure of short positions.
This isn't about chasing every green candle, but about watching the price reaction and the strength of the buyers.
If support fails, the bullish scenario loses strength.
Do you think BTC will reach $81,274?
$BTC
98
·
--
Bullish
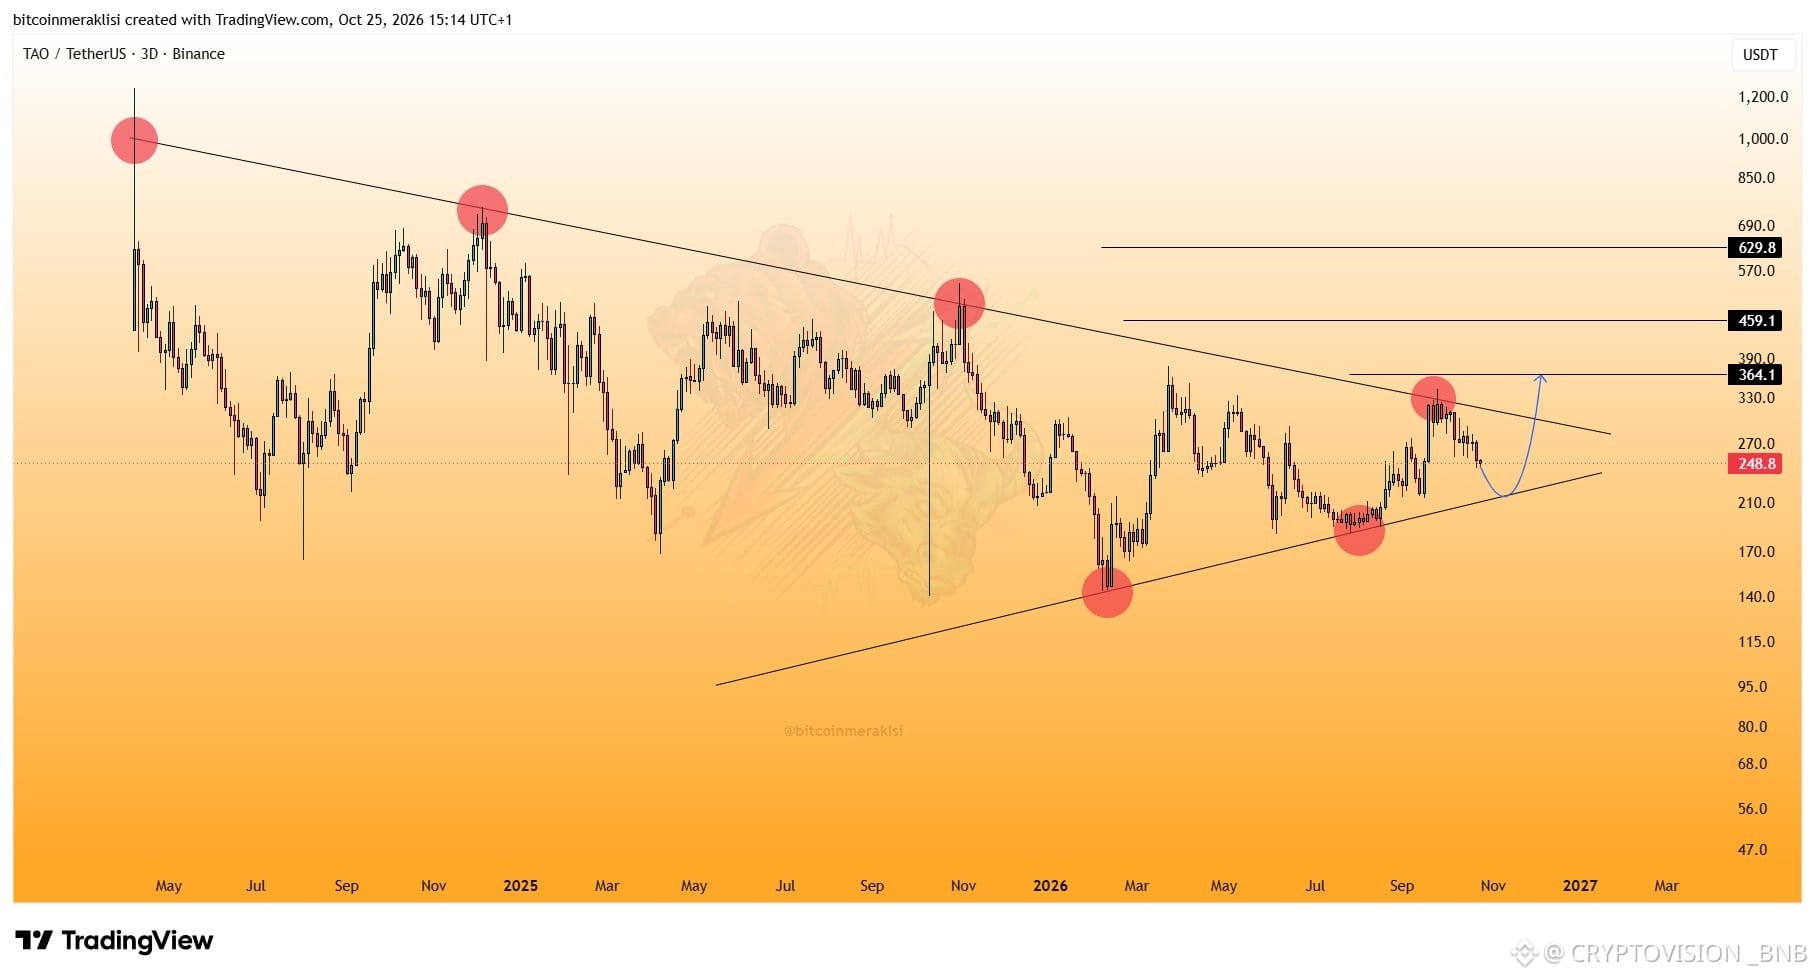
#TAO
Analysis of the request received from Telegram.
Friends, since the day $TAO was listed, its ongoing downtrend has been tested once again over the past few days, but it was rejected again and turned back downward.
Based on the current outlook, the decline is likely to continue to the $215 levels.
Both horizontal support and the uptrend support converge in this zone.
Of course, if there is positive movement on the #BTC side, a reaction could occur even before this level is reached.
However, for us to talk about a sustained rise, the downtrend must be broken.
$TAO
{spot}(TAOUSDT)
#TAO
Analysis of the request received from Telegram.
Friends, since the day $TAO was listed, its ongoing downtrend has been tested once again over the past few days, but it was rejected again and turned back downward.
Based on the current outlook, the decline is likely to continue to the $215 levels.
Both horizontal support and the uptrend support converge in this zone.
Of course, if there is positive movement on the #BTC side, a reaction could occur even before this level is reached.
However, for us to talk about a sustained rise, the downtrend must be broken.
$TAO
149
·
--
Bullish
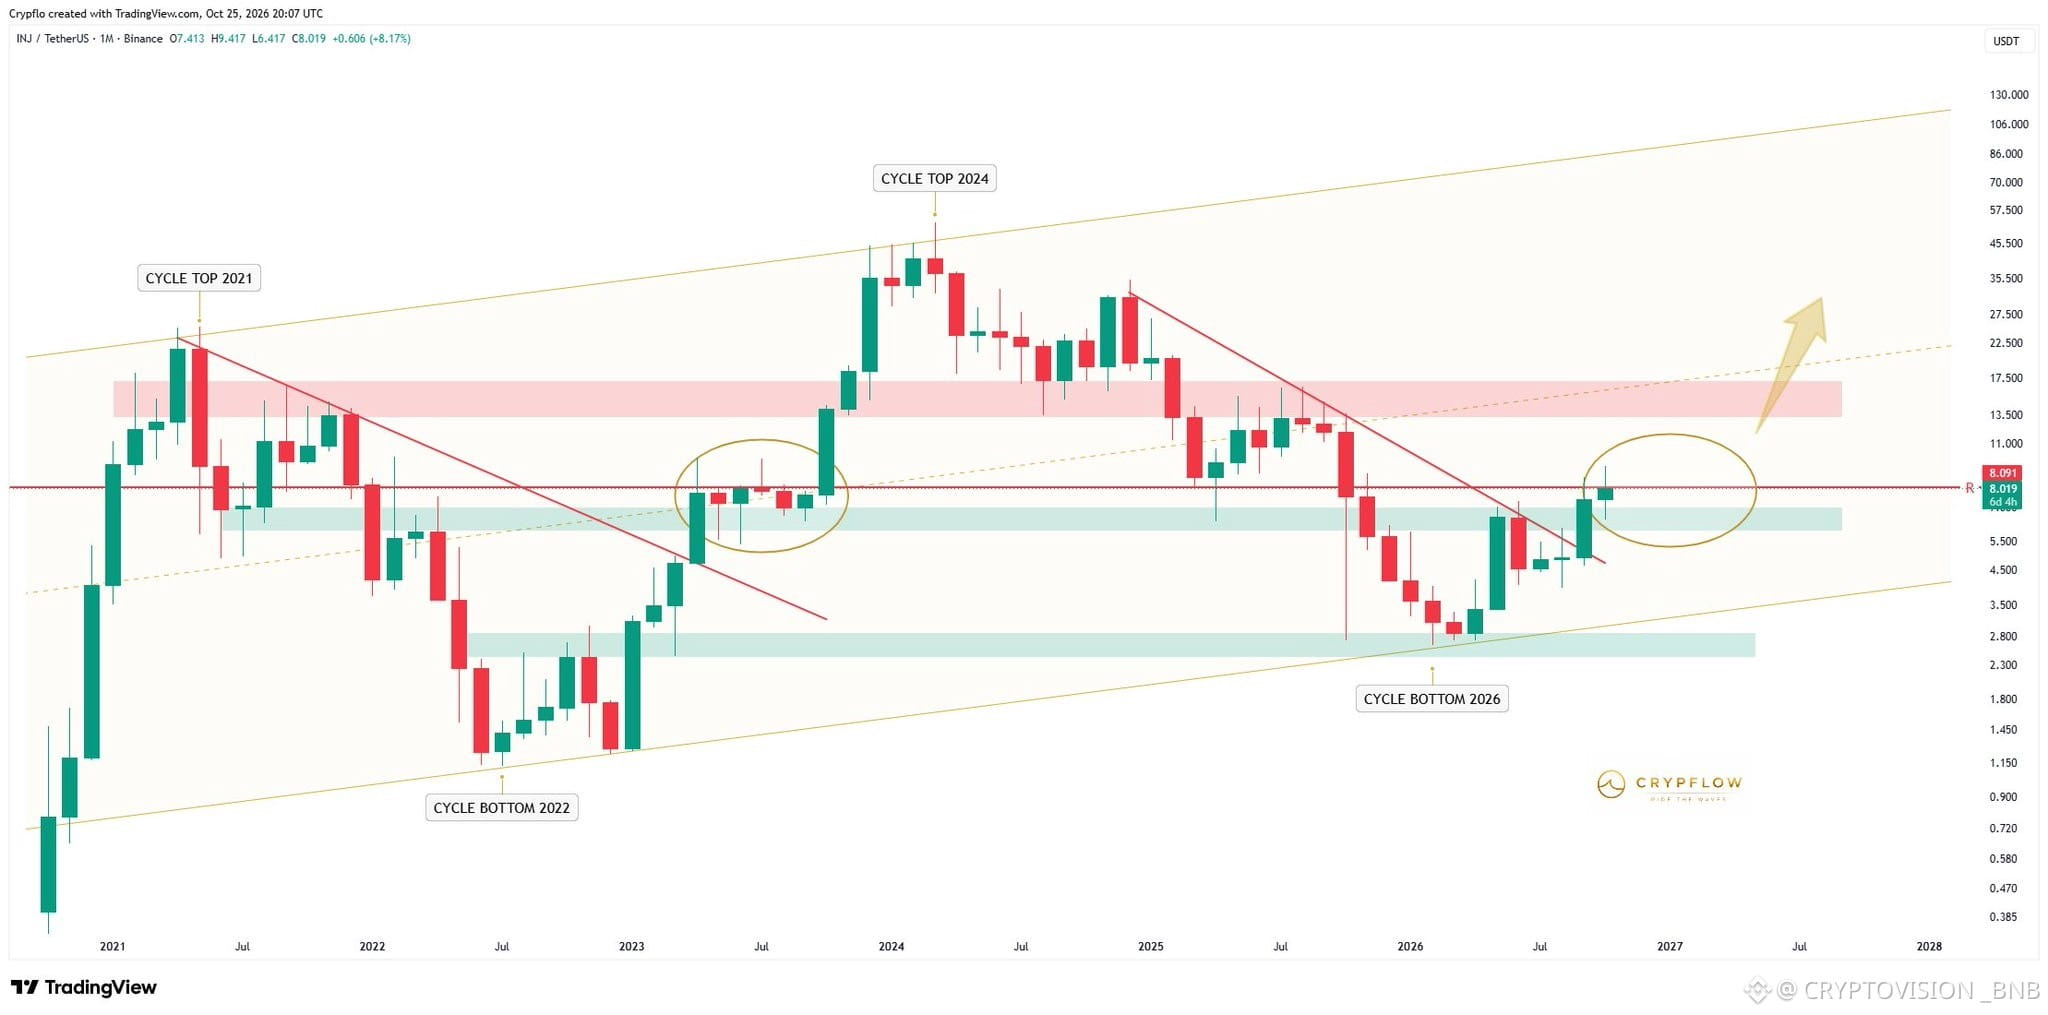
$INJ (1M) – Still reflecting the previous cycle.
INJ is currently struggling with the $8 resistance zone.
In the last cycle, the price spent around 6 months battling in this same area before finally breaking through.
What came next was a run to $52.
So if INJ gets boring here for a while, don't mistake it for weakness.
Sometimes the market just needs time to build pressure.
Break $8 and the next stage begins.
First area I'm watching after that: $13–$16.
$INJ
{spot}(INJUSDT)
$INJ (1M) – Still reflecting the previous cycle.
INJ is currently struggling with the $8 resistance zone.
In the last cycle, the price spent around 6 months battling in this same area before finally breaking through.
What came next was a run to $52.
So if INJ gets boring here for a while, don't mistake it for weakness.
Sometimes the market just needs time to build pressure.
Break $8 and the next stage begins.
First area I'm watching after that: $13–$16.
$INJ
1
204
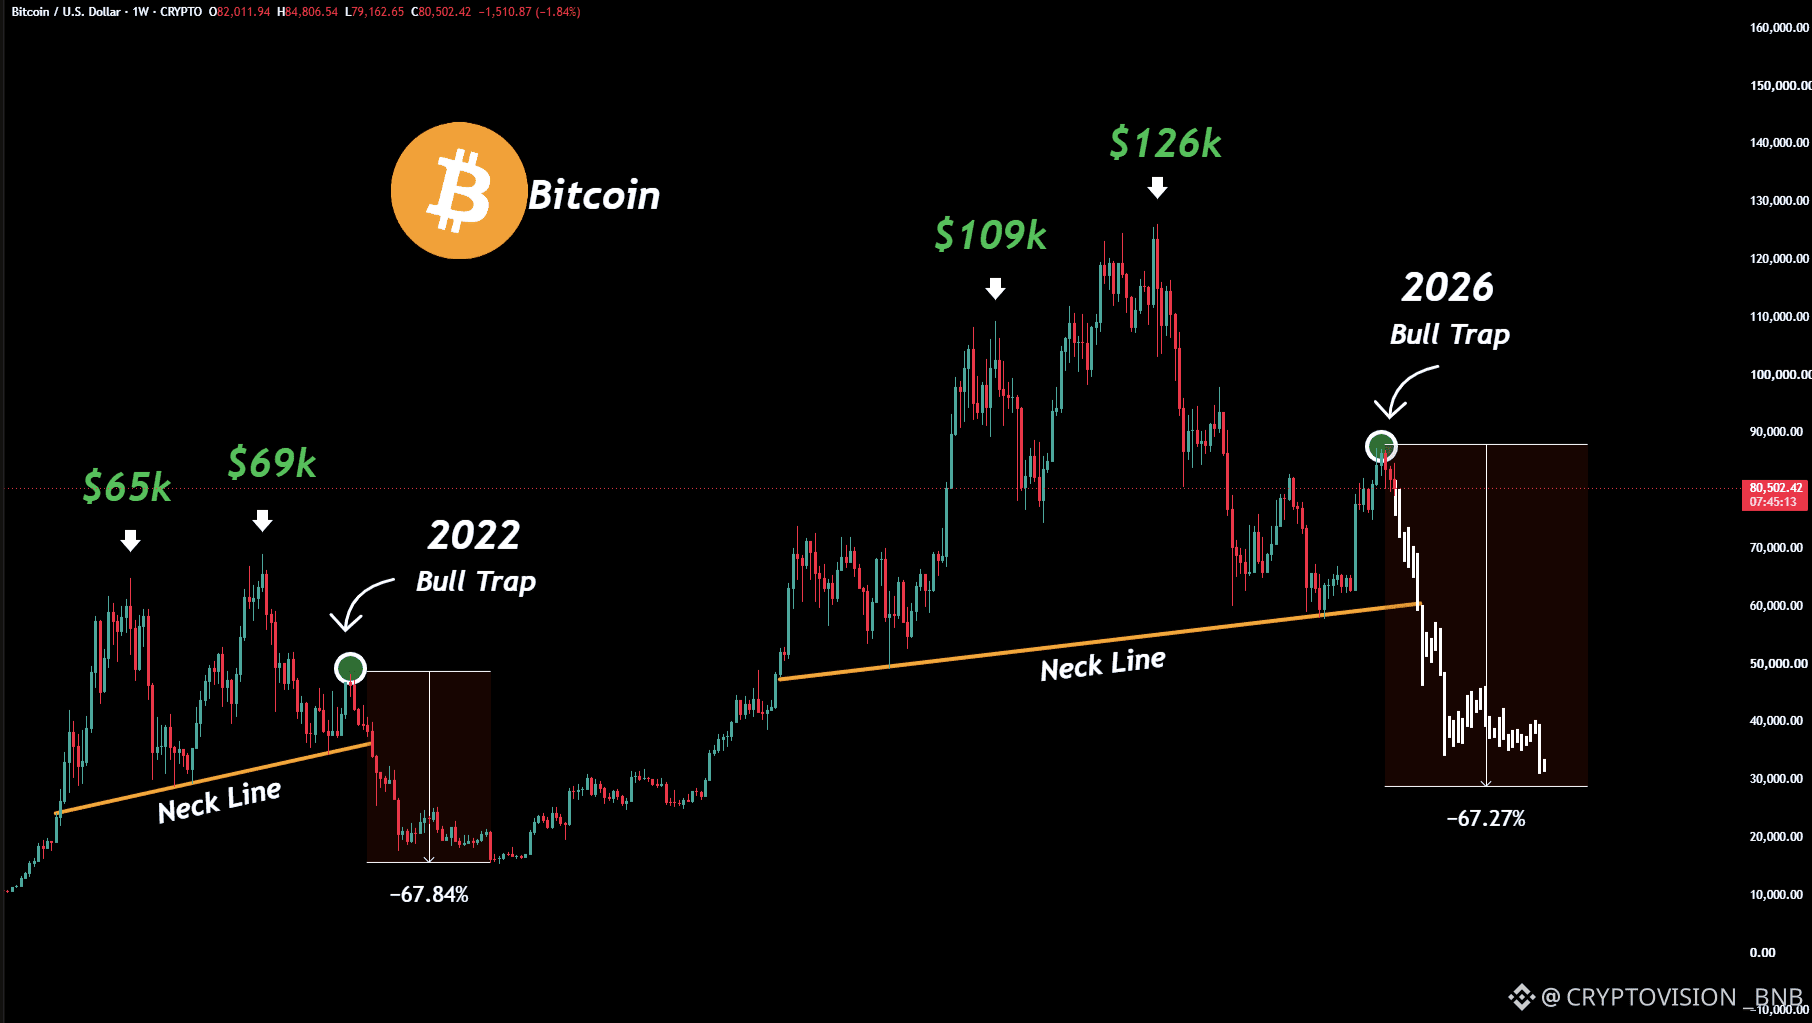
$BTC: Is the 2022 pattern repeating?
Some are comparing Bitcoin’s current behavior with the 2022 crash. If the pattern were to repeat, the path would look like this:
$80,000 → $67,000 → $40,000 → $30,000
This is a historical comparison scenario, not a certainty. Past patterns don’t guarantee that the price will repeat them. If BTC recovers key levels instead of continuing to fall, the comparison loses strength.
What do you think: is the pattern repeating, or is this time different?
$BTC
{spot}(BTCUSDT)
$BTC : Is the 2022 pattern repeating?
Some are comparing Bitcoin’s current behavior with the 2022 crash. If the pattern were to repeat, the path would look like this:
$80,000 → $67,000 → $40,000 → $30,000
This is a historical comparison scenario, not a certainty. Past patterns don’t guarantee that the price will repeat them. If BTC recovers key levels instead of continuing to fall, the comparison loses strength.
What do you think: is the pattern repeating, or is this time different?
$BTC
219
·
--
Bullish
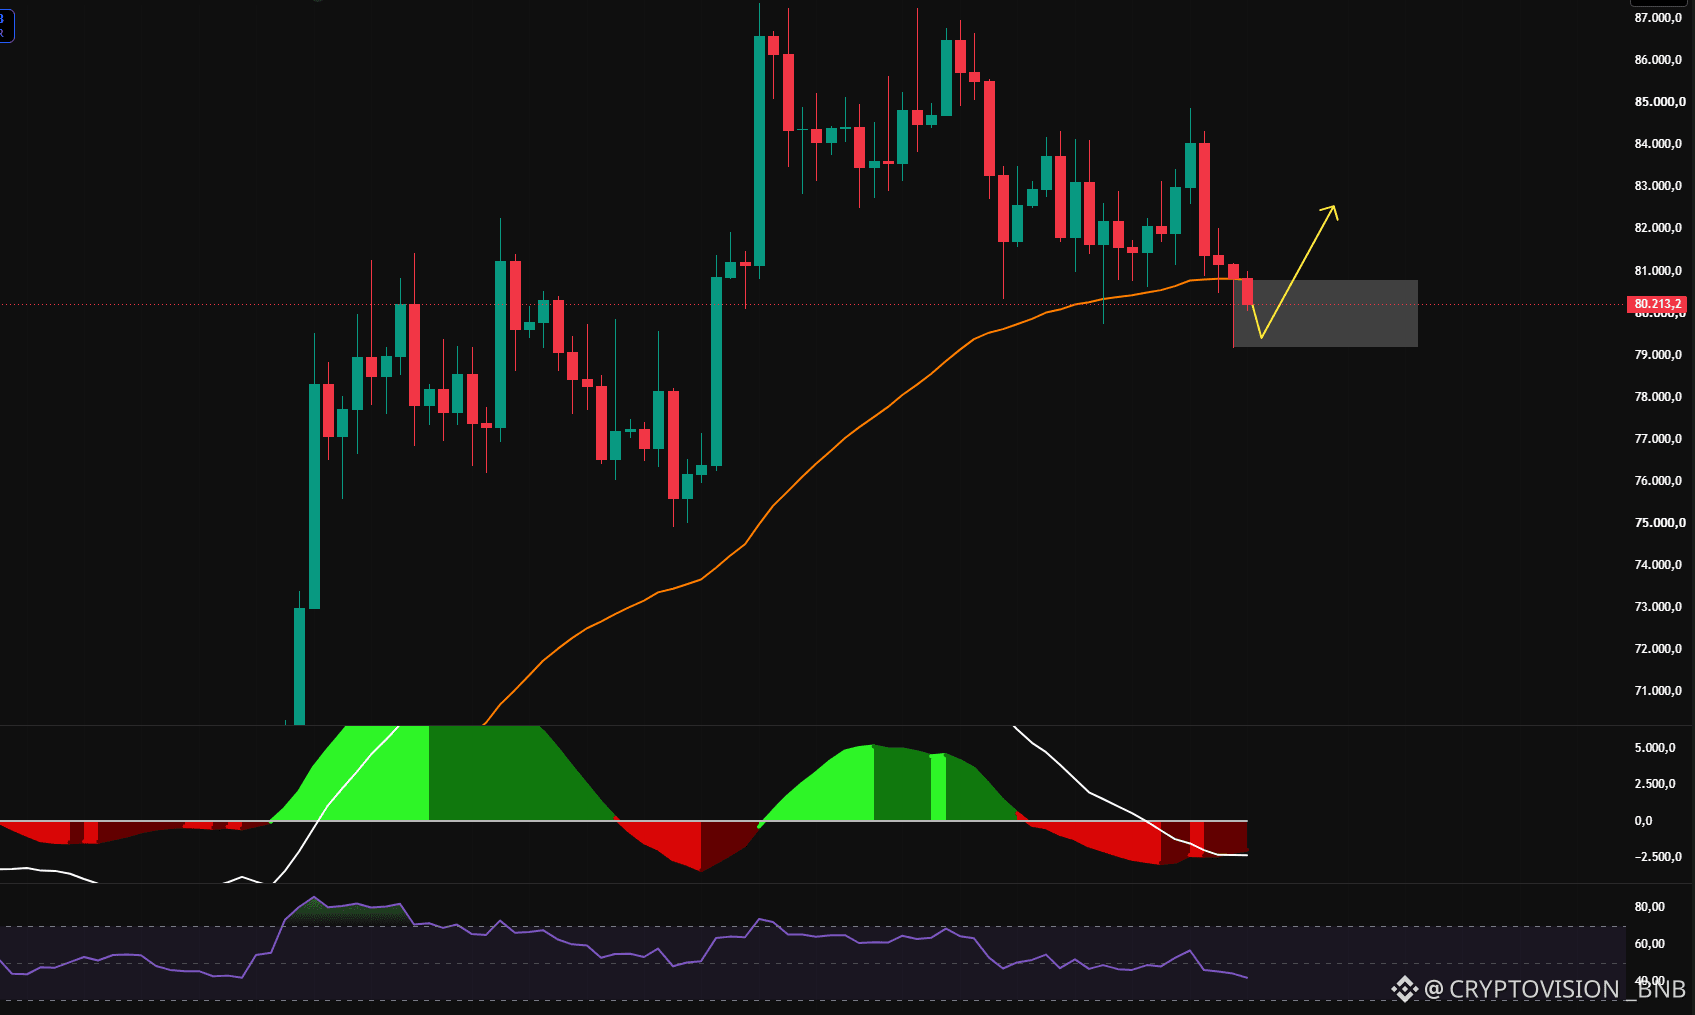
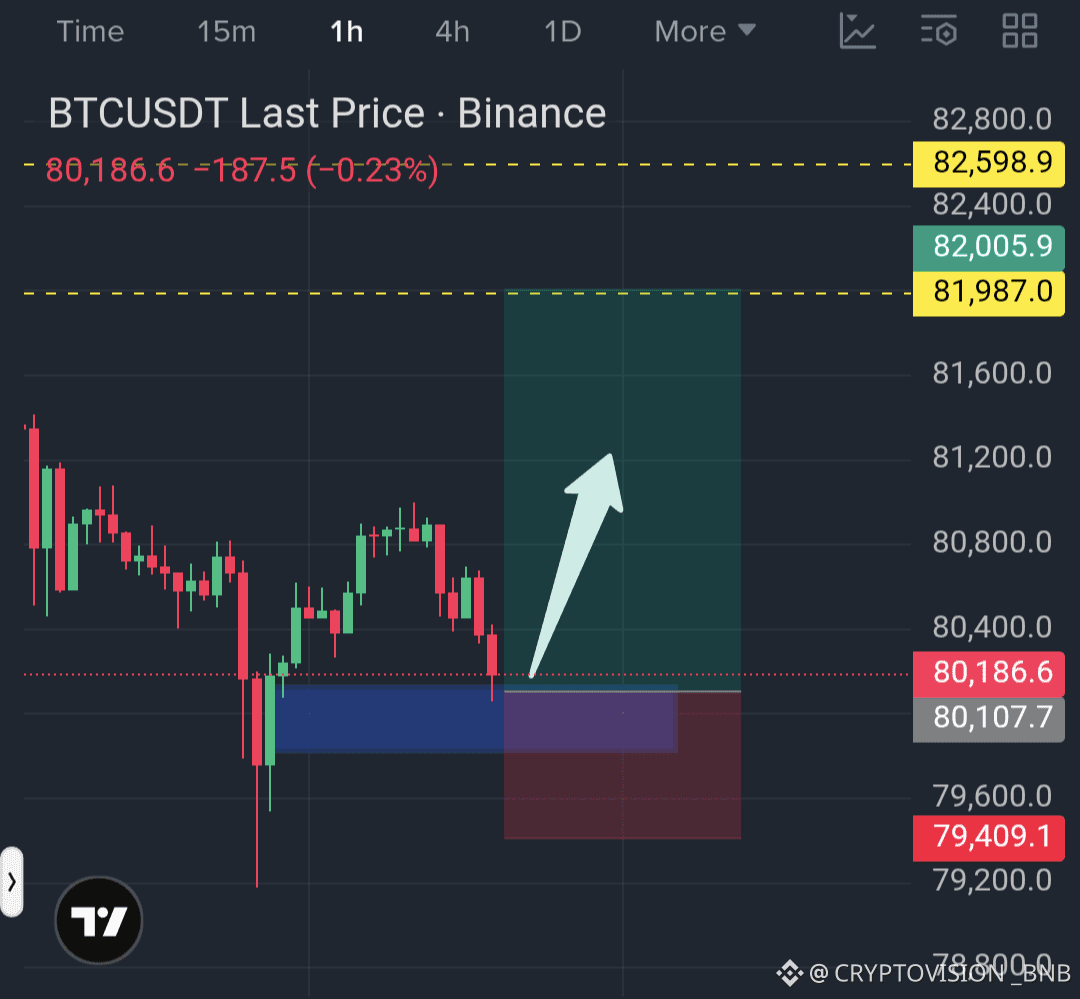
$BTC: reaction off an important order block, a zone I was waiting for. What interests me most is the buying pressure I’m seeing here: buyers are stepping in instead of letting the price fall without resistance.
Long
Entry: ~80.503
Target: 81.987
Stop: 79.409
With Monday’s open approaching, there could be upward momentum if support continues to hold. I’d rather enter in the zone than chase the price once it’s already rising. If it loses 79.409, the idea is invalidated.
$BTC
{spot}(BTCUSDT)
$BTC : reaction off an important order block, a zone I was waiting for. What interests me most is the buying pressure I’m seeing here: buyers are stepping in instead of letting the price fall without resistance.
Long
Entry: ~80.503
Target: 81.987
Stop: 79.409
With Monday’s open approaching, there could be upward momentum if support continues to hold. I’d rather enter in the zone than chase the price once it’s already rising. If it loses 79.409, the idea is invalidated.
$BTC
Long
Entry: ~80.503
Target: 81.987
Stop: 79.409
With Monday’s open approaching, there could be upward momentum if support continues to hold. I’d rather enter in the zone than chase the price once it’s already rising. If it loses 79.409, the idea is invalidated.
$BTC
1
137
·
--
Bearish
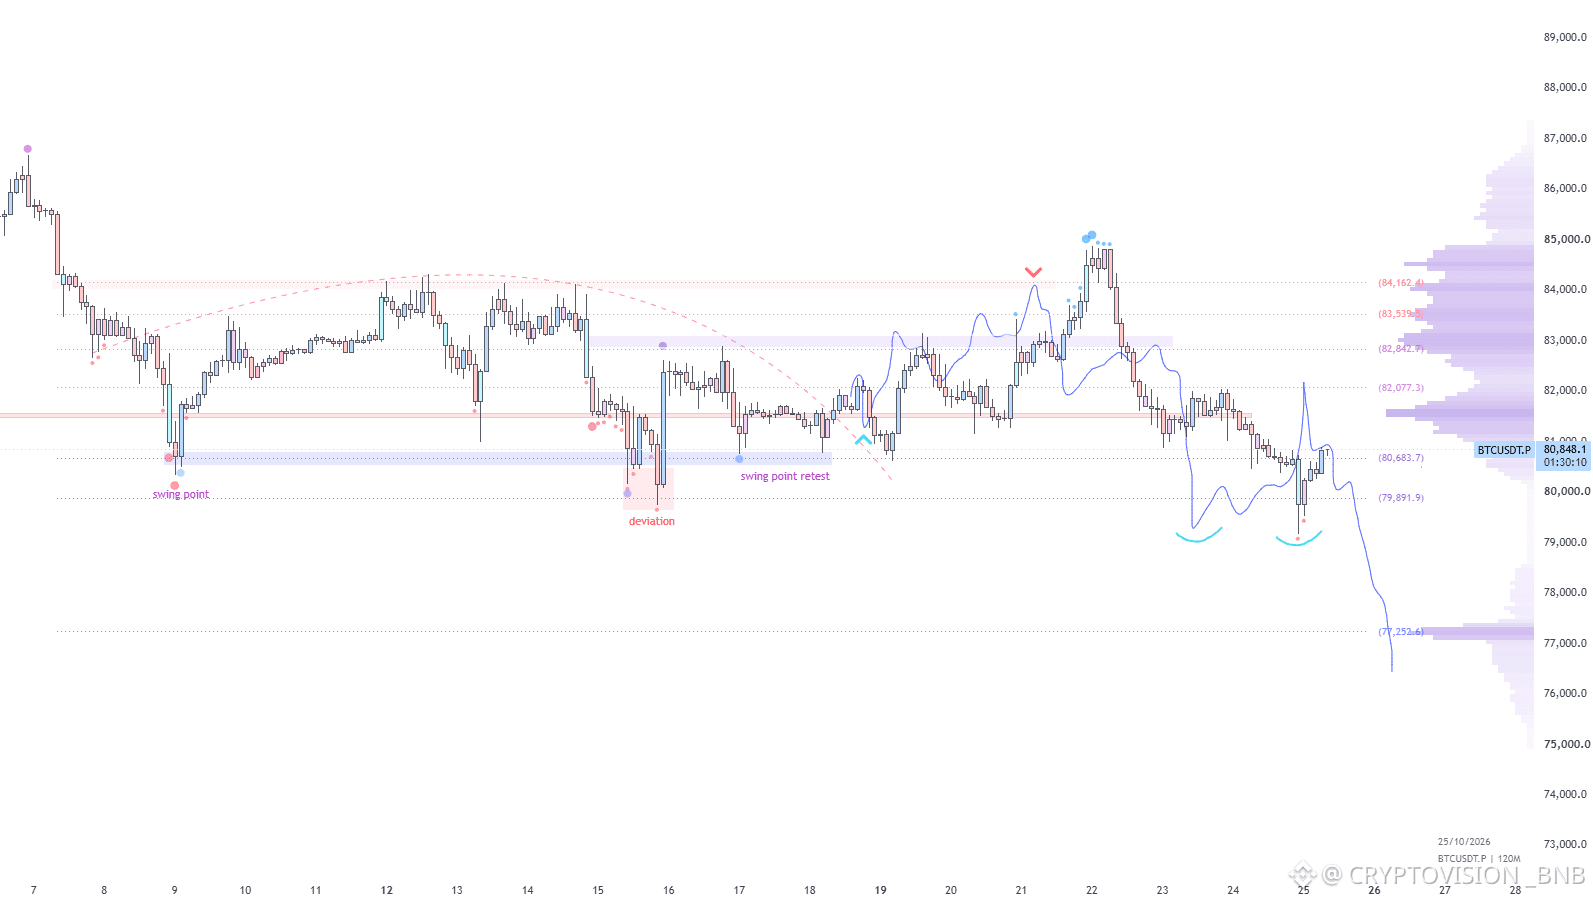
$BTC: back above its 2-year moving average
$BTC moved back above its 2-year moving average after spending some time below it.
Historically, these zones start to look interesting on a higher time frame. The key question is how long the price stays below that level, and this time it wasn't long: it went from $63K to $87K in about 3 months.
In the short term, the trade I'm watching is a tactical short:
Entry: 80,800–81,700
Targets: 80,000 / 79,400
Stop: 82,000
If the price moves above 82,000, the idea is invalidated. The entry range is wide, so adjust your position size depending on where you enter.
$BTC
{spot}(BTCUSDT)
$BTC : back above its 2-year moving average
$BTC moved back above its 2-year moving average after spending some time below it.
Historically, these zones start to look interesting on a higher time frame. The key question is how long the price stays below that level, and this time it wasn't long: it went from $63K to $87K in about 3 months.
In the short term, the trade I'm watching is a tactical short:
Entry: 80,800–81,700
Targets: 80,000 / 79,400
Stop: 82,000
If the price moves above 82,000, the idea is invalidated. The entry range is wide, so adjust your position size depending on where you enter.
$BTC
1
219
·
--
Bearish
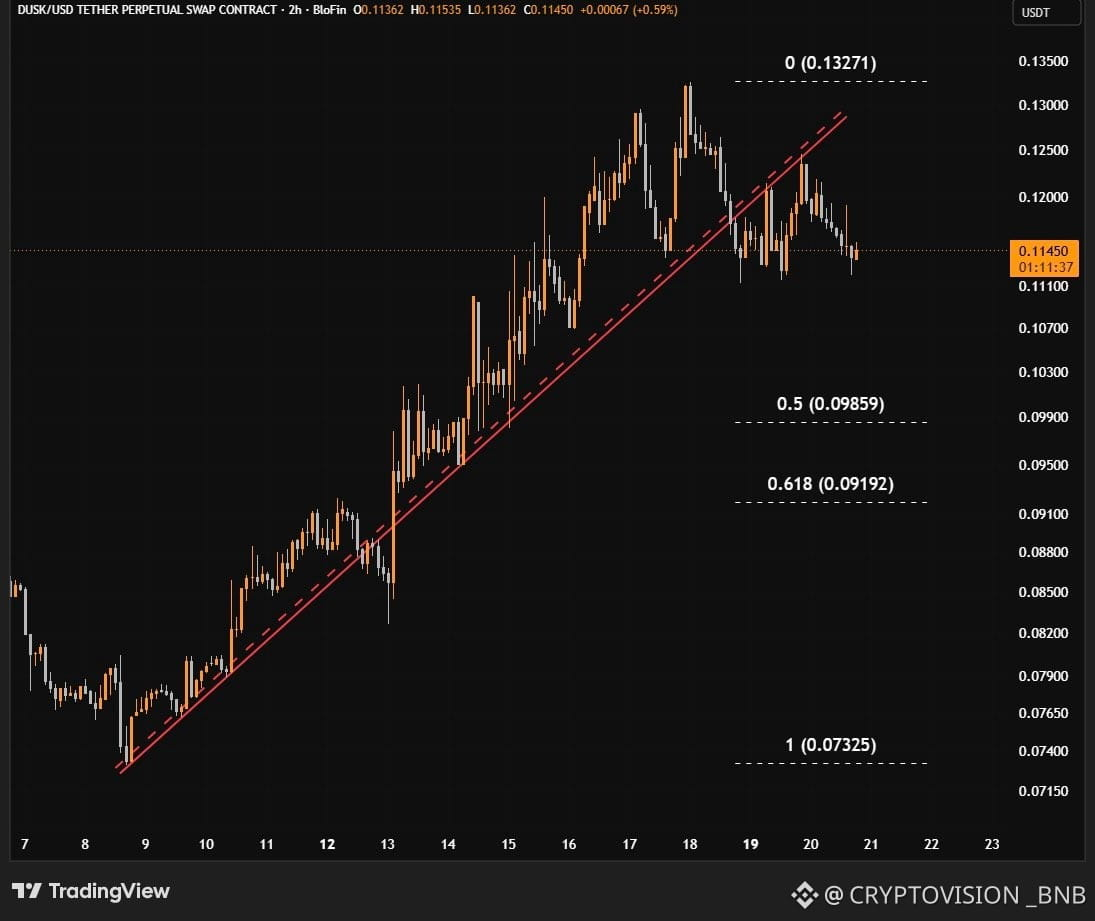
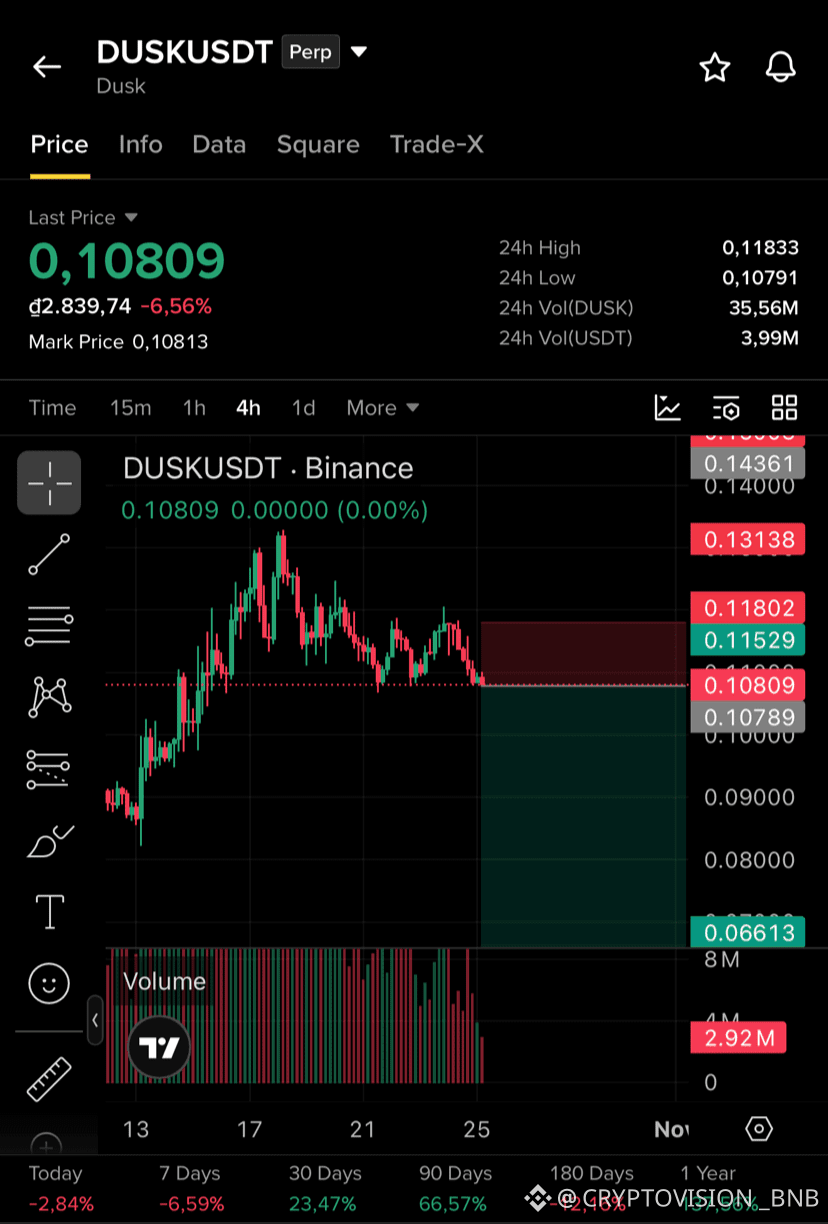
$DUSK shows renewed selling pressure after falling more than 6% in the last 24 hours. On the 4H chart, it pulled back from its recent high near $0.13 and continues to form lower highs.
Short
Entry: 0.1080 - 0.1100
Targets: 0.1030 / 0.0950 / 0.0850
Stop: 0.1180
Sellers are pushing the price toward support at 0.108. A confirmed breakdown could open the door to another leg down. If the price rises above 0.1180, the setup is invalidated.
$DUSK
{spot}(DUSKUSDT)
$DUSK shows renewed selling pressure after falling more than 6% in the last 24 hours. On the 4H chart, it pulled back from its recent high near $0.13 and continues to form lower highs.
Short
Entry: 0.1080 - 0.1100
Targets: 0.1030 / 0.0950 / 0.0850
Stop: 0.1180
Sellers are pushing the price toward support at 0.108. A confirmed breakdown could open the door to another leg down. If the price rises above 0.1180, the setup is invalidated.
$DUSK
Short
Entry: 0.1080 - 0.1100
Targets: 0.1030 / 0.0950 / 0.0850
Stop: 0.1180
Sellers are pushing the price toward support at 0.108. A confirmed breakdown could open the door to another leg down. If the price rises above 0.1180, the setup is invalidated.
$DUSK
141
Log in to explore more content
Join global crypto users on Binance Square
⚡️ Get latest and useful information about crypto.
💬 Trusted by the world’s largest crypto exchange.
👍 Discover real insights from verified creators.
Email / Phone number
Trending Topics
UniswapA16zSeekDeFiExemptionFromIllinoisCryptoTax
8,684 views
425 Discussing
#uniswapa16zseekdefiexemptionfromillinoiscryptotax
⚖️ TAX BATTLE CHALLENGE: UNISWAP AND A16Z OPPOSE ILLINOIS’ TAX!
The fight: Uniswap Labs and a16z are pushing for a total DeFi exemption from Illinois’ cryptocurrency tax.
The law: The state’s Digital Assets Tax Act targets cryptocurrency transfers with a controversial 0.2% tax per transaction.
The problem: Smart contracts have no central intermediaries, making compliance nearly impossible and threatening local Web3 innovation.
The stakes: Industry groups are actively lobbying and fighting the law in court to block it before it takes effect.
💬 YOUR TURN: Will state-level taxes drive crypto developers away? Share your thoughts! 👇
“CLICK THE YELLOW COIN TAG BELOW TO ACCESS THE TRADING PAGE YOU WANT AND ENJOY TRADING”
$IDOL
$BIRB
$BEAMX
Jacob trade
·1 Likes
·538 views
HKDollarStablecoinHKDAPToLaunchOnSolana
5,022 views
242 Discussing
$1.5BInLeveragedCryptoBetsLiquidated
19,764 views
197 Discussing