
cRyPtO sMaRt Team
521 Posts

cRyPtO sMaRt Team
Report
Block User
Your ultimate gateway to mastering the world of cryptocurrency trading. Deep insights into market psychology, proven strategies, and disciplined risk management
Open Trade
Frequent Trader
4.6 Years
67 Following
24 Followers
18 Liked
Posts
Portfolio
All
Videos
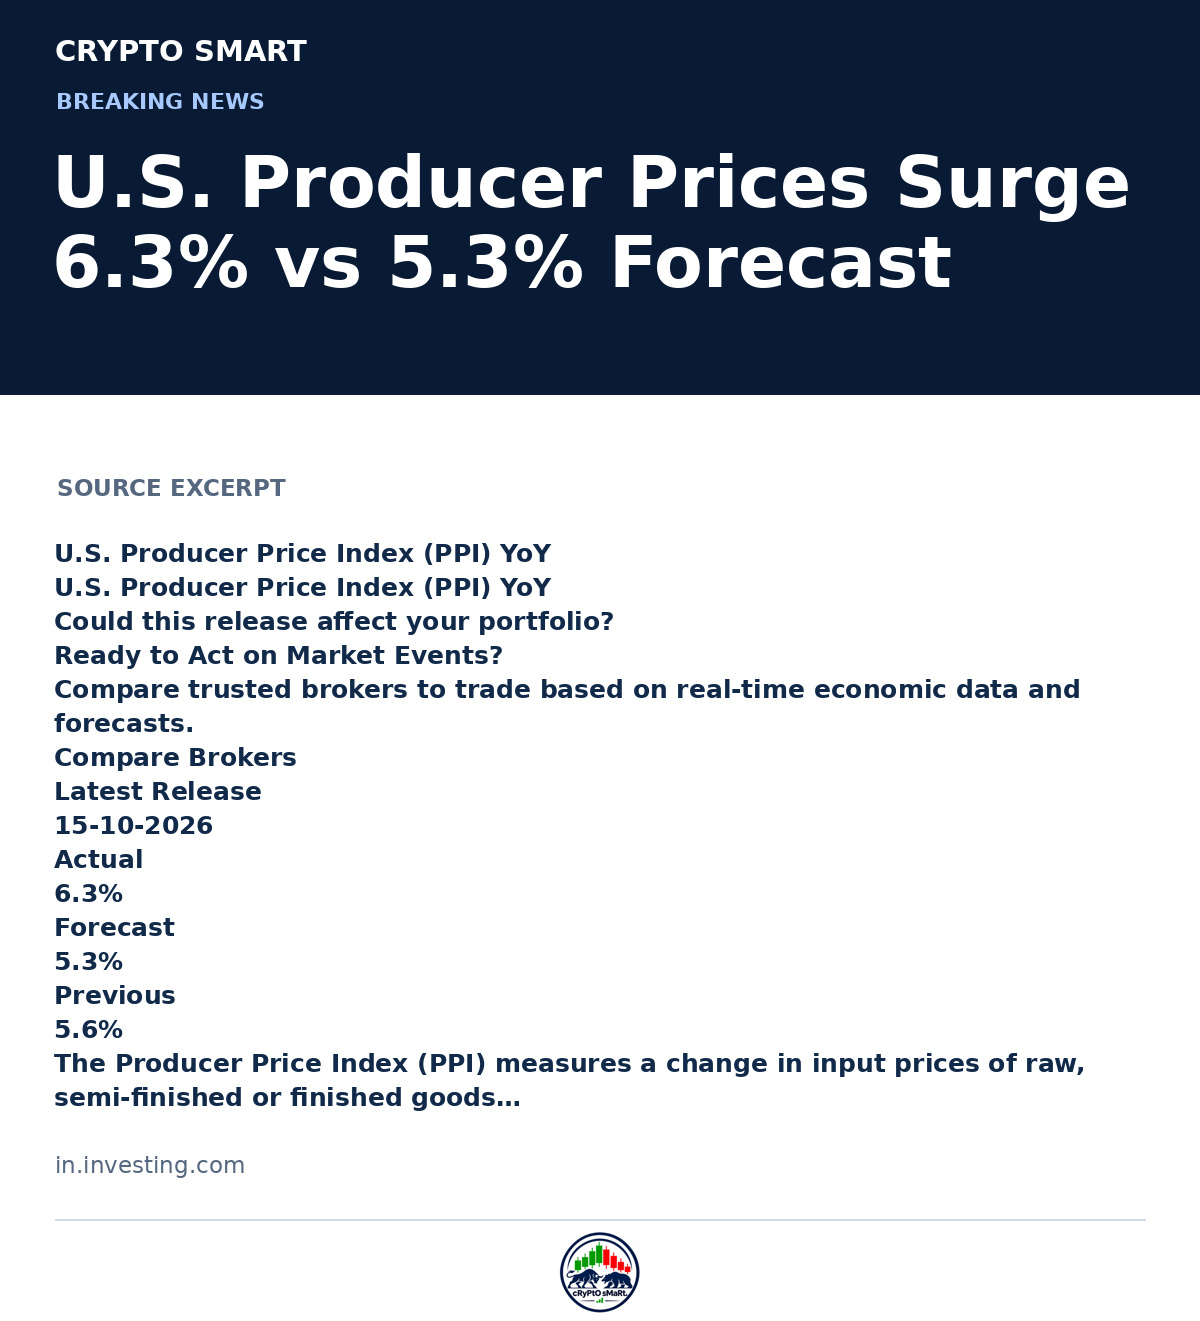
September’s U.S. Producer Price Index (PPI) reading came in at 6.3% year-over-year, significantly beating the 5.3% forecast and rising from August’s 5.6%. The PPI gauges shifts in input prices for raw materials, semi-finished, and finished goods and services. When input costs increase, producers may pass some costs onto consumers or absorb them, impacting inflation trends. This sharp rise draws attention from central bankers focused on price stability and traders tracking inflation signals. The U.S. dollar generally gains when PPI outperforms estimates, reflecting expectations of tighter monetary policy. In a small related note, a trader once joked, “If PPI climbs any higher, my coffee costs may start to chart!” This monthly economic pulse continues to be a vital signpost for markets and portfolios alike. $USD
https://in.investing.com/economic-calendar/ppi-734
September’s U.S. Producer Price Index (PPI) reading came in at 6.3% year-over-year, significantly beating the 5.3% forecast and rising from August’s 5.6%. The PPI gauges shifts in input prices for raw materials, semi-finished, and finished goods and services. When input costs increase, producers may pass some costs onto consumers or absorb them, impacting inflation trends. This sharp rise draws attention from central bankers focused on price stability and traders tracking inflation signals. The U.S. dollar generally gains when PPI outperforms estimates, reflecting expectations of tighter monetary policy. In a small related note, a trader once joked, “If PPI climbs any higher, my coffee costs may start to chart!” This monthly economic pulse continues to be a vital signpost for markets and portfolios alike. $USD
https://in.investing.com/economic-calendar/ppi-734
https://in.investing.com/economic-calendar/ppi-734
52
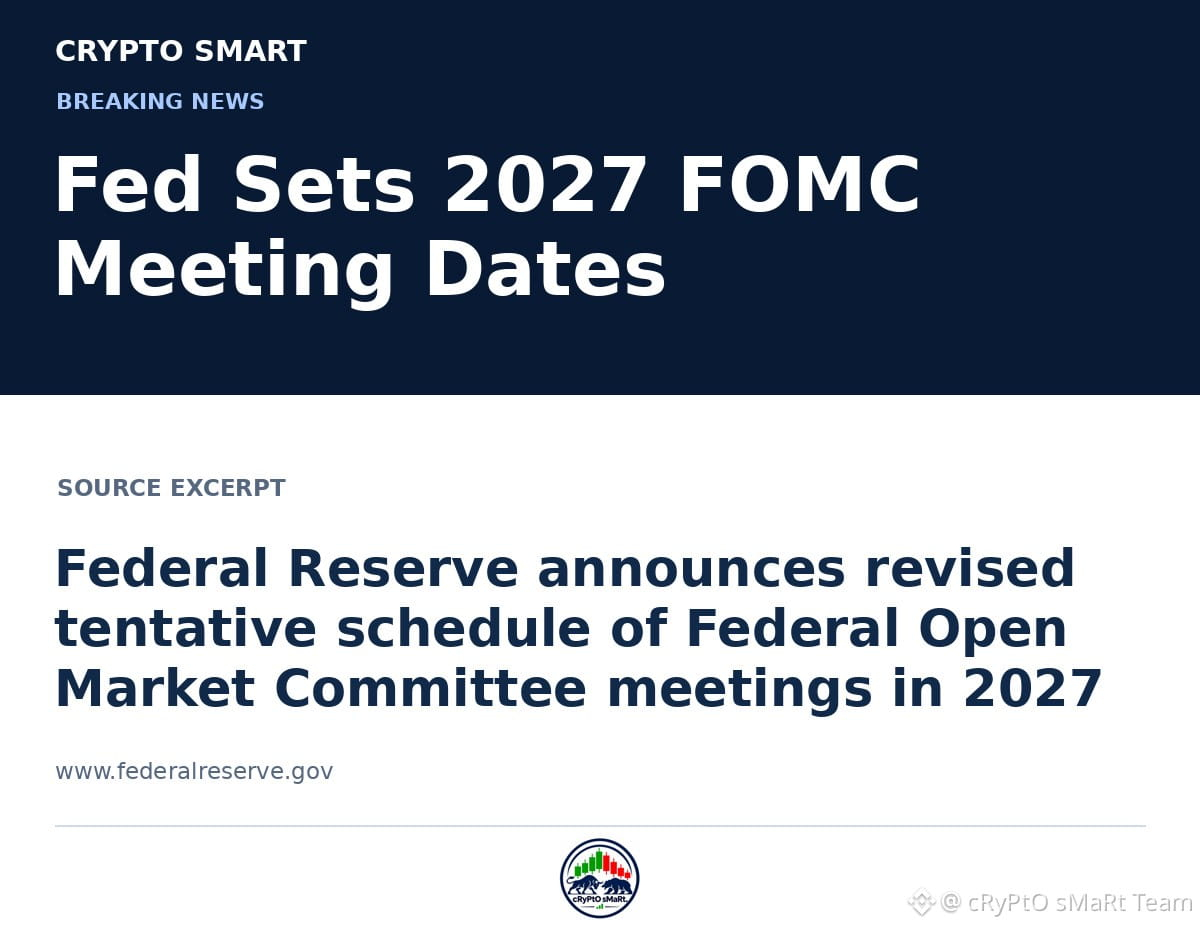
The Federal Reserve unveiled its revised tentative calendar for the Federal Open Market Committee (FOMC) meetings in 2027. These meetings are crucial for shaping monetary policy, including interest rate decisions that can ripple through global financial and crypto markets. The schedule offers transparency to investors and institutions planning ahead for policy updates that may affect assets like $BTC and $ETH. Traders and market watchers keep an eye on FOMC meetings for potential shifts in economic outlook and liquidity conditions.
https://www.federalreserve.gov/newsevents/pressreleases/monetary20261112a.htm
The Federal Reserve unveiled its revised tentative calendar for the Federal Open Market Committee (FOMC) meetings in 2027. These meetings are crucial for shaping monetary policy, including interest rate decisions that can ripple through global financial and crypto markets. The schedule offers transparency to investors and institutions planning ahead for policy updates that may affect assets like $BTC and $ETH . Traders and market watchers keep an eye on FOMC meetings for potential shifts in economic outlook and liquidity conditions.
https://www.federalreserve.gov/newsevents/pressreleases/monetary20261112a.htm
https://www.federalreserve.gov/newsevents/pressreleases/monetary20261112a.htm
83
Traders worldwide share a universal habit: the indecisive double-check. In this visual joke, a trader on a bright screen-filled desk moves the mouse to execute a buy, pauses, pulls back, then clicks once more with a sheepish grin. This moment, as familiar to crypto traders as charts and candlesticks, captures the ‘just one more look’ ritual before action. It’s a gentle reminder that even pros wrestle with the fear of jumping too soon or too late.
Traders worldwide share a universal habit: the indecisive double-check. In this visual joke, a trader on a bright screen-filled desk moves the mouse to execute a buy, pauses, pulls back, then clicks once more with a sheepish grin. This moment, as familiar to crypto traders as charts and candlesticks, captures the ‘just one more look’ ritual before action. It’s a gentle reminder that even pros wrestle with the fear of jumping too soon or too late.

52
$PUMP · Setup expired
12 Nov, 15:30 IST
The tracking window ended before either level traded. Setup closed.
Original setup: https://app.binance.com/uni-qr/cpos/387370594978724?r=YVIYFLT1&l=en-IN
$PUMP · Setup expired
12 Nov, 15:30 IST
The tracking window ended before either level traded. Setup closed.
Original setup: https://app.binance.com/uni-qr/cpos/387370594978724?r=YVIYFLT1&l=en-IN
12 Nov, 15:30 IST
The tracking window ended before either level traded. Setup closed.
Original setup: https://app.binance.com/uni-qr/cpos/387370594978724?r=YVIYFLT1&l=en-IN
347
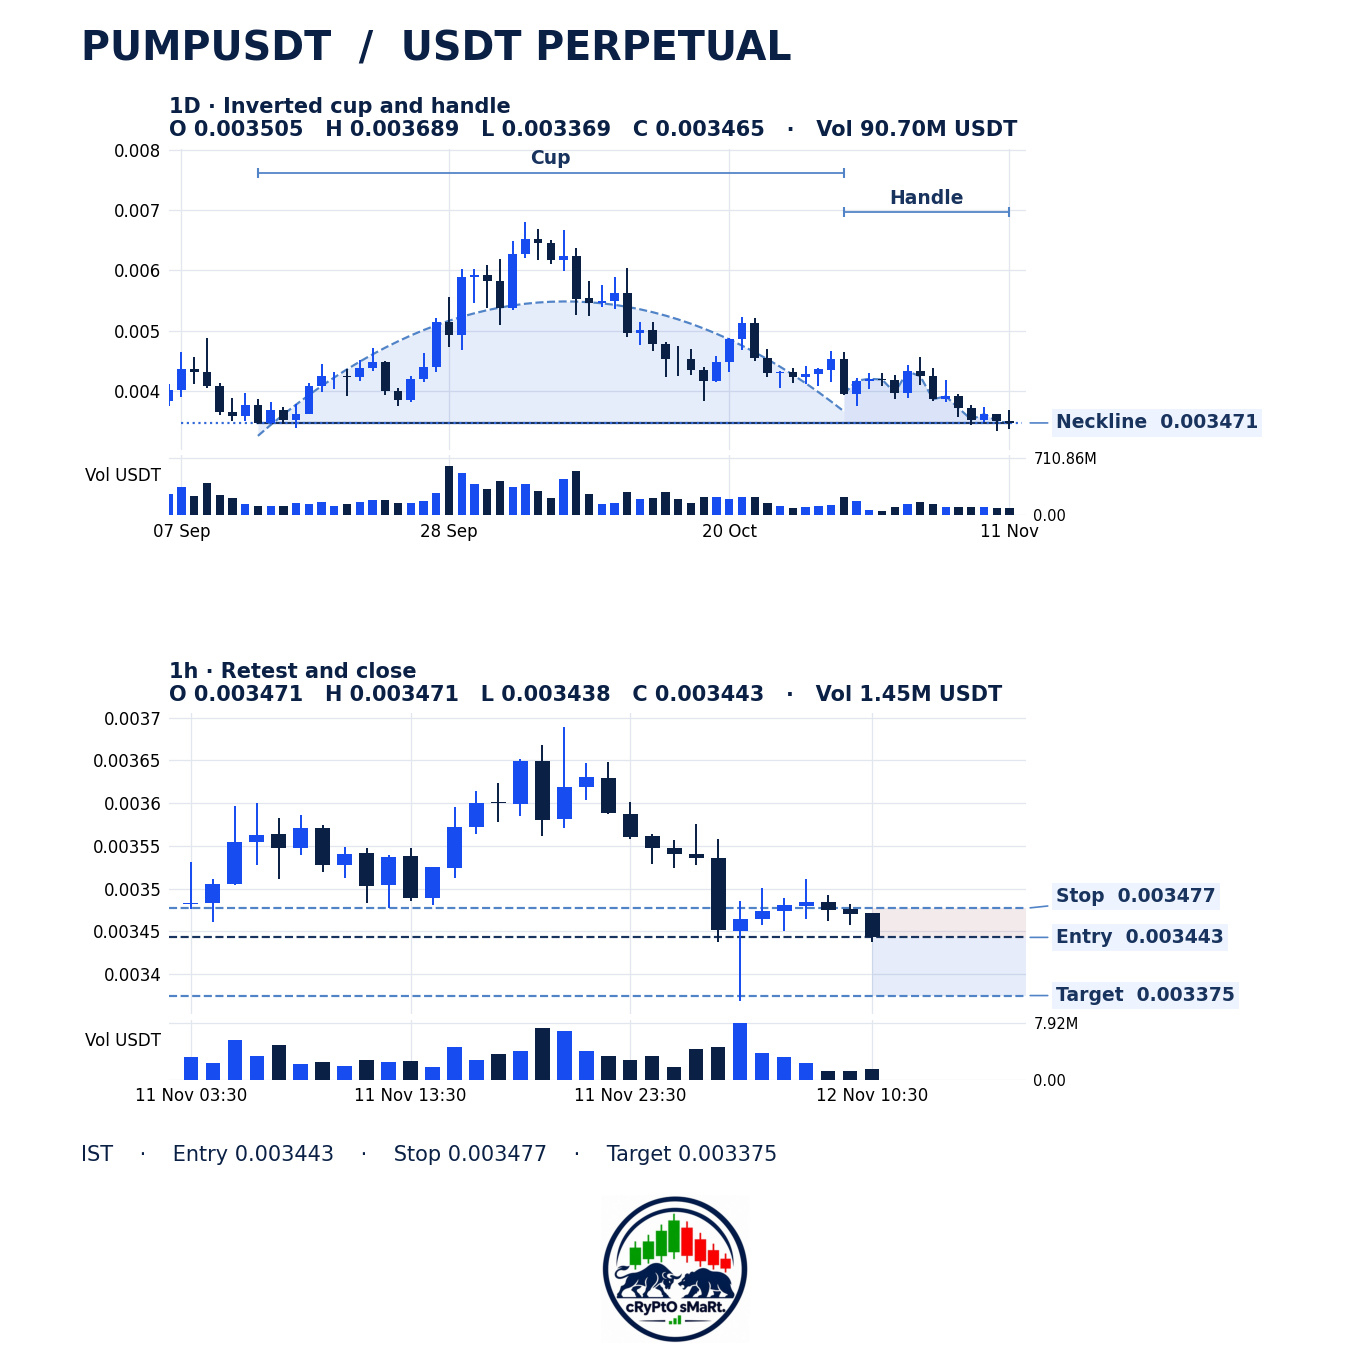
$PUMP · SHORT · USDT Perpetual
Entry 0.003443
Stop 0.003477
Target 0.003375
Price tested 0.003471 and fell back below it. The hourly candle closed at 0.003443.
Daily setup · Inverted cup and handle
12 Nov, 11:30 IST · Crypto Smart
$PUMP · SHORT · USDT Perpetual
Entry 0.003443
Stop 0.003477
Target 0.003375
Price tested 0.003471 and fell back below it. The hourly candle closed at 0.003443.
Daily setup · Inverted cup and handle
12 Nov, 11:30 IST · Crypto Smart
Entry 0.003443
Stop 0.003477
Target 0.003375
Price tested 0.003471 and fell back below it. The hourly candle closed at 0.003443.
Daily setup · Inverted cup and handle
12 Nov, 11:30 IST · Crypto Smart
211
A trader stares at multiple glowing screens well past midnight, eyes wide and coffee forgotten. Behind him, a cozy bed invites rest, but his cursor hovers over the ‘Buy’ button. This universal moment—it’s the silent battle every trader faces: closing the laptop and resisting ‘just one more trade.’ Like a digital moth circling the screen’s glow, it’s the hardest exit.
A trader stares at multiple glowing screens well past midnight, eyes wide and coffee forgotten. Behind him, a cozy bed invites rest, but his cursor hovers over the ‘Buy’ button. This universal moment—it’s the silent battle every trader faces: closing the laptop and resisting ‘just one more trade.’ Like a digital moth circling the screen’s glow, it’s the hardest exit.

50
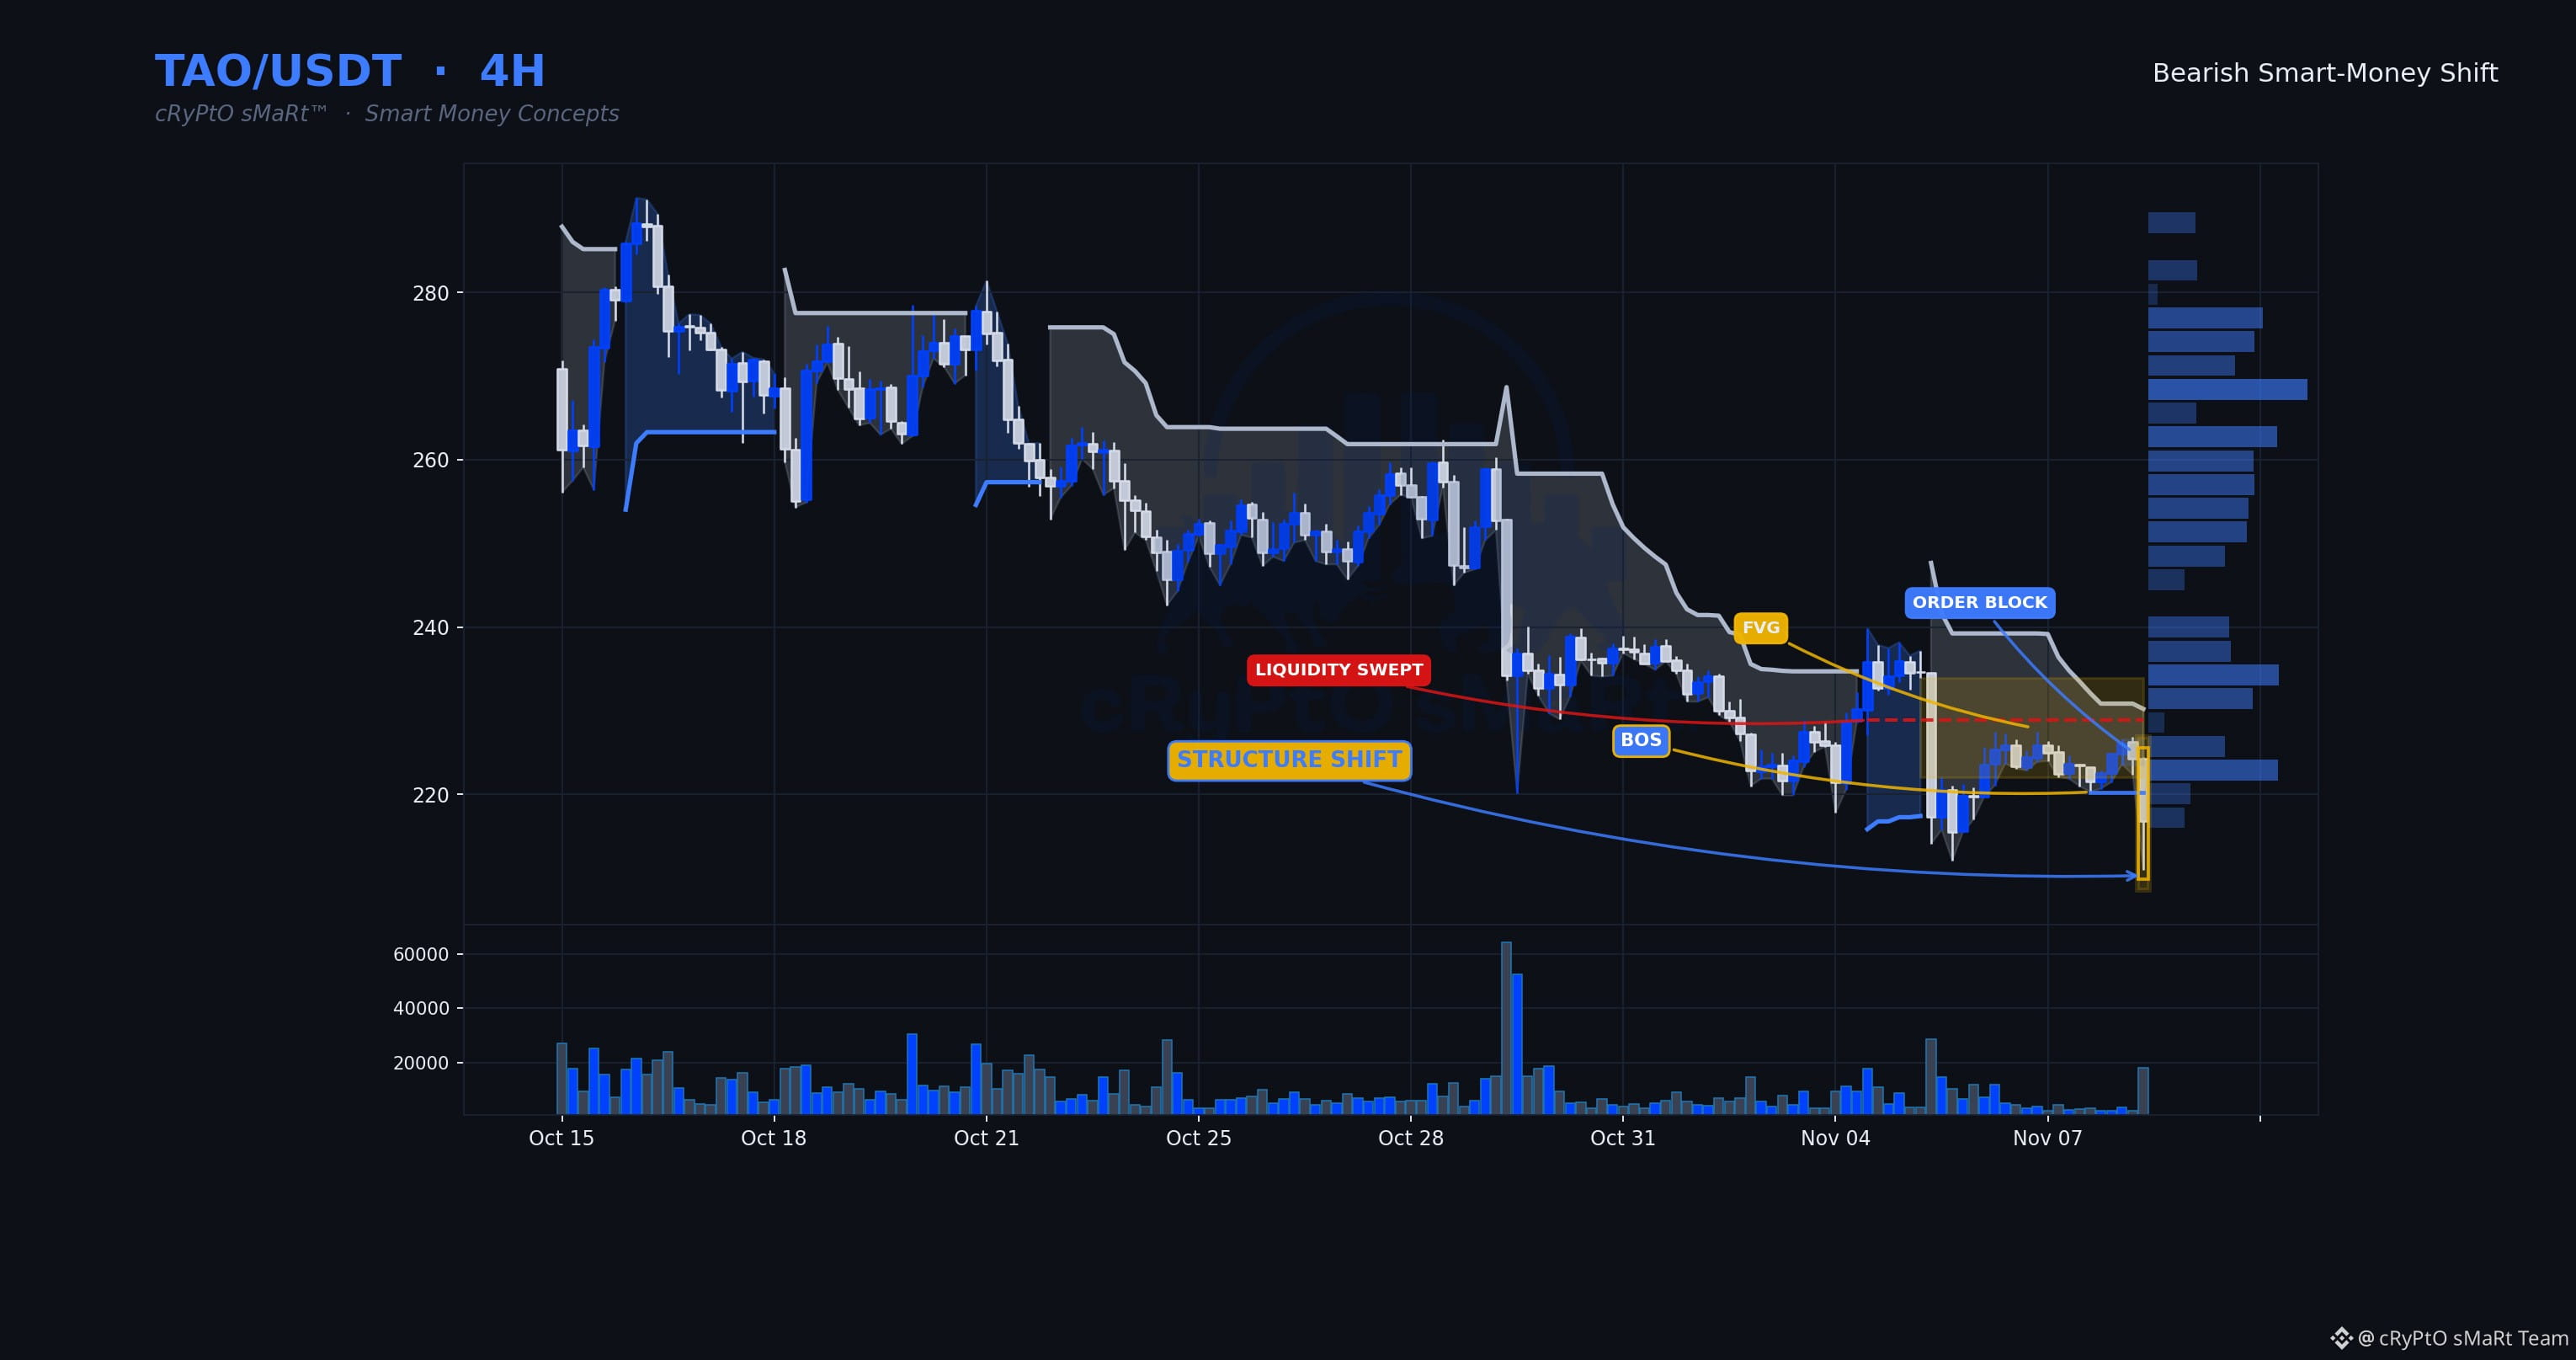
Sellers swept the highs to tag resting liquidity, then drove straight through structure on the downside with real displacement behind it. That's not a wick-and-reject — volume well above average confirms sellers showed up with conviction, not just a stop-run that fizzles.
🗓 Daily: Bearish — daily Supertrend down, price under the 50 EMA
⏱ 4H: Smart-Money Shift · Bearish bias
⏳ 1H: the 1H is trading below the level with its trend down — the lower timeframe confirms the setup.
✅ Daily, 4H and 1H all point bearish.
📋 WHY IT QUALIFIES
✓ Smart-Money Shift structure completed
🧭 Bias: Bearish while price holds below $220.3000
⚠️ Invalidation: 4H close back above $220.3000
🔵 Support $220.3000 🟡 Resistance $228.9000
$TAO $BTC #SmartMoney
Education only, not financial advice.
Sellers swept the highs to tag resting liquidity, then drove straight through structure on the downside with real displacement behind it. That's not a wick-and-reject — volume well above average confirms sellers showed up with conviction, not just a stop-run that fizzles.
🗓 Daily: Bearish — daily Supertrend down, price under the 50 EMA
⏱ 4H: Smart-Money Shift · Bearish bias
⏳ 1H: the 1H is trading below the level with its trend down — the lower timeframe confirms the setup.
✅ Daily, 4H and 1H all point bearish.
📋 WHY IT QUALIFIES
✓ Smart-Money Shift structure completed
🧭 Bias: Bearish while price holds below $220.3000
⚠️ Invalidation: 4H close back above $220.3000
🔵 Support $220.3000 🟡 Resistance $228.9000
$TAO $BTC #SmartMoney
Education only, not financial advice.
🗓 Daily: Bearish — daily Supertrend down, price under the 50 EMA
⏱ 4H: Smart-Money Shift · Bearish bias
⏳ 1H: the 1H is trading below the level with its trend down — the lower timeframe confirms the setup.
✅ Daily, 4H and 1H all point bearish.
📋 WHY IT QUALIFIES
✓ Smart-Money Shift structure completed
🧭 Bias: Bearish while price holds below $220.3000
⚠️ Invalidation: 4H close back above $220.3000
🔵 Support $220.3000 🟡 Resistance $228.9000
$TAO $BTC #SmartMoney
Education only, not financial advice.
90
Some weeks the market doesn't test your strategy — it tests your patience, and that's a harder exam to pass. The traders who stay steady are usually the ones who decided their rules before emotions showed up, not during the chaos. Waiting for a setup that actually fits your plan will always beat chasing a feeling of missing out, even when the urge to act feels overwhelming. And protecting capital isn't a defensive move — it's what keeps you in the game long enough to let good decisions compound over time.
What lesson tested you this week, and what did it teach you about your own discipline?
$SOL $XRP $ADA #Crypto #Trading #WeeklyRecap #TA
Follow for daily trading education · Education only, not financial advice.
Some weeks the market doesn't test your strategy — it tests your patience, and that's a harder exam to pass. The traders who stay steady are usually the ones who decided their rules before emotions showed up, not during the chaos. Waiting for a setup that actually fits your plan will always beat chasing a feeling of missing out, even when the urge to act feels overwhelming. And protecting capital isn't a defensive move — it's what keeps you in the game long enough to let good decisions compound over time.
What lesson tested you this week, and what did it teach you about your own discipline?
$SOL $XRP $ADA #Crypto #Trading #WeeklyRecap #TA
Follow for daily trading education · Education only, not financial advice.
What lesson tested you this week, and what did it teach you about your own discipline?
$SOL $XRP $ADA #Crypto #Trading #WeeklyRecap #TA
Follow for daily trading education · Education only, not financial advice.

167
Beginners believe a loss means they made a mistake, and a win means they got it right. That's the myth that quietly wrecks accounts. Markets are probabilistic — a well-reasoned setup can still fail, and a reckless guess can still print profit. Judging yourself by single outcomes trains you to chase randomness and abandon good logic the moment it stings. The fix: keep a simple log of your reasoning before each trade, then review decisions in batches of twenty or more, not one at a time. Process, repeated, is what separates skill from luck. What's one decision you'd grade as "good" even though it lost?
$BTC $ETH $BNB #TradingPsychology #Mindset #Crypto #Trading
Follow for daily trading education · Education only, not financial advice.
Beginners believe a loss means they made a mistake, and a win means they got it right. That's the myth that quietly wrecks accounts. Markets are probabilistic — a well-reasoned setup can still fail, and a reckless guess can still print profit. Judging yourself by single outcomes trains you to chase randomness and abandon good logic the moment it stings. The fix: keep a simple log of your reasoning before each trade, then review decisions in batches of twenty or more, not one at a time. Process, repeated, is what separates skill from luck. What's one decision you'd grade as "good" even though it lost?
$BTC $ETH $BNB #TradingPsychology #Mindset #Crypto #Trading
Follow for daily trading education · Education only, not financial advice.
$BTC $ETH $BNB #TradingPsychology #Mindset #Crypto #Trading
Follow for daily trading education · Education only, not financial advice.

103
Why does one loss suddenly make you question a process that's worked for months?
That's revenge-thinking in disguise. A loss stings, so the brain hunts for someone to blame — the strategy, the setup, the market itself. The cost isn't the loss. It's the rushed, oversized trade right after it, aimed at proving something rather than following the plan.
Next time, build in a pause. Write down what actually happened versus what you felt happened, then check it against your rules before touching another trade.
What's your rule for the first move after a loss?
$XRP $ADA $DOGE #TradingPsychology #Mindset #Crypto #Trading
Follow for daily trading education · Education only, not financial advice.
Why does one loss suddenly make you question a process that's worked for months?
That's revenge-thinking in disguise. A loss stings, so the brain hunts for someone to blame — the strategy, the setup, the market itself. The cost isn't the loss. It's the rushed, oversized trade right after it, aimed at proving something rather than following the plan.
Next time, build in a pause. Write down what actually happened versus what you felt happened, then check it against your rules before touching another trade.
What's your rule for the first move after a loss?
$XRP $ADA $DOGE #TradingPsychology #Mindset #Crypto #Trading
Follow for daily trading education · Education only, not financial advice.
That's revenge-thinking in disguise. A loss stings, so the brain hunts for someone to blame — the strategy, the setup, the market itself. The cost isn't the loss. It's the rushed, oversized trade right after it, aimed at proving something rather than following the plan.
Next time, build in a pause. Write down what actually happened versus what you felt happened, then check it against your rules before touching another trade.
What's your rule for the first move after a loss?
$XRP $ADA $DOGE #TradingPsychology #Mindset #Crypto #Trading
Follow for daily trading education · Education only, not financial advice.

226
Crypto's latest stress test is coming from outside crypto: Bitcoin slid to $76,000 as a broader AI-stock selloff dragged risk assets down together, showing how tightly digital assets now trade alongside tech sentiment. Structurally, this matters because it undercuts the idea that crypto moves independently — when macro fear spikes, correlated selling can hit even during periods of genuine protocol progress, like Zcash's NU7 upgrade or Hyperliquid's push for regulatory legitimacy. Meanwhile, security themes are resurfacing too, from quantum-threat defenses in Bitcoin's code to scrutiny of hacking groups like TraderTraitor, reminding everyone that infrastructure risk never fully disappears. Watch whether crypto decouples from equities as the AI-trade unwind plays out, and whether security and regulatory developments get overshadowed by macro noise. Does this feel like a temporary correlation, or a lasting shift in how crypto trades?
$ETH $BNB $SOL #Crypto #News #Bitcoin #Trading
Follow for daily trading education · Education only, not financial advice.
Crypto's latest stress test is coming from outside crypto: Bitcoin slid to $76,000 as a broader AI-stock selloff dragged risk assets down together, showing how tightly digital assets now trade alongside tech sentiment. Structurally, this matters because it undercuts the idea that crypto moves independently — when macro fear spikes, correlated selling can hit even during periods of genuine protocol progress, like Zcash's NU7 upgrade or Hyperliquid's push for regulatory legitimacy. Meanwhile, security themes are resurfacing too, from quantum-threat defenses in Bitcoin's code to scrutiny of hacking groups like TraderTraitor, reminding everyone that infrastructure risk never fully disappears. Watch whether crypto decouples from equities as the AI-trade unwind plays out, and whether security and regulatory developments get overshadowed by macro noise. Does this feel like a temporary correlation, or a lasting shift in how crypto trades?
$ETH $BNB $SOL #Crypto #News #Bitcoin #Trading
Follow for daily trading education · Education only, not financial advice.
$ETH $BNB $SOL #Crypto #News #Bitcoin #Trading
Follow for daily trading education · Education only, not financial advice.

96
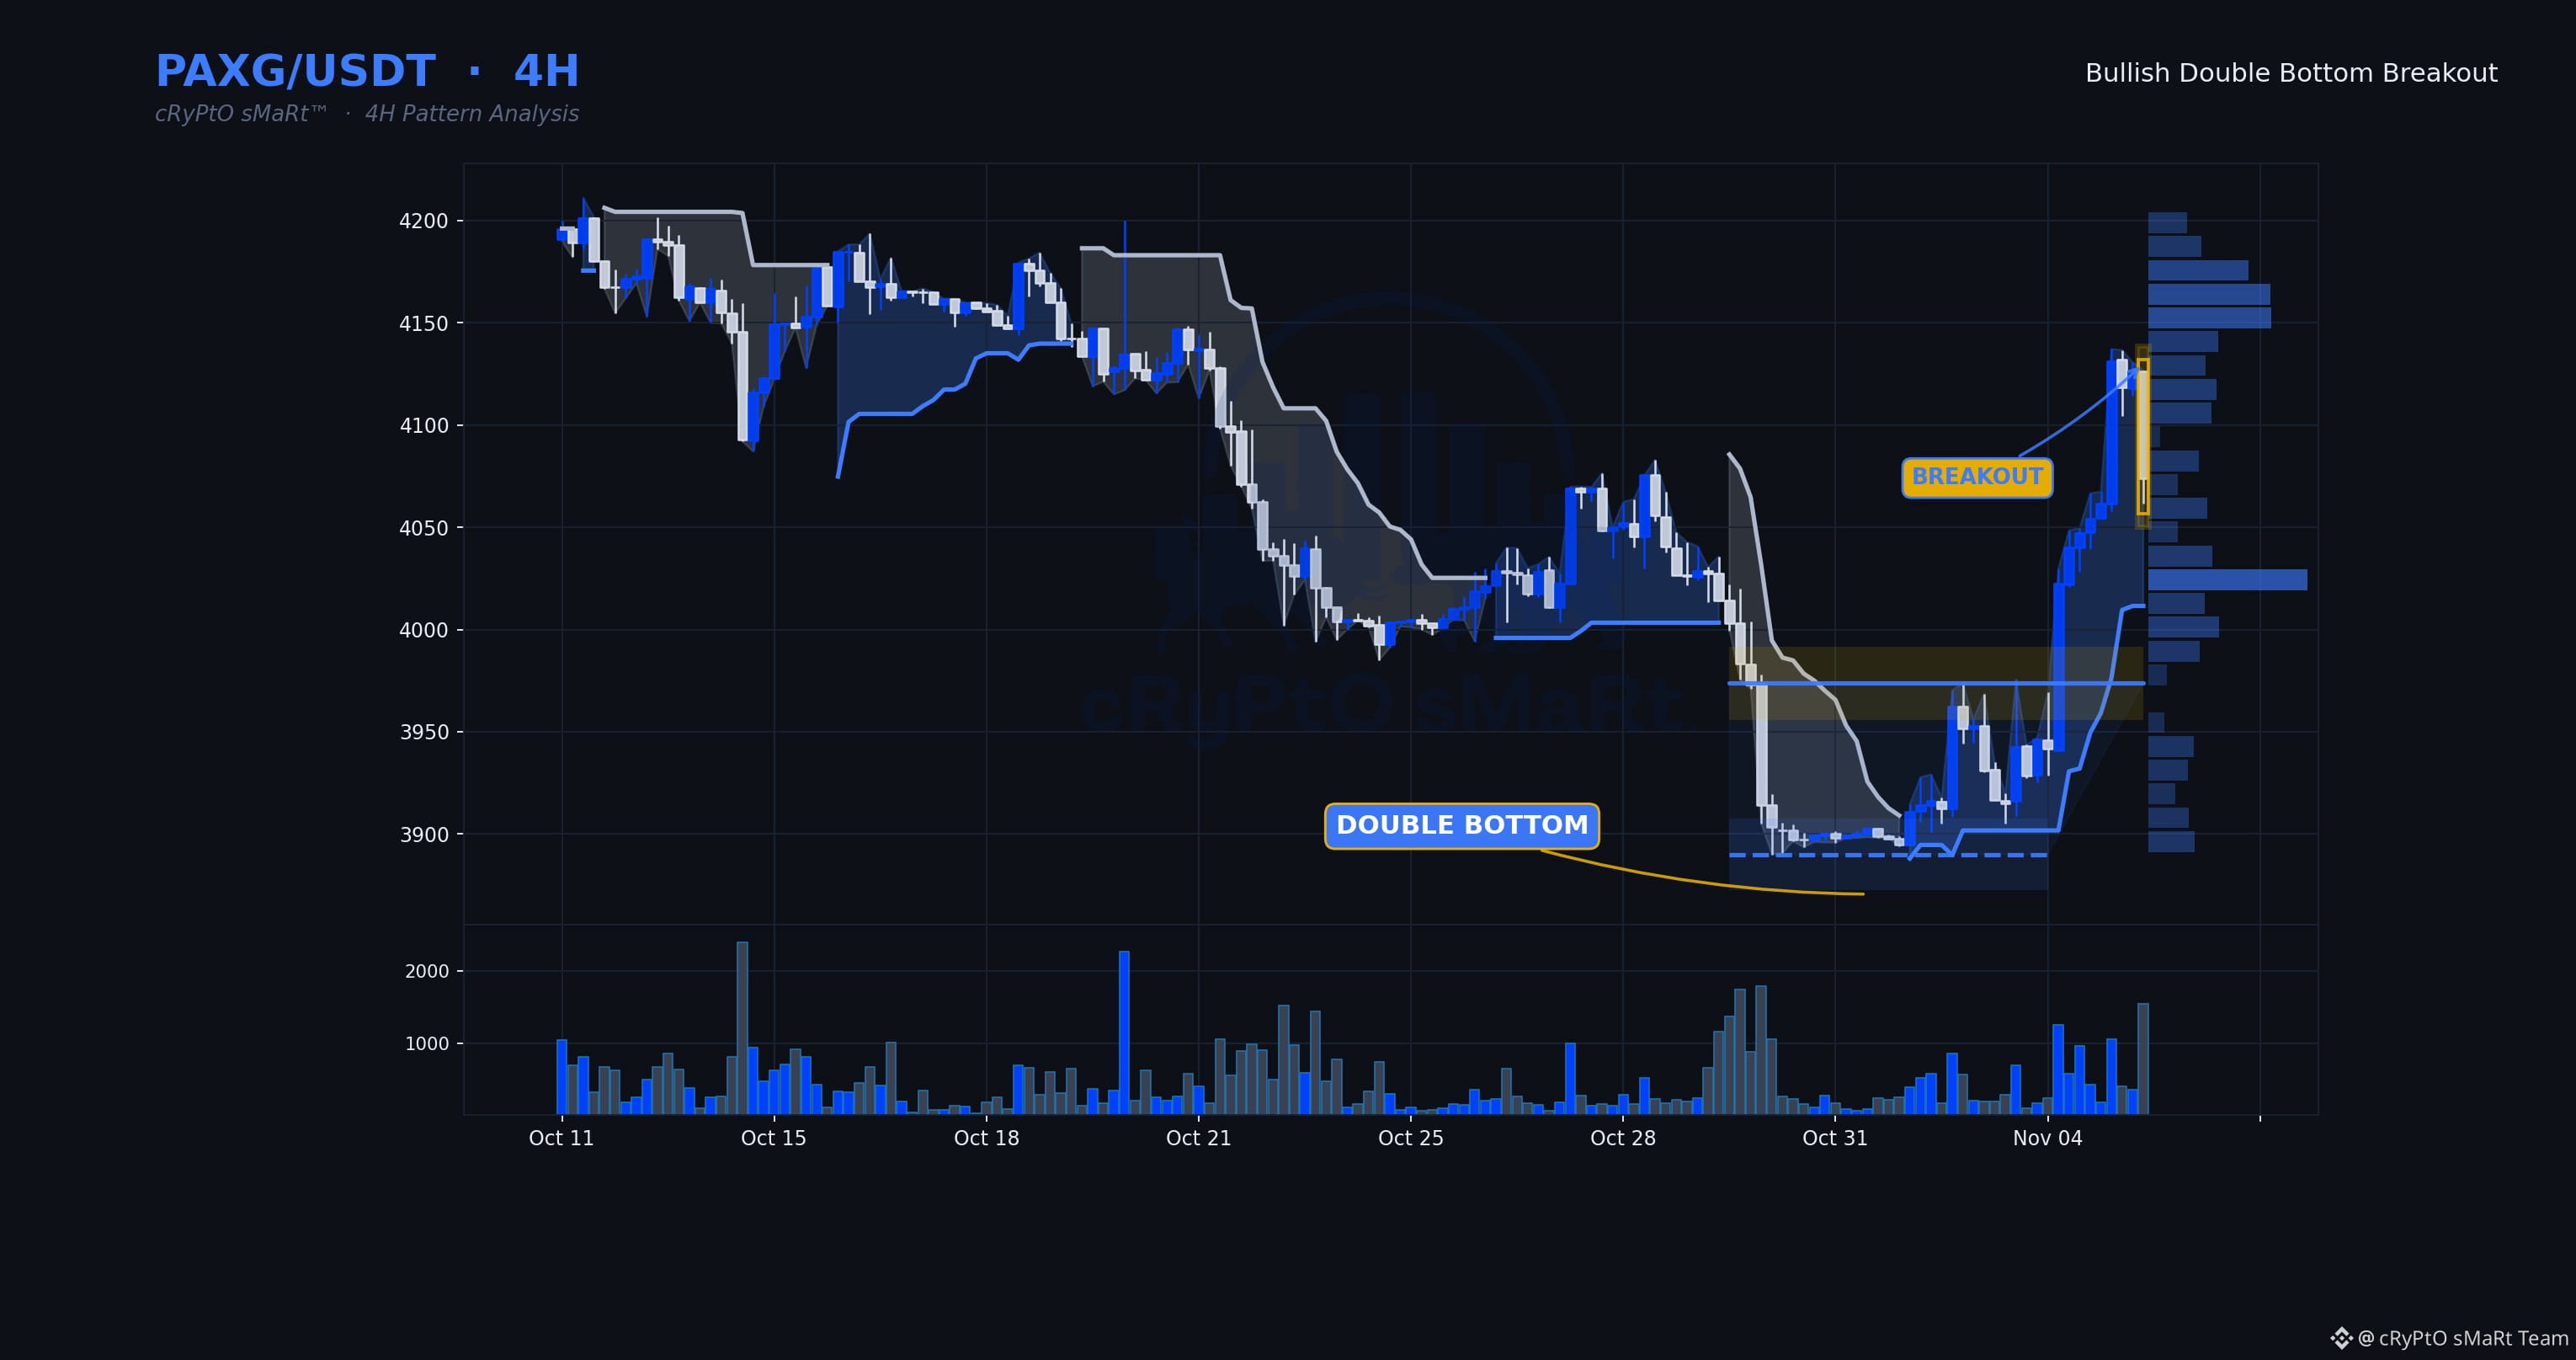
Buyers just took out the neckline on a double bottom with volume stepping up well above average — that's not a drift higher, that's participation showing up at the decision point. Momentum still has room before anything looks stretched, which matters for a breakout this clean.
🗓 Daily: Neutral — daily is mixed — Supertrend and EMAs not aligned
⏱ 4H: Double Bottom · Bullish bias
⏳ 1H: price is above the level but the 1H trend hasn't turned up yet — a 1H close that flips the trend up is the trigger.
📋 WHY IT QUALIFIES
✓ Double Bottom structure completed
✓ Decisive breakout — closed 2.5% beyond the line
✓ Volume 2.9× its 20-bar average
✓ RSI 63 — momentum confirms, not yet exhausted
🧭 Bias: Bullish while price holds above $3,973.74
⚠️ Invalidation: 4H close back below $3,973.74
🔵 Support $3,890.00 🟡 Resistance $3,973.74
$PAXG $BTC #ChartPatterns
Education only, not financial advice.
Buyers just took out the neckline on a double bottom with volume stepping up well above average — that's not a drift higher, that's participation showing up at the decision point. Momentum still has room before anything looks stretched, which matters for a breakout this clean.
🗓 Daily: Neutral — daily is mixed — Supertrend and EMAs not aligned
⏱ 4H: Double Bottom · Bullish bias
⏳ 1H: price is above the level but the 1H trend hasn't turned up yet — a 1H close that flips the trend up is the trigger.
📋 WHY IT QUALIFIES
✓ Double Bottom structure completed
✓ Decisive breakout — closed 2.5% beyond the line
✓ Volume 2.9× its 20-bar average
✓ RSI 63 — momentum confirms, not yet exhausted
🧭 Bias: Bullish while price holds above $3,973.74
⚠️ Invalidation: 4H close back below $3,973.74
🔵 Support $3,890.00 🟡 Resistance $3,973.74
$PAXG $BTC #ChartPatterns
Education only, not financial advice.
🗓 Daily: Neutral — daily is mixed — Supertrend and EMAs not aligned
⏱ 4H: Double Bottom · Bullish bias
⏳ 1H: price is above the level but the 1H trend hasn't turned up yet — a 1H close that flips the trend up is the trigger.
📋 WHY IT QUALIFIES
✓ Double Bottom structure completed
✓ Decisive breakout — closed 2.5% beyond the line
✓ Volume 2.9× its 20-bar average
✓ RSI 63 — momentum confirms, not yet exhausted
🧭 Bias: Bullish while price holds above $3,973.74
⚠️ Invalidation: 4H close back below $3,973.74
🔵 Support $3,890.00 🟡 Resistance $3,973.74
$PAXG $BTC #ChartPatterns
Education only, not financial advice.
155
Beginners think discipline means gritting your teeth and staying strong in the moment. That's backwards. By the time you're relying on willpower, you've already lost — emotions move faster than resolve, and tired decision-making always finds a reason to break the rule. The traders who stay consistent aren't tougher, they just removed the decision. A written process, checked mechanically before and during a trade, takes the fight out of the equation entirely. Try this: write your rules down tonight, somewhere you'll actually see them mid-trade tomorrow. What's one rule you keep breaking in the heat of the moment?
$BNB $SOL $XRP #TradingPsychology #Mindset #Crypto #Trading
Follow for daily trading education · Education only, not financial advice.
Beginners think discipline means gritting your teeth and staying strong in the moment. That's backwards. By the time you're relying on willpower, you've already lost — emotions move faster than resolve, and tired decision-making always finds a reason to break the rule. The traders who stay consistent aren't tougher, they just removed the decision. A written process, checked mechanically before and during a trade, takes the fight out of the equation entirely. Try this: write your rules down tonight, somewhere you'll actually see them mid-trade tomorrow. What's one rule you keep breaking in the heat of the moment?
$BNB $SOL $XRP #TradingPsychology #Mindset #Crypto #Trading
Follow for daily trading education · Education only, not financial advice.
$BNB $SOL $XRP #TradingPsychology #Mindset #Crypto #Trading
Follow for daily trading education · Education only, not financial advice.

171
Confidence is not a position size. Distance to your stop is.
Think of it like packing a parachute based on the jump height, not on how excited you are to jump. A ten-story jump and a hundred-story jump need completely different setups — your enthusiasm doesn't change the math. Same with trades: the further your invalidation point sits from entry, the smaller your size needs to be to keep risk constant. Decide what percentage of your account you're willing to lose first, then let that number and your stop distance dictate size. Conviction decides whether you take the trade. Risk decides how big.
Next time you size up, write down your stop distance before you think about how good the setup feels.
What's your account risk per trade, and does your sizing actually match it?
$TRX $BTC $ETH #Trading #TradingEducation #Crypto #TA
Follow for daily trading education · Education only, not financial advice.
Confidence is not a position size. Distance to your stop is.
Think of it like packing a parachute based on the jump height, not on how excited you are to jump. A ten-story jump and a hundred-story jump need completely different setups — your enthusiasm doesn't change the math. Same with trades: the further your invalidation point sits from entry, the smaller your size needs to be to keep risk constant. Decide what percentage of your account you're willing to lose first, then let that number and your stop distance dictate size. Conviction decides whether you take the trade. Risk decides how big.
Next time you size up, write down your stop distance before you think about how good the setup feels.
What's your account risk per trade, and does your sizing actually match it?
$TRX $BTC $ETH #Trading #TradingEducation #Crypto #TA
Follow for daily trading education · Education only, not financial advice.
Think of it like packing a parachute based on the jump height, not on how excited you are to jump. A ten-story jump and a hundred-story jump need completely different setups — your enthusiasm doesn't change the math. Same with trades: the further your invalidation point sits from entry, the smaller your size needs to be to keep risk constant. Decide what percentage of your account you're willing to lose first, then let that number and your stop distance dictate size. Conviction decides whether you take the trade. Risk decides how big.
Next time you size up, write down your stop distance before you think about how good the setup feels.
What's your account risk per trade, and does your sizing actually match it?
$TRX $BTC $ETH #Trading #TradingEducation #Crypto #TA
Follow for daily trading education · Education only, not financial advice.

105
What's the point of a brilliant setup if one bad trade wipes out the month?
Here's the gap most traders miss: capping risk per trade isn't about being scared of losing, it's about mathematics. Lose a small fraction of the account and a few wins bring you back. Lose a huge chunk and you need a miracle just to break even again. The size of the hole decides how hard the climb out gets. Survival isn't the boring part of trading, it's the entire game, because a trader with no capital left has no more trades to take.
Watch your position size before you watch your entry. Check it every single time, no exceptions.
How much of your account would one bad trade cost you right now?
$SOL $XRP $ADA #Trading #TradingEducation #Crypto #TA
Follow for daily trading education · Education only, not financial advice.
What's the point of a brilliant setup if one bad trade wipes out the month?
Here's the gap most traders miss: capping risk per trade isn't about being scared of losing, it's about mathematics. Lose a small fraction of the account and a few wins bring you back. Lose a huge chunk and you need a miracle just to break even again. The size of the hole decides how hard the climb out gets. Survival isn't the boring part of trading, it's the entire game, because a trader with no capital left has no more trades to take.
Watch your position size before you watch your entry. Check it every single time, no exceptions.
How much of your account would one bad trade cost you right now?
$SOL $XRP $ADA #Trading #TradingEducation #Crypto #TA
Follow for daily trading education · Education only, not financial advice.
Here's the gap most traders miss: capping risk per trade isn't about being scared of losing, it's about mathematics. Lose a small fraction of the account and a few wins bring you back. Lose a huge chunk and you need a miracle just to break even again. The size of the hole decides how hard the climb out gets. Survival isn't the boring part of trading, it's the entire game, because a trader with no capital left has no more trades to take.
Watch your position size before you watch your entry. Check it every single time, no exceptions.
How much of your account would one bad trade cost you right now?
$SOL $XRP $ADA #Trading #TradingEducation #Crypto #TA
Follow for daily trading education · Education only, not financial advice.

174
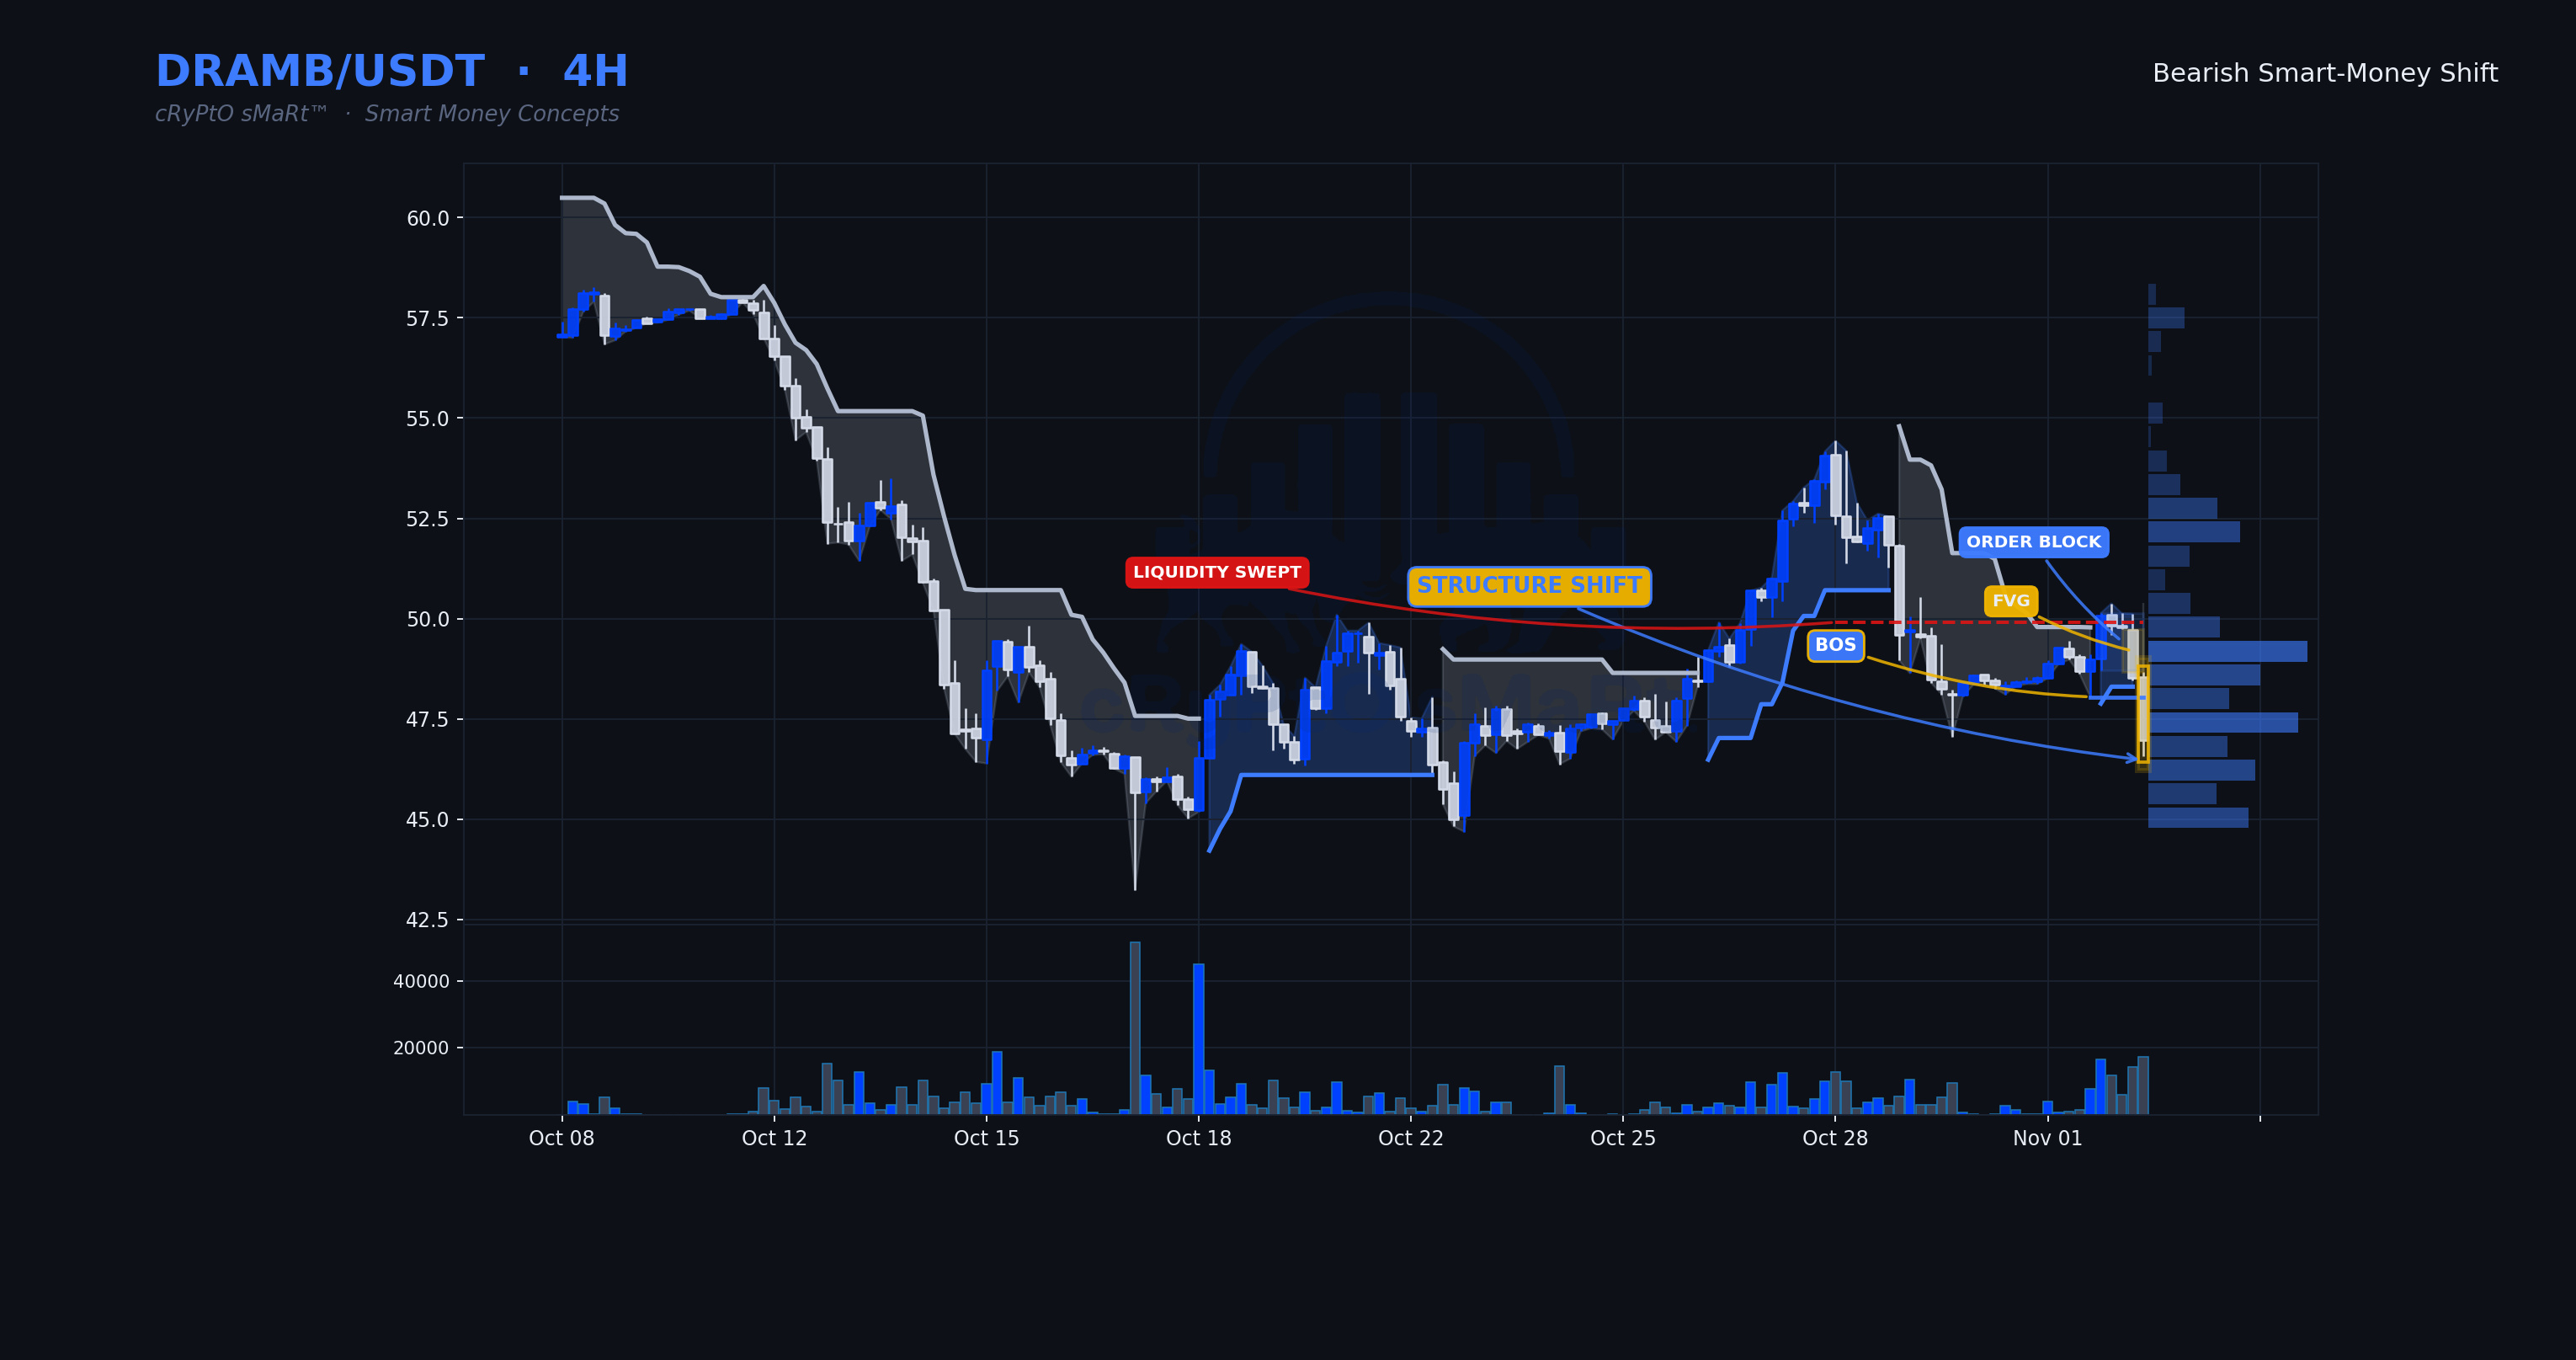
Sellers just took the highs and didn't stop there — that's a classic sweep-then-reverse, and the follow-through break of structure on strong displacement tells you this wasn't a shakeout, it was distribution.
🗓 Daily: Bearish — price below the daily Supertrend with a falling 50/200 EMA stack
⏱ 4H: Smart-Money Shift · Bearish bias
⏳ 1H: the 1H is trading below the level with its trend down — the lower timeframe confirms the setup.
✅ Daily, 4H and 1H all point bearish.
📋 WHY IT QUALIFIES
✓ Smart-Money Shift structure completed
🧭 Bias: Bearish while price holds below $48.0500
⚠️ Invalidation: 4H close back above $48.0500
🔵 Support $48.0500 🟡 Resistance $49.9100
$DRAMB $BTC #SmartMoney
Education only, not financial advice.
Sellers just took the highs and didn't stop there — that's a classic sweep-then-reverse, and the follow-through break of structure on strong displacement tells you this wasn't a shakeout, it was distribution.
🗓 Daily: Bearish — price below the daily Supertrend with a falling 50/200 EMA stack
⏱ 4H: Smart-Money Shift · Bearish bias
⏳ 1H: the 1H is trading below the level with its trend down — the lower timeframe confirms the setup.
✅ Daily, 4H and 1H all point bearish.
📋 WHY IT QUALIFIES
✓ Smart-Money Shift structure completed
🧭 Bias: Bearish while price holds below $48.0500
⚠️ Invalidation: 4H close back above $48.0500
🔵 Support $48.0500 🟡 Resistance $49.9100
$DRAMB $BTC #SmartMoney
Education only, not financial advice.
🗓 Daily: Bearish — price below the daily Supertrend with a falling 50/200 EMA stack
⏱ 4H: Smart-Money Shift · Bearish bias
⏳ 1H: the 1H is trading below the level with its trend down — the lower timeframe confirms the setup.
✅ Daily, 4H and 1H all point bearish.
📋 WHY IT QUALIFIES
✓ Smart-Money Shift structure completed
🧭 Bias: Bearish while price holds below $48.0500
⚠️ Invalidation: 4H close back above $48.0500
🔵 Support $48.0500 🟡 Resistance $49.9100
$DRAMB $BTC #SmartMoney
Education only, not financial advice.
121
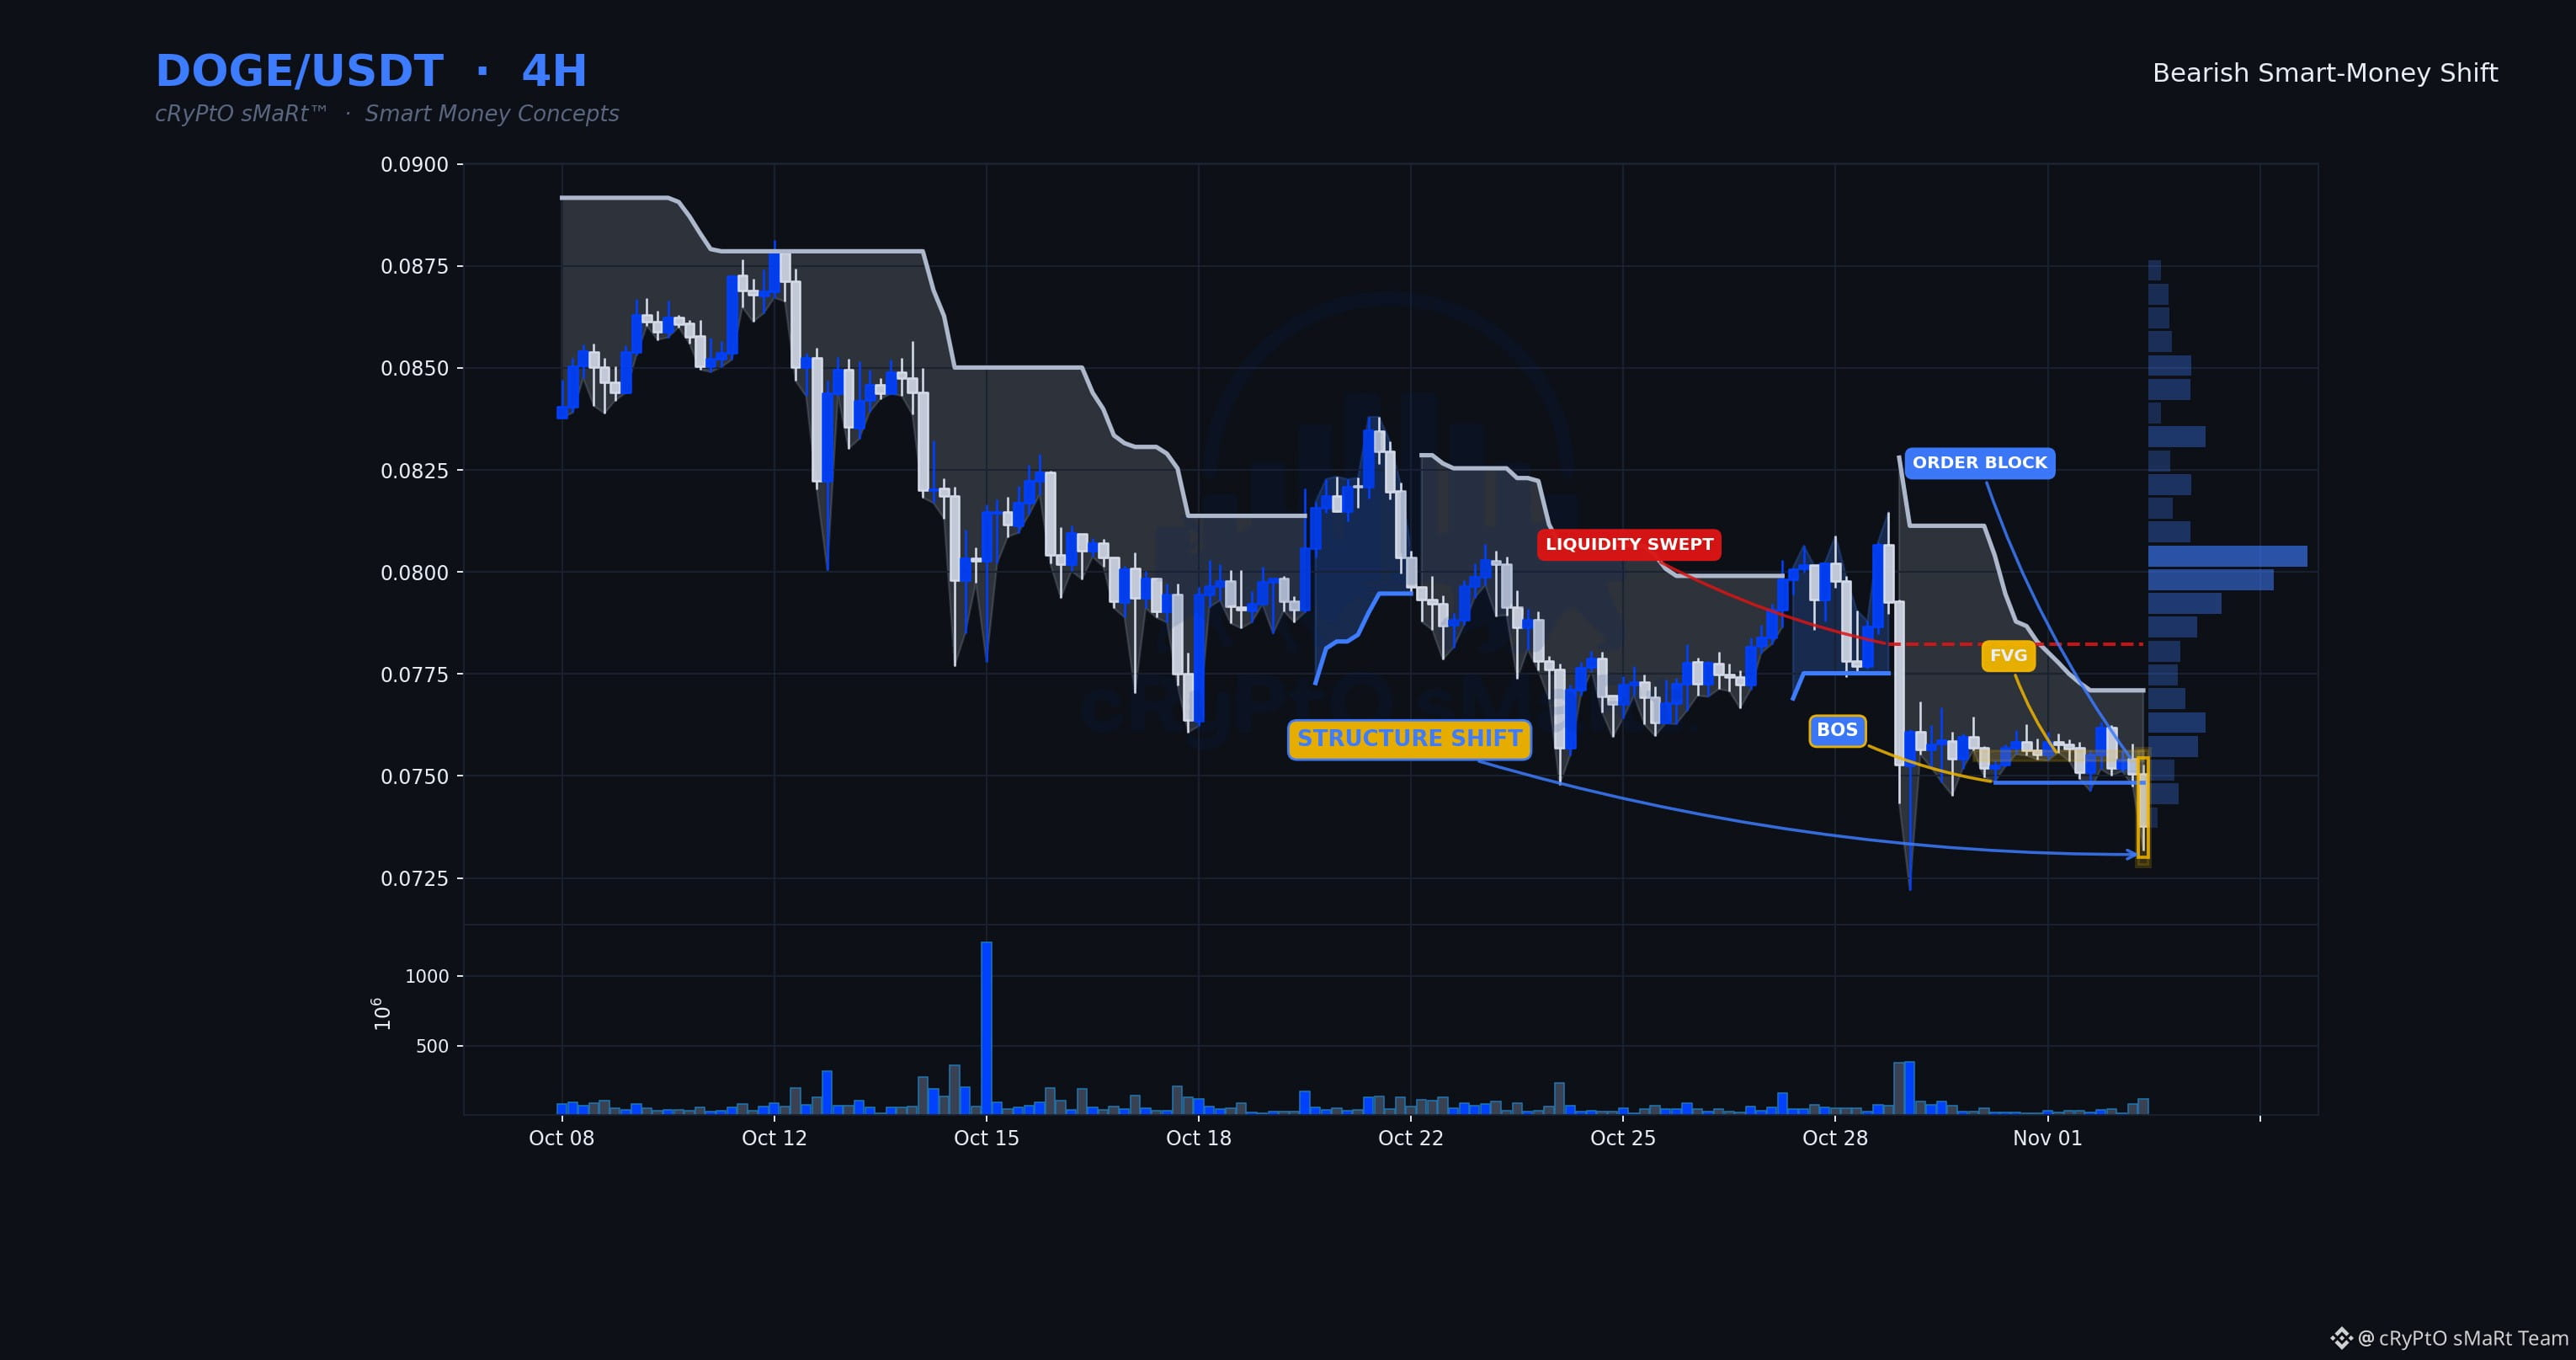
Sellers just swept the highs, trapped the late longs, and didn't stop there — they drove straight through structure with volume well above average. That's not a shakeout that fades, that's distribution with intent.
🗓 Daily: Bearish — price below the daily Supertrend with a falling 50/200 EMA stack
⏱ 4H: Smart-Money Shift · Bearish bias
⏳ 1H: the 1H is trading below the level with its trend down — the lower timeframe confirms the setup.
✅ Daily, 4H and 1H all point bearish.
📋 WHY IT QUALIFIES
✓ Smart-Money Shift structure completed
🧭 Bias: Bearish while price holds below $0.07485
⚠️ Invalidation: 4H close back above $0.07485
🔵 Support $0.07485 🟡 Resistance $0.07823
$DOGE $BTC #SmartMoney
Education only, not financial advice.
Sellers just swept the highs, trapped the late longs, and didn't stop there — they drove straight through structure with volume well above average. That's not a shakeout that fades, that's distribution with intent.
🗓 Daily: Bearish — price below the daily Supertrend with a falling 50/200 EMA stack
⏱ 4H: Smart-Money Shift · Bearish bias
⏳ 1H: the 1H is trading below the level with its trend down — the lower timeframe confirms the setup.
✅ Daily, 4H and 1H all point bearish.
📋 WHY IT QUALIFIES
✓ Smart-Money Shift structure completed
🧭 Bias: Bearish while price holds below $0.07485
⚠️ Invalidation: 4H close back above $0.07485
🔵 Support $0.07485 🟡 Resistance $0.07823
$DOGE $BTC #SmartMoney
Education only, not financial advice.
🗓 Daily: Bearish — price below the daily Supertrend with a falling 50/200 EMA stack
⏱ 4H: Smart-Money Shift · Bearish bias
⏳ 1H: the 1H is trading below the level with its trend down — the lower timeframe confirms the setup.
✅ Daily, 4H and 1H all point bearish.
📋 WHY IT QUALIFIES
✓ Smart-Money Shift structure completed
🧭 Bias: Bearish while price holds below $0.07485
⚠️ Invalidation: 4H close back above $0.07485
🔵 Support $0.07485 🟡 Resistance $0.07823
$DOGE $BTC #SmartMoney
Education only, not financial advice.
114
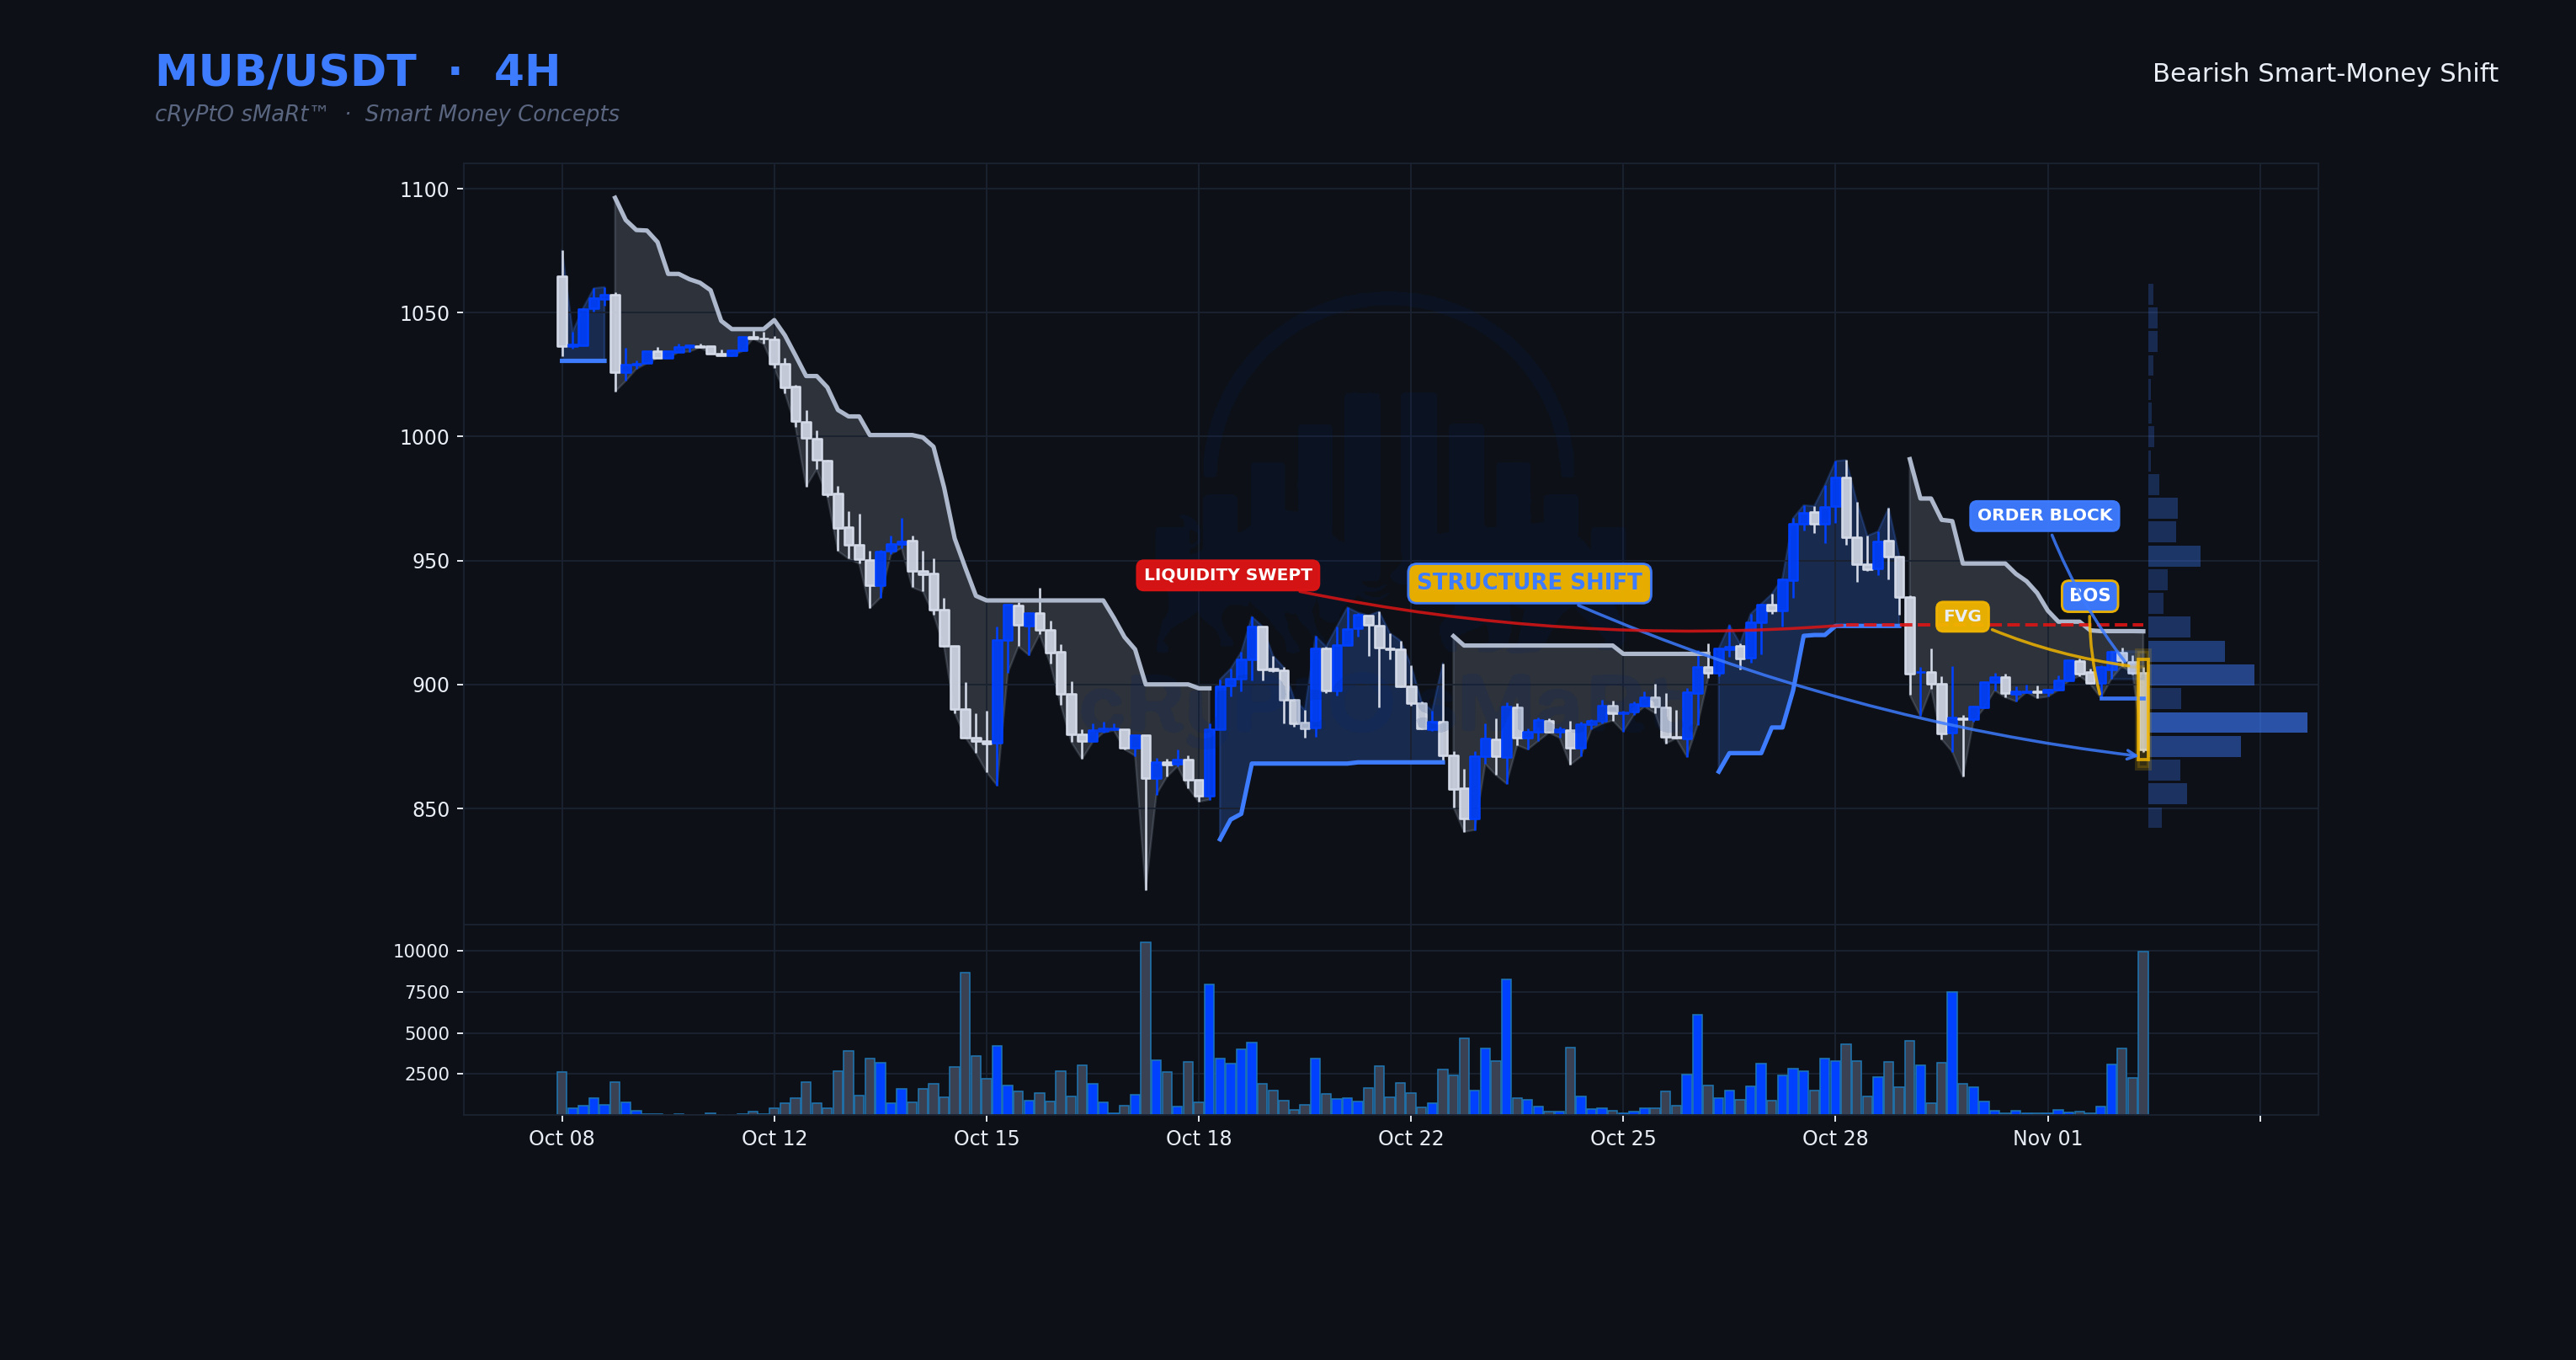
Sellers just ran the highs, grabbed the resting liquidity, and immediately turned it into a break of structure to the downside. That's not a slow bleed, that's displacement — strong range expansion on volume well above average, which tells you this wasn't retail noise, it was intent.
🗓 Daily: Bearish — price below the daily Supertrend with a falling 50/200 EMA stack
⏱ 4H: Smart-Money Shift · Bearish bias
⏳ 1H: the 1H is trading below the level with its trend down — the lower timeframe confirms the setup.
✅ Daily, 4H and 1H all point bearish.
📋 WHY IT QUALIFIES
✓ Smart-Money Shift structure completed
🧭 Bias: Bearish while price holds below $894.5900
⚠️ Invalidation: 4H close back above $894.5900
🔵 Support $894.5900 🟡 Resistance $924.0000
$MUB $BTC #SmartMoney
Education only, not financial advice.
Sellers just ran the highs, grabbed the resting liquidity, and immediately turned it into a break of structure to the downside. That's not a slow bleed, that's displacement — strong range expansion on volume well above average, which tells you this wasn't retail noise, it was intent.
🗓 Daily: Bearish — price below the daily Supertrend with a falling 50/200 EMA stack
⏱ 4H: Smart-Money Shift · Bearish bias
⏳ 1H: the 1H is trading below the level with its trend down — the lower timeframe confirms the setup.
✅ Daily, 4H and 1H all point bearish.
📋 WHY IT QUALIFIES
✓ Smart-Money Shift structure completed
🧭 Bias: Bearish while price holds below $894.5900
⚠️ Invalidation: 4H close back above $894.5900
🔵 Support $894.5900 🟡 Resistance $924.0000
$MUB $BTC #SmartMoney
Education only, not financial advice.
🗓 Daily: Bearish — price below the daily Supertrend with a falling 50/200 EMA stack
⏱ 4H: Smart-Money Shift · Bearish bias
⏳ 1H: the 1H is trading below the level with its trend down — the lower timeframe confirms the setup.
✅ Daily, 4H and 1H all point bearish.
📋 WHY IT QUALIFIES
✓ Smart-Money Shift structure completed
🧭 Bias: Bearish while price holds below $894.5900
⚠️ Invalidation: 4H close back above $894.5900
🔵 Support $894.5900 🟡 Resistance $924.0000
$MUB $BTC #SmartMoney
Education only, not financial advice.
110
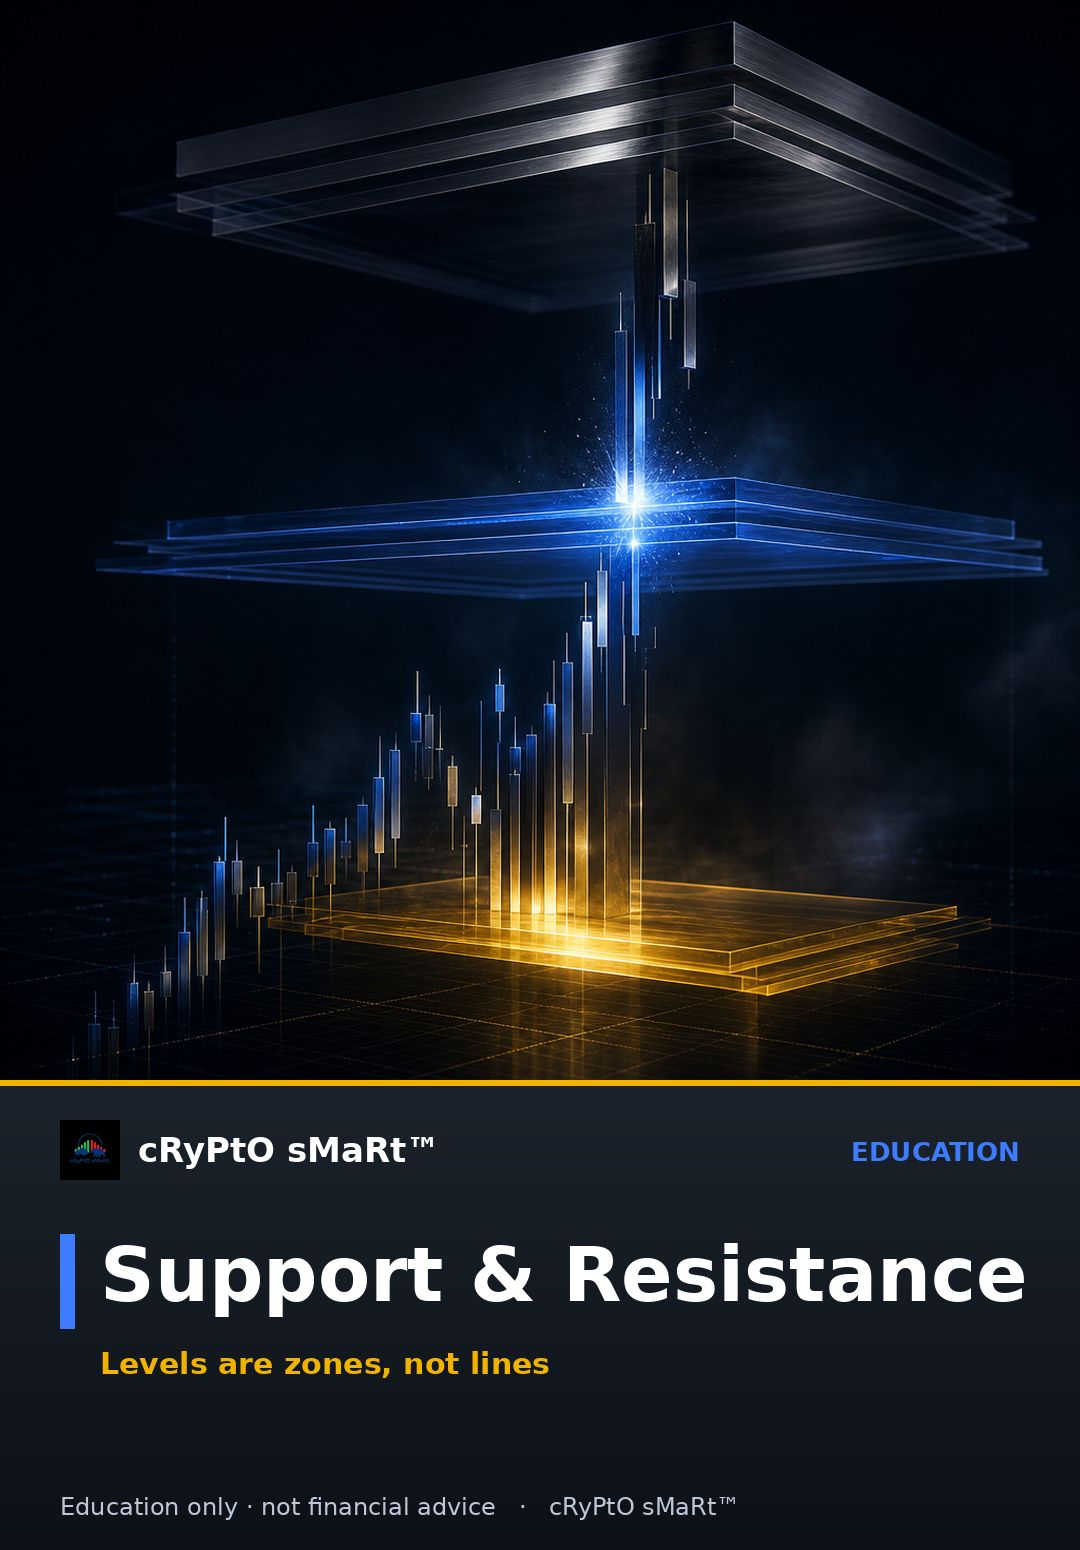
Most traders draw support and resistance as a single line. That's why they get faked out constantly.
Here's the rule: treat them as zones, not lines. Price rarely respects an exact number — it reacts somewhere around it. And once a zone breaks with conviction, it doesn't disappear. It flips roles. Old resistance becomes new support. Old support becomes new resistance. That retest of the broken level is one of the most consistent behaviors in markets.
Watch what happens on the retest, not the breakout itself. The breakout shows intent. The retest shows whether that intent holds.
What's your process for confirming a flip before trusting it?
$AVAX $LINK $TRX #Trading #TradingEducation #Crypto #TA
Follow for daily trading education · Education only, not financial advice.
Most traders draw support and resistance as a single line. That's why they get faked out constantly.
Here's the rule: treat them as zones, not lines. Price rarely respects an exact number — it reacts somewhere around it. And once a zone breaks with conviction, it doesn't disappear. It flips roles. Old resistance becomes new support. Old support becomes new resistance. That retest of the broken level is one of the most consistent behaviors in markets.
Watch what happens on the retest, not the breakout itself. The breakout shows intent. The retest shows whether that intent holds.
What's your process for confirming a flip before trusting it?
$AVAX $LINK $TRX #Trading #TradingEducation #Crypto #TA
Follow for daily trading education · Education only, not financial advice.
Here's the rule: treat them as zones, not lines. Price rarely respects an exact number — it reacts somewhere around it. And once a zone breaks with conviction, it doesn't disappear. It flips roles. Old resistance becomes new support. Old support becomes new resistance. That retest of the broken level is one of the most consistent behaviors in markets.
Watch what happens on the retest, not the breakout itself. The breakout shows intent. The retest shows whether that intent holds.
What's your process for confirming a flip before trusting it?
$AVAX $LINK $TRX #Trading #TradingEducation #Crypto #TA
Follow for daily trading education · Education only, not financial advice.
125
Log in to explore more content
Join global crypto users on Binance Square
⚡️ Get latest and useful information about crypto.
💬 Trusted by the world’s largest crypto exchange.
👍 Discover real insights from verified creators.
Email / Phone number
Trending Topics
USPPIMissMayEaseBTCPressure
47,223 views
783 Discussing
US PPI Rises 6.5% a Year in October, Slightly Below 6.6% Forecast
Binance News
·17 Likes
·17.9k views
BitcoinCoreDisclosesTorTrafficVulnerability
18,890 views
416 Discussing
WhatWillDriveCryptoandStocks’NextRebound?
161,289 views
1,632 Discussing