

Justin_BNB
2k Posts

Justin_BNB
Report
Block User
Trader || Community Builder || BNB Holder || Twitter/X: @JustinTraderBNB
392 Following
16.5K+ Followers
8.8K+ Liked
Posts
All
Quotes
Videos
Live
·
--
Bullish
$HYPE The recent 3.55 percentage point increase in Hyperliquid (HYPE) over the last 38 hours is primarily driven by large-scale accumulation by its treasury vehicle, Hyperliquid Strategies, against a backdrop of a strong buyback and burn narrative, rather than a broad market swing.
Treasury Buys 1.9M HYPE
Hyperliquid Strategies, a Nasdaq-listed company acting as HYPE's treasury, disclosed a fresh purchase of 1.9 million HYPE (about $167.2 million), lifting its holdings to roughly 37 million HYPE TokenPost report on Hyperliquid Strategies purchase. This move, valued around $3.26 billion, acts as a structural demand source for the token, especially given its circulating supply is only a fraction of its total. At current levels, HYPE has a market cap around $22.7 billion with 24-hour spot volume near $461.56 million and a 24-hour price gain of about 3.01%, while still sitting about 7.65% below its all-time high price of $97.98 according to Hyperliquid (HYPE).
Against a backdrop of unlock anxiety and whale transfers, a clearly documented $167 million buy by the main treasury vehicle is exactly the sort of event that can tilt short-term order flow back toward the bid and support a few percentage points of upside, even as overall crypto volumes fall.
{future}(HYPEUSDT)
$HYPE The recent 3.55 percentage point increase in Hyperliquid (HYPE) over the last 38 hours is primarily driven by large-scale accumulation by its treasury vehicle, Hyperliquid Strategies, against a backdrop of a strong buyback and burn narrative, rather than a broad market swing.
Treasury Buys 1.9M HYPE
Hyperliquid Strategies, a Nasdaq-listed company acting as HYPE's treasury, disclosed a fresh purchase of 1.9 million HYPE (about $167.2 million), lifting its holdings to roughly 37 million HYPE TokenPost report on Hyperliquid Strategies purchase. This move, valued around $3.26 billion, acts as a structural demand source for the token, especially given its circulating supply is only a fraction of its total. At current levels, HYPE has a market cap around $22.7 billion with 24-hour spot volume near $461.56 million and a 24-hour price gain of about 3.01%, while still sitting about 7.65% below its all-time high price of $97.98 according to Hyperliquid (HYPE).
Against a backdrop of unlock anxiety and whale transfers, a clearly documented $167 million buy by the main treasury vehicle is exactly the sort of event that can tilt short-term order flow back toward the bid and support a few percentage points of upside, even as overall crypto volumes fall.

1
383
·
--
Bullish
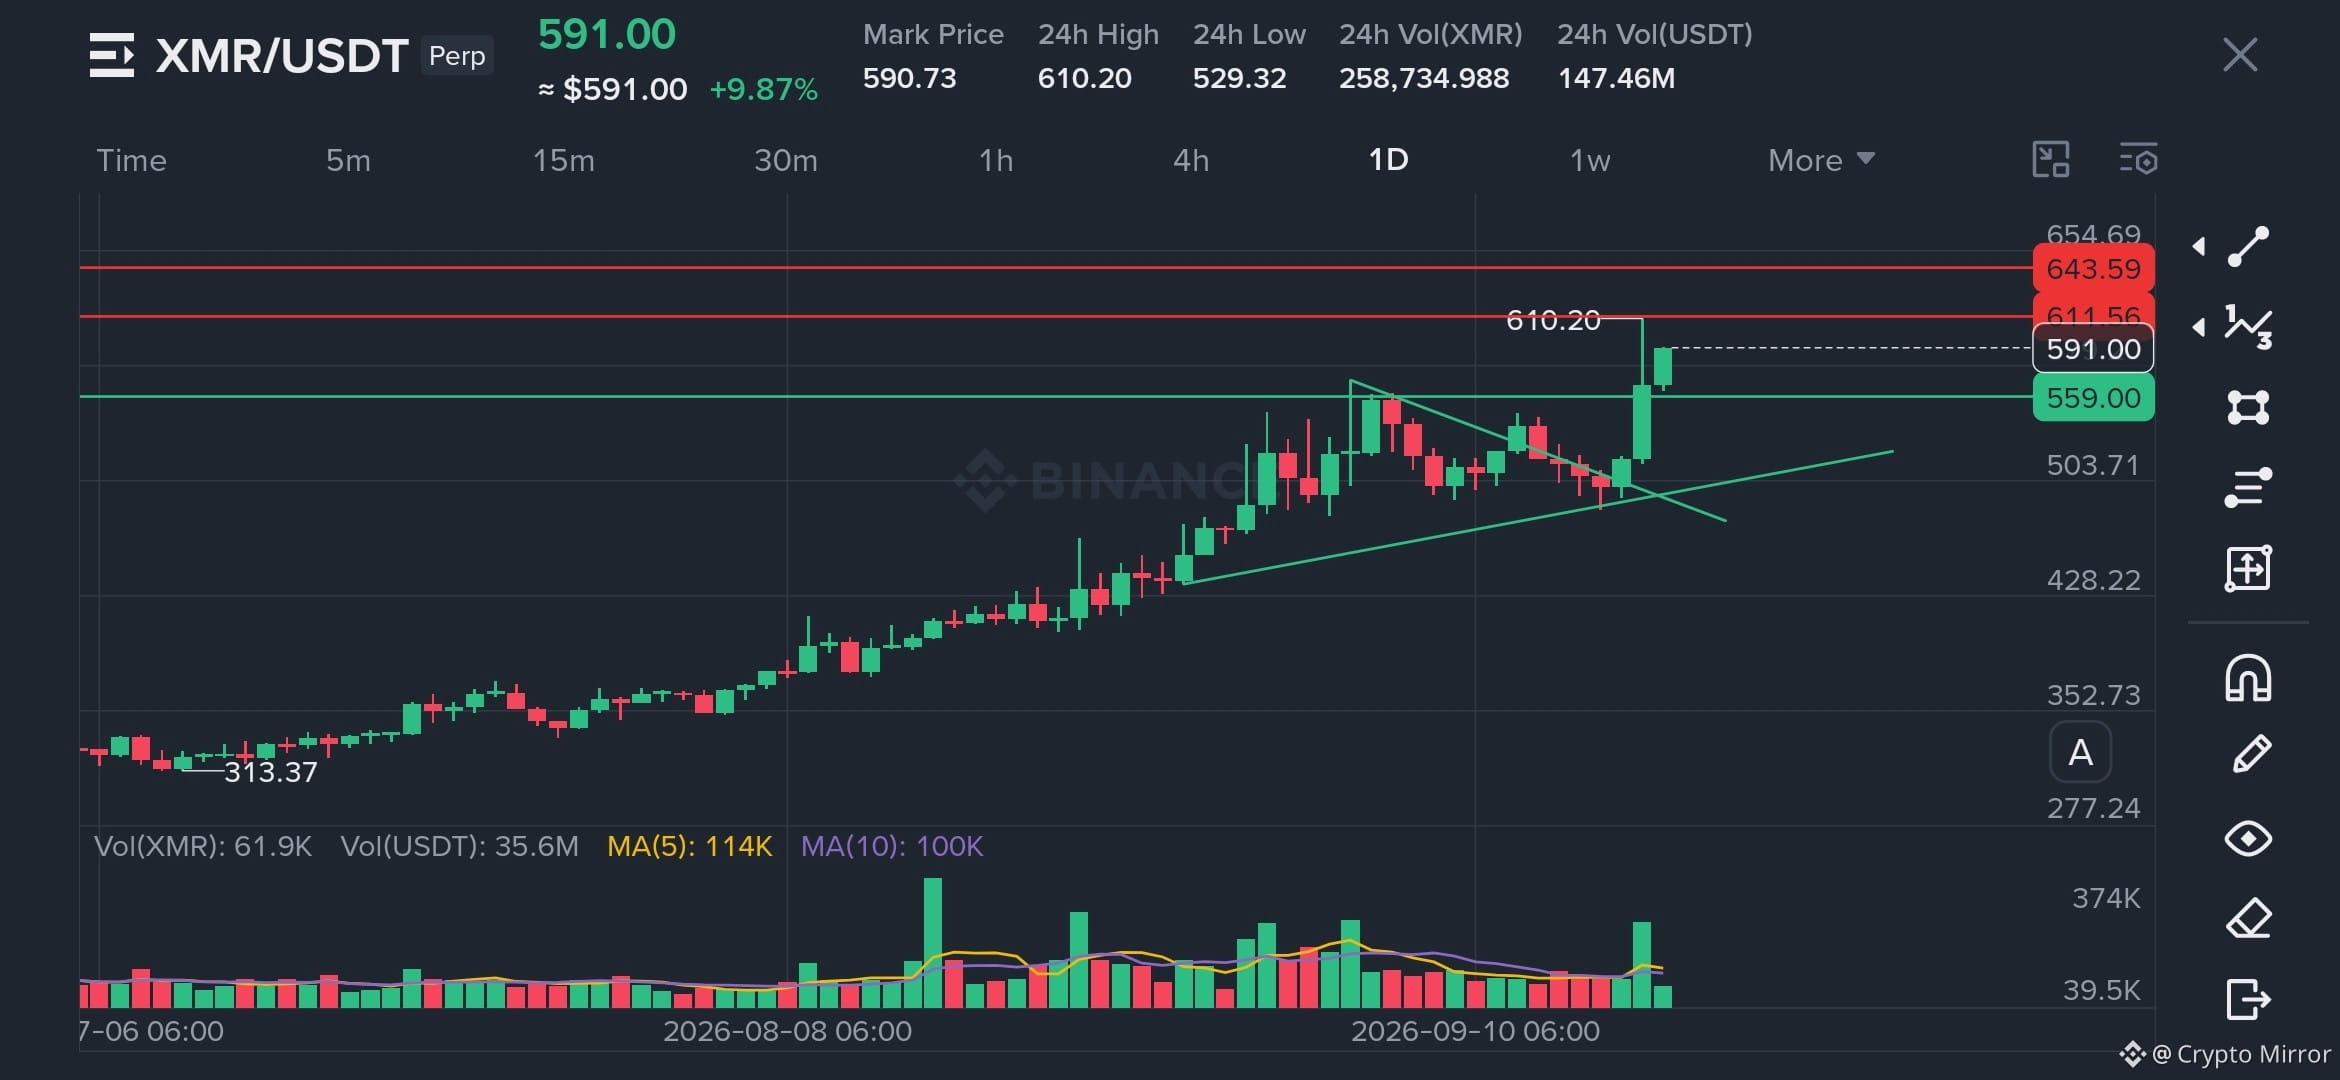
$XMR XMR is facing a key resistance zone with strong bullish momentum. A breakout above this resistance, supported by strong buying volume, could trigger further upside.
Entry : $585-$590
TP:$610-$620-$630-$640
SL:$550
$XMR XMR is facing a key resistance zone with strong bullish momentum. A breakout above this resistance, supported by strong buying volume, could trigger further upside.
Entry : $585-$590
TP:$610-$620-$630-$640
SL:$550
Entry : $585-$590
TP:$610-$620-$630-$640
SL:$550
1
224
·
--
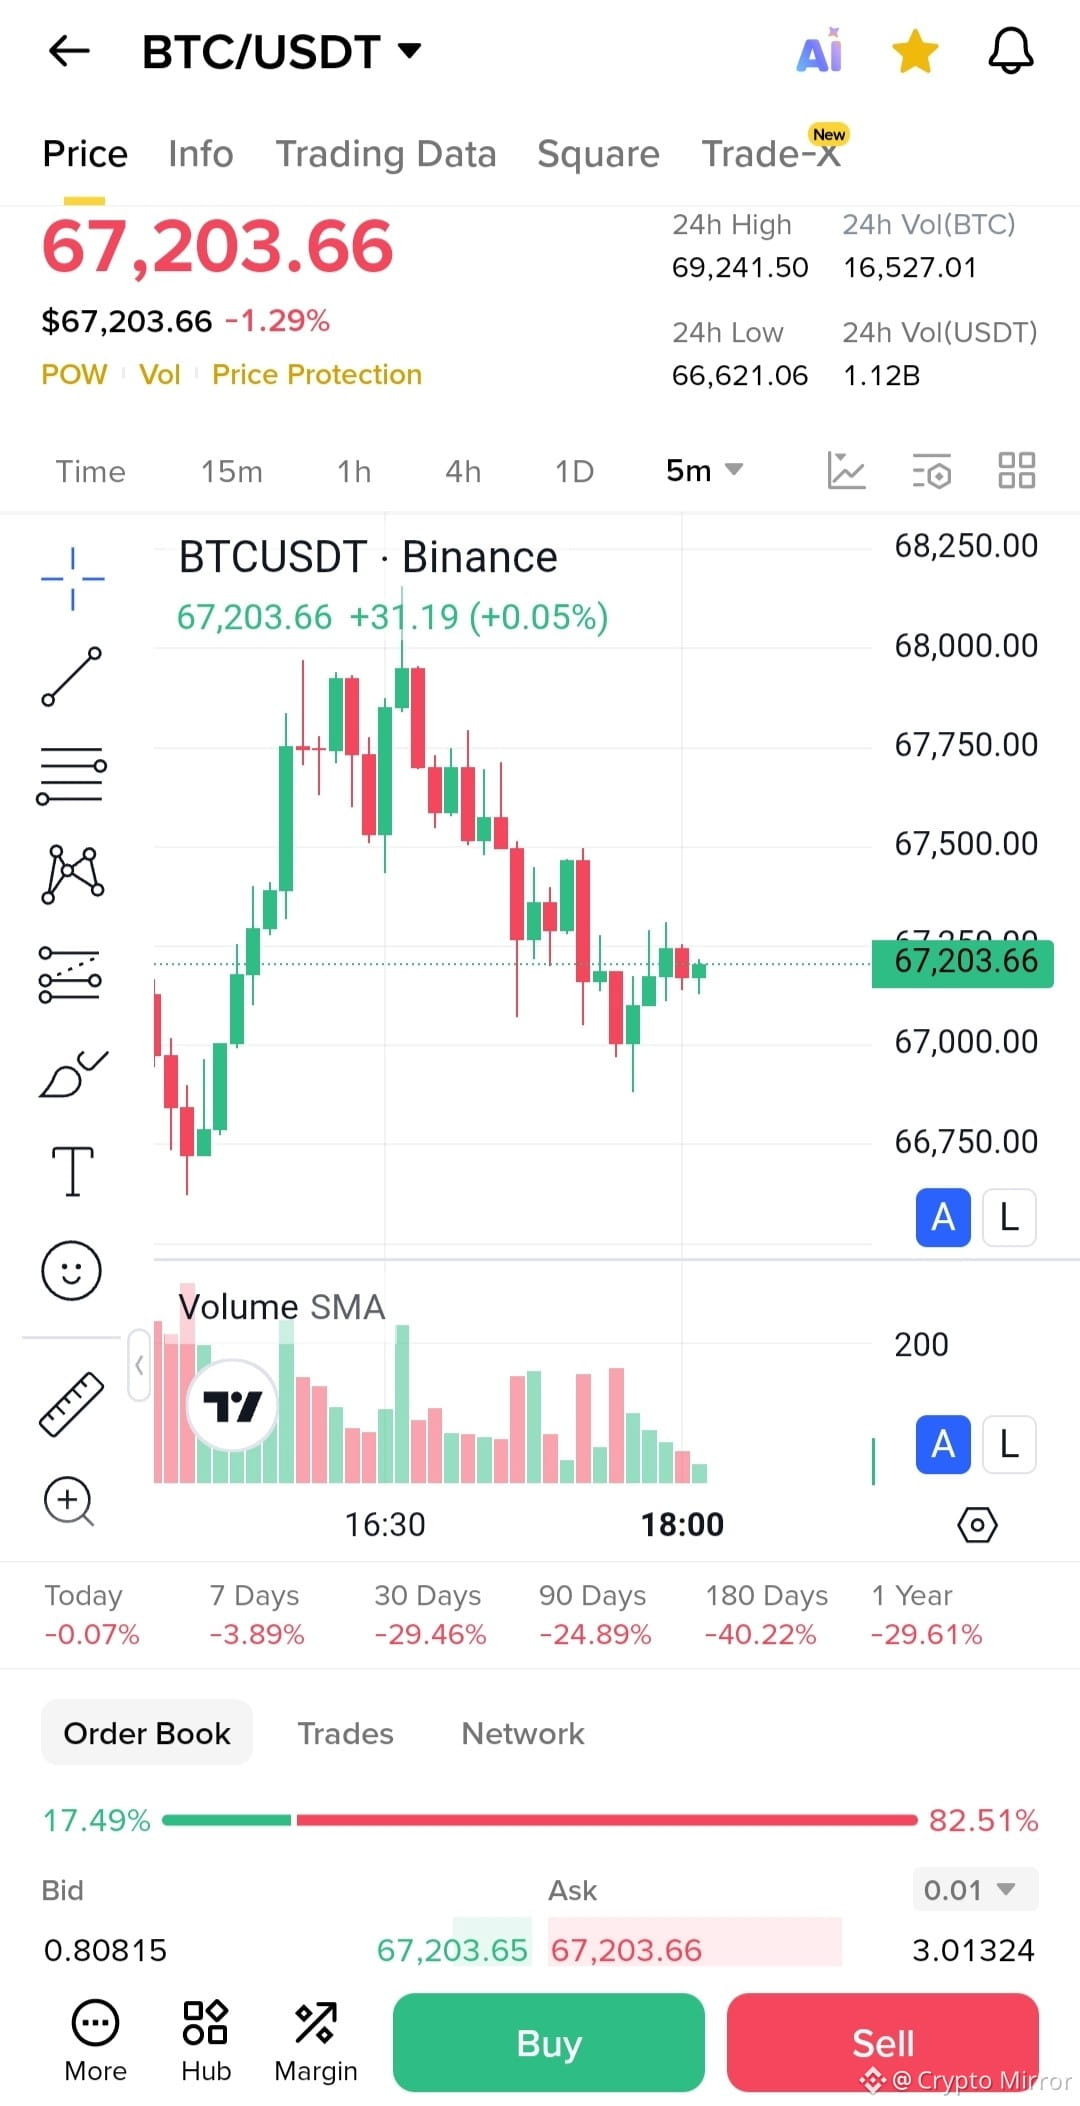
$BTC Currently BTC is down. After a week, BTC may reach 65000 USDT.
$BTC Currently BTC is down. After a week, BTC may reach 65000 USDT.
3
266
·
--
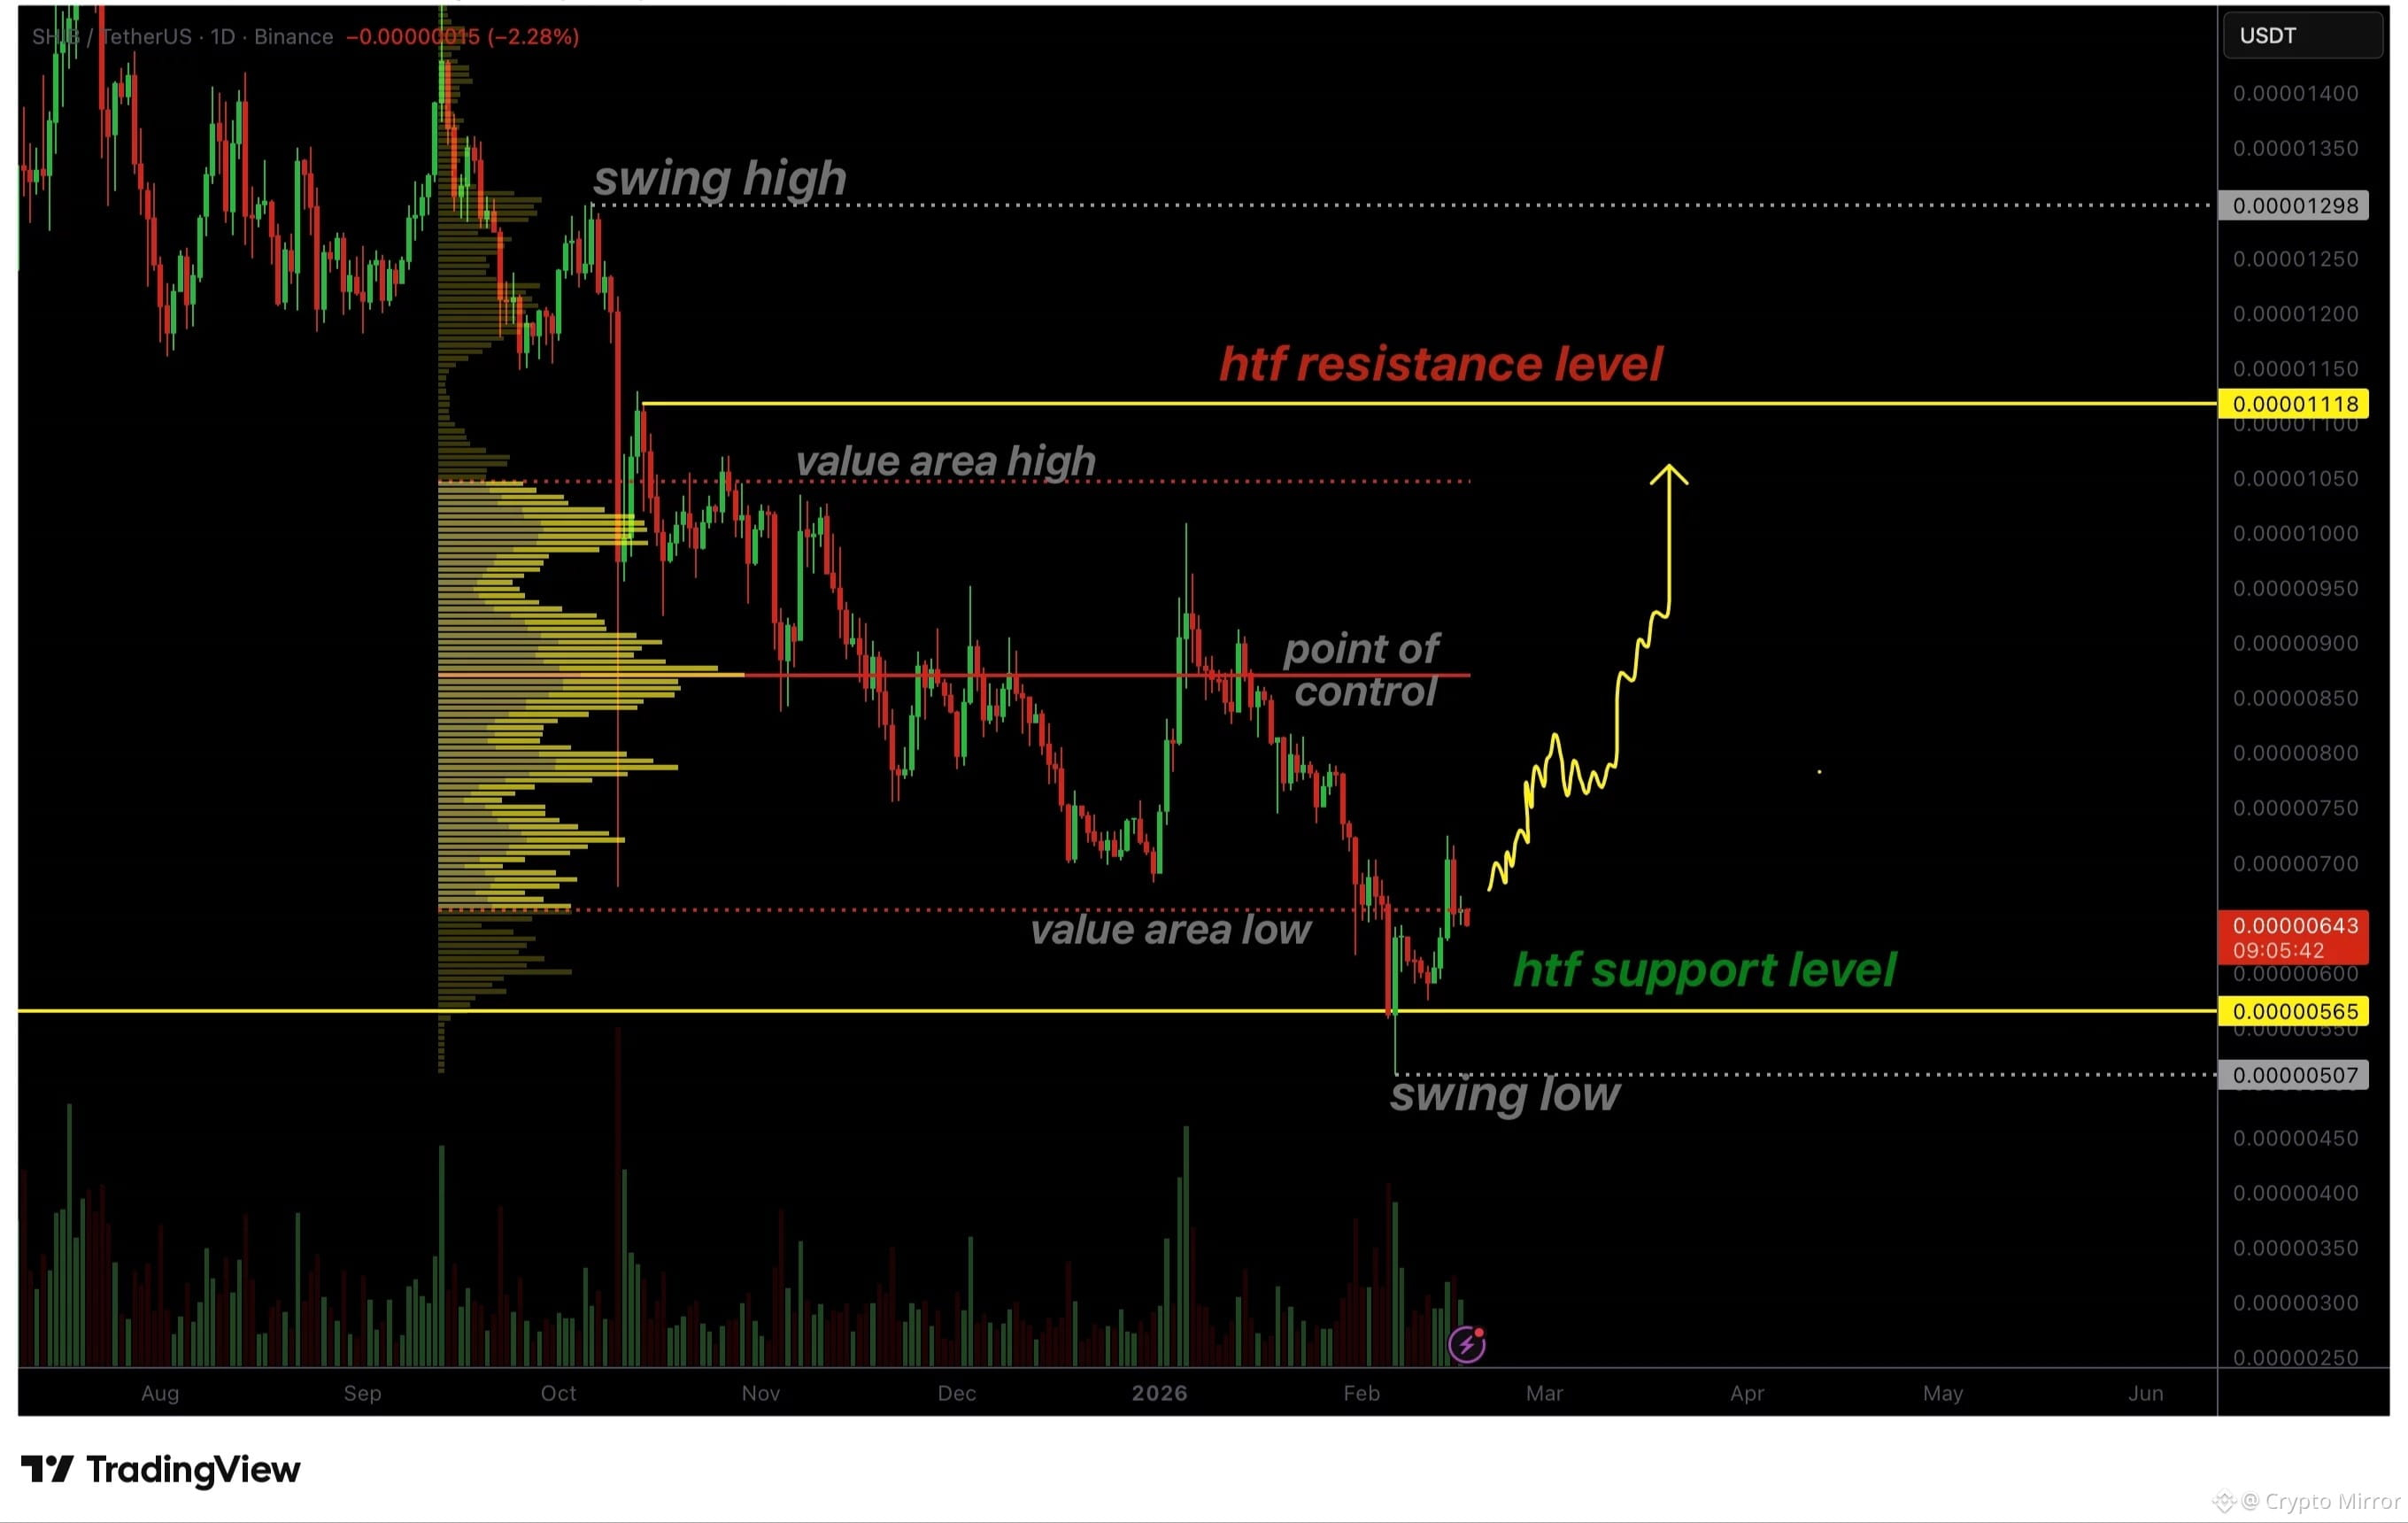
Shiba Inu price key technical points
Monthly support has been reclaimed, invalidating the recent breakdown
Oversold conditions are easing, supporting a relief bounce scenario
Holding above value area low increases upside probability, toward range highs
The recent sell-off in Shiba Inu was aggressive, producing a sequence of lower lows and strong bearish momentum. However, this downside move ultimately pushed the price below a key monthly support level, a zone that has historically attracted demand.
Rather than accepting below this level, the price quickly rebounded and reclaimed support, forming a bullish retest. This type of behavior is often associated with capitulation-style moves, where sellers exhaust themselves and buyers step in aggressively once liquidity is taken.
From a market structure perspective, reclaiming lost support after a brief breakdown weakens the bearish case and increases the likelihood that the move lower was corrective rather than trend-defining.
2
143
·
--
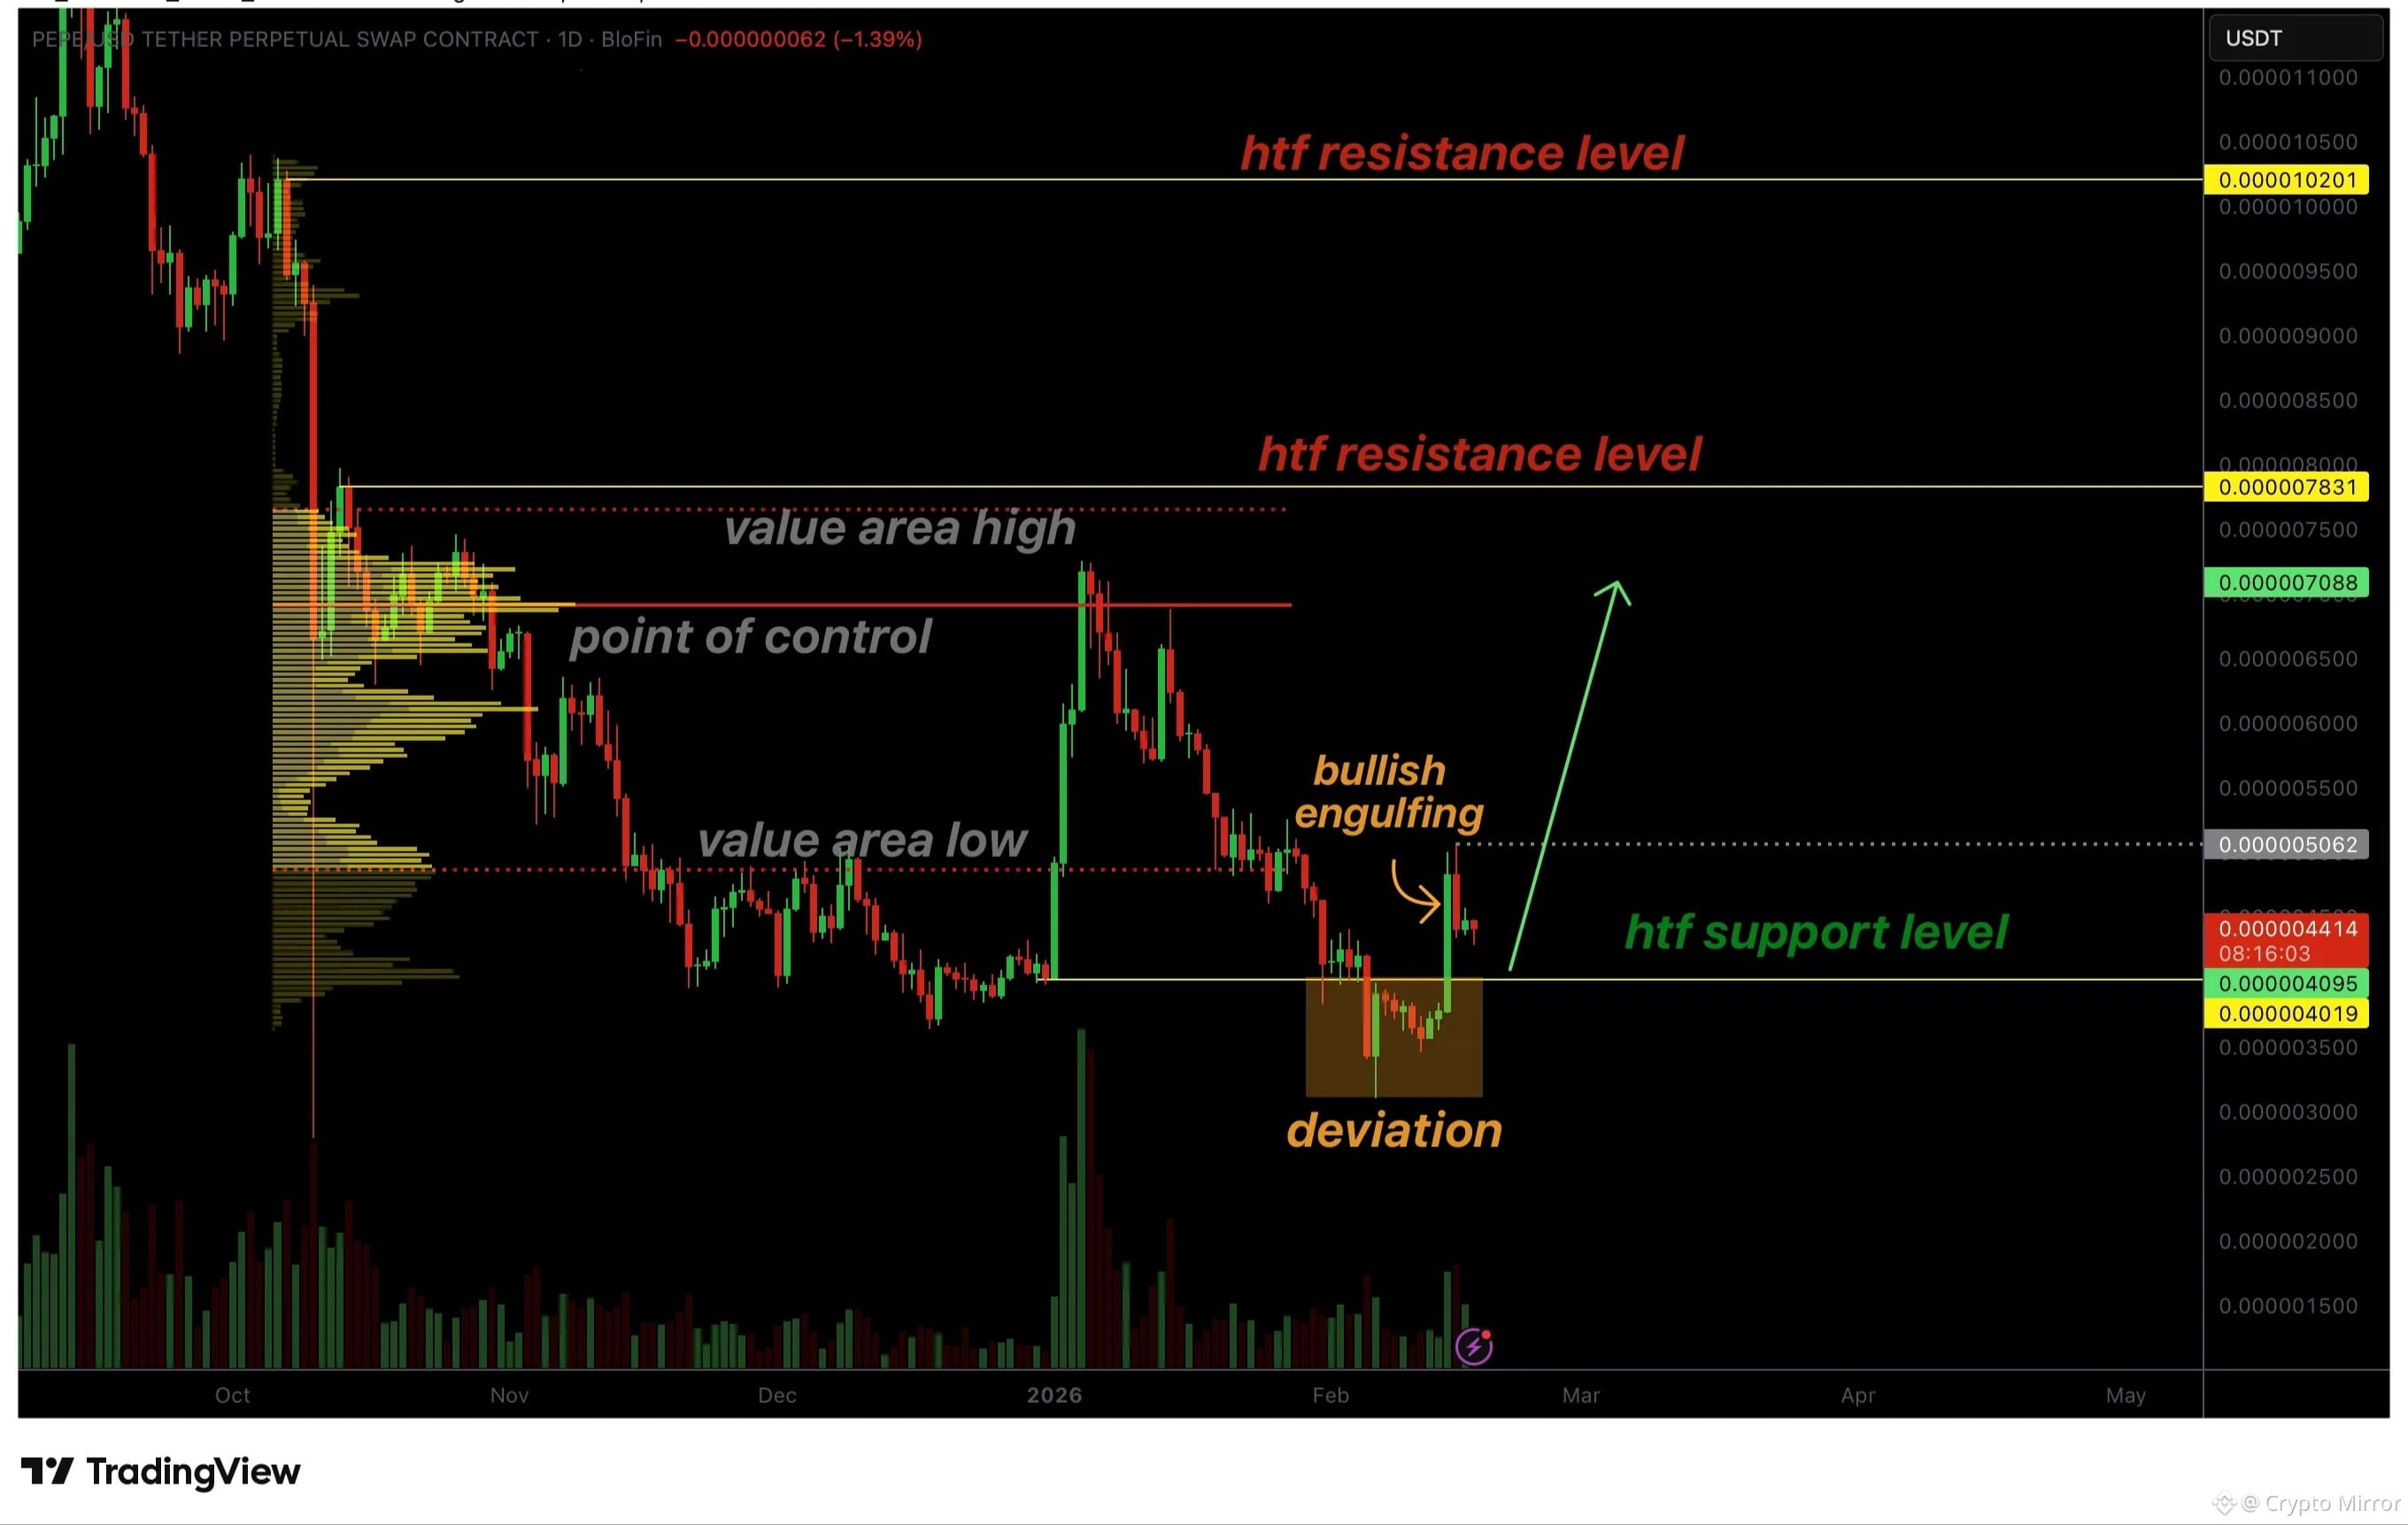
Pepe price key technical points
Deviation below high-timeframe support has been reclaimed, invalidating the breakdown
Bullish engulfing candle broke the sequence of lower highs, signaling a structure shift
Value area low reclaim is required, to open upside continuation toward resistance
PEPE’s recent move below high-timeframe support can be classified as a deviation, where price briefly trades below a key level to trigger stop-losses and capture liquidity before reversing sharply higher. This behavior is commonly seen near market bottoms, as weak hands are flushed out before stronger participants step in.
Rather than finding acceptance below support, PEPE quickly reclaimed the level, indicating that sellers were unable to sustain control. The speed of the reclaim is significant, as prolonged trading below support would have suggested genuine bearish continuation.
2
182
·
--
🎙️ 🔥Chat about Web3 cryptocurrency topics💖Knowledge dissemination💖Fraud prevention and avoidance💖Free teaching💖Co-build Binance Square🌆
End
03 h 23 m 49 s
9.6k
39
161
·
--
XRP price technical analysis
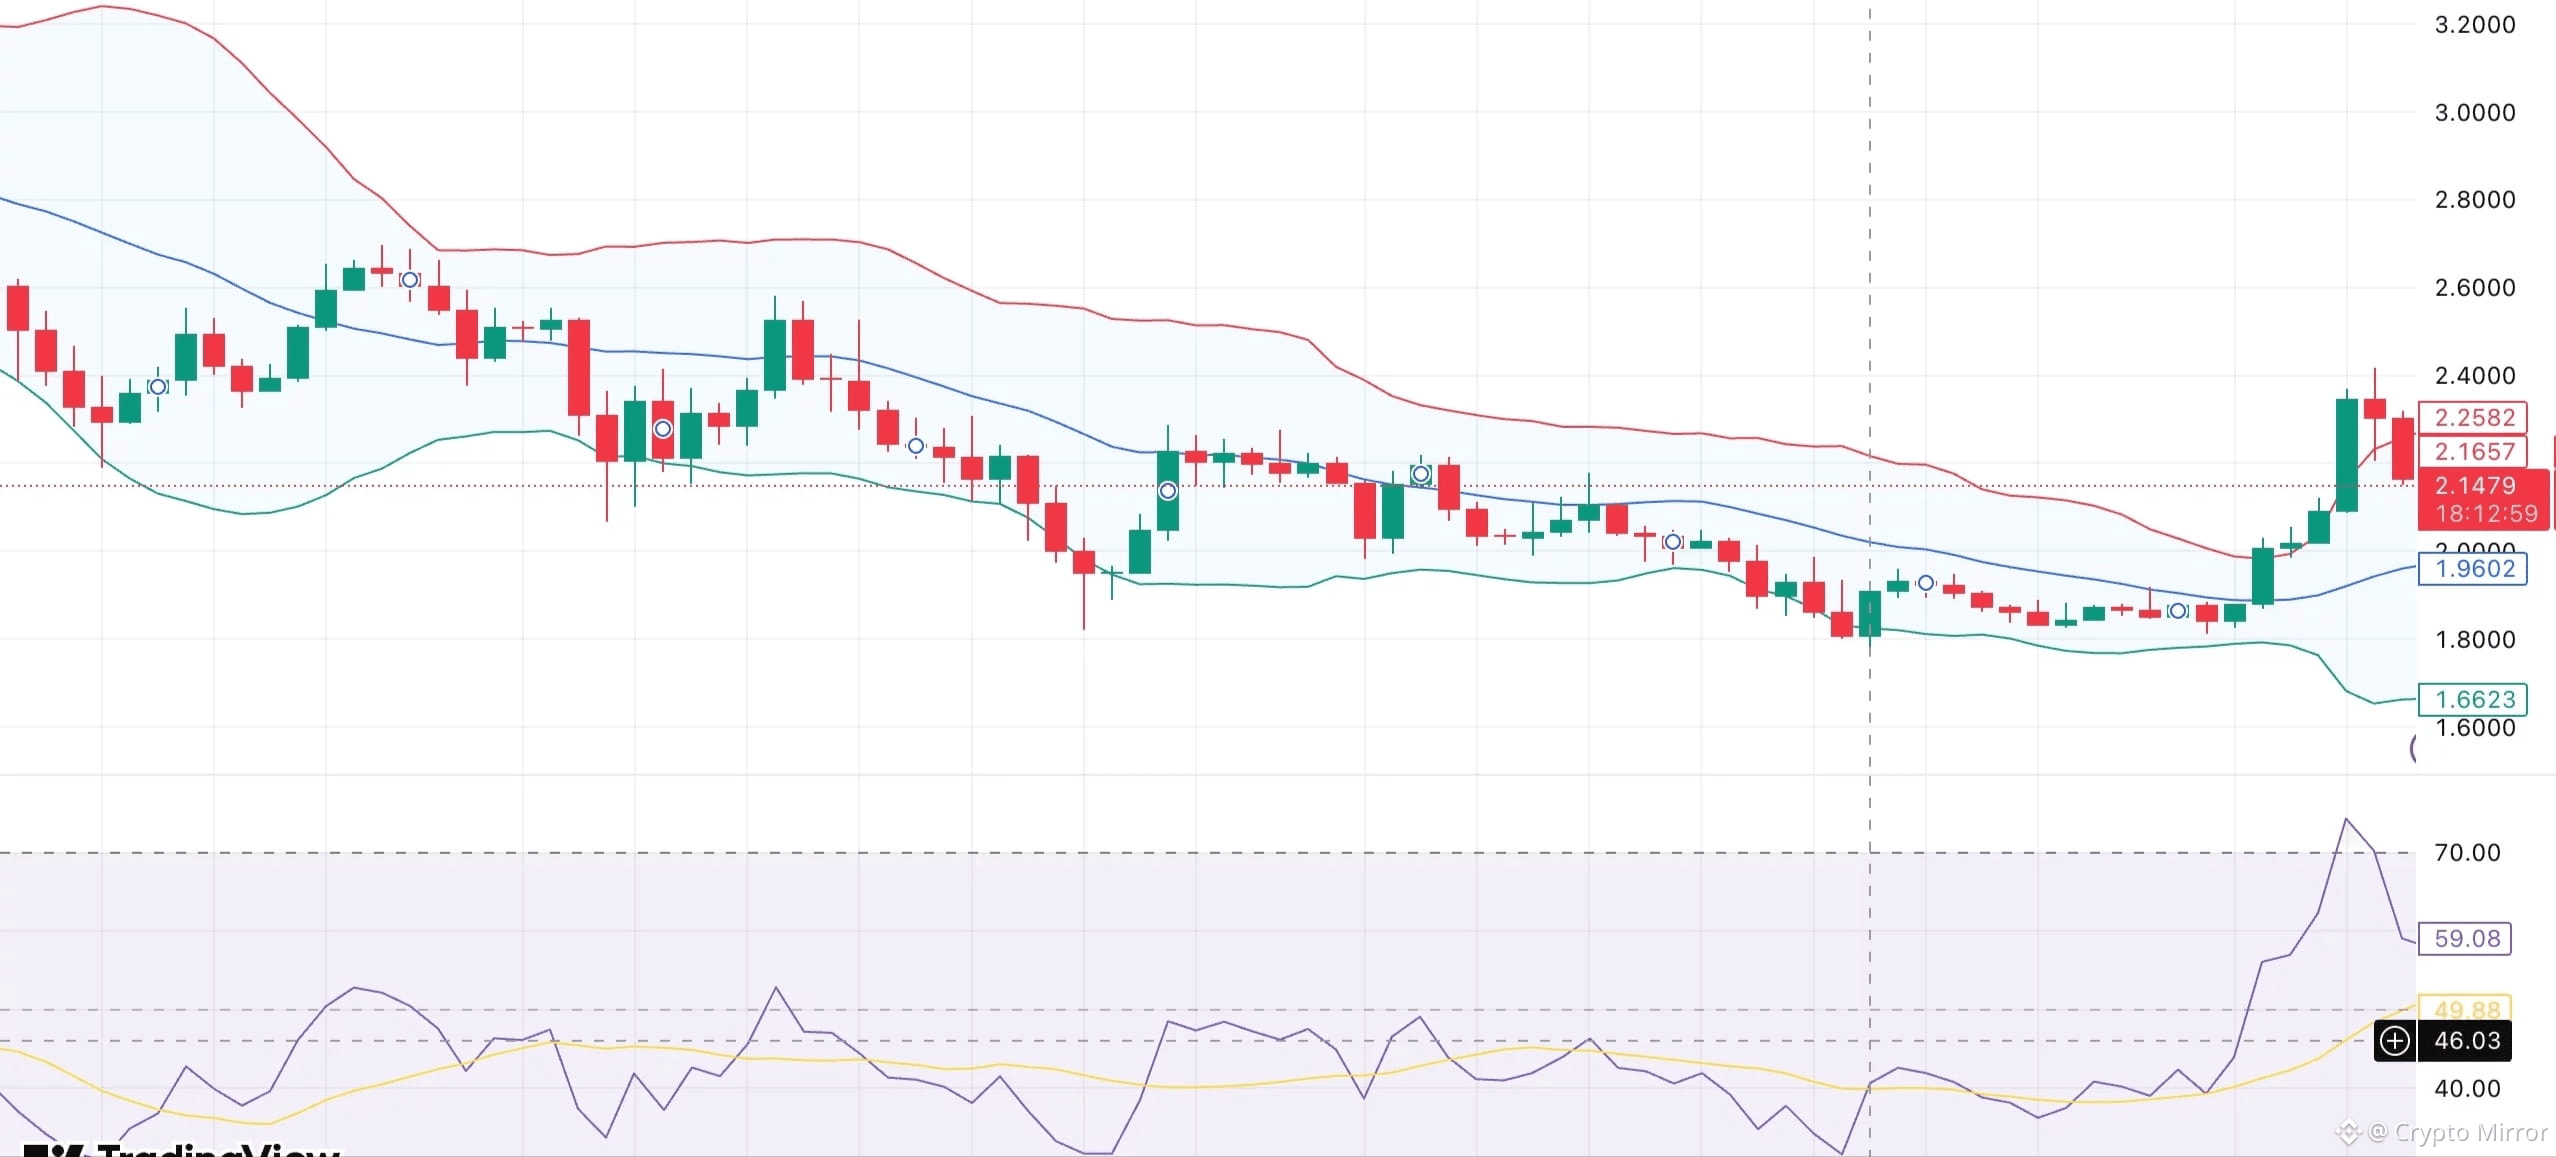
From a chart perspective, XRP is consolidating after breaking higher. The price recently moved above the $2.10–$2.15 zone, which had capped gains through late December.
That area is now acting as near-term support. XRP has also reclaimed its short-term moving average near $1.96, a level often watched for trend direction.
After weeks of sideways movement, the price has pushed above the middle Bollinger Band at $2.05, indicating improving momentum. XRP is currently testing the upper band at $2.26. That level could restrict future gains if volatility doesn’t pick up.
The relative strength index has climbed to 59, showing stronger momentum, but rallies in weaker trends often stall in this range. A higher low has formed near $1.88–$1.90, which supports the short-term structure.
As long as XRP holds above $1.96 on a daily close, the setup remains constructive. A clean move above $2.26 would put $2.40 to $2.50 back into focus. If support fails, attention would shift back toward $1.85, with deeper downside near $1.66.
#XRPRealityCheck #XRPUSDT🚨
3
589
·
--
BNB falls below $900 even after network upgrade, ecosystem developments as market declines
The BNB Chain's layer-2 network, opBNB, recently completed a major upgrade, the Fourier hard fork, which doubled transaction throughput.
What to know:
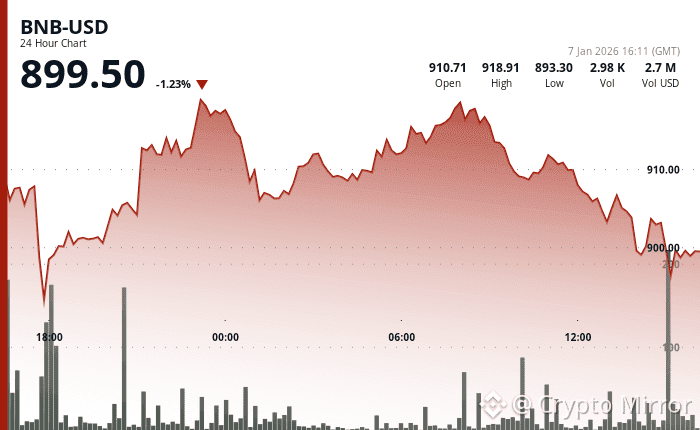
BNB fell below $900 amid a broader market decline, even after recent technical upgrades and ecosystem developments on the BNB Chain.
The BNB Chain's layer-2 network, opBNB, recently completed a major upgrade, the Fourier hard fork, which doubled transaction throughput and cut block times in half.
To regain bullish momentum, BNB needs to break out of its current downtrend and reclaim resistance levels near $906, otherwise it may face further pressure toward $892.
BNB slipped below $900 after a day of steady losses and heavy selling in the entire cryptocurrency market, despite several technical upgrades and ecosystem developments across the BNB Chain.#WriteToEarnUpgrade #BNBChainEcosystemRally #ZTCBinanceTGE
1
4
710
·
--
Ethereum price key technical points
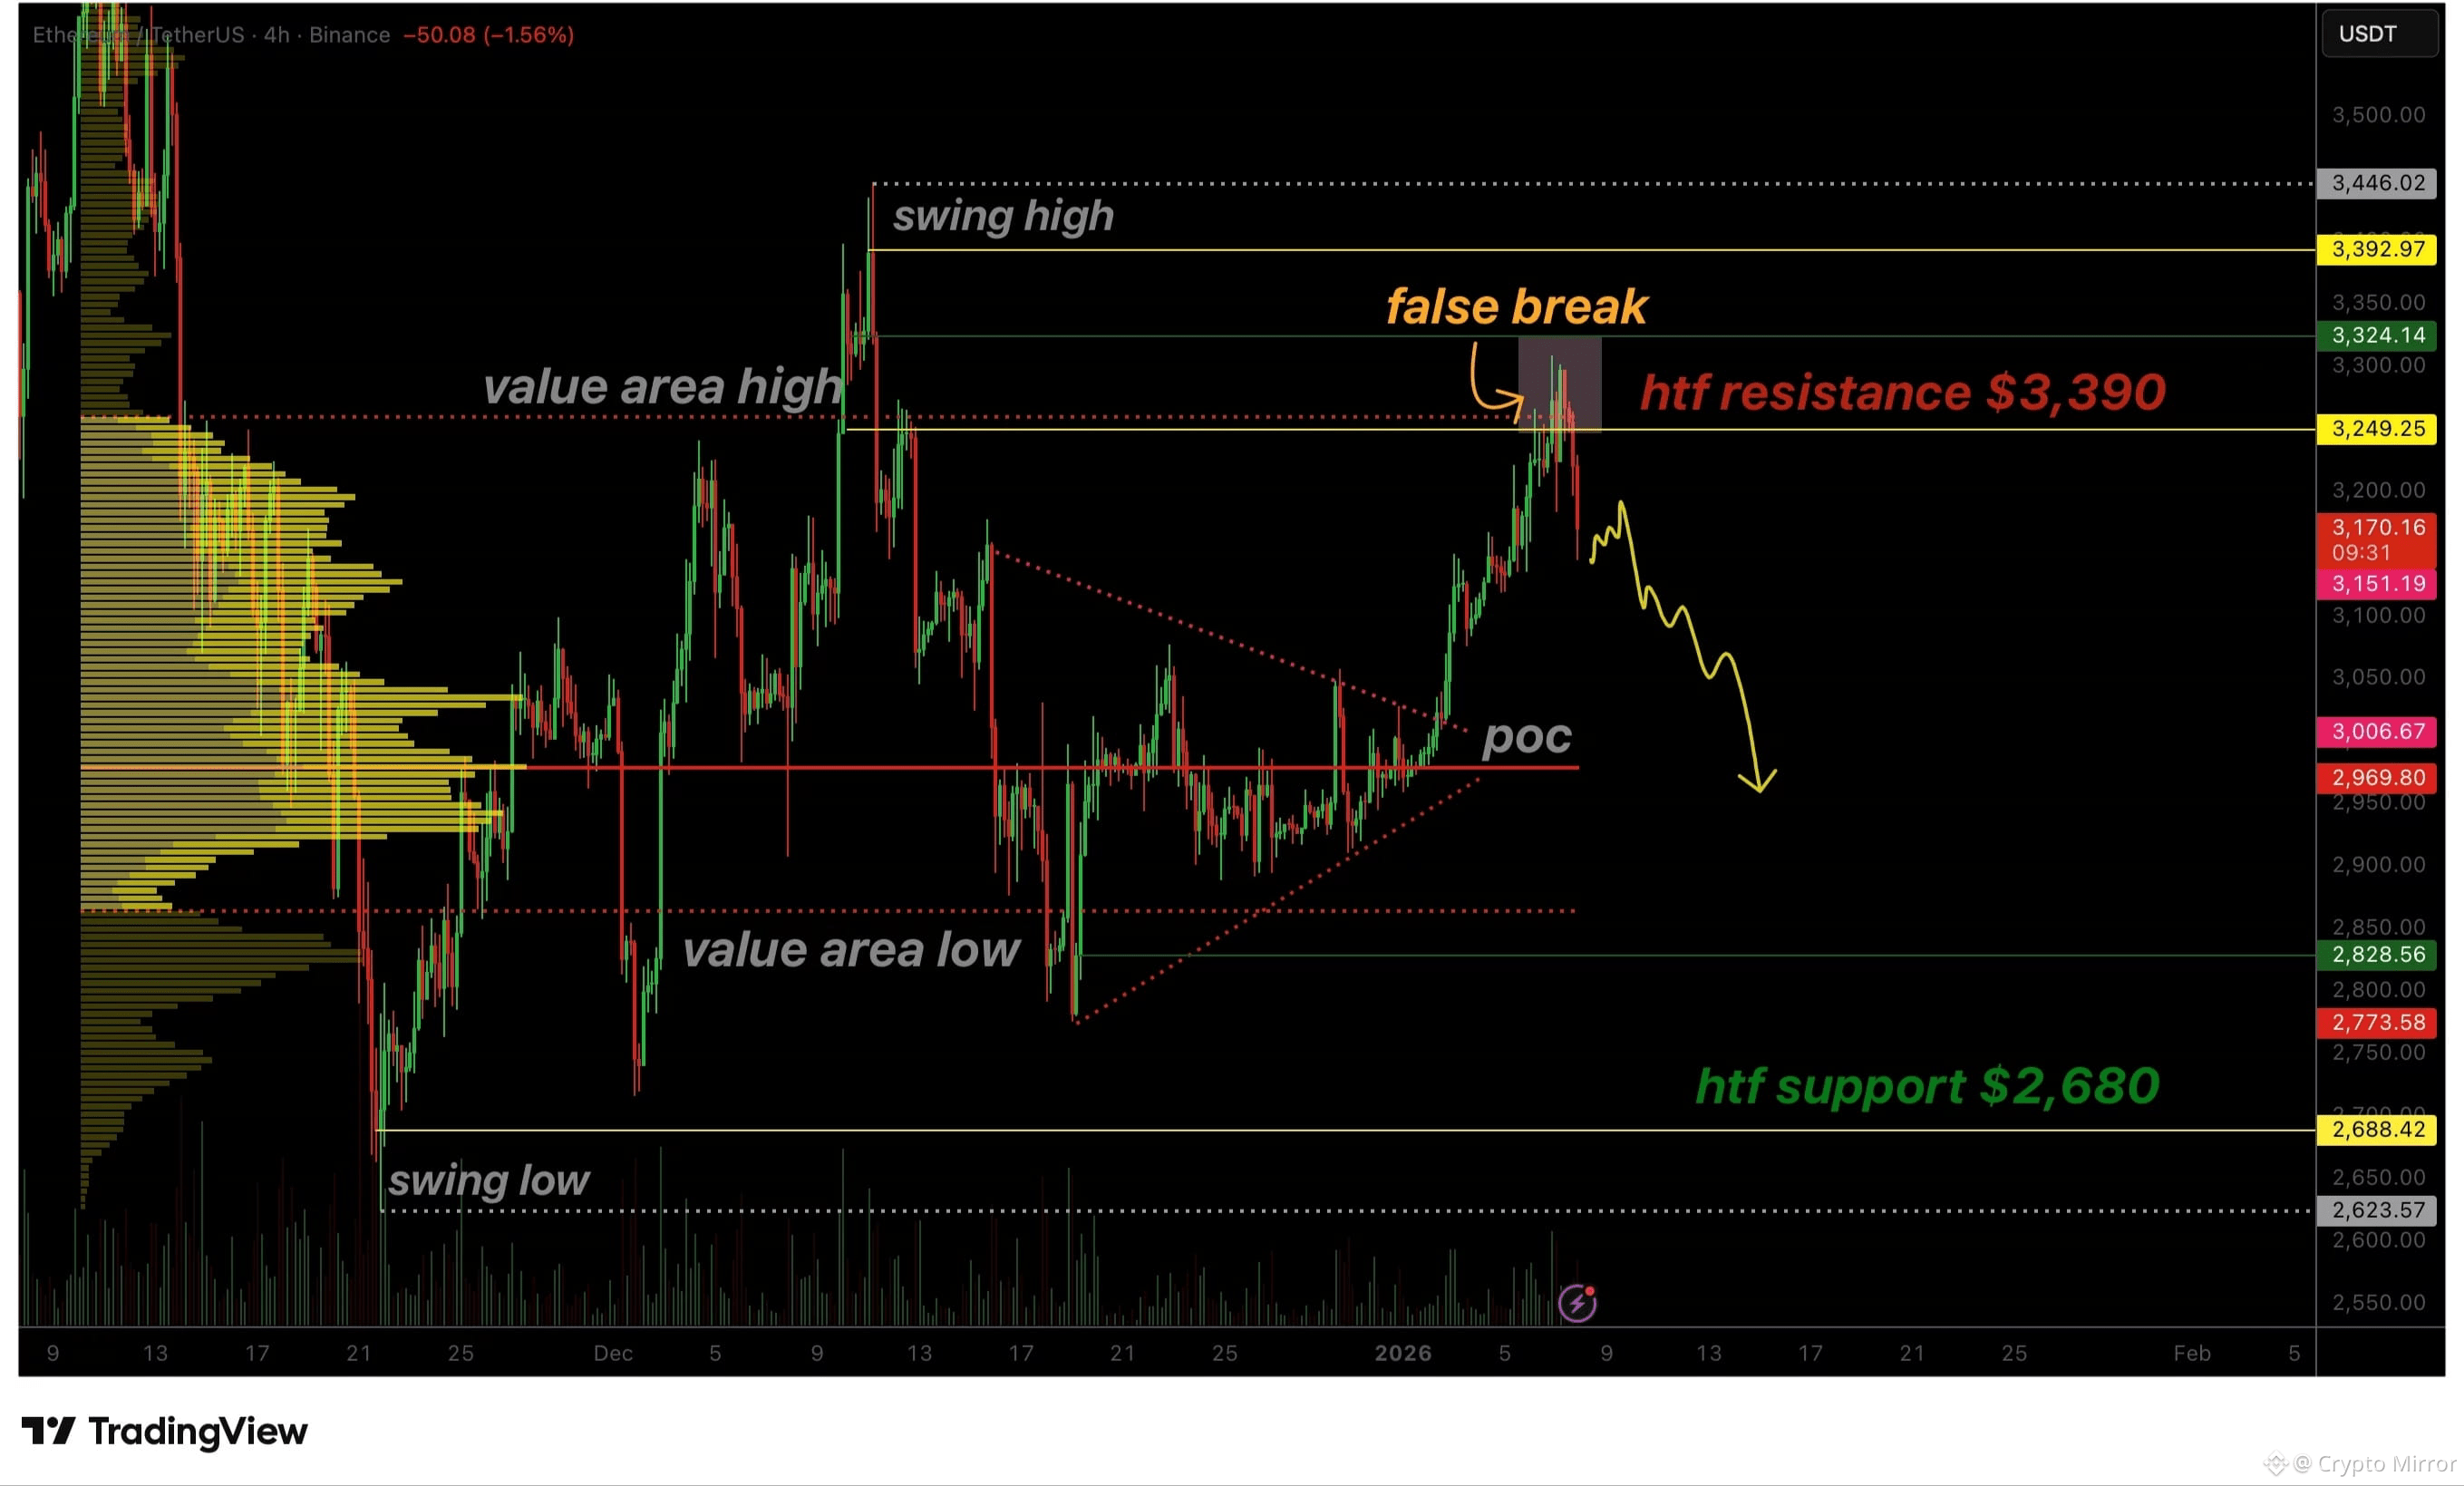
$3,300 – High-confluence resistance and failed breakout zone
Value Area High (VAH) – Acting as a major supply barrier
$2,680 – High-time-frame support and downside rotation target
#ETHWhaleWatch #WriteToEarnUpgrade #BinanceHODLerBREV
Ethereum price key technical points
$3,300 – High-confluence resistance and failed breakout zone
Value Area High (VAH) – Acting as a major supply barrier
$2,680 – High-time-frame support and downside rotation target
#ETHWhaleWatch #WriteToEarnUpgrade #BinanceHODLerBREV
$3,300 – High-confluence resistance and failed breakout zone
Value Area High (VAH) – Acting as a major supply barrier
$2,680 – High-time-frame support and downside rotation target
#ETHWhaleWatch #WriteToEarnUpgrade #BinanceHODLerBREV
3
293
·
--
Bitcoin price key technical points
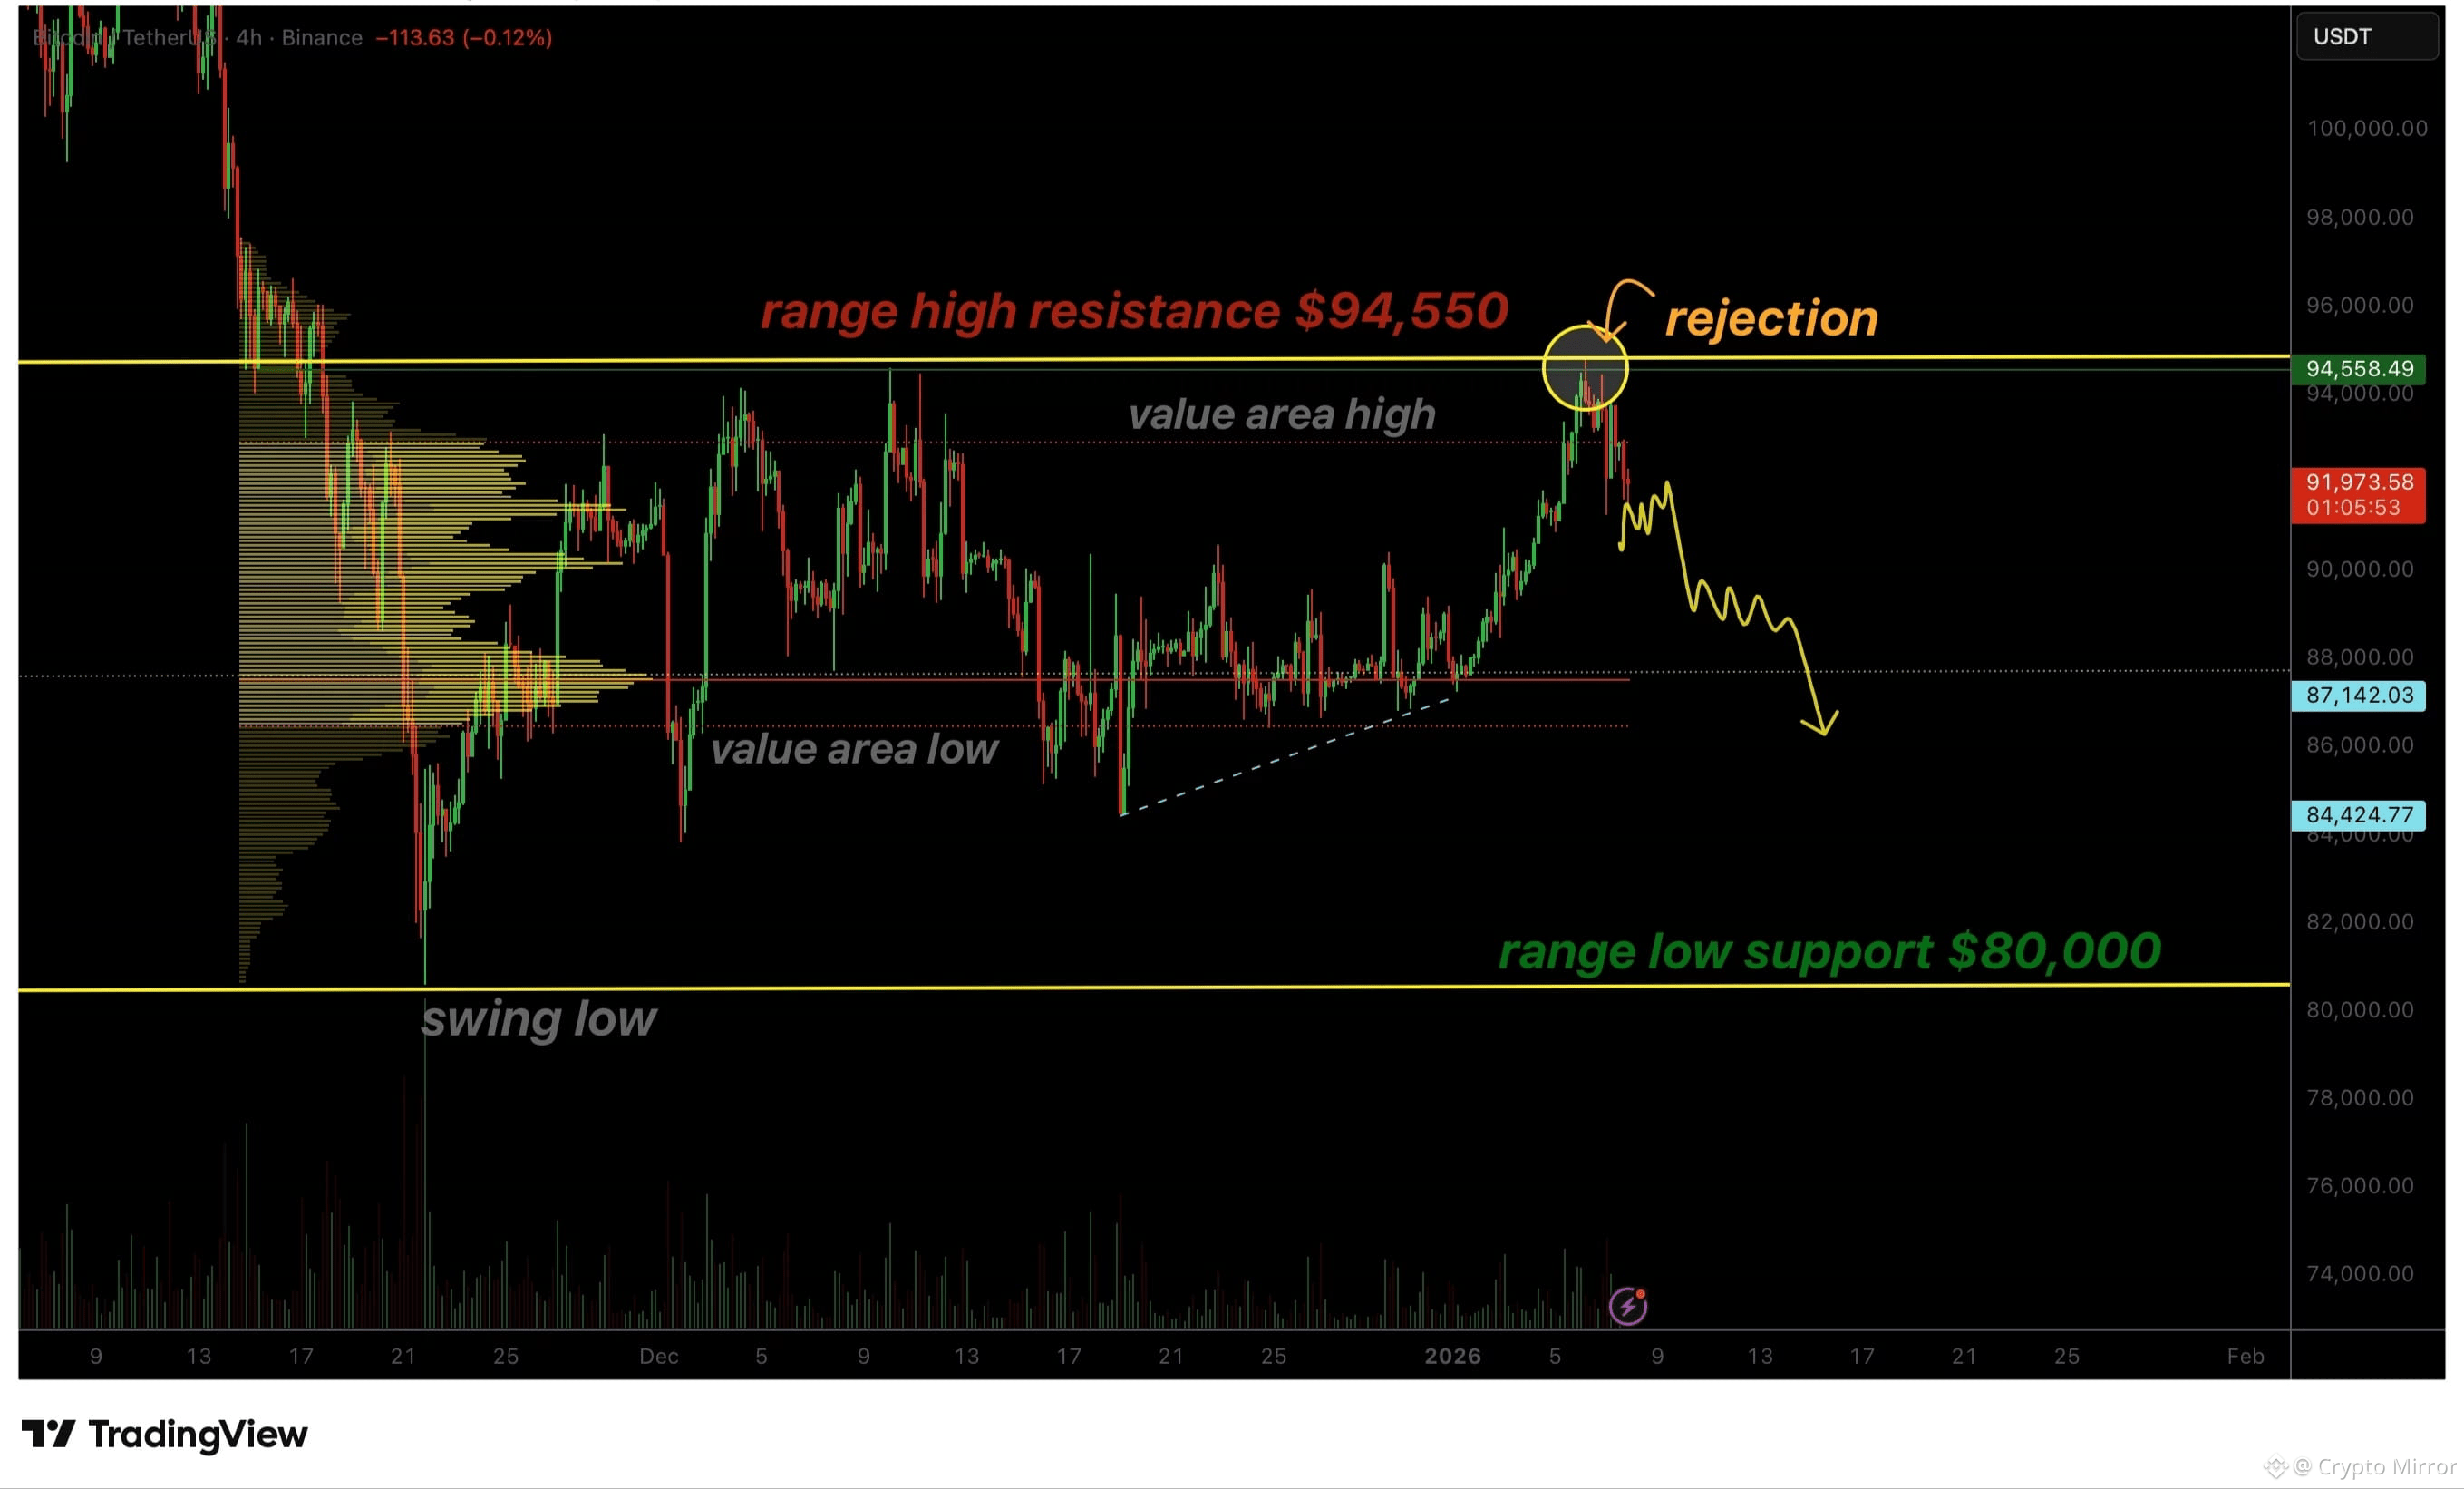
Repeated resistance rejections: Bitcoin has failed multiple times to reclaim higher resistance levels.
Weak rally characteristics: The current upside move lacks strong bullish volume and follow-through.
$80,000 range low in focus: A confirmed rejection would likely trigger a rotation toward this level.
Bitcoin has repeatedly tested the $95,500 resistance region, but each attempt has resulted in rejection rather than acceptance. These failures indicate that sellers remain active at higher prices and that demand has not been strong enough to absorb supply. In trending markets, resistance levels are typically reclaimed quickly and decisively.
In Bitcoin’s case, the lack of follow-through reinforces the idea that the market is still consolidating rather than preparing for continuation higher.
Each rejection from resistance further validates this zone as a ceiling within the current trading range. As long as price remains capped below this area, the upside remains limited and prone to reversal. #ZTCBinanceTGE #BinanceHODLerBREV #ZTCBinanceTGE #
1
199
·
--
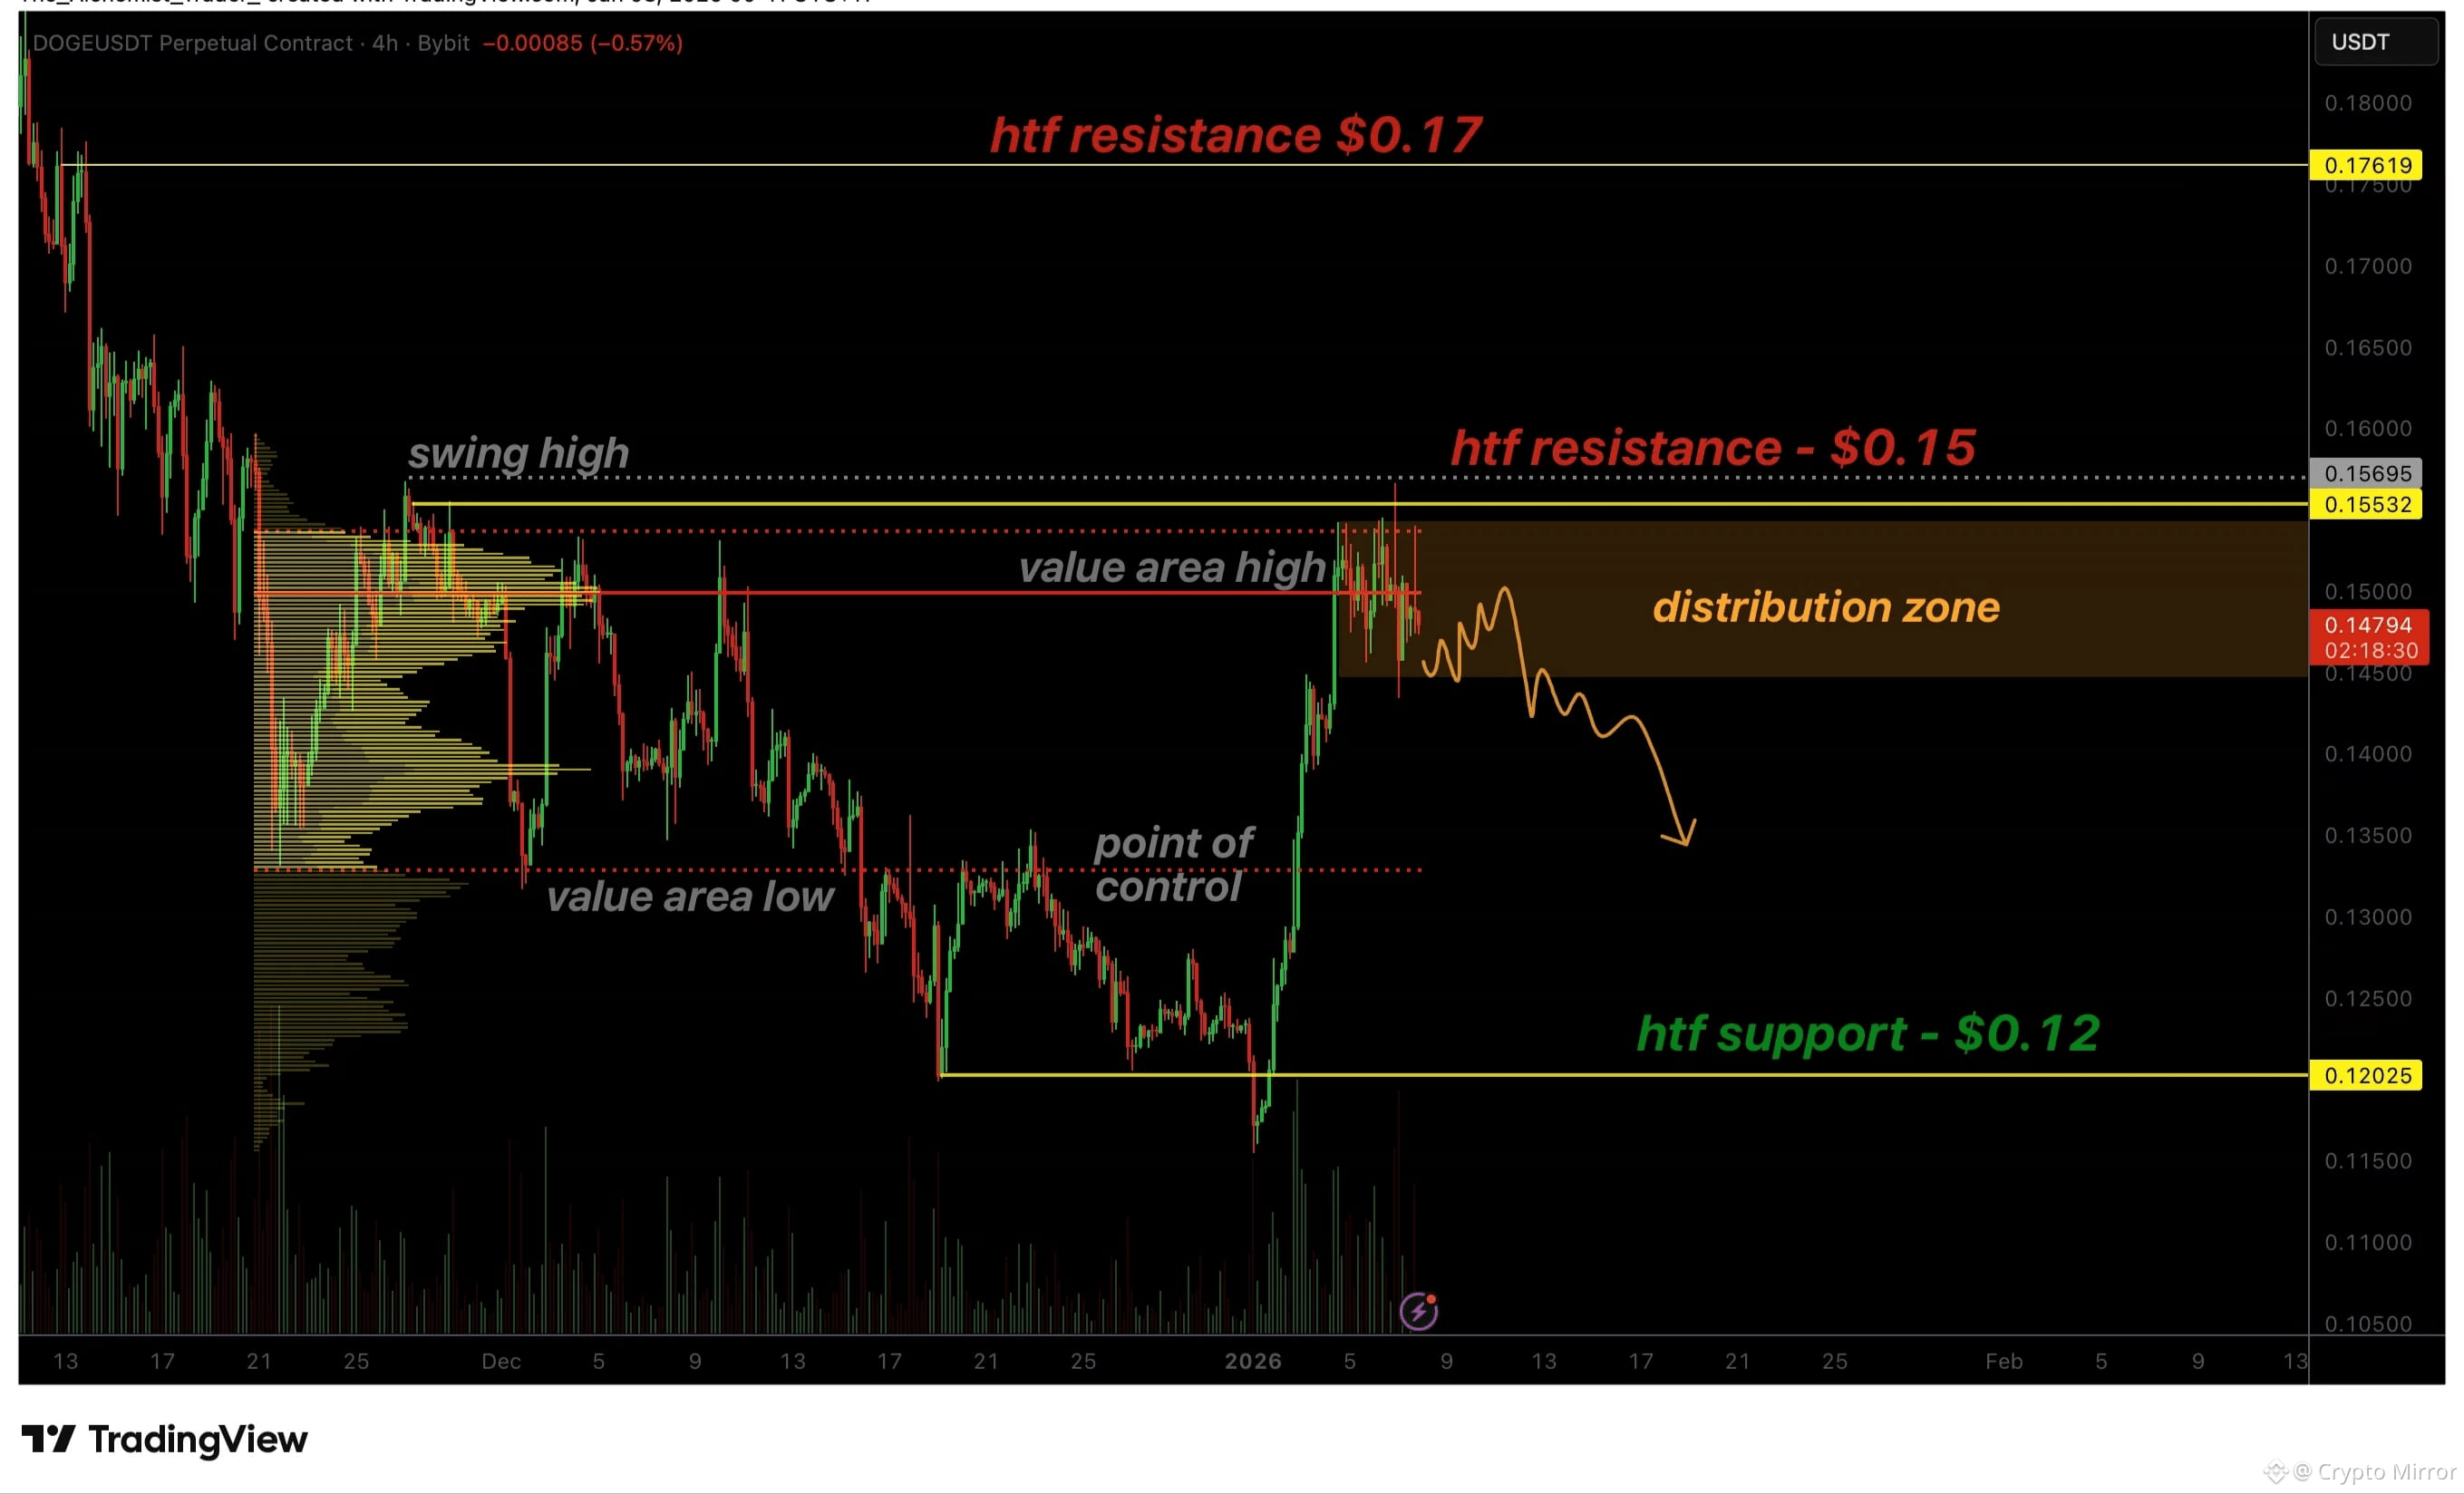
Dogecoin price key technical points
$0.15 is high-confluence resistance: The level aligns with the value area high and a prior swing high.
Repeated rejections signal distribution: Multiple failures at resistance suggest supply is outweighing demand.
Downside rotation risk increases: a pullback toward the value-area low and the 0.618 Fibonacci level is increasingly likely.
The current move higher originated from $0.12 support, where buyers stepped in decisively to defend price. That rebound carried DOGE through the mid-range and into the upper boundary of value. However, as price approached $0.15, upside momentum slowed markedly. Instead of expanding higher, price has begun to stall, often the first indication that buyers are losing control.
#ZTCBinanceTGE #BinanceHODLerBREV #WriteToEarnUpgrade
1
510
·
--
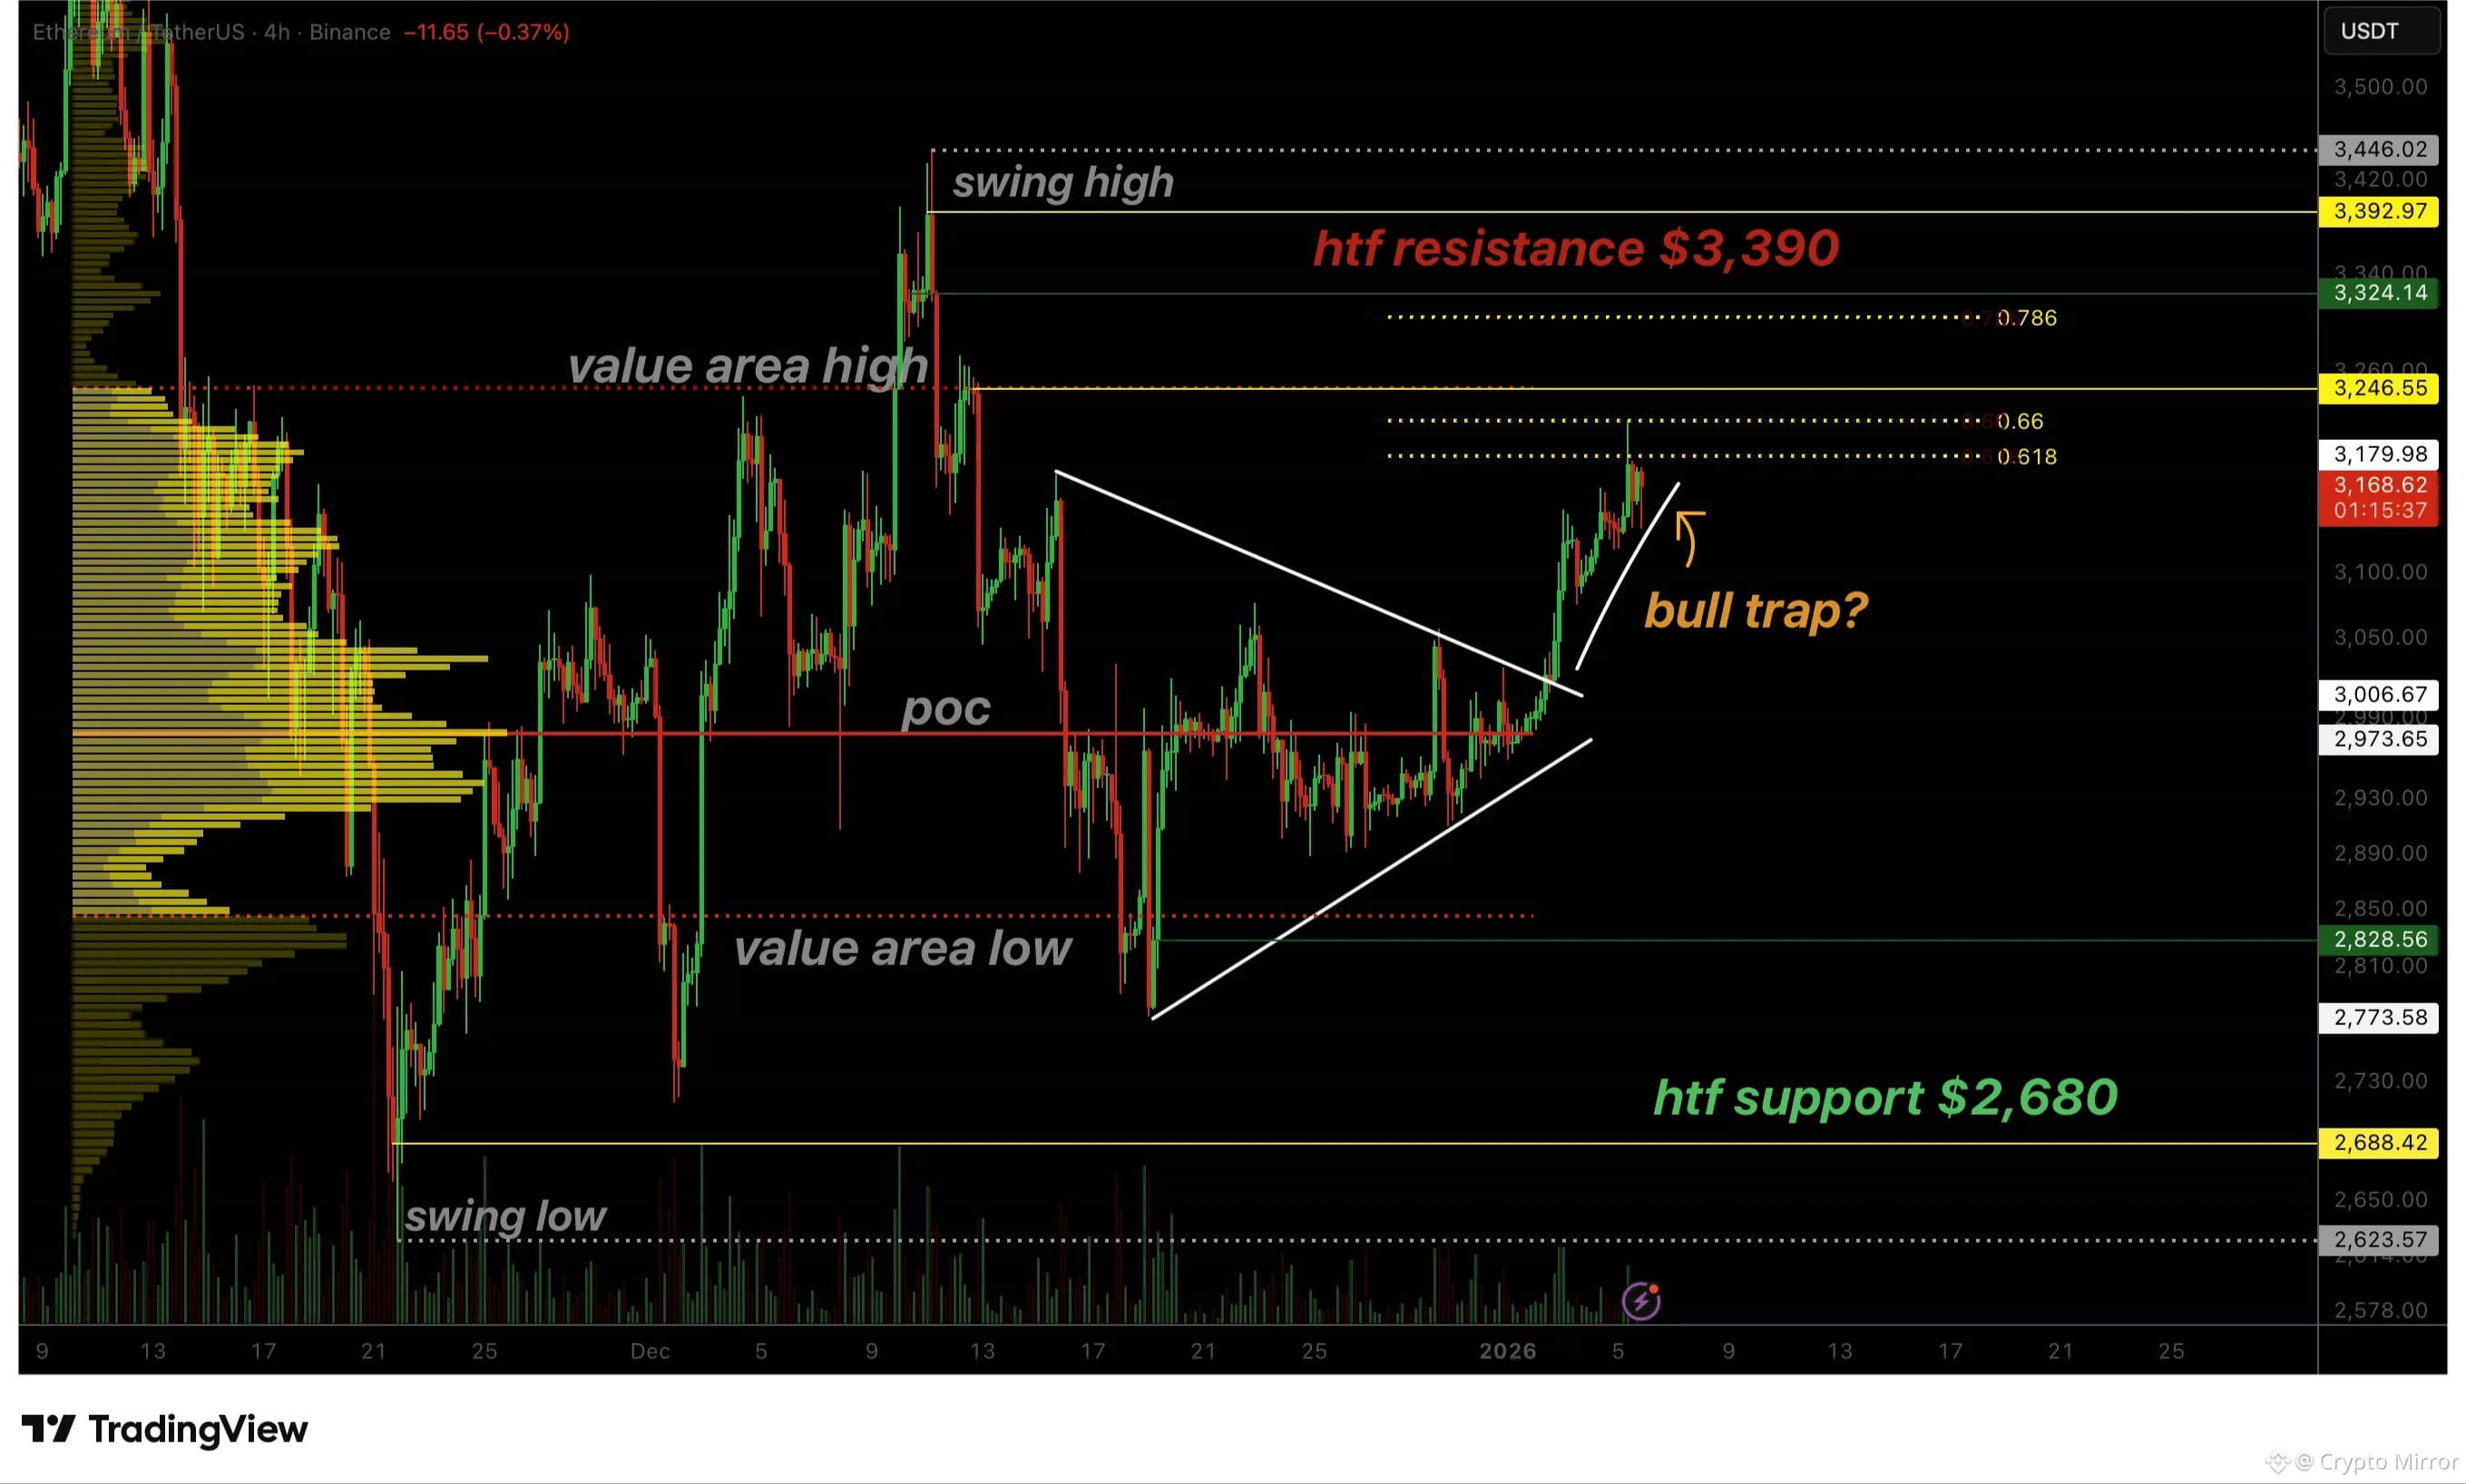
Ethereum price key technical points
Triangle breakout lacks volume confirmation: The move higher has not been supported by strong buying pressure.
Major resistance caps price: The 0.618 Fibonacci, value area high, and local resistance are converging overhead.
Bull trap risk increases below resistance: Failure to reclaim this zone could trigger a rotation toward lower support.
From a structural standpoint, Ethereum’s breakout from the triangle apex is technically valid. Price compressed into a narrow range, volatility declined, and a directional expansion eventually followed. However, the strength of that expansion is critical when assessing breakout reliability. In this case, volume failed to expand meaningfully alongside price, which weakens the bullish signal.
In strong continuation moves, breakouts are typically accompanied by an influx of participation, reflecting conviction from buyers. Ethereum’s breakout, by contrast, has struggled to attract sustained demand. This lack of follow-through suggests that the move may be driven more by short-term positioning than by a broader shift in market sentiment.
3
283
·
--
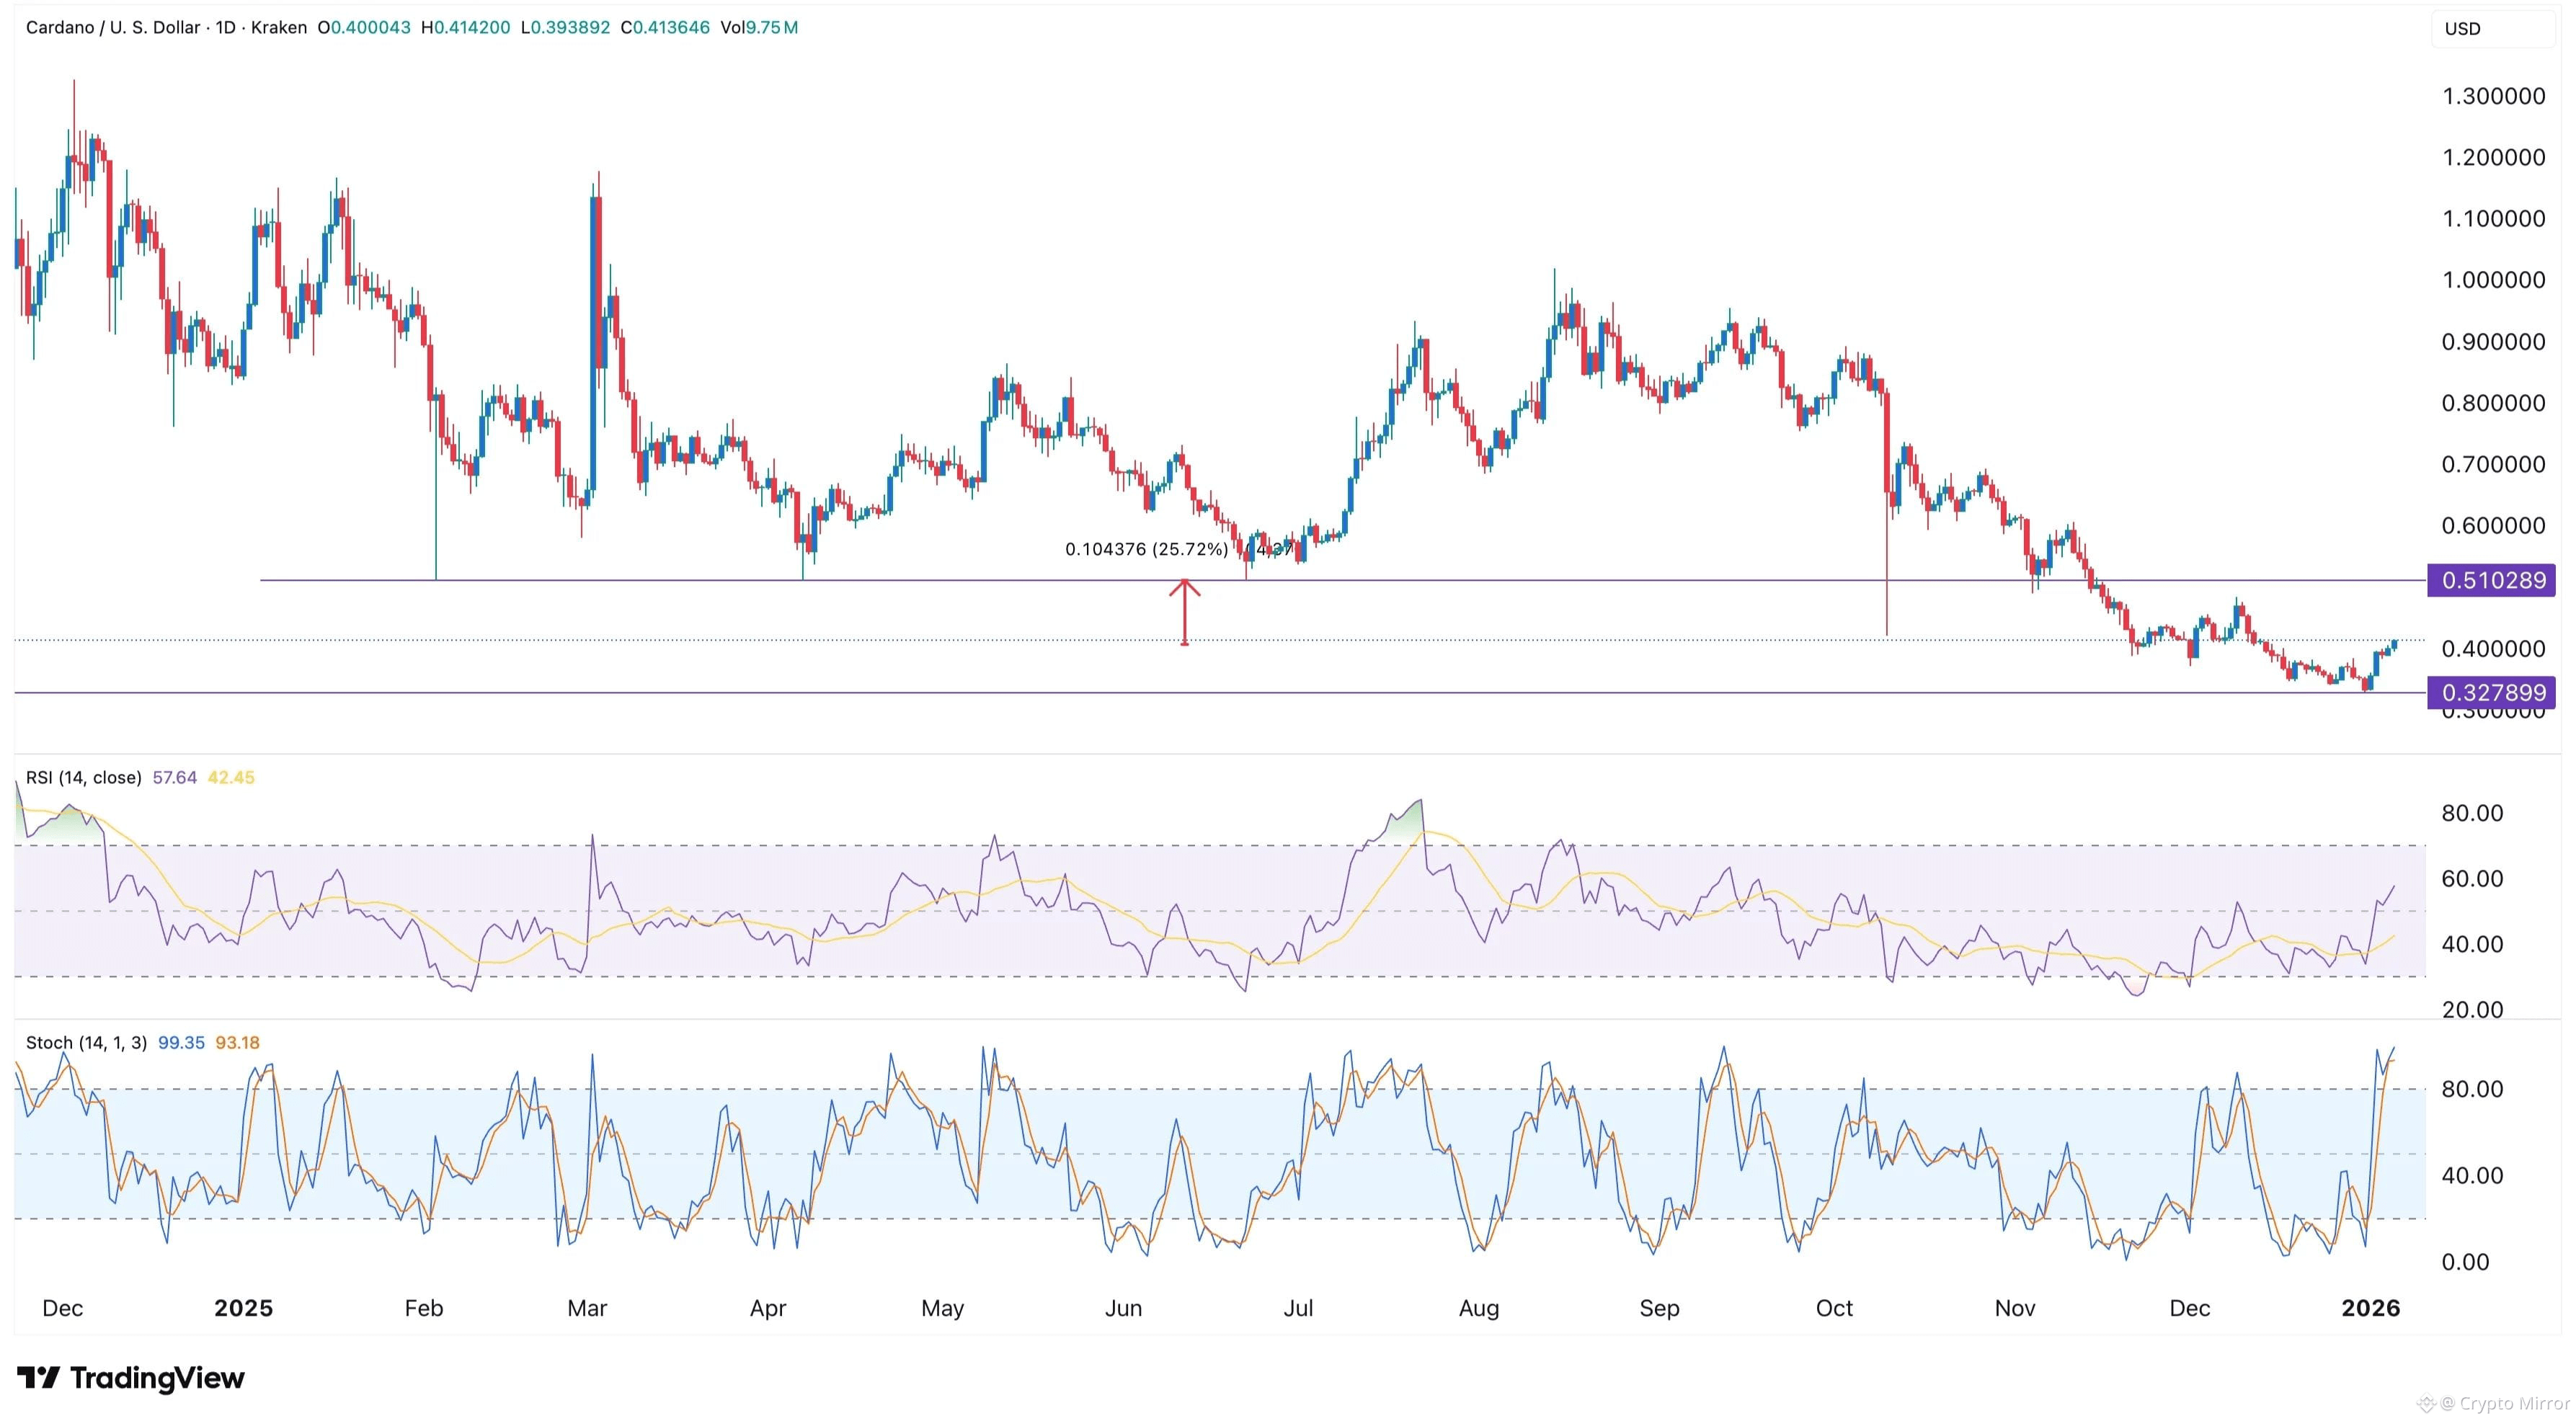
Cardano price technical analysis
The daily timeframe chart shows that the ADA price bottomed at $0.3278 on Dec. 31 and is currently $0.4125. This rebound has coincided with that of Bitcoin and other altcoins.
The Relative Strength Index has moved above the neutral point at 50, while the Stochastic Oscillator has moved to the overbought level.
However, the token remains below the 50-day and 100-day Exponential Moving Averages and the Supertrend indicator. That is a sign that bears remain in control for now.
However, the token will likely rebound and possibly retest the key resistance level at $0.5100, which is about 25% above the current level. This target is the lowest level in February, April, and June last year.
1
340
·
--
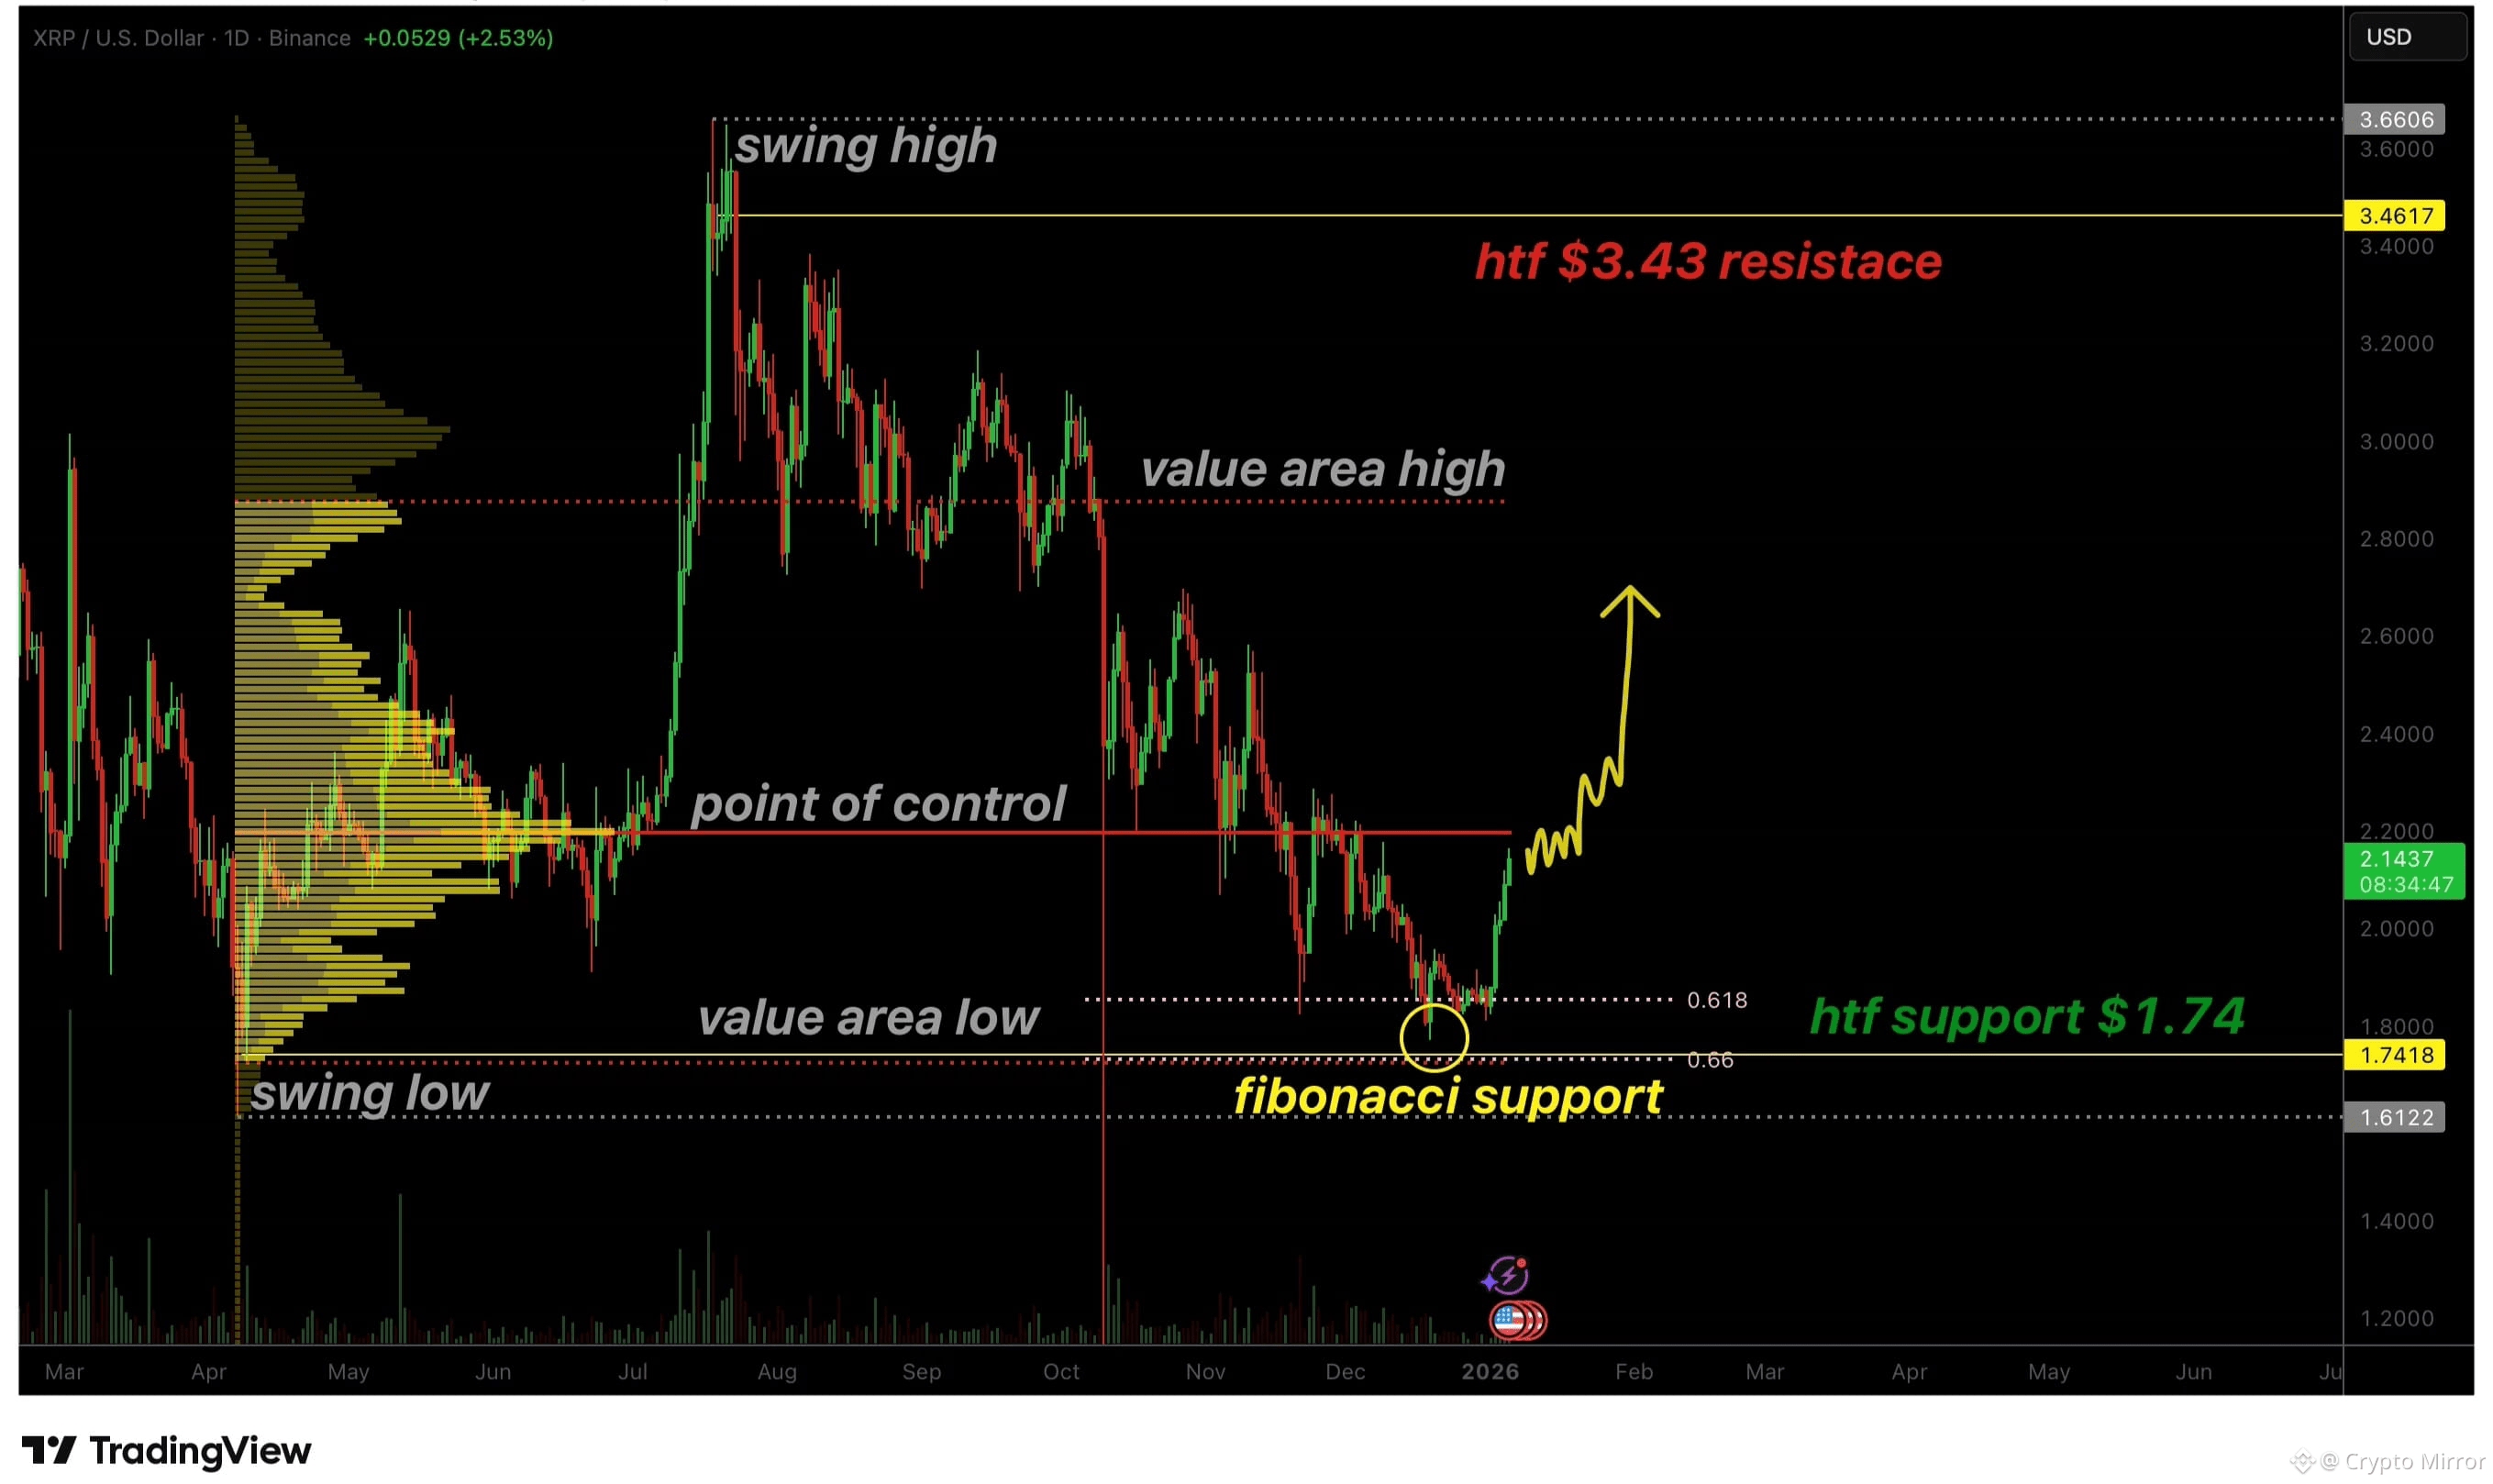
XRP price key technical points
Strong confluence at $1.74 support: Fibonacci and value area low aligned to create a high-probability bounce zone.
Point of control is the key resistance: A reclaim is required to confirm a bullish momentum shift.
Bearish structure still intact: Lower highs and lower lows remain until resistance is decisively broken.
The $1.74 region has proven to be a technically significant area for XRP. The confluence between the 0.618 Fibonacci retracement and the value area low often attracts buyers looking for discounted entries within broader ranges, particularly as institutional interest grows following recent XRP ETF filing developments. In this case, price reacted decisively, producing a rally that suggests selling pressure was absorbed effectively.
From a price action perspective, this response reflects improving demand dynamics. Instead of continued acceptance below support, XRP quickly rotated higher, signaling that buyers were willing to defend this level aggressively. Such reactions often mark short-term inflection points, particularly when they occur at high-time-frame technical confluence.
6
471
·
--
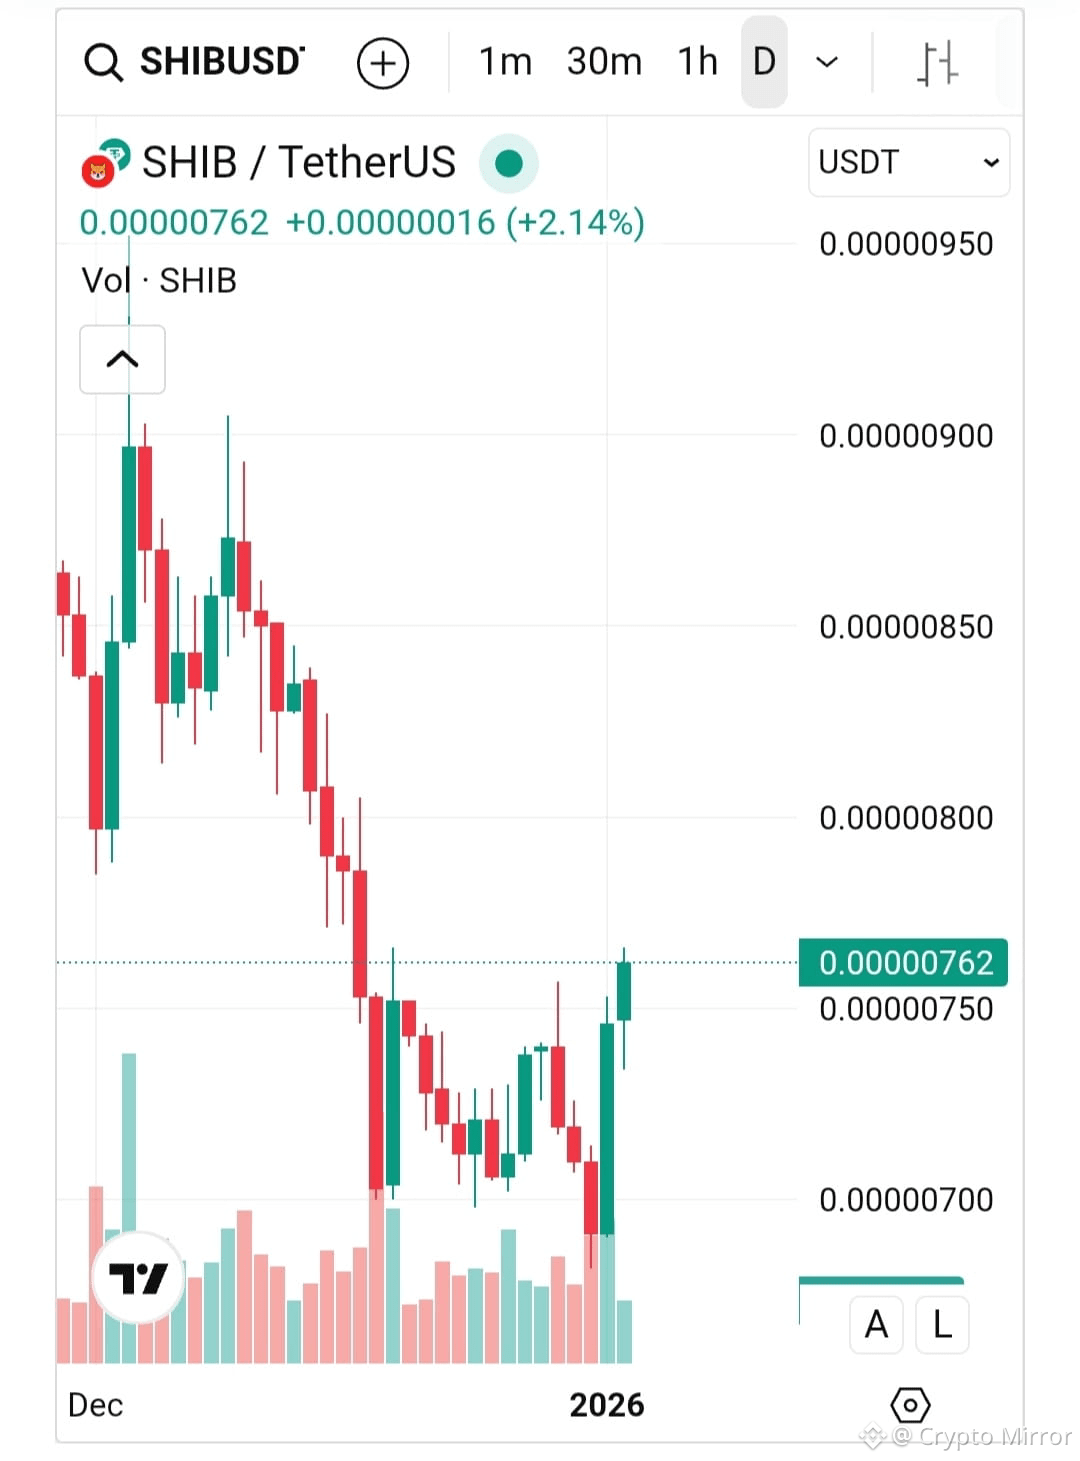
Shiba Inu price today
The current price of Shiba Inu (SHIB) is $0.0000075, as of Jan 2, 2026. Over the last 24 hours, the price has moved by 6.44%, with a change of 0.52% in the past hour. For longer-term performance, the price has varied by 4.3% over the last 7 days and by -14.68% in the past month.
Market update
The 24-hour trading volume is $133,422,737, and price fluctuations during this time have ranged between a low of $0.000007 and a high of $0.0000075. The all-time high for Shiba Inu was $0.0000862 on Oct 28, 2021, while the all-time low was $0.0000000000564 on Nov 28, 2020.
Market ranking and capitalization
Shiba Inu holds a market rank of #36, with a market capitalization of $4,406,277,222. Its fully diluted valuation stands at $4,408,195,172.
Supply overview
The circulating supply of Shiba Inu is $589,244,062,282,068, out of a total supply of $589,500,546,595,230.
Price changes and historical data
Over the last year, Shiba Inu has experienced a price shift of -66.25%, while over the last 30 days, the price has seen a -14.68% change. The price change over the last 200 days stands at -38.86%.
These metrics are updated every minute to ensure real-time accuracy, helping you stay informed about the latest trends and market movements for Shiba Inu.
6
347
Log in to explore more content
Join global crypto users on Binance Square
⚡️ Get latest and useful information about crypto.
💬 Trusted by the world’s largest crypto exchange.
👍 Discover real insights from verified creators.
Email / Phone number
Trending Topics
BinanceProcesses$4.65BWithdrawals
532 views
26 Discussing
Binance Processes $4.65 Billion in Withdrawals After Reopening, Net Outflow of $3.64 Billion Equals 2.1% of Its $171 Billion in Assets
Binance News
·15 Likes
·4.2k views
WithdrawalsBack: 15 networks live
3,101 views
81 Discussing
BinanceUpdatesProofofReservesAddresses
68,569 views
1,149 Discussing