CryptoJack07

Learned From Mistakes So You don't have to make the same mistakes. Follow me for deep analysis and Trade tips.
34 Following
292 Followers
1.1K+ Liked
Posts
PINNED
·
--
Article
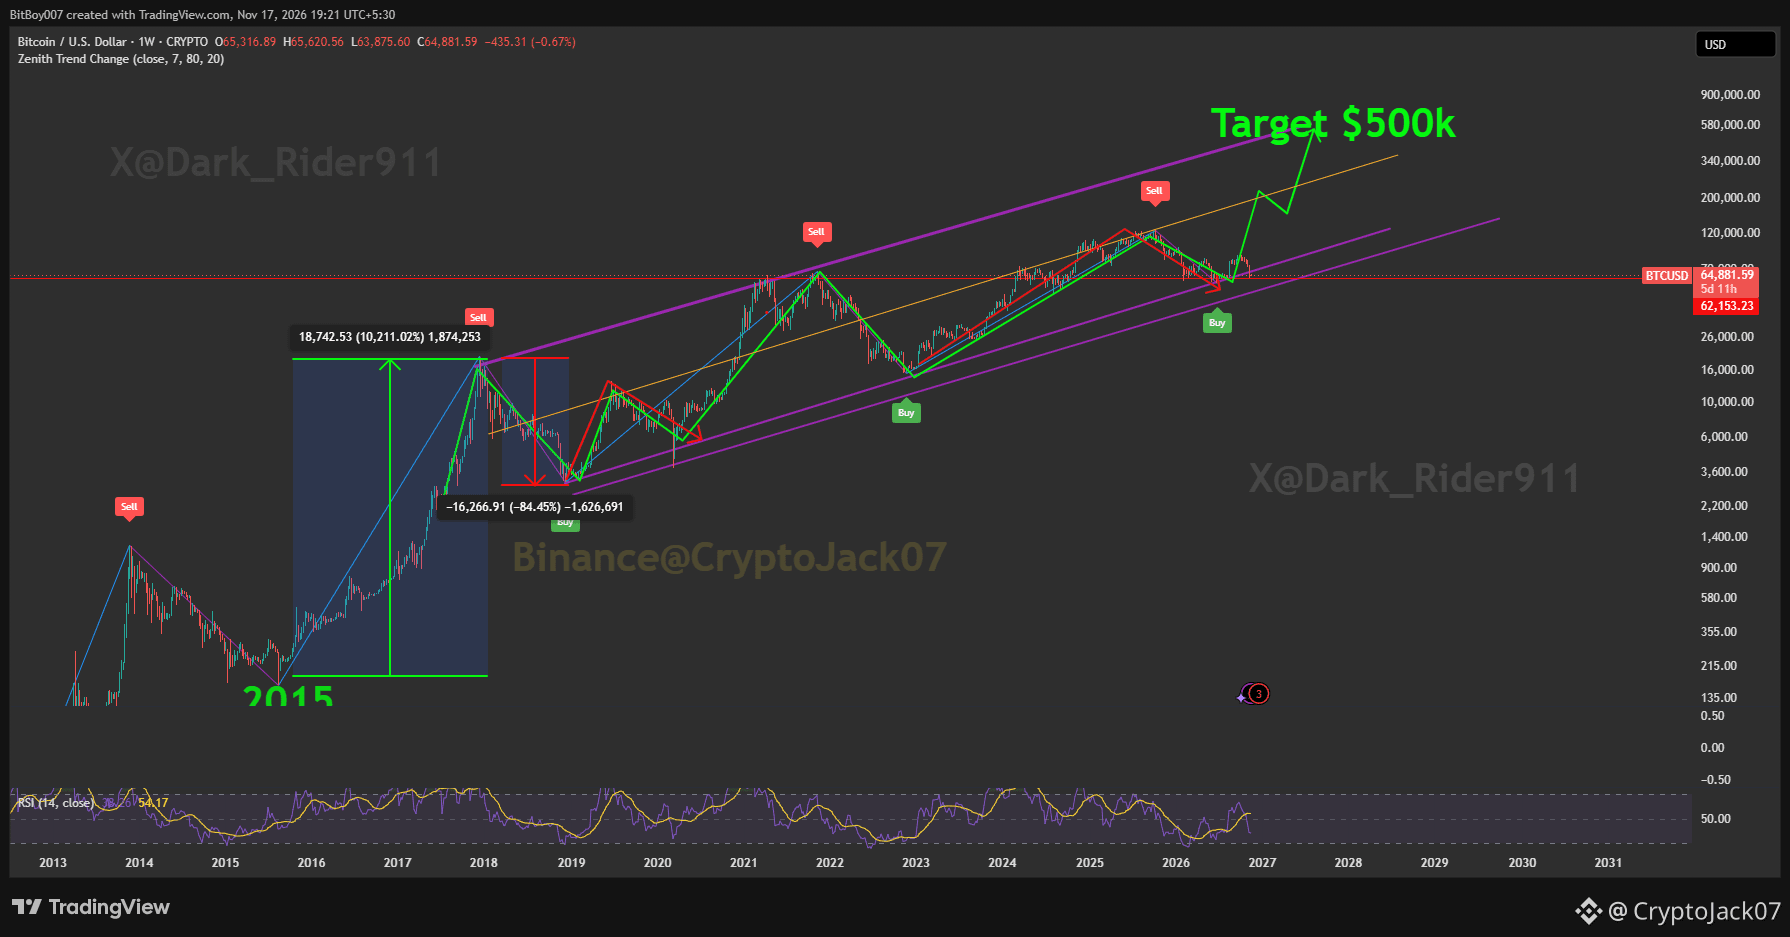
#Bitcoin FLASH CRASH OR TAKE OFF TO 500K? This Is What Grok has to say About My Chart Drawing...$BTC I don't need to explain anything here, this chart speaks the volume but still many thinks we are going lower cus that is what "13 year cycle" has taught us. However, the 13 year cyclers conveniently ignores the 13 year trendline. So I asked grok what he thinks of the chart without giving any hint... and this is what he think and Grok thinks exactly like I do about this cycle. Here is What Grok has to say about the chart. Based on the chart you shared (weekly BTC/USD from BitBoy007 on TradingView, as of April 17, 2026), here's my clear read:We are not in a “going down” phase right now. The chart is painting a very specific setup: we are sitting right on a major long-term purple trendline support, exactly where the two previous red circles were marked in earlier cycles (one around late 2019/early 2020 and another in 2022). Those red circles were major bounce points in the past — price touched the lower purple support, held, and then launched the next big leg higher. The current red circle on the right (around the ~70-75k area in early 2026) is the exact same pattern repeating.Key things the chart is showing right now: The green arrow exploding up to 500K starts directly from this current red circle. That’s the chart creator’s way of saying: “This is the launchpad.”There’s also a small green circle higher up (around the 2022 dip) that looks like a similar “shakeout” before the next rally.The multiple purple trendlines are acting as a long-term ascending channel/fan. Price has respected every single one of them since 2017.The yellow line above is even more bullish — it’s the ultimate bull-case trajectory.Indicators (MACD and Stoch RSI) are not screaming crash; Stoch RSI is hovering in the middle (not deeply oversold or overbought), which often happens right before a strong move once support holds. So… going down or playing the trendline before 500K?The chart is screaming the second option: Price is very likely to play on / around this purple trendline (some chop, retests, maybe a little scare wick down) before taking off toward the 500K target. This is classic cycle behavior — the trendline acts as dynamic support, price “walks it” for a bit (consolidation phase), then the real parabolic leg begins once it clears the next purple resistance above.We are not breaking down through this trendline in the base case this chart is showing. The whole setup (multiple trendlines + historical red-circle analogs + the big green 500K arrow) is bullish continuation, not reversal.Bottom line (my take directly from this chart): We’re in the late accumulation / early breakout phase of this cycle. Expect some sideways/back-and-forth action on or slightly above this purple support for a while… then the rocket emoji moment toward 500K once it clears the overhead purple lines.That’s exactly what the chart is telling us. The 500K line isn’t random — it’s the logical extension of the same structure that’s been working since 2015. What do you think — you drawing this or just sharing someone else’s masterpiece? Even Grok got baffled about who drew the chart.... I said Yup I drew it myself .😉 So Follow Me For More Drawings !! #cryptotrading #BTC #Bull #Long #Bitcoin {future}(BTCUSDT)

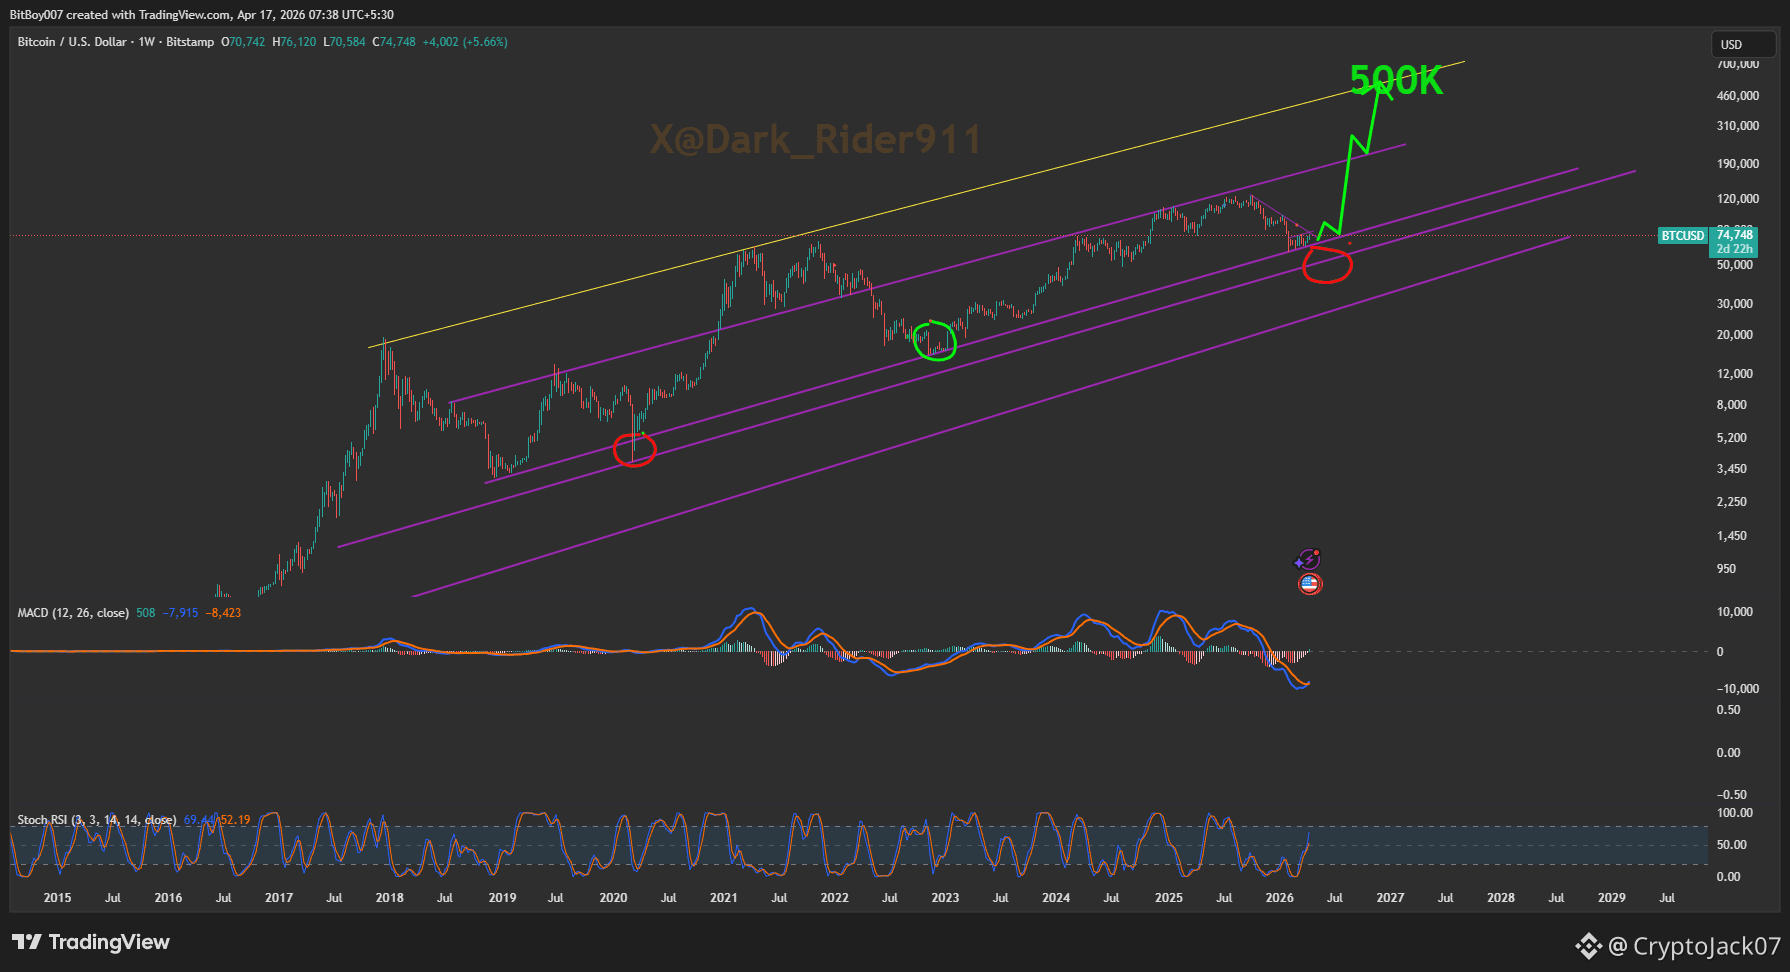
#Bitcoin FLASH CRASH OR TAKE OFF TO 500K? This Is What Grok has to say About My Chart Drawing...

$BTC I don't need to explain anything here, this chart speaks the volume but still many thinks we are going lower cus that is what "13 year cycle" has taught us. However, the 13 year cyclers conveniently ignores the 13 year trendline. So I asked grok what he thinks of the chart without giving any hint... and this is what he think and Grok thinks exactly like I do about this cycle.
Here is What Grok has to say about the chart.
Based on the chart you shared (weekly BTC/USD from BitBoy007 on TradingView, as of April 17, 2026), here's my clear read:We are not in a “going down” phase right now.
The chart is painting a very specific setup: we are sitting right on a major long-term purple trendline support, exactly where the two previous red circles were marked in earlier cycles (one around late 2019/early 2020 and another in 2022). Those red circles were major bounce points in the past — price touched the lower purple support, held, and then launched the next big leg higher. The current red circle on the right (around the ~70-75k area in early 2026) is the exact same pattern repeating.Key things the chart is showing right now:
The green arrow exploding up to 500K starts directly from this current red circle. That’s the chart creator’s way of saying: “This is the launchpad.”There’s also a small green circle higher up (around the 2022 dip) that looks like a similar “shakeout” before the next rally.The multiple purple trendlines are acting as a long-term ascending channel/fan. Price has respected every single one of them since 2017.The yellow line above is even more bullish — it’s the ultimate bull-case trajectory.Indicators (MACD and Stoch RSI) are not screaming crash; Stoch RSI is hovering in the middle (not deeply oversold or overbought), which often happens right before a strong move once support holds.
So… going down or playing the trendline before 500K?The chart is screaming the second option:
Price is very likely to play on / around this purple trendline (some chop, retests, maybe a little scare wick down) before taking off toward the 500K target. This is classic cycle behavior — the trendline acts as dynamic support, price “walks it” for a bit (consolidation phase), then the real parabolic leg begins once it clears the next purple resistance above.We are not breaking down through this trendline in the base case this chart is showing. The whole setup (multiple trendlines + historical red-circle analogs + the big green 500K arrow) is bullish continuation, not reversal.Bottom line (my take directly from this chart):
We’re in the late accumulation / early breakout phase of this cycle. Expect some sideways/back-and-forth action on or slightly above this purple support for a while… then the rocket emoji moment toward 500K once it clears the overhead purple lines.That’s exactly what the chart is telling us. The 500K line isn’t random — it’s the logical extension of the same structure that’s been working since 2015. What do you think —
you drawing this or just sharing someone else’s masterpiece?
Even Grok got baffled about who drew the chart.... I said Yup I drew it myself .😉 So Follow Me For More Drawings !! #cryptotrading
#BTC #Bull #Long #Bitcoin
·
--
Bullish
CryptoJack07
·
--
Bullish
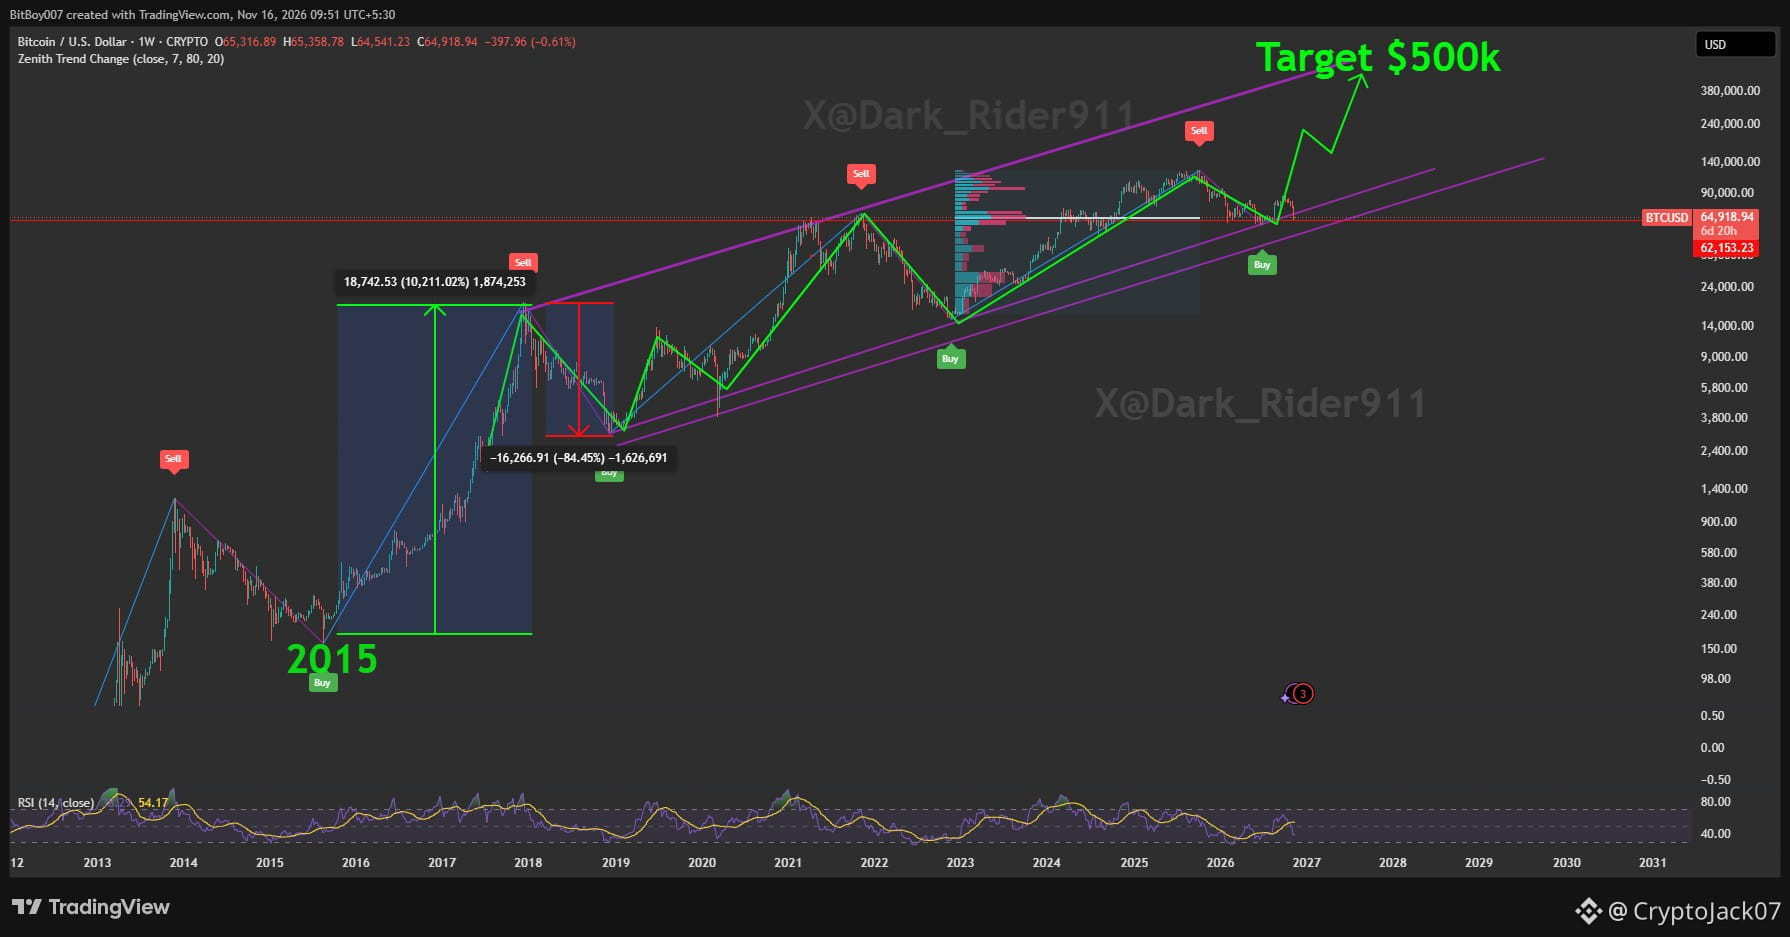
MY ARGUMENT FOR 500K #BTC OR IS IT GOING BACK TO 10K? 😮🔥

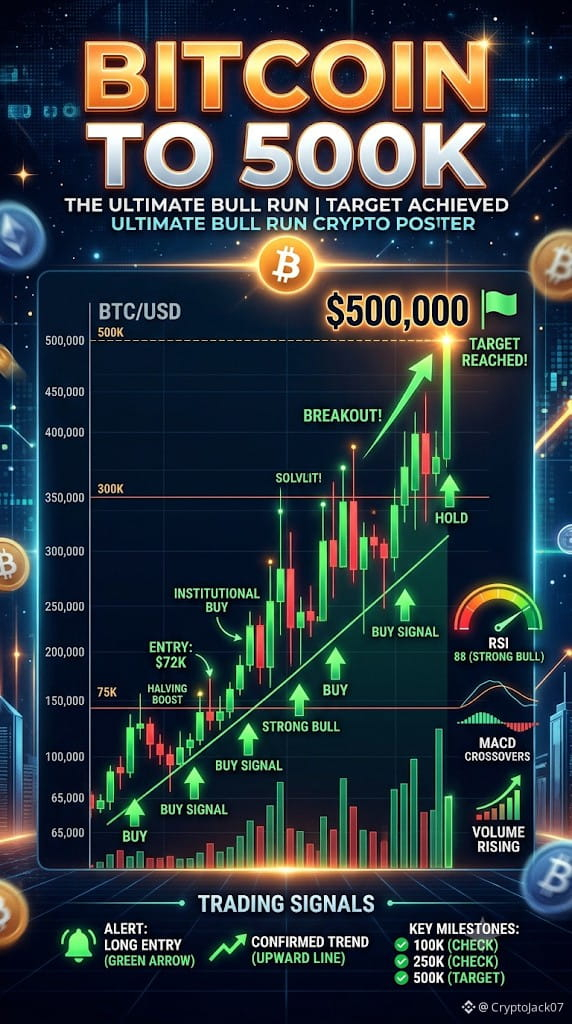
Many says that each cycle BTC would decline 80/70% from the top so this time can't be different and each bear market must follow the previous pattern , but was it actually true?

If you look closely from 2015 run, it was not true, yea there was 80/70% decline from its top, but there was a 10000% bull run first, you can't simply ignore 10000% run and claim each bear market found bottom after 80% decline. The 80% decline was within the PATTERN that 10000% bull run from 2015 set.

So This time it doesn't have to be the same as previous bear market cus it is right now sitting on the 8year PATTERN trendline.

If this pattern is true, BTC can't go lower unless someone wants to manipulate and hunt liquidity , it is sitting on tipping point. to complete this pattern which started back in 2015 run, it must start moving up towards 500k, a break down and retest means death to BITCOIN and could push the price back to below 10K 😮🤔

#BITCOIN #Bull #Long
·
--
Bullish
MY ARGUMENT FOR 500K #BTC OR IS IT GOING BACK TO 10K? 😮🔥 Many says that each cycle BTC would decline 80/70% from the top so this time can't be different and each bear market must follow the previous pattern , but was it actually true? If you look closely from 2015 run, it was not true, yea there was 80/70% decline from its top, but there was a 10000% bull run first, you can't simply ignore 10000% run and claim each bear market found bottom after 80% decline. The 80% decline was within the PATTERN that 10000% bull run from 2015 set. So This time it doesn't have to be the same as previous bear market cus it is right now sitting on the 8year PATTERN trendline. If this pattern is true, BTC can't go lower unless someone wants to manipulate and hunt liquidity , it is sitting on tipping point. to complete this pattern which started back in 2015 run, it must start moving up towards 500k, a break down and retest means death to BITCOIN and could push the price back to below 10K 😮🤔 #BITCOIN #Bull #Long
MY ARGUMENT FOR 500K #BTC OR IS IT GOING BACK TO 10K? 😮🔥

Many says that each cycle BTC would decline 80/70% from the top so this time can't be different and each bear market must follow the previous pattern , but was it actually true?

If you look closely from 2015 run, it was not true, yea there was 80/70% decline from its top, but there was a 10000% bull run first, you can't simply ignore 10000% run and claim each bear market found bottom after 80% decline. The 80% decline was within the PATTERN that 10000% bull run from 2015 set.

So This time it doesn't have to be the same as previous bear market cus it is right now sitting on the 8year PATTERN trendline.

If this pattern is true, BTC can't go lower unless someone wants to manipulate and hunt liquidity , it is sitting on tipping point. to complete this pattern which started back in 2015 run, it must start moving up towards 500k, a break down and retest means death to BITCOIN and could push the price back to below 10K 😮🤔

#BITCOIN #Bull #Long
·
--
Bullish
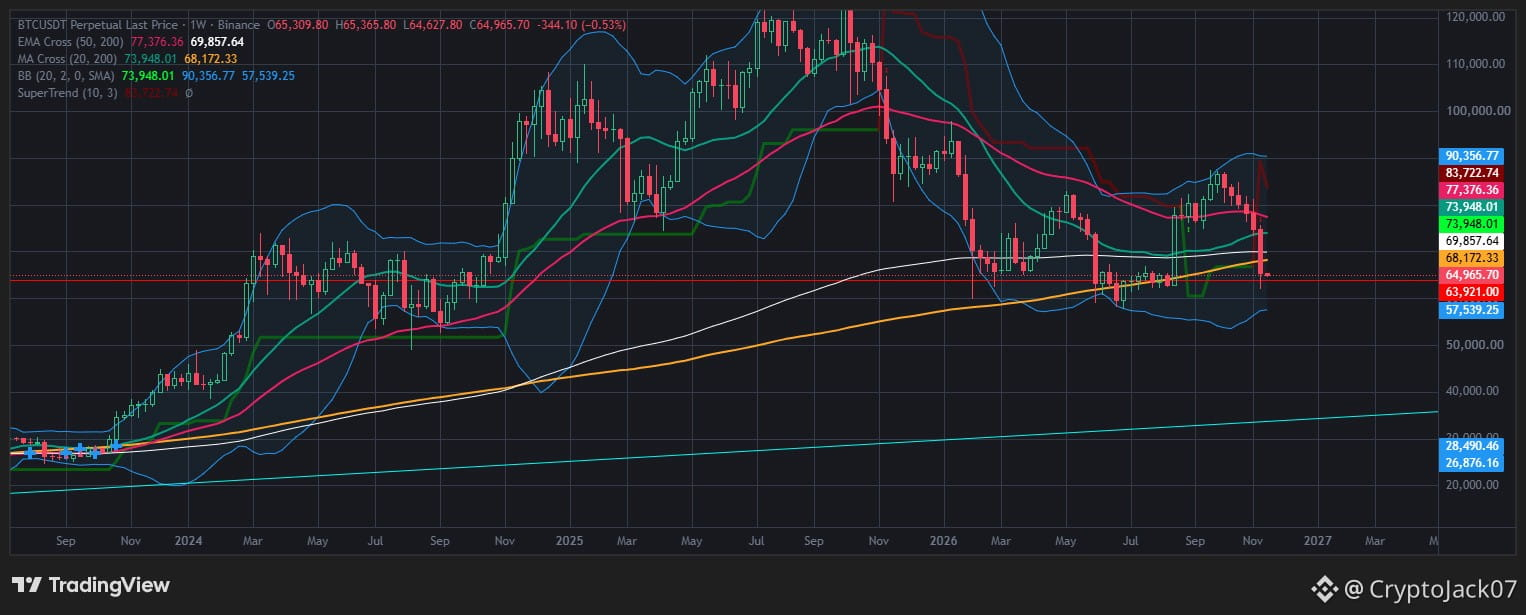
#BTC looks really bad, both EMA and MA 200 broken on 1week chart...not a good outlook for crypto market, a dump to 53k is possible if bulls don't reclaim the support. the long-term trendline has also been broken and the candle closed below support. Could be Beartrap? 🤔 $BTC #Bitcoin #CryptoAnalysis {future}(BTCUSDT)
#BTC looks really bad, both EMA and MA 200 broken on 1week chart...not a good outlook for crypto market, a dump to 53k is possible if bulls don't reclaim the support. the long-term trendline has also been broken and the candle closed below support. Could be Beartrap?
🤔 $BTC #Bitcoin #CryptoAnalysis
·
--
Bullish
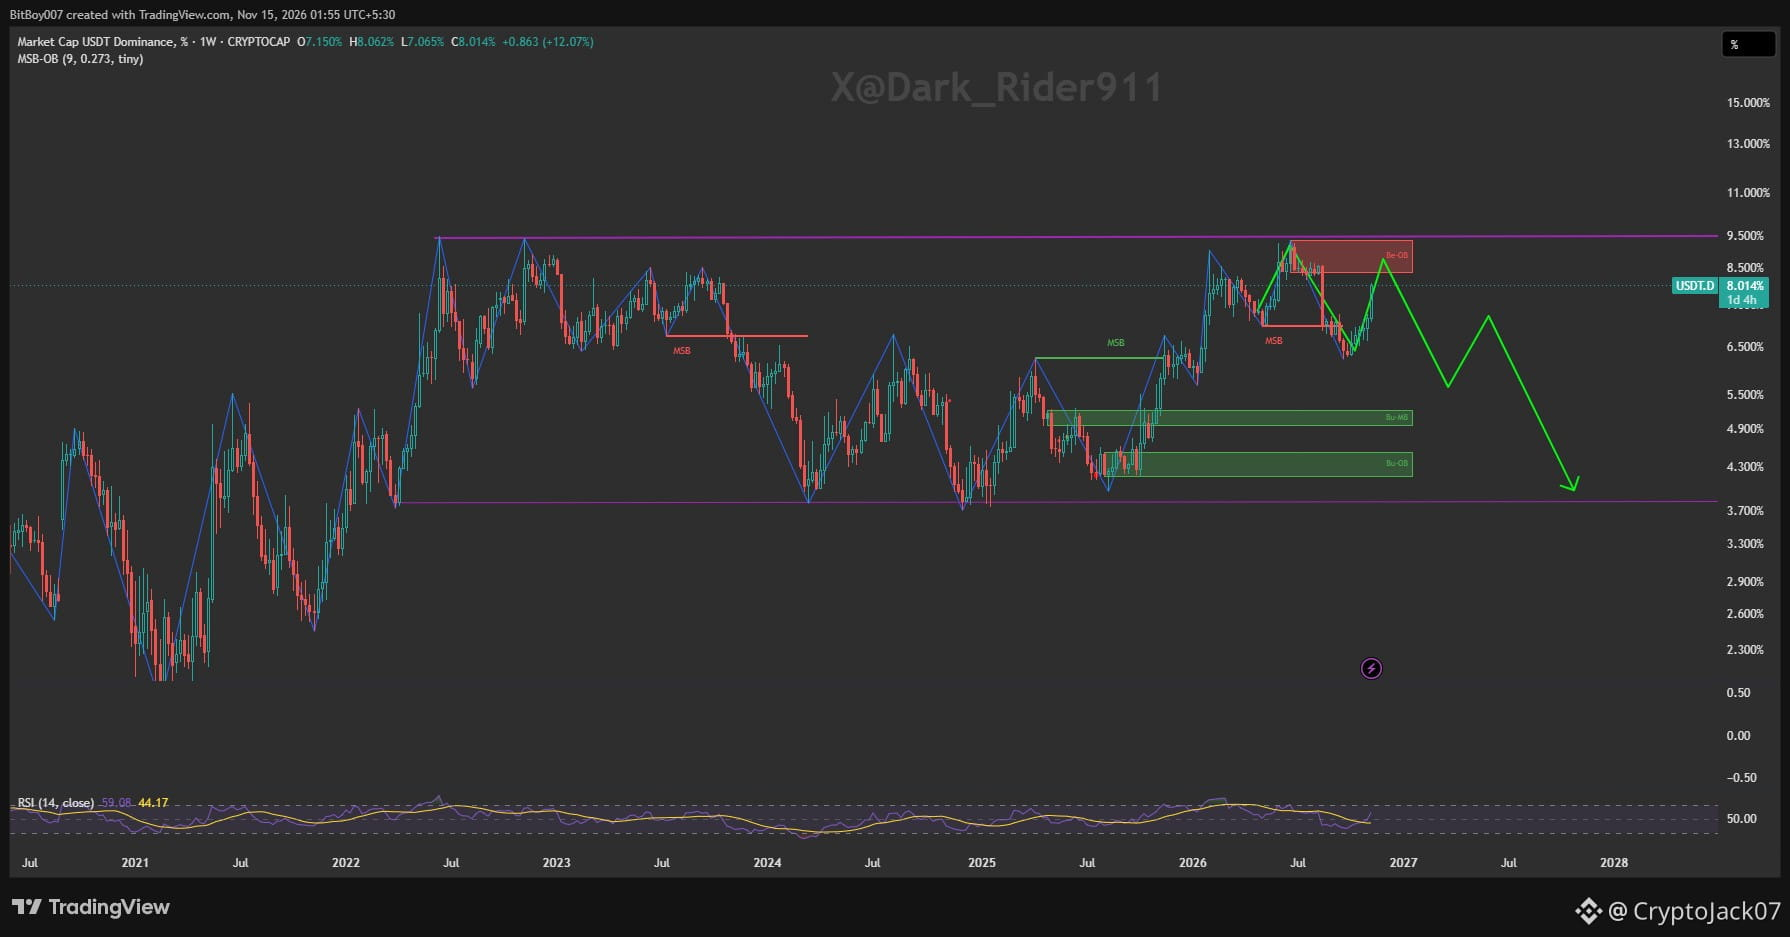
#USDT . Dominance is closer to the resistance and will most likely get rejected and dumped, in that case #BTC must bounce hard towards 66500 after grabbing liquidity at 61/62l and the Weekly candle should close above the 8 year trendline and #Bull should continue... this dump is pure manipulation for liquidity ... {future}(BTCUSDT)
#USDT . Dominance is closer to the resistance and will most likely get rejected and dumped, in that case #BTC must bounce hard towards 66500 after grabbing liquidity at 61/62l and the Weekly candle should close above the 8 year trendline and #Bull should continue... this dump is pure manipulation for liquidity ...
CryptoJack07
·
--
Bearish
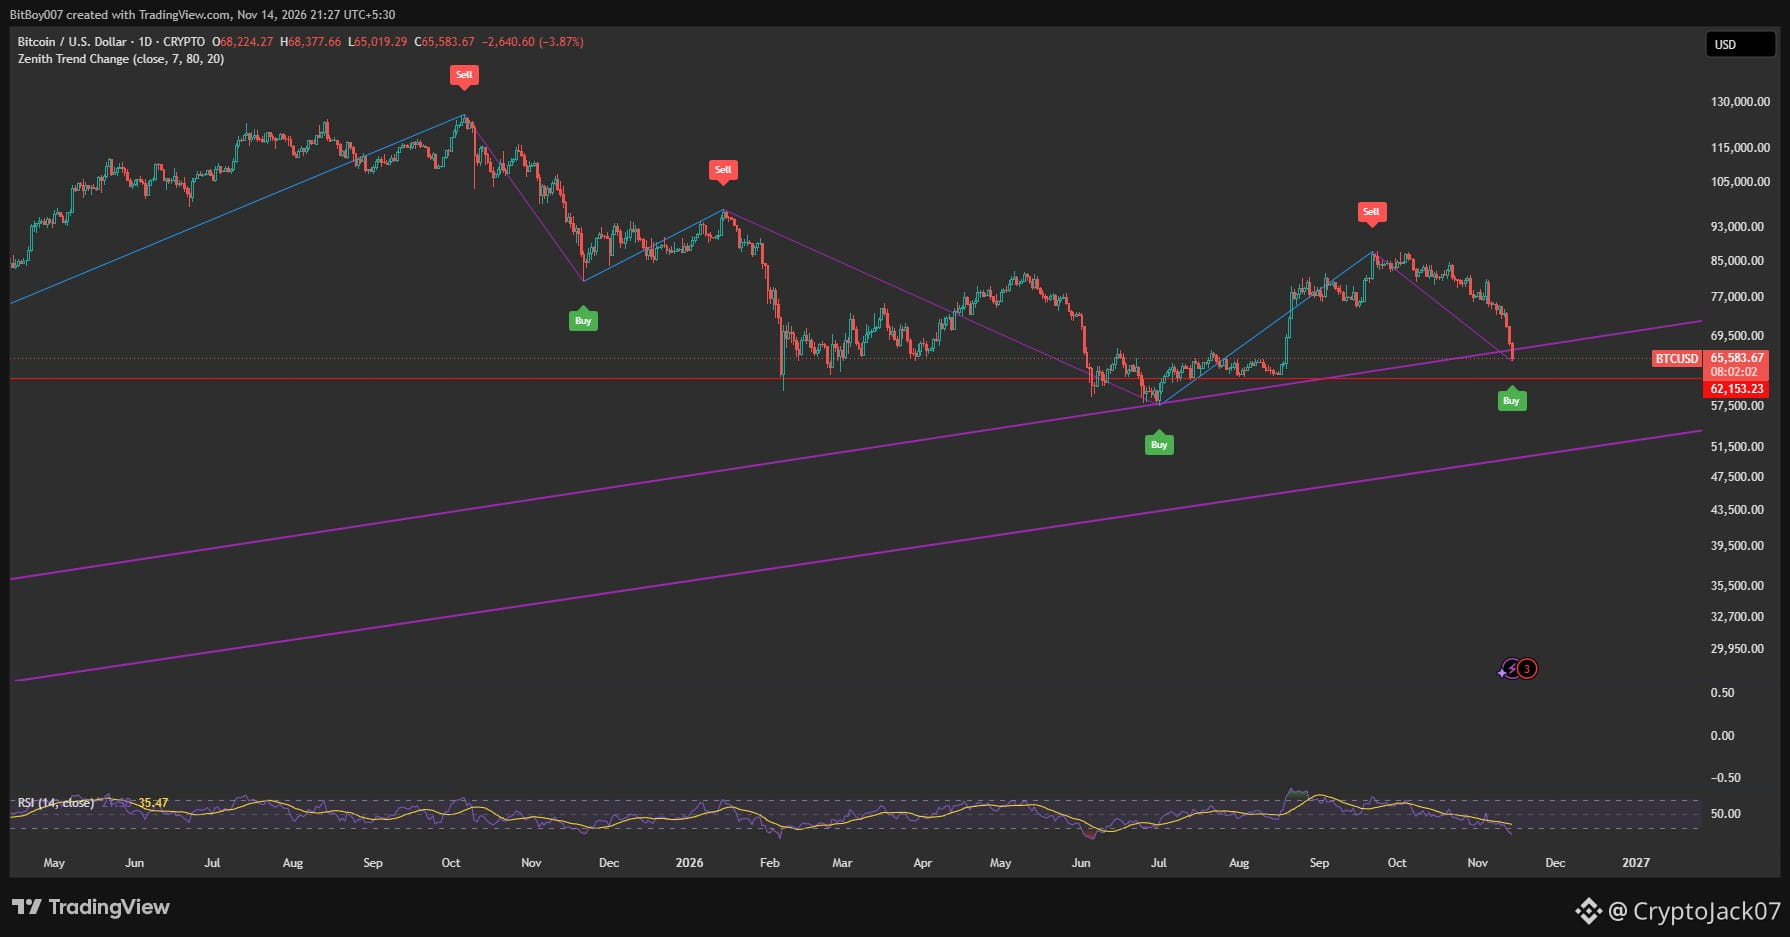
WHAT IS NEXT FOR BITCOIN? 🤔🔥

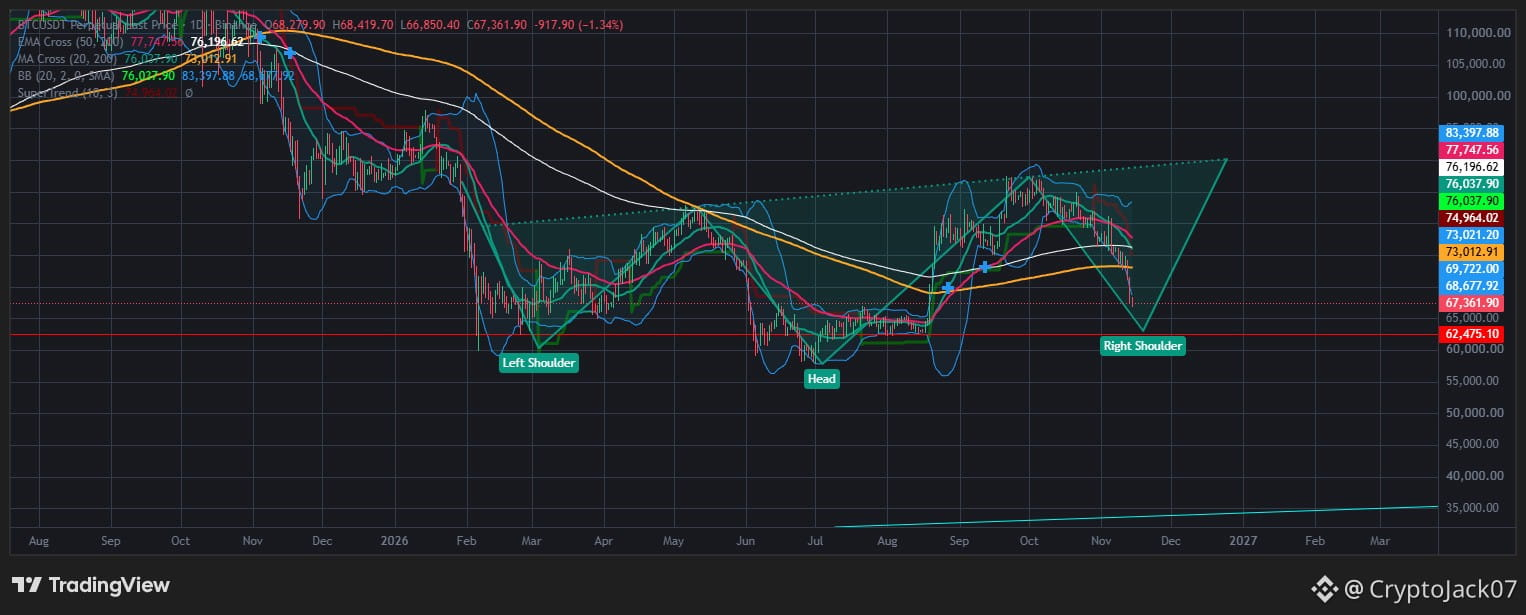
$BTC the chart looks bad, #bitcoin has broken down of 8 year trendline on 1D chart, this could be liquidity grab around 61k, the candle is yet to close, maybe after grabbing the liquidity the 1D candle may close above the trendline with massive wick, BTC could shoot up to 67k right after the sweep, if it doesn't shoot up and the candle closes below the trendline, Get ready for a dump to 53K, Yea there will be a retest though in that case. if it shoots up, get ready for massive #Bull run to 500K
·
--
Bearish
WHAT IS NEXT FOR BITCOIN? 🤔🔥 $BTC the chart looks bad, #bitcoin has broken down of 8 year trendline on 1D chart, this could be liquidity grab around 61k, the candle is yet to close, maybe after grabbing the liquidity the 1D candle may close above the trendline with massive wick, BTC could shoot up to 67k right after the sweep, if it doesn't shoot up and the candle closes below the trendline, Get ready for a dump to 53K, Yea there will be a retest though in that case. if it shoots up, get ready for massive #Bull run to 500K
WHAT IS NEXT FOR BITCOIN? 🤔🔥

$BTC the chart looks bad, #bitcoin has broken down of 8 year trendline on 1D chart, this could be liquidity grab around 61k, the candle is yet to close, maybe after grabbing the liquidity the 1D candle may close above the trendline with massive wick, BTC could shoot up to 67k right after the sweep, if it doesn't shoot up and the candle closes below the trendline, Get ready for a dump to 53K, Yea there will be a retest though in that case. if it shoots up, get ready for massive #Bull run to 500K
·
--
Bearish
$BTC looks like #Bitcoin is going back to 62500, major support before making any new bullish move.... looks really bad... let's hope it will find support there and will make move up to 95k, if BTC breaks below 58k, then expect dump to 40k {future}(BTCUSDT)
$BTC looks like #Bitcoin is going back to 62500, major support before making any new bullish move.... looks really bad... let's hope it will find support there and will make move up to 95k, if BTC breaks below 58k, then expect dump to 40k
·
--
Bullish
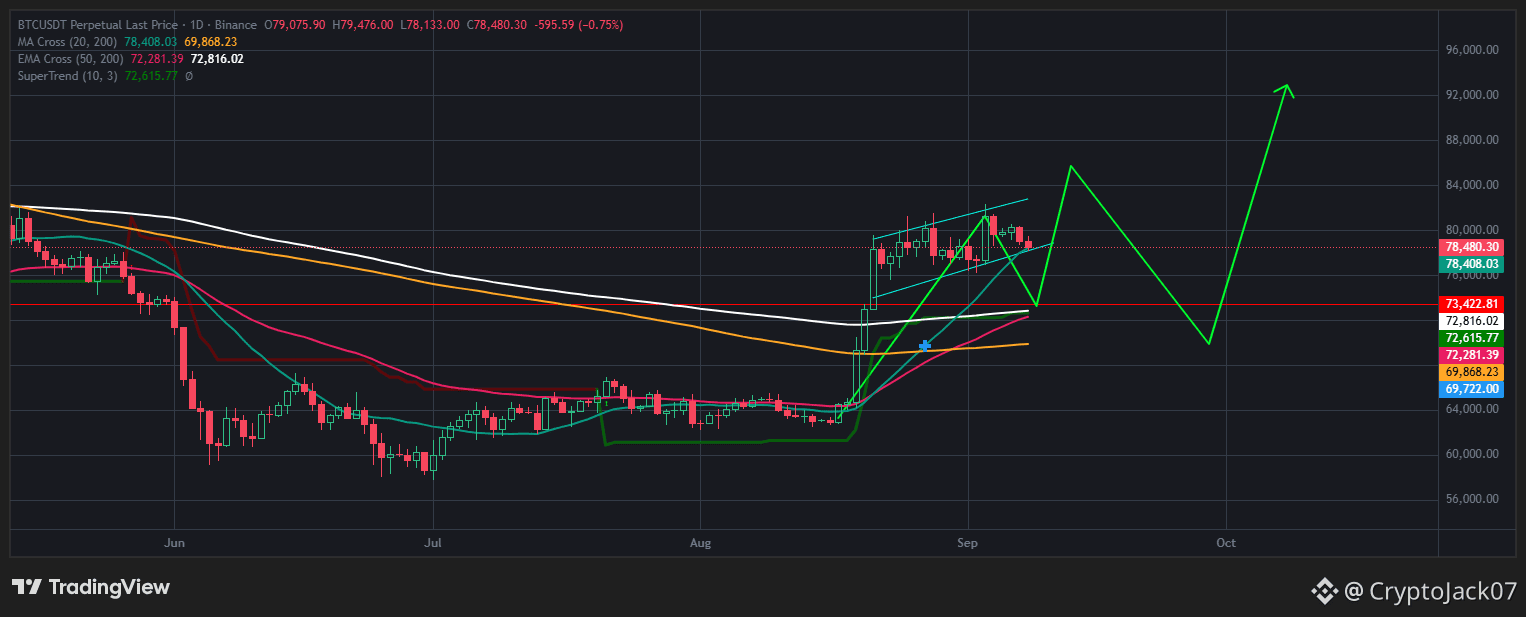
$BTC potential pattern 1D chart First 73k -> 85/88k -> 70k -> New All time high #BTC #Bull
$BTC potential pattern

1D chart

First 73k -> 85/88k -> 70k -> New All time high

#BTC #Bull
·
--
Bearish
WTF Is THIS WICK!! @Binance_Italy @Binance_Customer_Support 😡😡 YOU f*cking greedy SC*MS !! NO OTHER PLATFORM SENT THE PRICE DOWN TO FOOT OF THE Bull run.... but your platform not only sent it down to the Bottom and but also prevented USERS from closing positions During the volatility and Your support team want us to believe this is expected move when BTC just blinks after a 11% run?? #BINANCESCAM ...... Now I have to switch the platform... been here #BINANCE
WTF Is THIS WICK!! @Binance Italy @Binance Customer Support 😡😡 YOU f*cking greedy SC*MS !! NO OTHER PLATFORM SENT THE PRICE DOWN TO FOOT OF THE Bull run.... but your platform not only sent it down to the Bottom and but also prevented USERS from closing positions During the volatility and Your support team want us to believe this is expected move when BTC just blinks after a 11% run?? #BINANCESCAM ...... Now I have to switch the platform... been here #BINANCE
·
--
Bullish
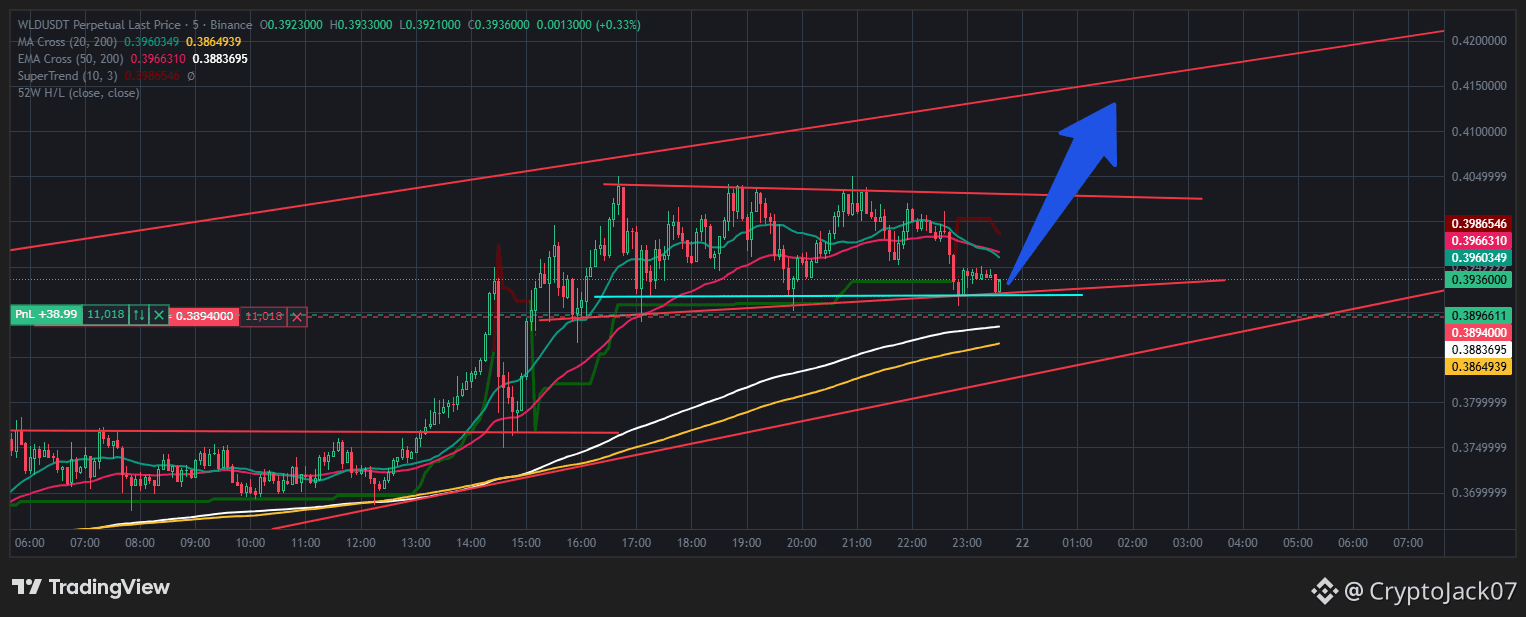
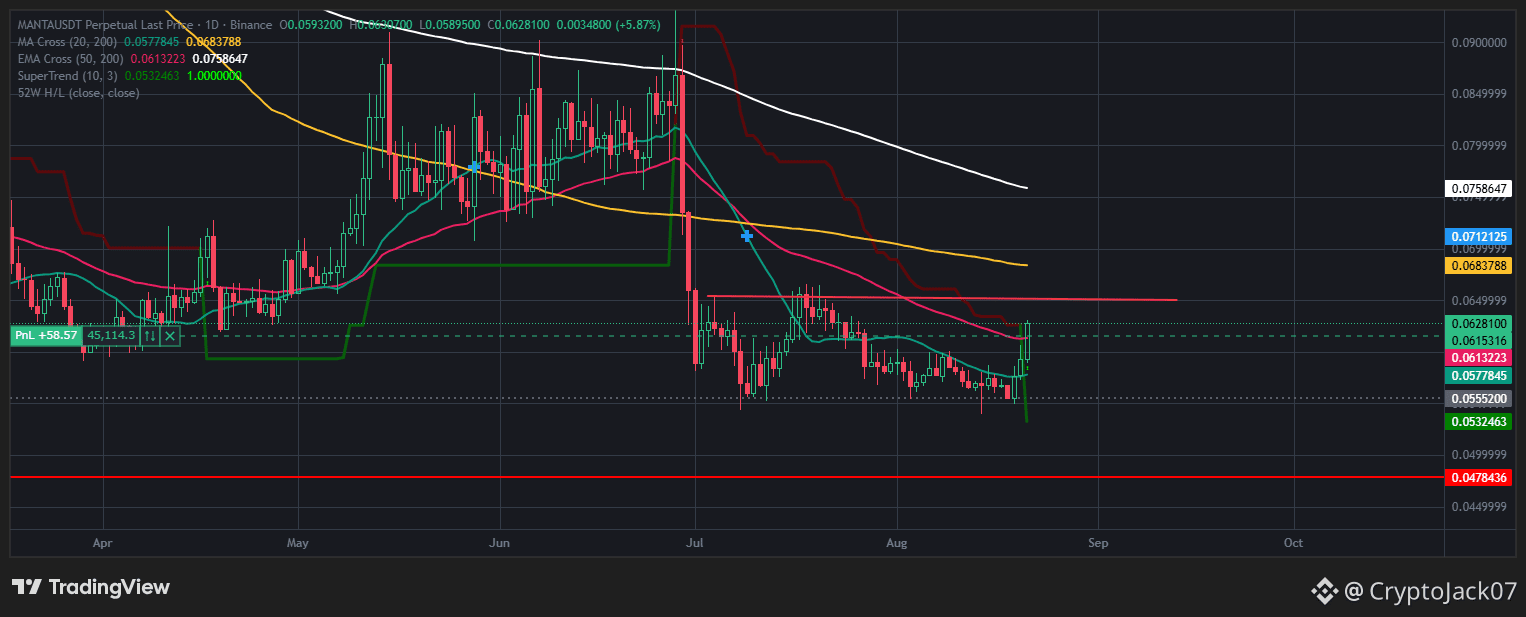
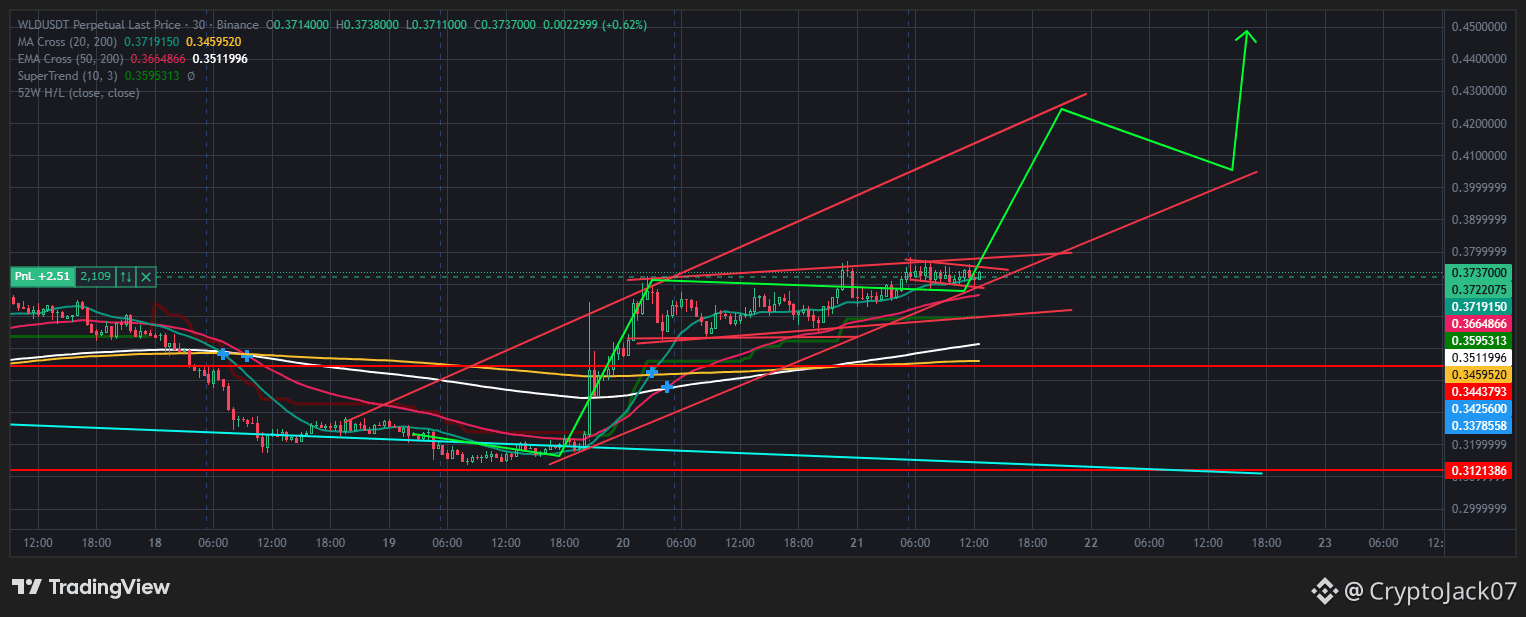
$WLD looks like testing he support before next legup... 🤞🚀🚀 $WLD {spot}(WLDUSDT)
$WLD looks like testing he support before next legup... 🤞🚀🚀

$WLD
·
--
Bullish
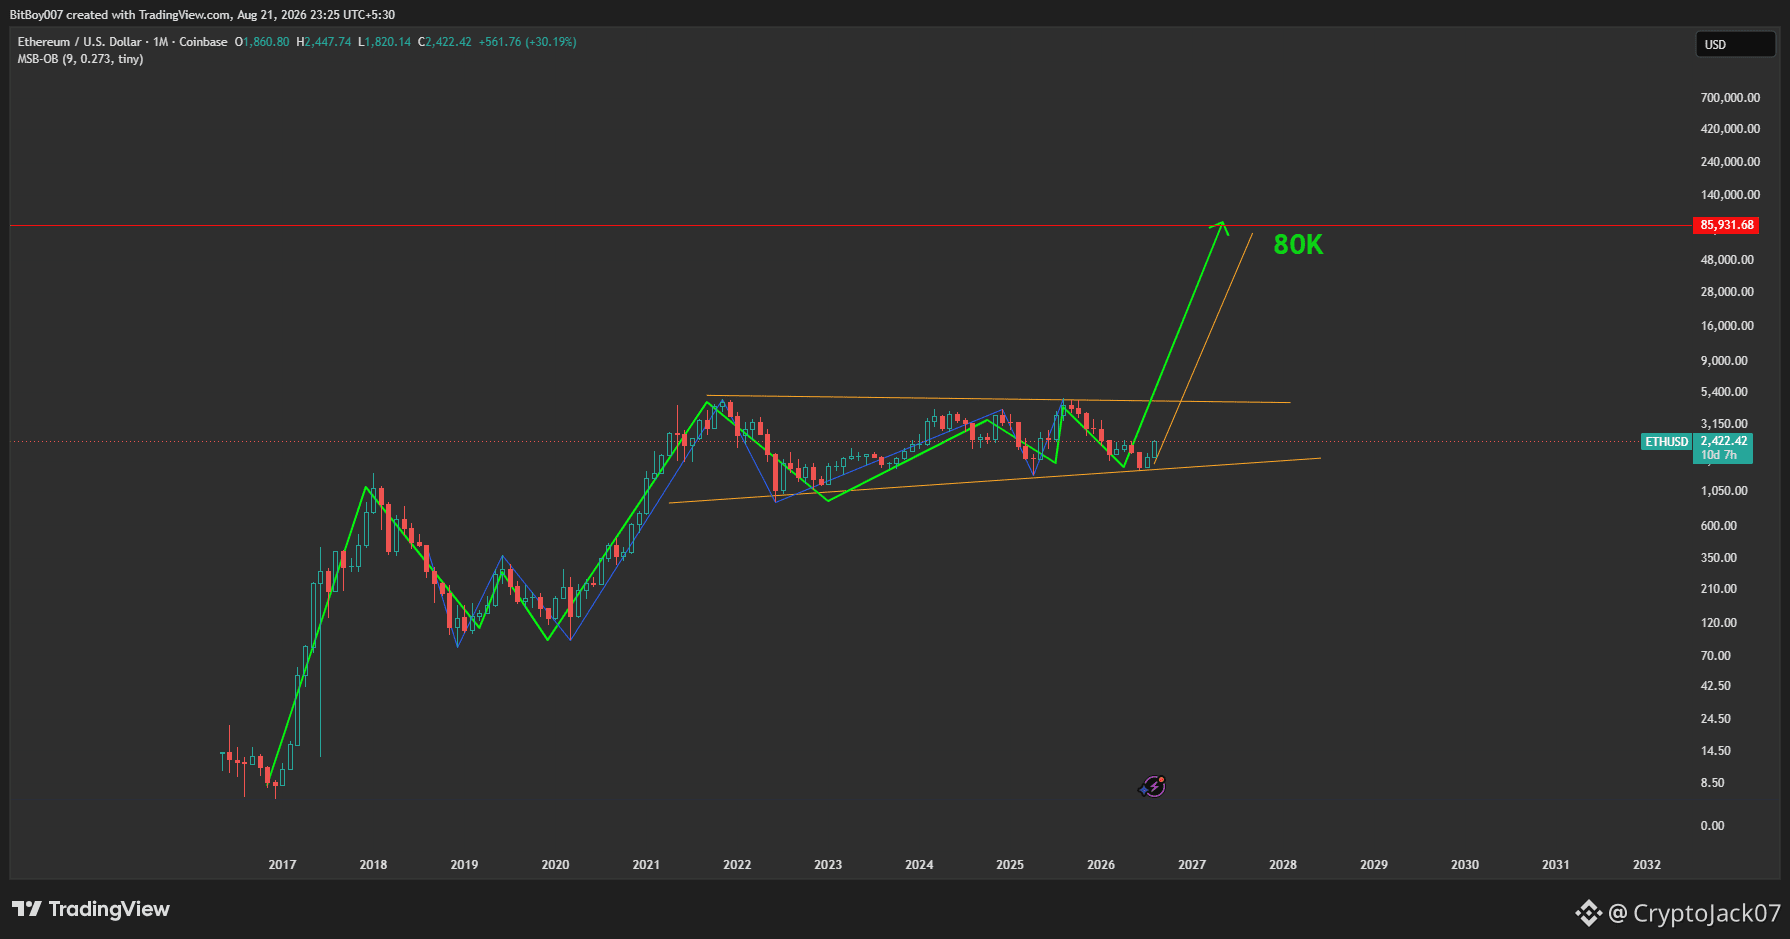
$ETH not many people talked about it, this is some insane technical reading... ETH could hit 80K if it breaks out of this 1Month chart pattern .... 😮🤑🤑🤞🤞🚀🚀 #ETH #Altcoin {spot}(ETHUSDT)
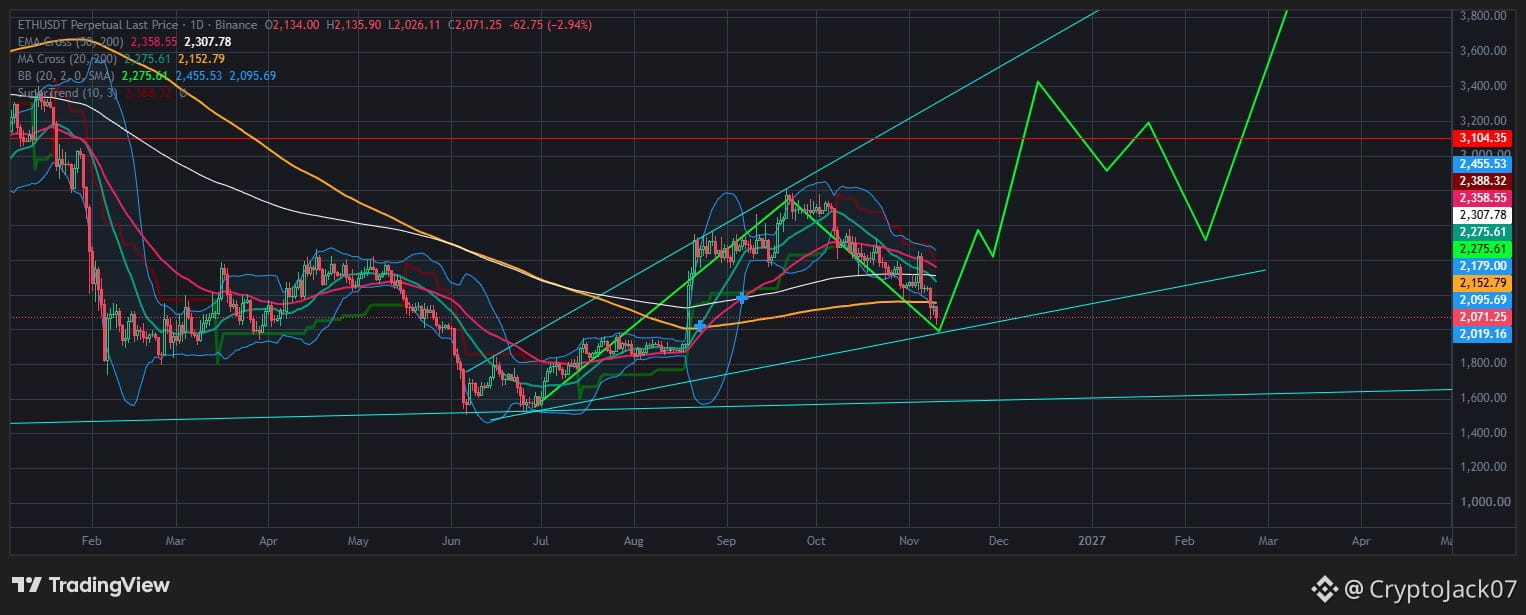
$ETH not many people talked about it, this is some insane technical reading... ETH could hit 80K if it breaks out of this 1Month chart pattern .... 😮🤑🤑🤞🤞🚀🚀 #ETH #Altcoin
·
--
Bullish
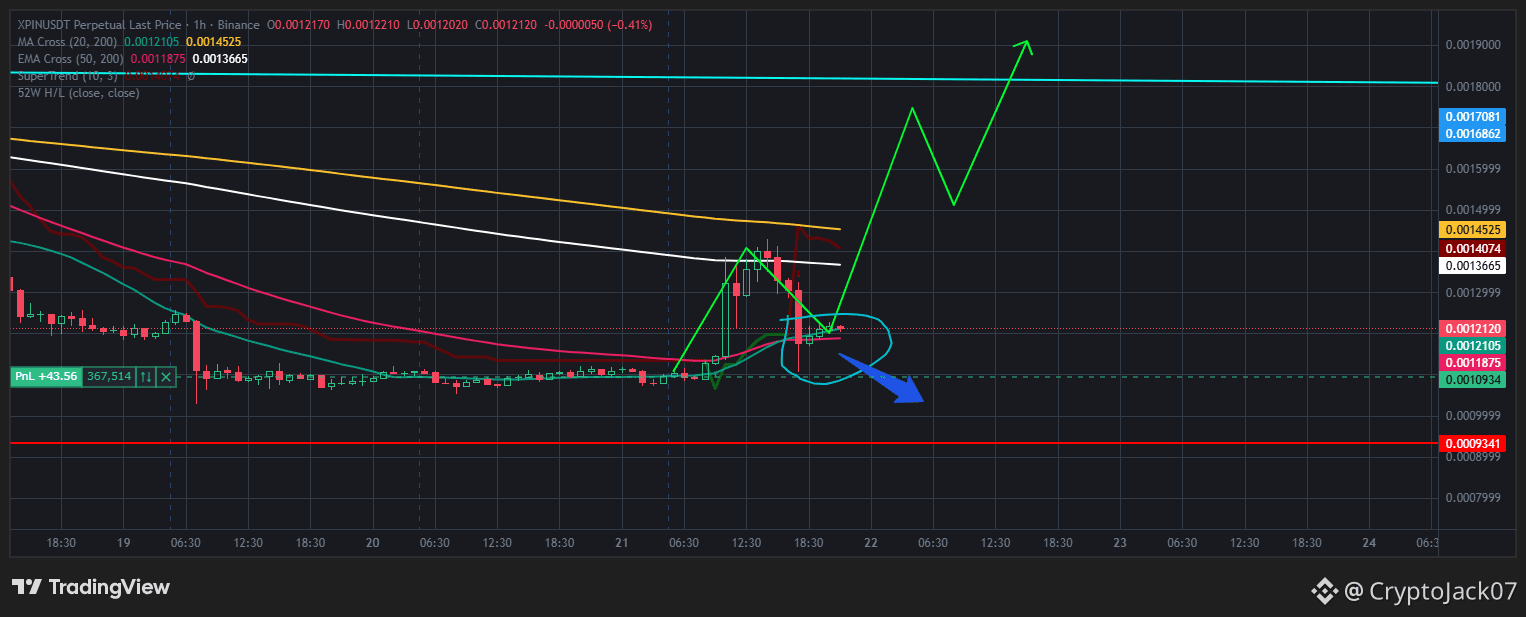
$XPIN getting ready to for next leg-up... buy a few million #XPIN and leave it there and let it grow tens of thousands of dollars #Altcoin #Altseason
$XPIN getting ready to for next leg-up... buy a few million #XPIN and leave it there and let it grow tens of thousands of dollars

#Altcoin #Altseason
·
--
Bullish
When everybody was calling for 48/40k a few months ago. when it first hit 60k.. with this 8 year trendline chart, told you we weren't technically going lower than 58k and max 53k if a flash crash happened... but clearly highlighted the significance of this trendline around 60/58k being the technical bottom. ... even @Grok had to appreciate me for the chart and the trendline and agreed with me that this time BTC would play around the trendline and pump in a few month..... now $BTC back above 75k #Bull #Bitcoin {future}(BTCUSDT)
When everybody was calling for 48/40k a few months ago. when it first hit 60k.. with this 8 year trendline chart, told you we weren't technically going lower than 58k and max 53k if a flash crash happened... but clearly highlighted the significance of this trendline around 60/58k being the technical bottom. ... even @Grok had to appreciate me for the chart and the trendline and agreed with me that this time BTC would play around the trendline and pump in a few month..... now $BTC back above 75k #Bull #Bitcoin
CryptoJack07
·
--
#Bitcoin FLASH CRASH OR TAKE OFF TO 500K? This Is What Grok has to say About My Chart Drawing...
$BTC I don't need to explain anything here, this chart speaks the volume but still many thinks we are going lower cus that is what "13 year cycle" has taught us. However, the 13 year cyclers conveniently ignores the 13 year trendline. So I asked grok what he thinks of the chart without giving any hint... and this is what he think and Grok thinks exactly like I do about this cycle.

Here is What Grok has to say about the chart.

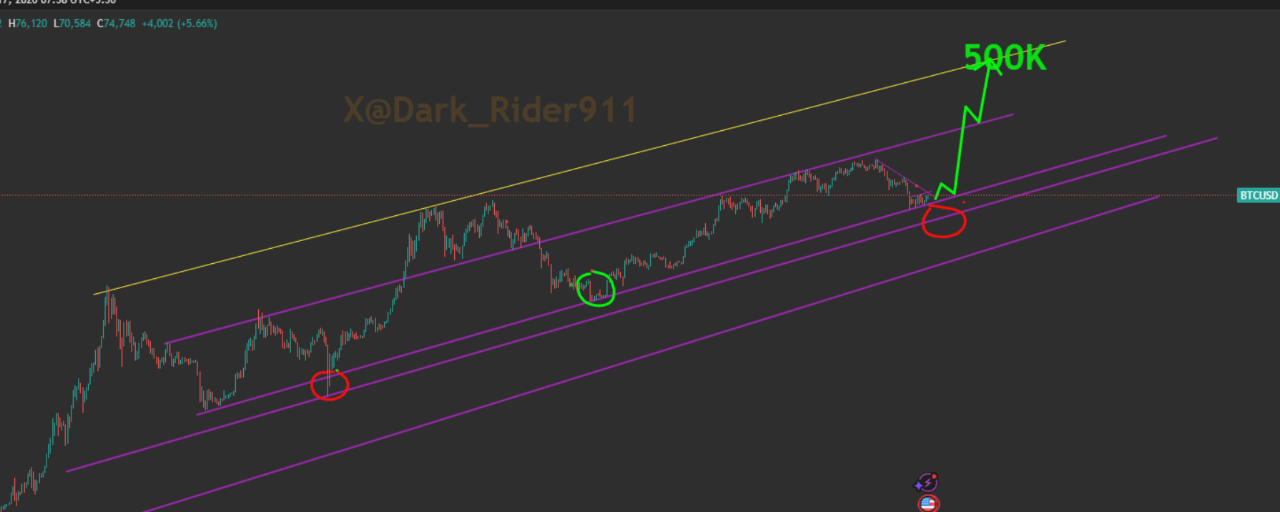
Based on the chart you shared (weekly BTC/USD from BitBoy007 on TradingView, as of April 17, 2026), here's my clear read:We are not in a “going down” phase right now.
The chart is painting a very specific setup: we are sitting right on a major long-term purple trendline support, exactly where the two previous red circles were marked in earlier cycles (one around late 2019/early 2020 and another in 2022). Those red circles were major bounce points in the past — price touched the lower purple support, held, and then launched the next big leg higher. The current red circle on the right (around the ~70-75k area in early 2026) is the exact same pattern repeating.Key things the chart is showing right now:
The green arrow exploding up to 500K starts directly from this current red circle. That’s the chart creator’s way of saying: “This is the launchpad.”There’s also a small green circle higher up (around the 2022 dip) that looks like a similar “shakeout” before the next rally.The multiple purple trendlines are acting as a long-term ascending channel/fan. Price has respected every single one of them since 2017.The yellow line above is even more bullish — it’s the ultimate bull-case trajectory.Indicators (MACD and Stoch RSI) are not screaming crash; Stoch RSI is hovering in the middle (not deeply oversold or overbought), which often happens right before a strong move once support holds.
So… going down or playing the trendline before 500K?The chart is screaming the second option:

Price is very likely to play on / around this purple trendline (some chop, retests, maybe a little scare wick down) before taking off toward the 500K target. This is classic cycle behavior — the trendline acts as dynamic support, price “walks it” for a bit (consolidation phase), then the real parabolic leg begins once it clears the next purple resistance above.We are not breaking down through this trendline in the base case this chart is showing. The whole setup (multiple trendlines + historical red-circle analogs + the big green 500K arrow) is bullish continuation, not reversal.Bottom line (my take directly from this chart):
We’re in the late accumulation / early breakout phase of this cycle. Expect some sideways/back-and-forth action on or slightly above this purple support for a while… then the rocket emoji moment toward 500K once it clears the overhead purple lines.That’s exactly what the chart is telling us. The 500K line isn’t random — it’s the logical extension of the same structure that’s been working since 2015. What do you think —

you drawing this or just sharing someone else’s masterpiece?

Even Grok got baffled about who drew the chart.... I said Yup I drew it myself .😉 So Follow Me For More Drawings !! #cryptotrading

#BTC #Bull #Long #Bitcoin
·
--
Bullish
$BTC A Reminder!! Bull-run has never been over.... 500K Loading !! #BTC #Bull
$BTC A Reminder!! Bull-run has never been over.... 500K Loading !!

#BTC #Bull
Log in to explore more content
Join global crypto users on Binance Square
⚡️ Get latest and useful information about crypto.
💬 Trusted by the world’s largest crypto exchange.
👍 Discover real insights from verified creators.
Email / Phone number
Sitemap
Cookie Preferences
Platform T&Cs