

Cryptorian_Emraan
1.3k Posts

Cryptorian_Emraan
Report
Block User
Crypto explorer | Mastering intraday, DCA & swing trading.
Open Trade
Frequent Trader
1.5 Years
892 Following
2.1K+ Followers
1.1K+ Liked
Posts
Portfolio
All
Quotes
Live
PINNED
I realized I had been thinking about managed onchain strategies too simply. I used to believe that giving a manager control over a strategy also meant giving them full control over the assets.
After spending more time understanding how @grvt_io approaches this, I noticed the permissions are separated. A strategy manager can make trading decisions, but withdrawals remain outside their control. That design made me think more carefully about how trust can be limited without removing the manager's role.
In my opinion, this is a meaningful improvement, but it does not eliminate investment risk. Better custody protection cannot guarantee better trading decisions. Investors still need to evaluate the person behind the strategy as much as the technology itself.
What is the biggest factor for you in managed onchain strategies?
$EVAA $BSB $HEI #grvt #grvt
{future}(LABUSDT)
{spot}(SXTUSDT)
I realized I had been thinking about managed onchain strategies too simply. I used to believe that giving a manager control over a strategy also meant giving them full control over the assets.
After spending more time understanding how @grvt_io approaches this, I noticed the permissions are separated. A strategy manager can make trading decisions, but withdrawals remain outside their control. That design made me think more carefully about how trust can be limited without removing the manager's role.
In my opinion, this is a meaningful improvement, but it does not eliminate investment risk. Better custody protection cannot guarantee better trading decisions. Investors still need to evaluate the person behind the strategy as much as the technology itself.
What is the biggest factor for you in managed onchain strategies?
$EVAA $BSB $HEI #grvt #grvt
After spending more time understanding how @grvt_io approaches this, I noticed the permissions are separated. A strategy manager can make trading decisions, but withdrawals remain outside their control. That design made me think more carefully about how trust can be limited without removing the manager's role.
In my opinion, this is a meaningful improvement, but it does not eliminate investment risk. Better custody protection cannot guarantee better trading decisions. Investors still need to evaluate the person behind the strategy as much as the technology itself.
What is the biggest factor for you in managed onchain strategies?
$EVAA $BSB $HEI #grvt #grvt
5
6
19
1.4k
PINNED
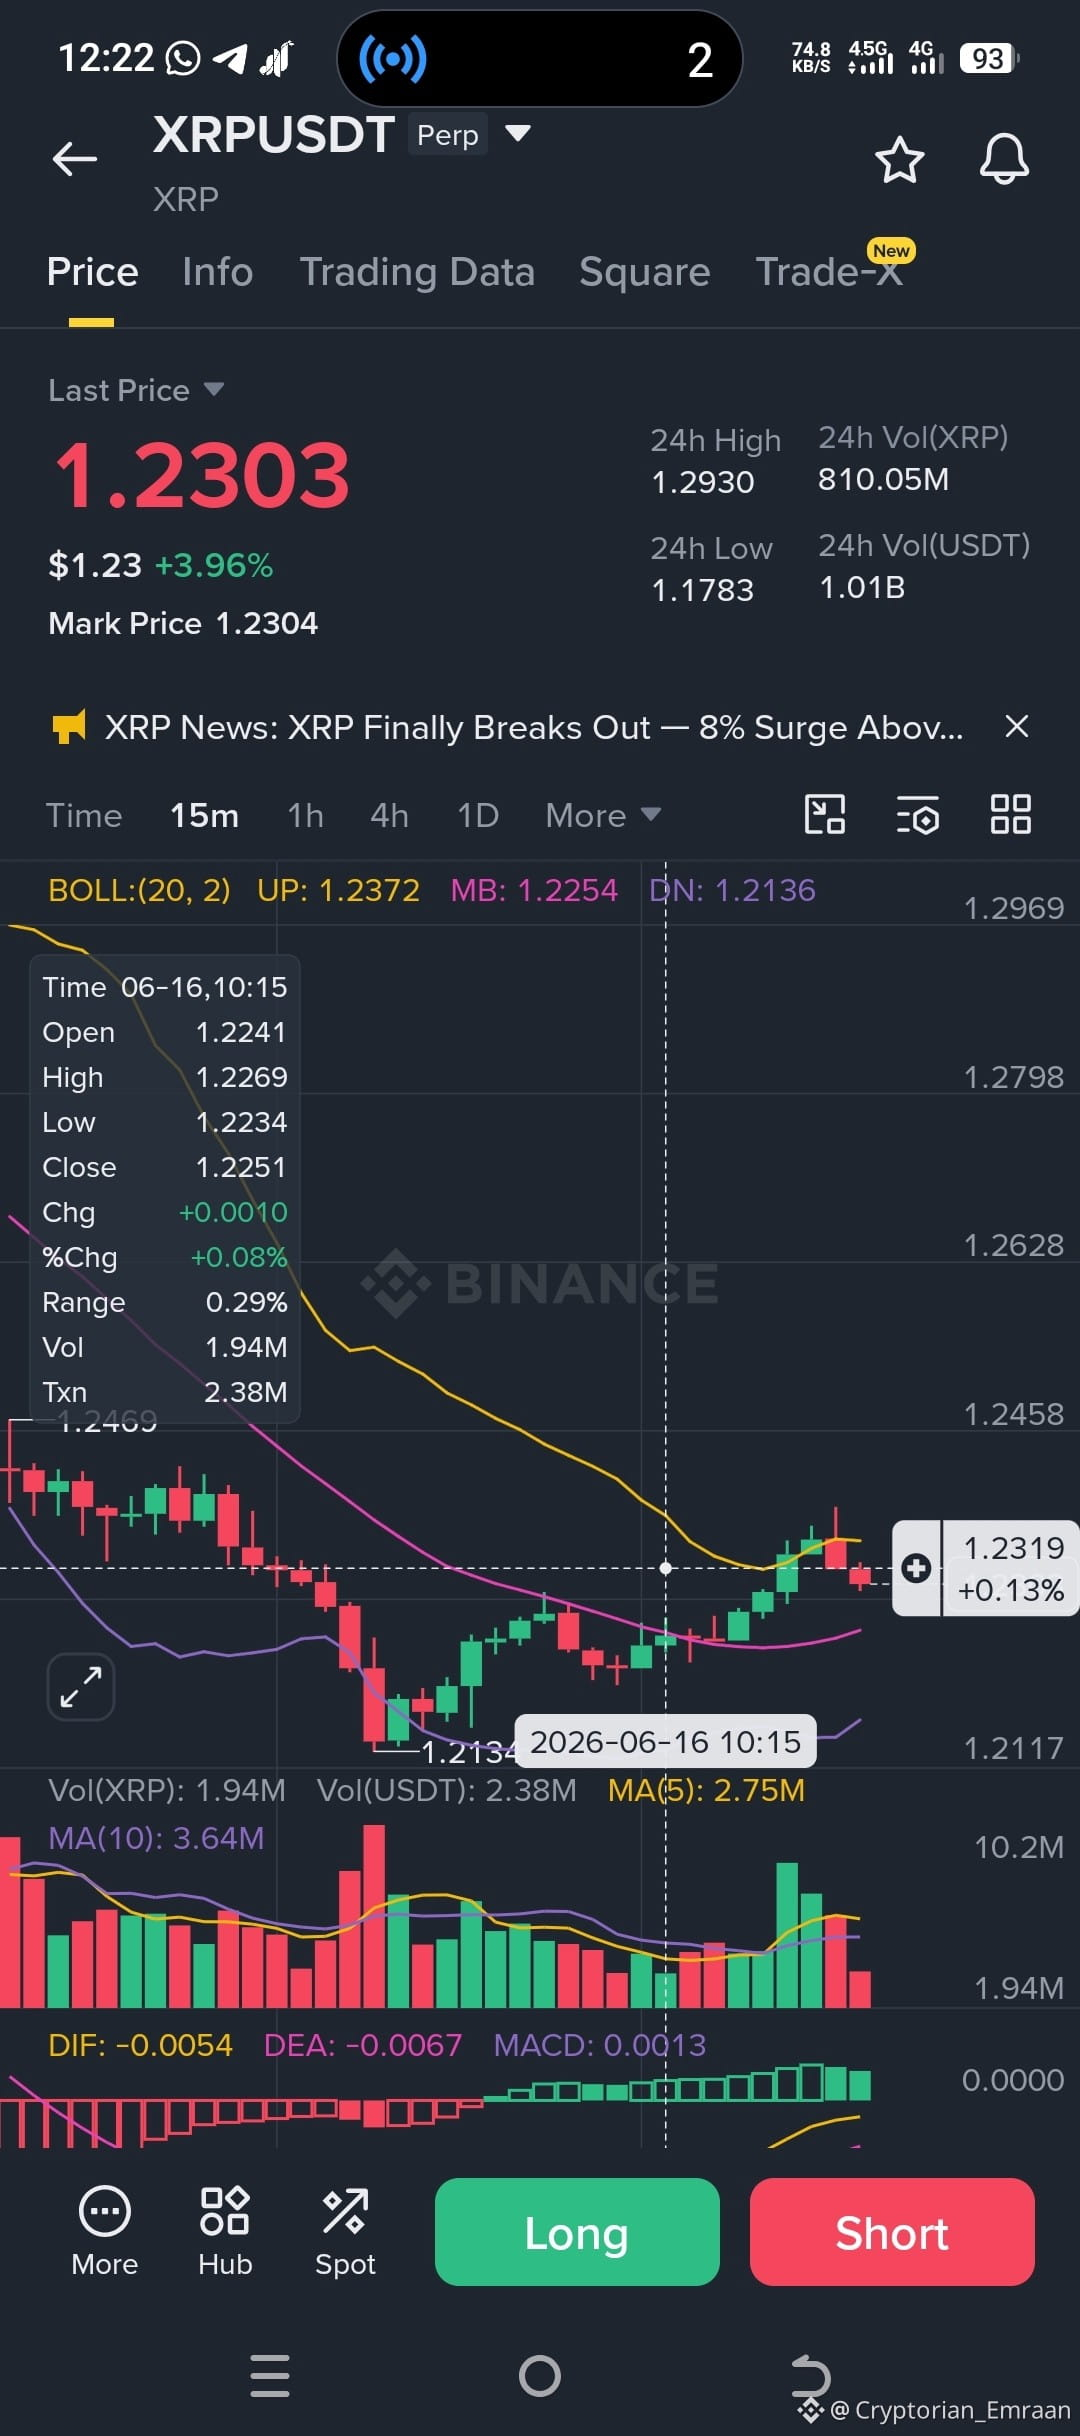
💥$XRP Market Mood: Total Chaos & Pure Speculation!
{future}(XRPUSDT)
Current Price: $1.23 🚀
Spotted in the wild via the latest charts
Predictions are all over the place:
🐻 $0.32 in 2026 (The "Doom-Scroll" prediction) 💀
🐂 $10-$20 by 2030 (The "To The Moon" dream) 👀
🚀 $1,000,000 by 2035 (The "Total
Delusion" mode) 🤯
Analysts are out here acting like monkeys with tambourines, just making noise while the charts dance! 😂 Nobody actually knows where the next candle is heading, but that’s the beauty of the game, right?
We’re all still here holding the line.
What’s your gut telling you? Drop your boldest prediction below! 👇🔥
#XRPPredictions #cryptotradingpro #BinanceSquareFamily #Altcoins👀🚀 #BTC☀️
💥$XRP Market Mood: Total Chaos & Pure Speculation!
Current Price: $1.23 🚀
Spotted in the wild via the latest charts
Predictions are all over the place:
🐻 $0.32 in 2026 (The "Doom-Scroll" prediction) 💀
🐂 $10-$20 by 2030 (The "To The Moon" dream) 👀
🚀 $1,000,000 by 2035 (The "Total
Delusion" mode) 🤯
Analysts are out here acting like monkeys with tambourines, just making noise while the charts dance! 😂 Nobody actually knows where the next candle is heading, but that’s the beauty of the game, right?
We’re all still here holding the line.
What’s your gut telling you? Drop your boldest prediction below! 👇🔥
#XRPPredictions #cryptotradingpro #BinanceSquareFamily #Altcoins👀🚀 #BTC☀️
Current Price: $1.23 🚀
Spotted in the wild via the latest charts
Predictions are all over the place:
🐻 $0.32 in 2026 (The "Doom-Scroll" prediction) 💀
🐂 $10-$20 by 2030 (The "To The Moon" dream) 👀
🚀 $1,000,000 by 2035 (The "Total
Delusion" mode) 🤯
Analysts are out here acting like monkeys with tambourines, just making noise while the charts dance! 😂 Nobody actually knows where the next candle is heading, but that’s the beauty of the game, right?
We’re all still here holding the line.
What’s your gut telling you? Drop your boldest prediction below! 👇🔥
#XRPPredictions #cryptotradingpro #BinanceSquareFamily #Altcoins👀🚀 #BTC☀️
3
1
20
2.4k

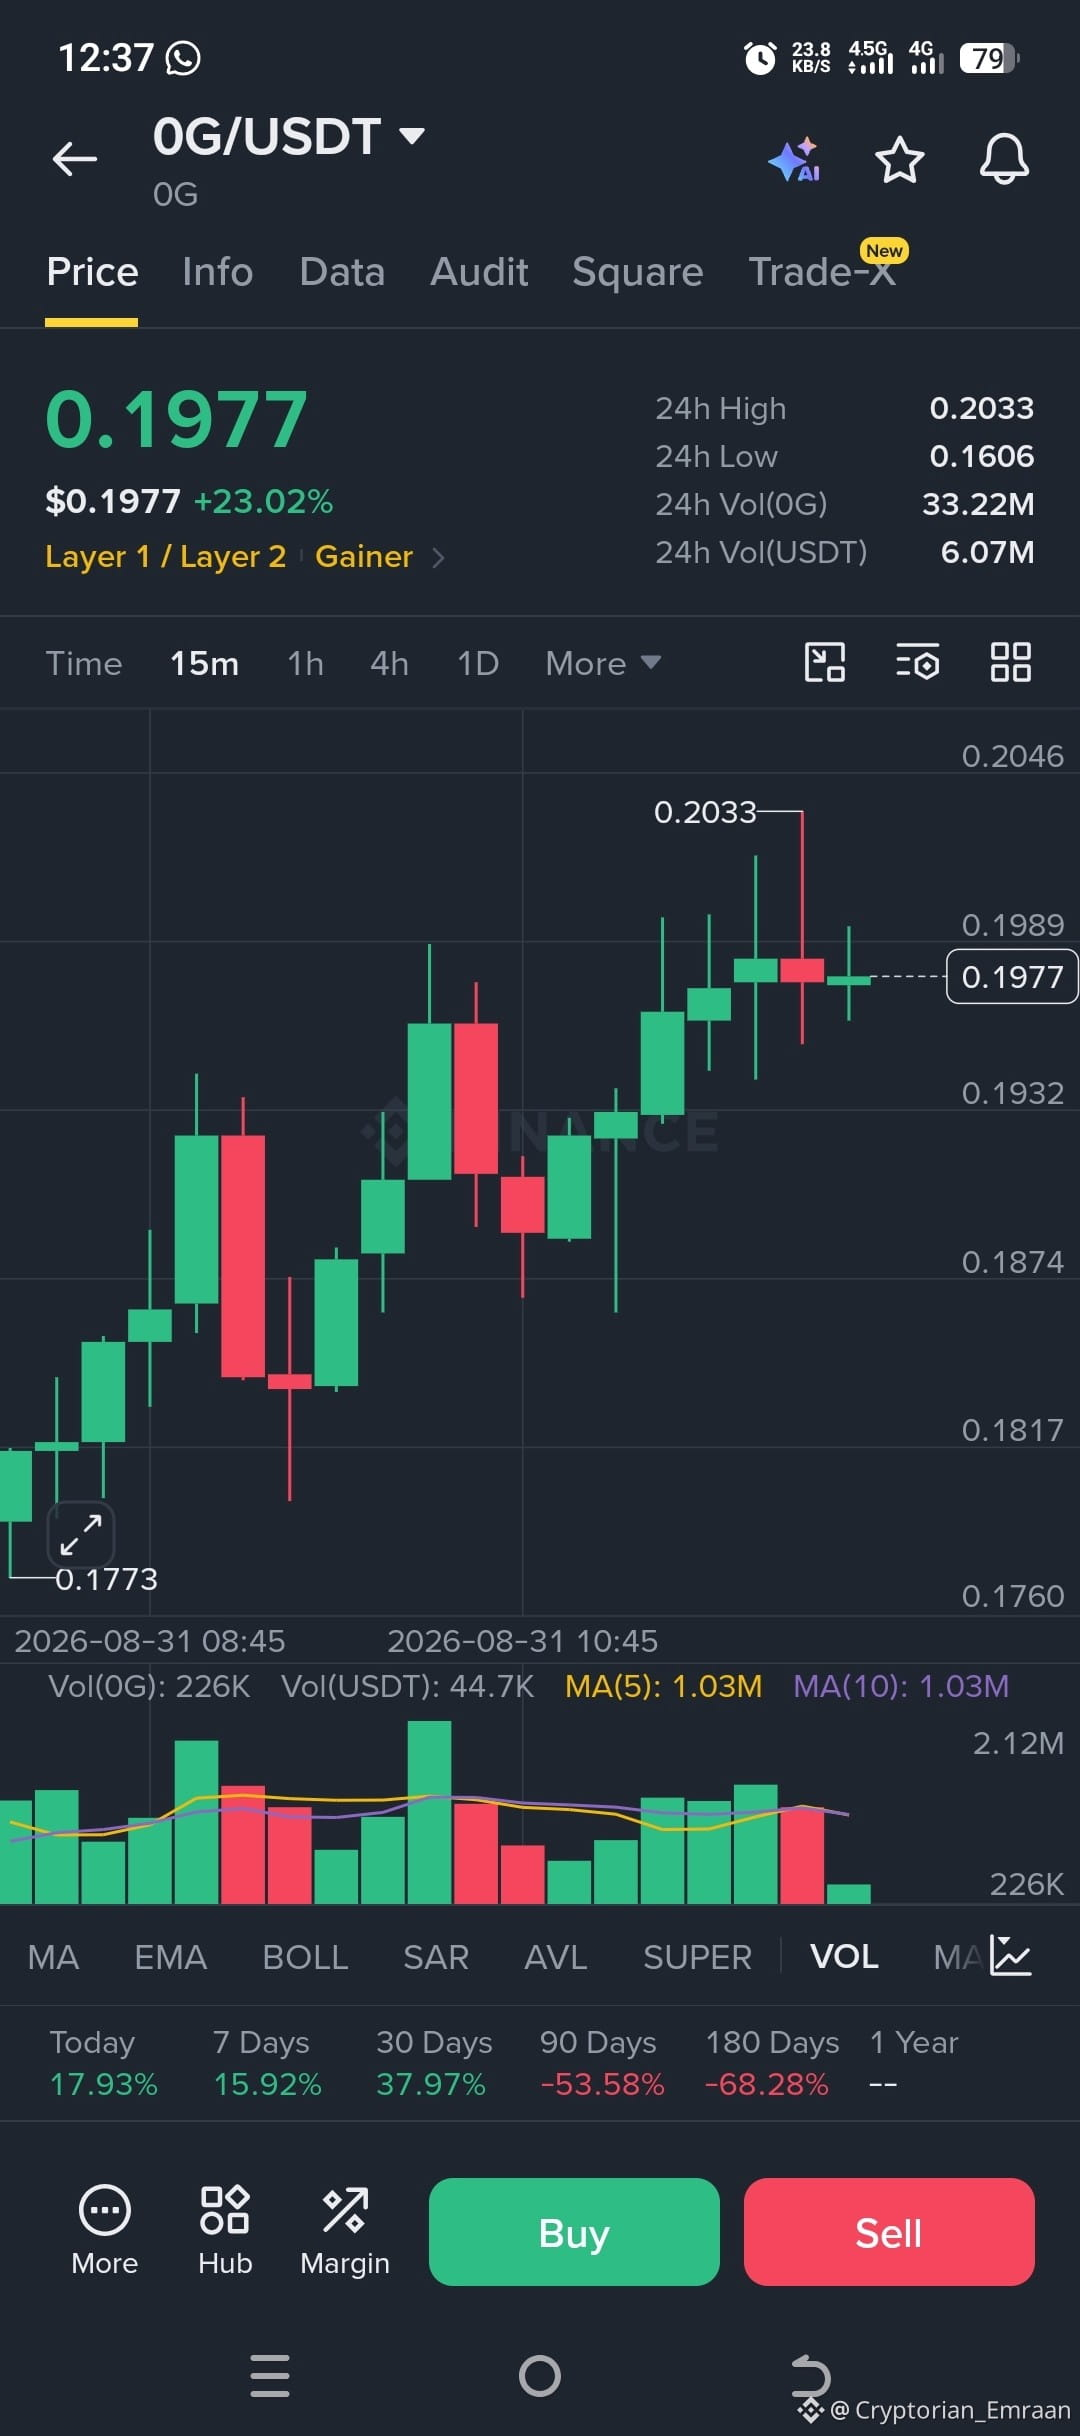
$0G technical read based on the chart (15m, 0G/USDT, current $0.1977, +23% on the day):
Structure: Strong impulsive move from ~0.1773 up to 0.2033, now consolidating in a tight range (0.1970–0.1989) after rejecting the highs. Volume is tapering off on the last few candles, which suggests indecision rather than fresh buying.
Possible entry (long, momentum continuation):
Breakout entry: above 0.1989–0.1995 (recent consolidation high), confirming continuation toward new highs.
Pullback entry: near 0.1932 (prior support/MA zone) if price retraces before continuing.
Possible exit / targets:
First target: 0.2033 (24h high / recent swing high)
Extended target: 0.2046 (next visible resistance on chart)
Stop-loss:
For breakout entry: below 0.1932 (invalidates the current base)
For pullback entry: below 0.1874 (next support shelf down)
Caution: This coin is up 23% in a day with high volatility (24h range 0.1606–0.2033, nearly 25% swing) that's a wide, choppy range, and the pullback candle right at the highs (the red candle touching 0.2033) shows some selling pressure at resistance. Position size accordingly.
I'm not a financial advisor, and this is chart-pattern analysis only, not a recommendation, crypto at this volatility can gap through stops. Do your own risk assessment before entering.
#0G #Binance #crypto #BinanceSquareFamily
{future}(0GUSDT)
$0G technical read based on the chart (15m, 0G/USDT, current $0.1977, +23% on the day):
Structure: Strong impulsive move from ~0.1773 up to 0.2033, now consolidating in a tight range (0.1970–0.1989) after rejecting the highs. Volume is tapering off on the last few candles, which suggests indecision rather than fresh buying.
Possible entry (long, momentum continuation):
Breakout entry: above 0.1989–0.1995 (recent consolidation high), confirming continuation toward new highs.
Pullback entry: near 0.1932 (prior support/MA zone) if price retraces before continuing.
Possible exit / targets:
First target: 0.2033 (24h high / recent swing high)
Extended target: 0.2046 (next visible resistance on chart)
Stop-loss:
For breakout entry: below 0.1932 (invalidates the current base)
For pullback entry: below 0.1874 (next support shelf down)
Caution: This coin is up 23% in a day with high volatility (24h range 0.1606–0.2033, nearly 25% swing) that's a wide, choppy range, and the pullback candle right at the highs (the red candle touching 0.2033) shows some selling pressure at resistance. Position size accordingly.
I'm not a financial advisor, and this is chart-pattern analysis only, not a recommendation, crypto at this volatility can gap through stops. Do your own risk assessment before entering.
#0G #Binance #crypto #BinanceSquareFamily
Structure: Strong impulsive move from ~0.1773 up to 0.2033, now consolidating in a tight range (0.1970–0.1989) after rejecting the highs. Volume is tapering off on the last few candles, which suggests indecision rather than fresh buying.
Possible entry (long, momentum continuation):
Breakout entry: above 0.1989–0.1995 (recent consolidation high), confirming continuation toward new highs.
Pullback entry: near 0.1932 (prior support/MA zone) if price retraces before continuing.
Possible exit / targets:
First target: 0.2033 (24h high / recent swing high)
Extended target: 0.2046 (next visible resistance on chart)
Stop-loss:
For breakout entry: below 0.1932 (invalidates the current base)
For pullback entry: below 0.1874 (next support shelf down)
Caution: This coin is up 23% in a day with high volatility (24h range 0.1606–0.2033, nearly 25% swing) that's a wide, choppy range, and the pullback candle right at the highs (the red candle touching 0.2033) shows some selling pressure at resistance. Position size accordingly.
I'm not a financial advisor, and this is chart-pattern analysis only, not a recommendation, crypto at this volatility can gap through stops. Do your own risk assessment before entering.
#0G #Binance #crypto #BinanceSquareFamily
3
160
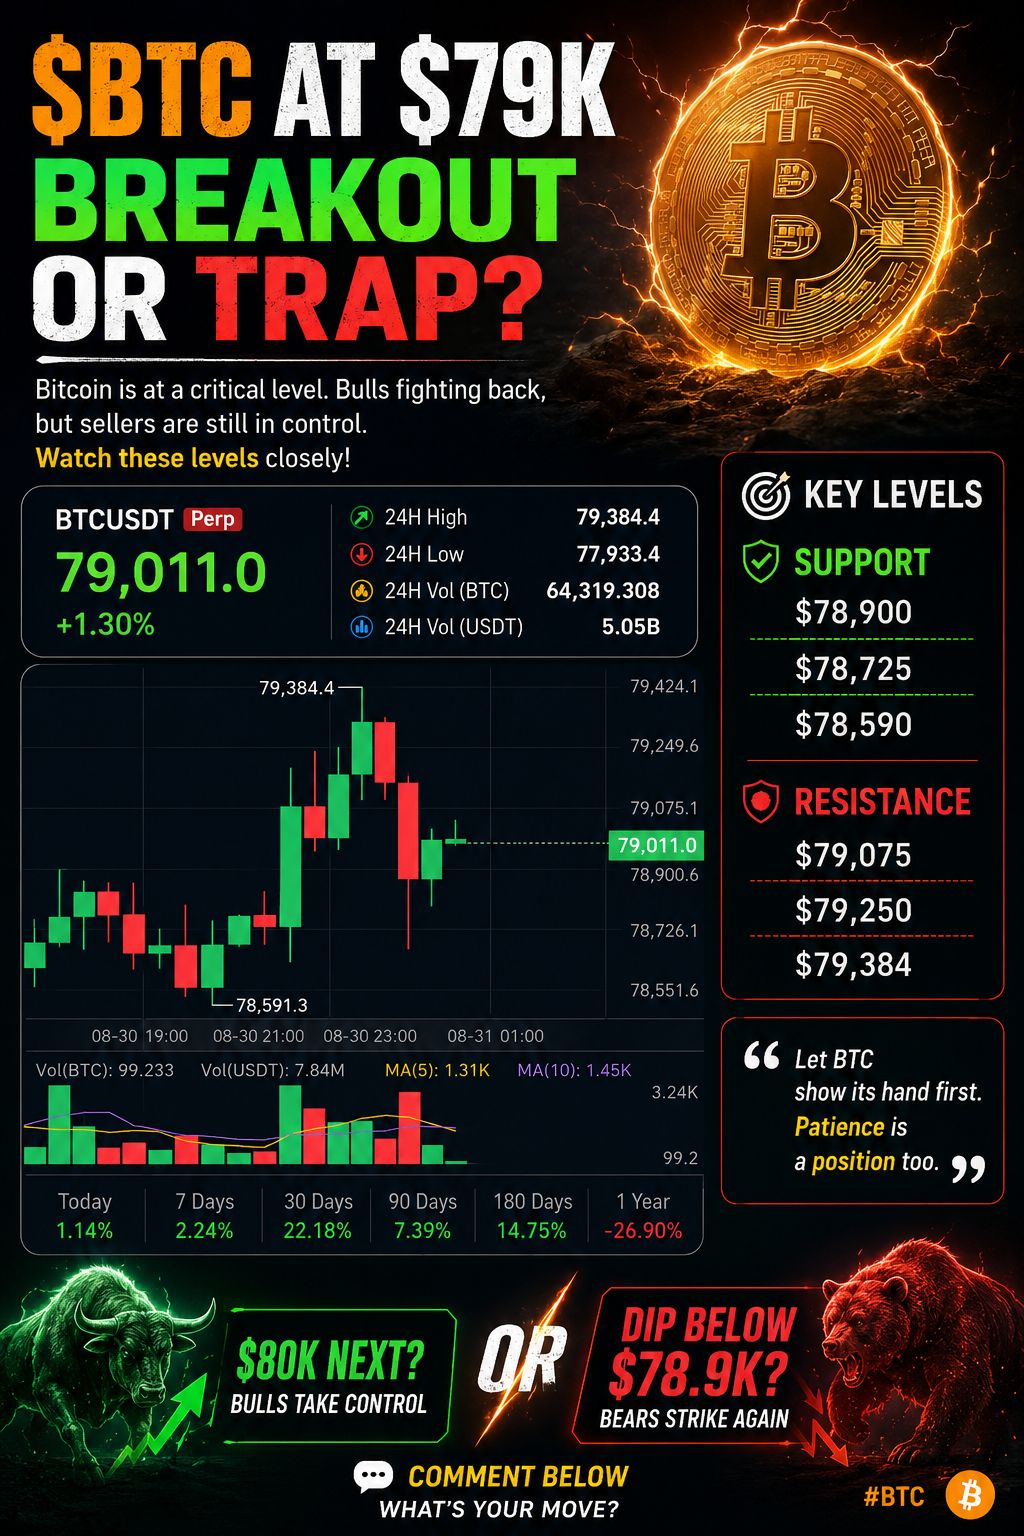
🚨 $BTC AT $79K ➡️ BREAKOUT OR TRAP?
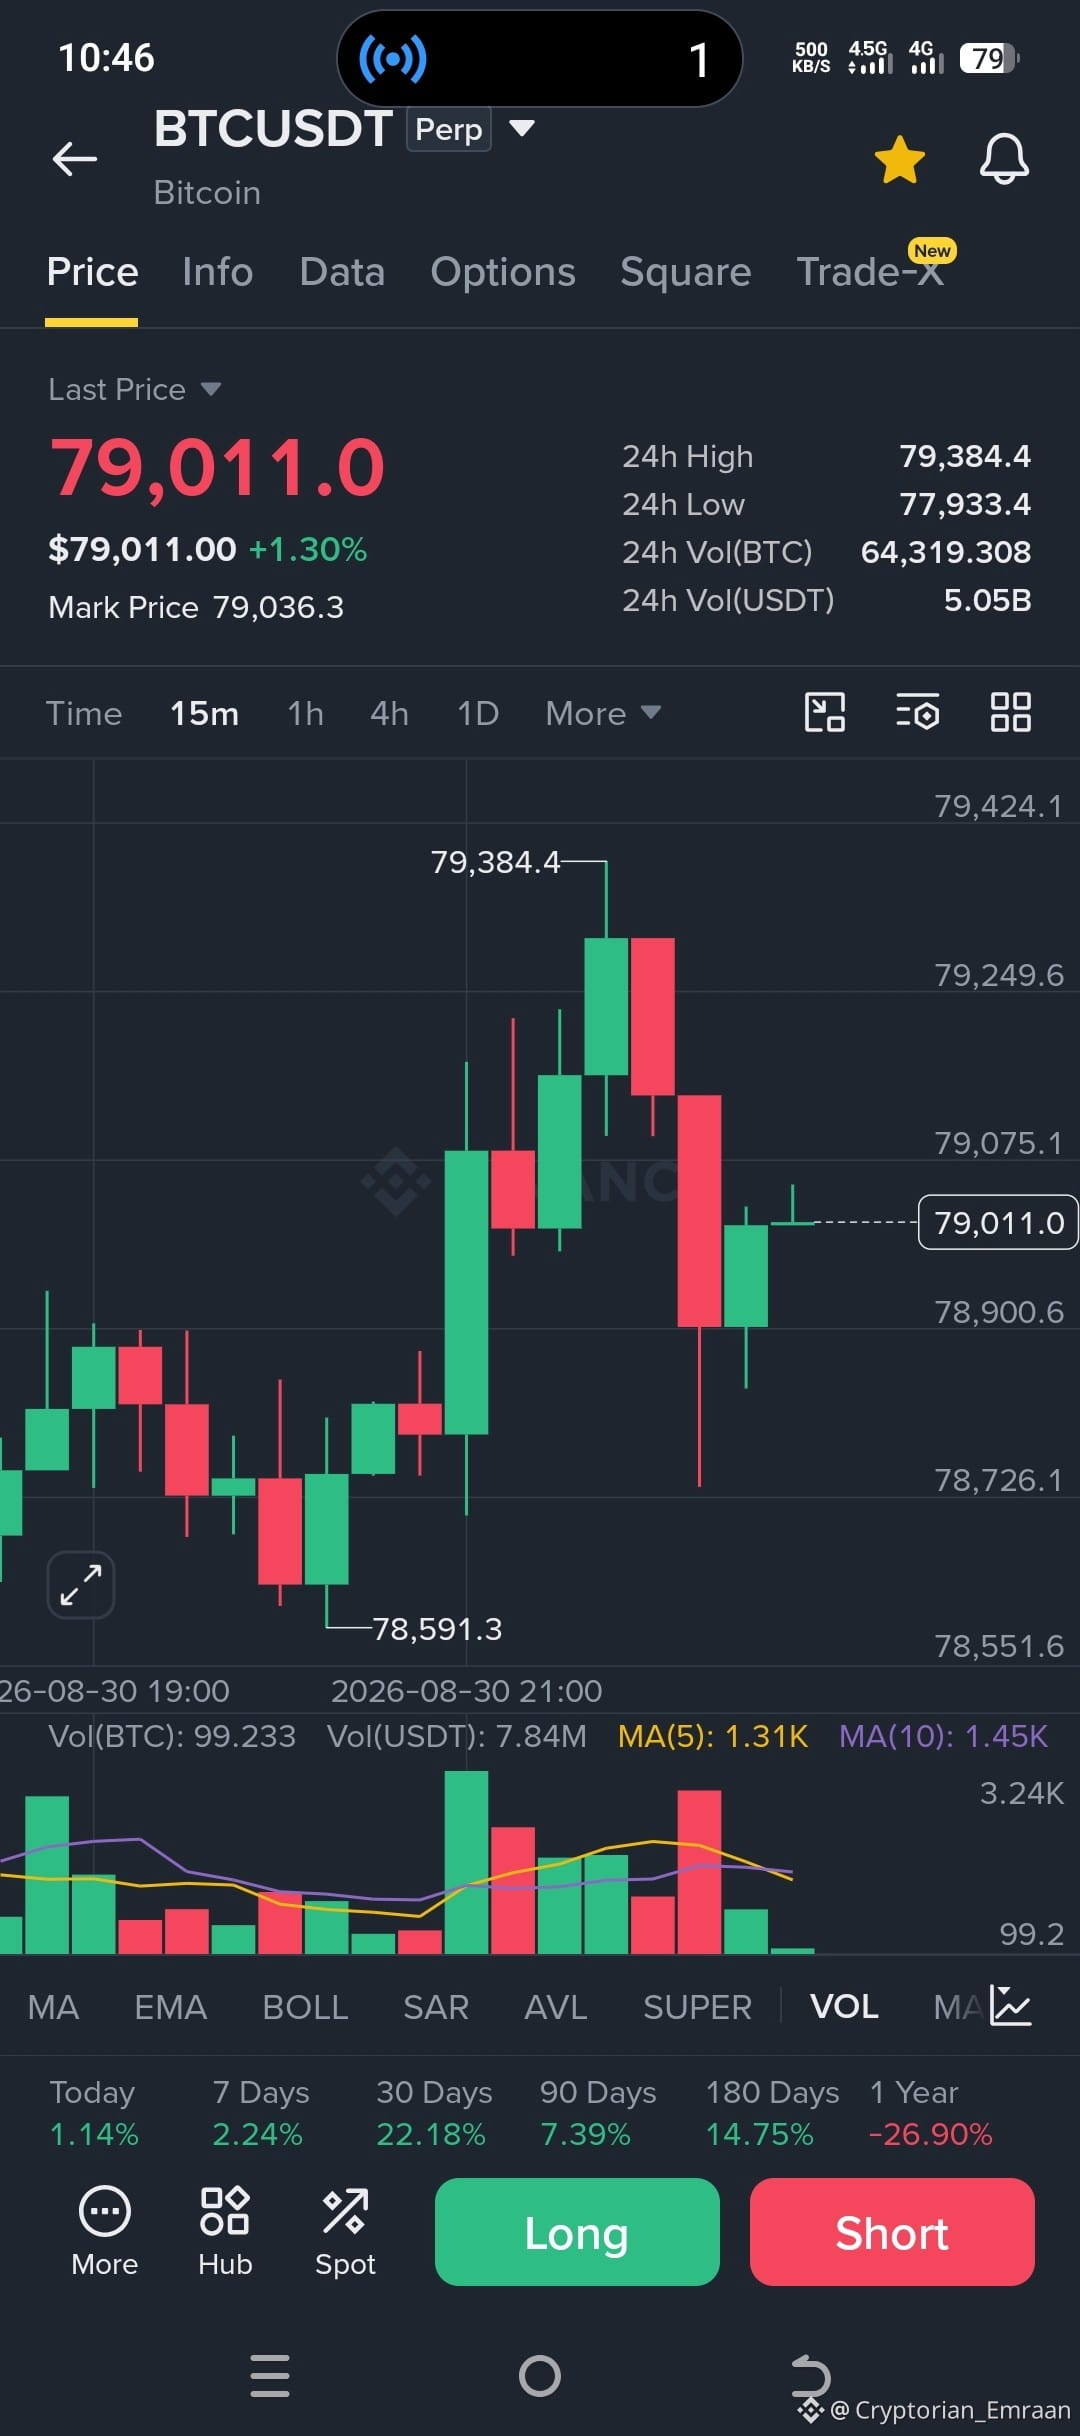
Bitcoin is sitting right around $79,011 after bouncing sharply from the $78,591 area.
Looking at the 15-minute chart, the story is interesting 👀
BTC pushed up to $79,384, but sellers immediately stepped in and dragged price back toward $78,900. The latest candles show buyers trying to reclaim momentum, but volume is starting to cool off.
📊 Levels I’m watching
🟢 Support: $78,900 → $78,725 → $78,590
🔴 Resistance: $79,075 → $79,250 → $79,384
If BTC can reclaim $79,250–$79,400 with strong volume, the next upside expansion could become interesting.
But if $78,900 breaks decisively, I’d expect another test of the lower support zones.
My take: I’m not chasing the middle. Let BTC show its hand first. Patience is a position too. 🧠
🚫 Encourage readers to Do Your Own Research (DYOR) before making any investment decisions.
What do you think ➡️ $80K next, or another liquidity sweep below $78.9K? 👇
#BTC #Bitcoin #Crypto #BinanceSquare #BTCUSDT
{spot}(BTCUSDT)
🚨 $BTC AT $79K ➡️ BREAKOUT OR TRAP?
Bitcoin is sitting right around $79,011 after bouncing sharply from the $78,591 area.
Looking at the 15-minute chart, the story is interesting 👀
BTC pushed up to $79,384, but sellers immediately stepped in and dragged price back toward $78,900. The latest candles show buyers trying to reclaim momentum, but volume is starting to cool off.
📊 Levels I’m watching
🟢 Support: $78,900 → $78,725 → $78,590
🔴 Resistance: $79,075 → $79,250 → $79,384
If BTC can reclaim $79,250–$79,400 with strong volume, the next upside expansion could become interesting.
But if $78,900 breaks decisively, I’d expect another test of the lower support zones.
My take: I’m not chasing the middle. Let BTC show its hand first. Patience is a position too. 🧠
🚫 Encourage readers to Do Your Own Research (DYOR) before making any investment decisions.
What do you think ➡️ $80K next, or another liquidity sweep below $78.9K? 👇
#BTC #Bitcoin #Crypto #BinanceSquare #BTCUSDT
Bitcoin is sitting right around $79,011 after bouncing sharply from the $78,591 area.
Looking at the 15-minute chart, the story is interesting 👀
BTC pushed up to $79,384, but sellers immediately stepped in and dragged price back toward $78,900. The latest candles show buyers trying to reclaim momentum, but volume is starting to cool off.
📊 Levels I’m watching
🟢 Support: $78,900 → $78,725 → $78,590
🔴 Resistance: $79,075 → $79,250 → $79,384
If BTC can reclaim $79,250–$79,400 with strong volume, the next upside expansion could become interesting.
But if $78,900 breaks decisively, I’d expect another test of the lower support zones.
My take: I’m not chasing the middle. Let BTC show its hand first. Patience is a position too. 🧠
🚫 Encourage readers to Do Your Own Research (DYOR) before making any investment decisions.
What do you think ➡️ $80K next, or another liquidity sweep below $78.9K? 👇
#BTC #Bitcoin #Crypto #BinanceSquare #BTCUSDT
1
3
141
🎙️ Have you had enough of the big melon? Come and study the wealth password now!
End
02 h 39 m 44 s
11.2k
22
24
·
--
Bullish
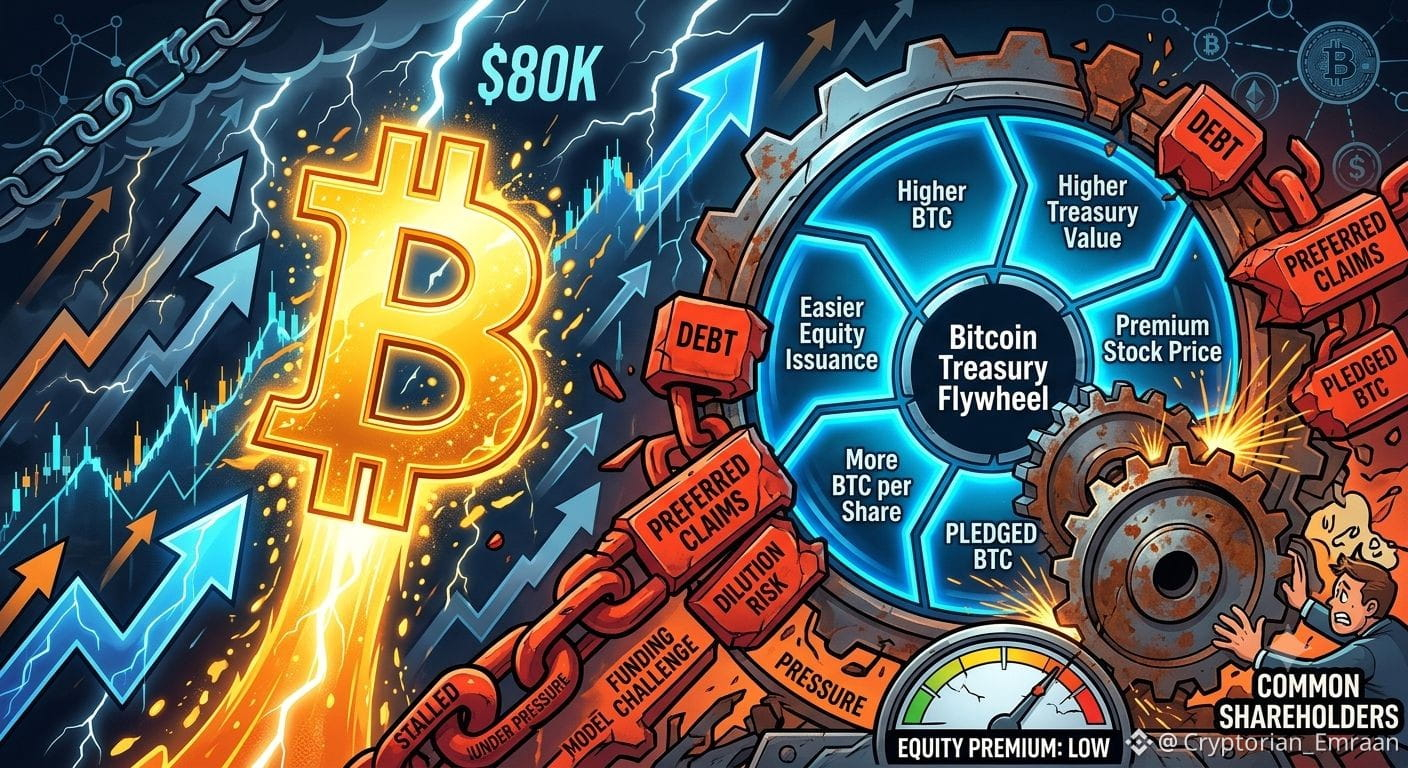
🔥 $BTC at $80K, but Bitcoin Treasury Stocks Aren’t Getting Their Premium Back.
Bitcoin moving back toward $80,000 should theoretically reignite the corporate Bitcoin treasury flywheel:
Higher BTC → higher treasury value → premium stock price → easier equity issuance → more BTC per share.
But that flywheel appears to be under pressure.
Strategy, Twenty One Capital and Metaplanet are still facing a major funding challenge as common-equity discounts collide with debt, preferred claims, pledged BTC and potential dilution.
Strategy is the clearest example. Despite selling 18.26M MSTR shares for roughly $2.0B, the proceeds were directed toward liquidity, preferred-stock repurchases and cash reserves rather than immediately buying more Bitcoin.
That distinction matters.
A treasury company trading below its gross BTC value doesn't automatically mean investors can buy Bitcoin at a discount. Common shareholders sit behind creditors and preferred holders, while future dilution can further reduce BTC exposure per share.
The real question isn't:
“How much Bitcoin does the company own?”
It's:
“How much Bitcoin value actually belongs to each common share after debt, preferred claims, cash and dilution?”
Until the equity premium returns, the traditional Bitcoin → premium → new shares → more Bitcoin flywheel may remain broken.
📊 Is $BTC strength enough to restart the treasury flywheel, or has the model entered a new phase?
#BTC #bitcoin #Binance #BinanceSquareFamily #BTC走势分析
{spot}(BTCUSDT)
🔥 $BTC at $80K, but Bitcoin Treasury Stocks Aren’t Getting Their Premium Back.
Bitcoin moving back toward $80,000 should theoretically reignite the corporate Bitcoin treasury flywheel:
Higher BTC → higher treasury value → premium stock price → easier equity issuance → more BTC per share.
But that flywheel appears to be under pressure.
Strategy, Twenty One Capital and Metaplanet are still facing a major funding challenge as common-equity discounts collide with debt, preferred claims, pledged BTC and potential dilution.
Strategy is the clearest example. Despite selling 18.26M MSTR shares for roughly $2.0B, the proceeds were directed toward liquidity, preferred-stock repurchases and cash reserves rather than immediately buying more Bitcoin.
That distinction matters.
A treasury company trading below its gross BTC value doesn't automatically mean investors can buy Bitcoin at a discount. Common shareholders sit behind creditors and preferred holders, while future dilution can further reduce BTC exposure per share.
The real question isn't:
“How much Bitcoin does the company own?”
It's:
“How much Bitcoin value actually belongs to each common share after debt, preferred claims, cash and dilution?”
Until the equity premium returns, the traditional Bitcoin → premium → new shares → more Bitcoin flywheel may remain broken.
📊 Is $BTC strength enough to restart the treasury flywheel, or has the model entered a new phase?
#BTC #bitcoin #Binance #BinanceSquareFamily #BTC走势分析
Bitcoin moving back toward $80,000 should theoretically reignite the corporate Bitcoin treasury flywheel:
Higher BTC → higher treasury value → premium stock price → easier equity issuance → more BTC per share.
But that flywheel appears to be under pressure.
Strategy, Twenty One Capital and Metaplanet are still facing a major funding challenge as common-equity discounts collide with debt, preferred claims, pledged BTC and potential dilution.
Strategy is the clearest example. Despite selling 18.26M MSTR shares for roughly $2.0B, the proceeds were directed toward liquidity, preferred-stock repurchases and cash reserves rather than immediately buying more Bitcoin.
That distinction matters.
A treasury company trading below its gross BTC value doesn't automatically mean investors can buy Bitcoin at a discount. Common shareholders sit behind creditors and preferred holders, while future dilution can further reduce BTC exposure per share.
The real question isn't:
“How much Bitcoin does the company own?”
It's:
“How much Bitcoin value actually belongs to each common share after debt, preferred claims, cash and dilution?”
Until the equity premium returns, the traditional Bitcoin → premium → new shares → more Bitcoin flywheel may remain broken.
📊 Is $BTC strength enough to restart the treasury flywheel, or has the model entered a new phase?
#BTC #bitcoin #Binance #BinanceSquareFamily #BTC走势分析
1
3
80
Article
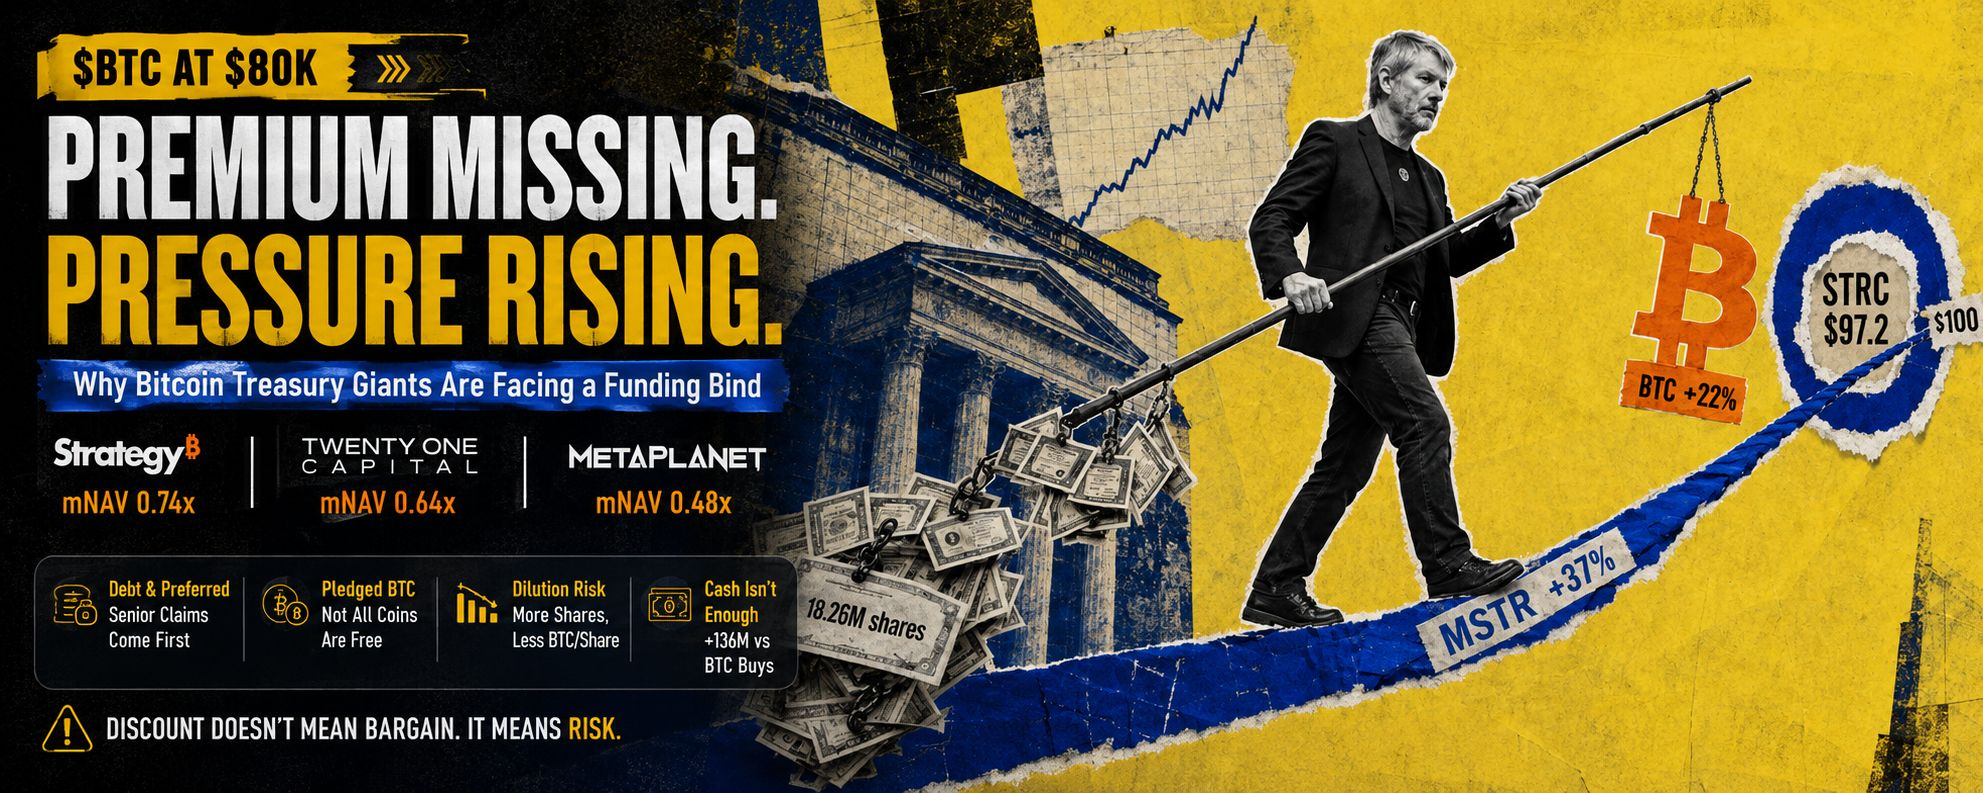
$BTC hit $80,000 but failed to restore BTC treasury premiums at Strategy, 21 Capital or MetaplanetBitcoin hit $80,000 but failed to restore $BTC treasury premiums at Strategy, Twenty One Capital, or Metaplanet
Strategy, Twenty One Capital and Metaplanet still face a funding bind as common-equity discounts collide with debt, pledged coins and dilution.
Bitcoin price is trading near $78,900, close enough to $80,000 to revive the old treasury-company pitch on paper: higher Bitcoin should lift the value of corporate holdings, pull the shares back above net asset value, and reopen common-stock issuance as a source of fresh coins.
That sequence did not return. At Strategy, Twenty One Capital, and Metaplanet, three listed companies built around corporate Bitcoin treasuries, common market capitalization remained well below the gross value of reported Bitcoin holdings. Yet the apparent discount was not uniform, and it did not amount to directly redeemable, cut-price Bitcoin. Debt, preferred stock, pledged coins, cash balances, warrants and different share-count conventions all changed what was left for common shareholders.
The result is a funding problem, not just a valuation puzzle. If common stock no longer trades at a reliable premium, issuing it can dilute Bitcoin per share. Debt and preferred stock avoid immediate common-share dilution but move value and risk toward senior claims. Retained operating cash is the only recurring route that adds neither, but Metaplanet's disclosed cash generation was nowhere near the scale of its recent Bitcoin purchases.
BitcoinTreasuries' Aug. 27 snapshot put Bitcoin at roughly $78,900 and produced the following rounded comparison. The figures are a same-day analytical snapshot, not a perfectly synchronized market close: U.S. overnight quotes and a delayed Tokyo quote were observed at different times, and the dataset displayed different holding dates for the companies.
Those ratios are not interchangeable. Basic mNAV compares basic common market capitalization with gross Bitcoin value. Diluted mNAV expands the share denominator. Enterprise mNAV adds debt and preferred stock and subtracts cash before comparing enterprise value with the Bitcoin stack.
That is why “market cap below Bitcoin value” is an incomplete claim. A share is a residual interest in a company, not a withdrawal ticket for its coins. Common holders sit behind creditors and preferred investors, absorb future dilution, and remain exposed to operating costs, taxes, governance decisions and restrictions on assets. The table's own disagreement is the warning: Twenty One screened at 0.64x on basic mNAV but 1.20x on the dataset's diluted measure.
Strategy's $2 billion sale bought liquidity, not Bitcoin
Strategy offers the clearest test of the old equity flywheel because its enterprise value had recovered to roughly parity with gross Bitcoin value, while both common-equity measures remained near 0.74x.
The company nevertheless sold 18.26 million MSTR shares from Aug. 17 through Aug. 23 for $2.0065 billion of net proceeds. Its Aug. 24 filing reported no Bitcoin purchase for the week. Instead, Strategy allocated $136.4 million to repurchase STRC preferred stock, $300 million to its USD Reserve and the remainder to USD Cash.
By Aug. 23, Strategy reported 840,447 BTC, a $5.10 billion USD Reserve and $1.59 billion of USD Cash. The cash figures included expected proceeds from shares sold but not yet settled.
That choice matters. Common issuance did not mechanically increase Bitcoin per MSTR share; it reinforced liquidity and managed a senior security. Strategy's June-quarter filing showed about $6.75 billion of debt principal, with a carrying value near $6.71 billion. Its June digital-credit framework estimated about $1.76 billion of annual preferred dividends and debt interest combined.
The reserve reduces near-term pressure to fund those obligations from Bitcoin sales, but it also explains why common investors do not own the gross coin stack free of claims. Strategy can still sell shares for corporate purposes when the stock screens below gross Bitcoin value. What it cannot do at that price is assume that every dollar raised and converted into Bitcoin will increase Bitcoin value per old common share.
Common issuance only lifts Bitcoin per share when the coins bought per new share exceed the pre-issue ratio. Fees, cash retained for obligations and differences between basic and diluted share counts all raise that hurdle.
Twenty One Capital presents a different capital structure. It reported 43,514 BTC at June 30 and 346.8 million Class A shares, alongside 215.7 million Class B shares. Its basic mNAV was deeply below 1x in the Aug. 27 snapshot, while diluted mNAV was above 1x.
#BTC走势分析 #BTC #Binance #crypto #BinanceSquareFamily
{spot}(BTCUSDT)
$BTC hit $80,000 but failed to restore BTC treasury premiums at Strategy, 21 Capital or Metaplanet
Bitcoin hit $80,000 but failed to restore $BTC treasury premiums at Strategy, Twenty One Capital, or Metaplanet
Strategy, Twenty One Capital and Metaplanet still face a funding bind as common-equity discounts collide with debt, pledged coins and dilution.
Bitcoin price is trading near $78,900, close enough to $80,000 to revive the old treasury-company pitch on paper: higher Bitcoin should lift the value of corporate holdings, pull the shares back above net asset value, and reopen common-stock issuance as a source of fresh coins.
That sequence did not return. At Strategy, Twenty One Capital, and Metaplanet, three listed companies built around corporate Bitcoin treasuries, common market capitalization remained well below the gross value of reported Bitcoin holdings. Yet the apparent discount was not uniform, and it did not amount to directly redeemable, cut-price Bitcoin. Debt, preferred stock, pledged coins, cash balances, warrants and different share-count conventions all changed what was left for common shareholders.
The result is a funding problem, not just a valuation puzzle. If common stock no longer trades at a reliable premium, issuing it can dilute Bitcoin per share. Debt and preferred stock avoid immediate common-share dilution but move value and risk toward senior claims. Retained operating cash is the only recurring route that adds neither, but Metaplanet's disclosed cash generation was nowhere near the scale of its recent Bitcoin purchases.
BitcoinTreasuries' Aug. 27 snapshot put Bitcoin at roughly $78,900 and produced the following rounded comparison. The figures are a same-day analytical snapshot, not a perfectly synchronized market close: U.S. overnight quotes and a delayed Tokyo quote were observed at different times, and the dataset displayed different holding dates for the companies.
Those ratios are not interchangeable. Basic mNAV compares basic common market capitalization with gross Bitcoin value. Diluted mNAV expands the share denominator. Enterprise mNAV adds debt and preferred stock and subtracts cash before comparing enterprise value with the Bitcoin stack.
That is why “market cap below Bitcoin value” is an incomplete claim. A share is a residual interest in a company, not a withdrawal ticket for its coins. Common holders sit behind creditors and preferred investors, absorb future dilution, and remain exposed to operating costs, taxes, governance decisions and restrictions on assets. The table's own disagreement is the warning: Twenty One screened at 0.64x on basic mNAV but 1.20x on the dataset's diluted measure.
Strategy's $2 billion sale bought liquidity, not Bitcoin
Strategy offers the clearest test of the old equity flywheel because its enterprise value had recovered to roughly parity with gross Bitcoin value, while both common-equity measures remained near 0.74x.
The company nevertheless sold 18.26 million MSTR shares from Aug. 17 through Aug. 23 for $2.0065 billion of net proceeds. Its Aug. 24 filing reported no Bitcoin purchase for the week. Instead, Strategy allocated $136.4 million to repurchase STRC preferred stock, $300 million to its USD Reserve and the remainder to USD Cash.
By Aug. 23, Strategy reported 840,447 BTC, a $5.10 billion USD Reserve and $1.59 billion of USD Cash. The cash figures included expected proceeds from shares sold but not yet settled.
That choice matters. Common issuance did not mechanically increase Bitcoin per MSTR share; it reinforced liquidity and managed a senior security. Strategy's June-quarter filing showed about $6.75 billion of debt principal, with a carrying value near $6.71 billion. Its June digital-credit framework estimated about $1.76 billion of annual preferred dividends and debt interest combined.
The reserve reduces near-term pressure to fund those obligations from Bitcoin sales, but it also explains why common investors do not own the gross coin stack free of claims. Strategy can still sell shares for corporate purposes when the stock screens below gross Bitcoin value. What it cannot do at that price is assume that every dollar raised and converted into Bitcoin will increase Bitcoin value per old common share.
Common issuance only lifts Bitcoin per share when the coins bought per new share exceed the pre-issue ratio. Fees, cash retained for obligations and differences between basic and diluted share counts all raise that hurdle.
Twenty One Capital presents a different capital structure. It reported 43,514 BTC at June 30 and 346.8 million Class A shares, alongside 215.7 million Class B shares. Its basic mNAV was deeply below 1x in the Aug. 27 snapshot, while diluted mNAV was above 1x.
#BTC走势分析 #BTC #Binance #crypto #BinanceSquareFamily
Strategy, Twenty One Capital and Metaplanet still face a funding bind as common-equity discounts collide with debt, pledged coins and dilution.
Bitcoin price is trading near $78,900, close enough to $80,000 to revive the old treasury-company pitch on paper: higher Bitcoin should lift the value of corporate holdings, pull the shares back above net asset value, and reopen common-stock issuance as a source of fresh coins.
That sequence did not return. At Strategy, Twenty One Capital, and Metaplanet, three listed companies built around corporate Bitcoin treasuries, common market capitalization remained well below the gross value of reported Bitcoin holdings. Yet the apparent discount was not uniform, and it did not amount to directly redeemable, cut-price Bitcoin. Debt, preferred stock, pledged coins, cash balances, warrants and different share-count conventions all changed what was left for common shareholders.
The result is a funding problem, not just a valuation puzzle. If common stock no longer trades at a reliable premium, issuing it can dilute Bitcoin per share. Debt and preferred stock avoid immediate common-share dilution but move value and risk toward senior claims. Retained operating cash is the only recurring route that adds neither, but Metaplanet's disclosed cash generation was nowhere near the scale of its recent Bitcoin purchases.
BitcoinTreasuries' Aug. 27 snapshot put Bitcoin at roughly $78,900 and produced the following rounded comparison. The figures are a same-day analytical snapshot, not a perfectly synchronized market close: U.S. overnight quotes and a delayed Tokyo quote were observed at different times, and the dataset displayed different holding dates for the companies.
Those ratios are not interchangeable. Basic mNAV compares basic common market capitalization with gross Bitcoin value. Diluted mNAV expands the share denominator. Enterprise mNAV adds debt and preferred stock and subtracts cash before comparing enterprise value with the Bitcoin stack.
That is why “market cap below Bitcoin value” is an incomplete claim. A share is a residual interest in a company, not a withdrawal ticket for its coins. Common holders sit behind creditors and preferred investors, absorb future dilution, and remain exposed to operating costs, taxes, governance decisions and restrictions on assets. The table's own disagreement is the warning: Twenty One screened at 0.64x on basic mNAV but 1.20x on the dataset's diluted measure.
Strategy's $2 billion sale bought liquidity, not Bitcoin
Strategy offers the clearest test of the old equity flywheel because its enterprise value had recovered to roughly parity with gross Bitcoin value, while both common-equity measures remained near 0.74x.
The company nevertheless sold 18.26 million MSTR shares from Aug. 17 through Aug. 23 for $2.0065 billion of net proceeds. Its Aug. 24 filing reported no Bitcoin purchase for the week. Instead, Strategy allocated $136.4 million to repurchase STRC preferred stock, $300 million to its USD Reserve and the remainder to USD Cash.
By Aug. 23, Strategy reported 840,447 BTC, a $5.10 billion USD Reserve and $1.59 billion of USD Cash. The cash figures included expected proceeds from shares sold but not yet settled.
That choice matters. Common issuance did not mechanically increase Bitcoin per MSTR share; it reinforced liquidity and managed a senior security. Strategy's June-quarter filing showed about $6.75 billion of debt principal, with a carrying value near $6.71 billion. Its June digital-credit framework estimated about $1.76 billion of annual preferred dividends and debt interest combined.
The reserve reduces near-term pressure to fund those obligations from Bitcoin sales, but it also explains why common investors do not own the gross coin stack free of claims. Strategy can still sell shares for corporate purposes when the stock screens below gross Bitcoin value. What it cannot do at that price is assume that every dollar raised and converted into Bitcoin will increase Bitcoin value per old common share.
Common issuance only lifts Bitcoin per share when the coins bought per new share exceed the pre-issue ratio. Fees, cash retained for obligations and differences between basic and diluted share counts all raise that hurdle.
Twenty One Capital presents a different capital structure. It reported 43,514 BTC at June 30 and 346.8 million Class A shares, alongside 215.7 million Class B shares. Its basic mNAV was deeply below 1x in the Aug. 27 snapshot, while diluted mNAV was above 1x.
#BTC走势分析 #BTC #Binance #crypto #BinanceSquareFamily
1
3
99
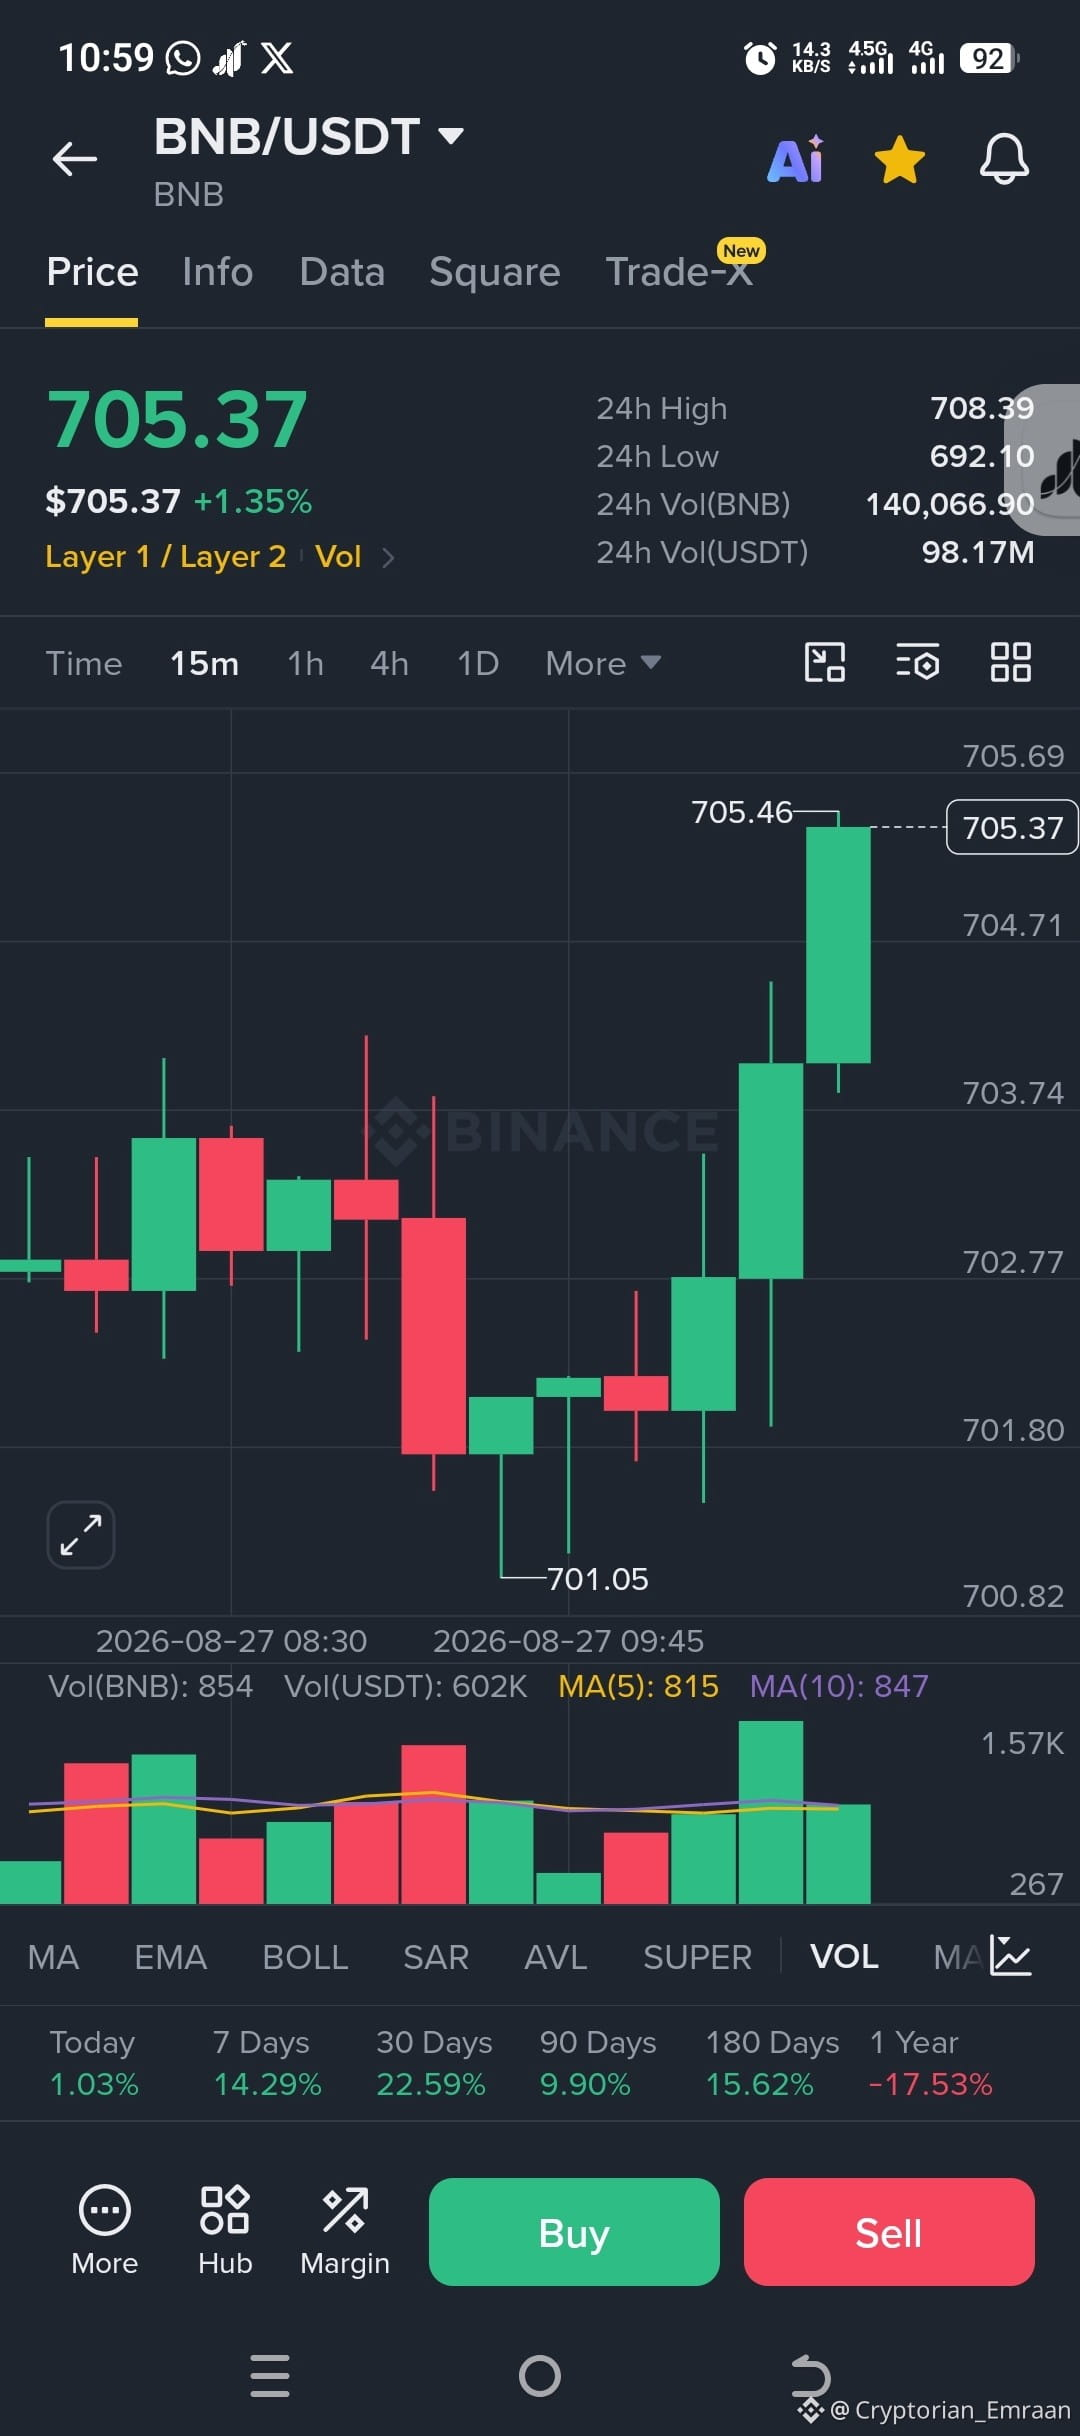
Based on the 15-minute BNB/USDT chart provided, here is the technical breakdown of key support and resistance levels.
Immediate Levels (Visible Range)
✨Immediate Resistance: $705.46
This is the local peak formed by the most recent green candlestick. A breakout above this level pushes price toward the 24-hour high.
✨Major 24h Resistance: $708.39
The 24-hour high listed at the top right, serving as the strongest overhead resistance on this timeframe.
✨Immediate Support: $701.05
The bottom of the wick from the recent drop, acting as the primary local floor for price action.
✨Major 24h Support: $692.10
The 24-hour low, serving as the key macro support level if price breaks back down below $700.
✨Key Technical Observations
Consolidation Zone:
Between $702.30 and $703.50, there was a minor consolidation area where price held prior to the recent bullish move.
✨Current Momentum: Price is currently trading near $705.37 with high buying volume on the latest 15-minute candle, testing the local resistance at $705.46.
To give more tailored insights:
Are you looking to enter a short-term trade, or are you tracking this for a longer swing position?
#bnb #Binance #crypto #BinanceSquareFamily
{spot}(BNBUSDT)
Based on the 15-minute BNB/USDT chart provided, here is the technical breakdown of key support and resistance levels.
Immediate Levels (Visible Range)
✨Immediate Resistance: $705.46
This is the local peak formed by the most recent green candlestick. A breakout above this level pushes price toward the 24-hour high.
✨Major 24h Resistance: $708.39
The 24-hour high listed at the top right, serving as the strongest overhead resistance on this timeframe.
✨Immediate Support: $701.05
The bottom of the wick from the recent drop, acting as the primary local floor for price action.
✨Major 24h Support: $692.10
The 24-hour low, serving as the key macro support level if price breaks back down below $700.
✨Key Technical Observations
Consolidation Zone:
Between $702.30 and $703.50, there was a minor consolidation area where price held prior to the recent bullish move.
✨Current Momentum: Price is currently trading near $705.37 with high buying volume on the latest 15-minute candle, testing the local resistance at $705.46.
To give more tailored insights:
Are you looking to enter a short-term trade, or are you tracking this for a longer swing position?
#bnb #Binance #crypto #BinanceSquareFamily
Immediate Levels (Visible Range)
✨Immediate Resistance: $705.46
This is the local peak formed by the most recent green candlestick. A breakout above this level pushes price toward the 24-hour high.
✨Major 24h Resistance: $708.39
The 24-hour high listed at the top right, serving as the strongest overhead resistance on this timeframe.
✨Immediate Support: $701.05
The bottom of the wick from the recent drop, acting as the primary local floor for price action.
✨Major 24h Support: $692.10
The 24-hour low, serving as the key macro support level if price breaks back down below $700.
✨Key Technical Observations
Consolidation Zone:
Between $702.30 and $703.50, there was a minor consolidation area where price held prior to the recent bullish move.
✨Current Momentum: Price is currently trading near $705.37 with high buying volume on the latest 15-minute candle, testing the local resistance at $705.46.
To give more tailored insights:
Are you looking to enter a short-term trade, or are you tracking this for a longer swing position?
#bnb #Binance #crypto #BinanceSquareFamily
1
2
99
🌴 Good Vibes + Big Web3 Energy! 💛
The Binance Angels SEA team recently united in Bali to bring you closer to the Binance Clubhouse experience! From building alongside top creators to empowering the local community, this is what Web3 is all about. 🚀
Want to dive deeper into the community culture and catch the full recap?
@Binance_Angels
@CryptoImranX
🔥 Set your alerts for our upcoming Live Session!
📅 August 27 | 19:00
👇 Drop a 💛 in the comments if you're tuned in, and smash that "Remind Me" button!
$BNB #BinanceSquareTG #Binance #CryptoLife #BNBChain
{spot}(BNBUSDT)
🌴 Good Vibes + Big Web3 Energy! 💛
The Binance Angels SEA team recently united in Bali to bring you closer to the Binance Clubhouse experience! From building alongside top creators to empowering the local community, this is what Web3 is all about. 🚀
Want to dive deeper into the community culture and catch the full recap?
@Binance Angels
@Cryptorian_Emraan
🔥 Set your alerts for our upcoming Live Session!
📅 August 27 | 19:00
👇 Drop a 💛 in the comments if you're tuned in, and smash that "Remind Me" button!
$BNB #BinanceSquareTG #Binance #CryptoLife #BNBChain
The Binance Angels SEA team recently united in Bali to bring you closer to the Binance Clubhouse experience! From building alongside top creators to empowering the local community, this is what Web3 is all about. 🚀
Want to dive deeper into the community culture and catch the full recap?
@Binance Angels
@Cryptorian_Emraan
🔥 Set your alerts for our upcoming Live Session!
📅 August 27 | 19:00
👇 Drop a 💛 in the comments if you're tuned in, and smash that "Remind Me" button!
$BNB #BinanceSquareTG #Binance #CryptoLife #BNBChain

1
2
91


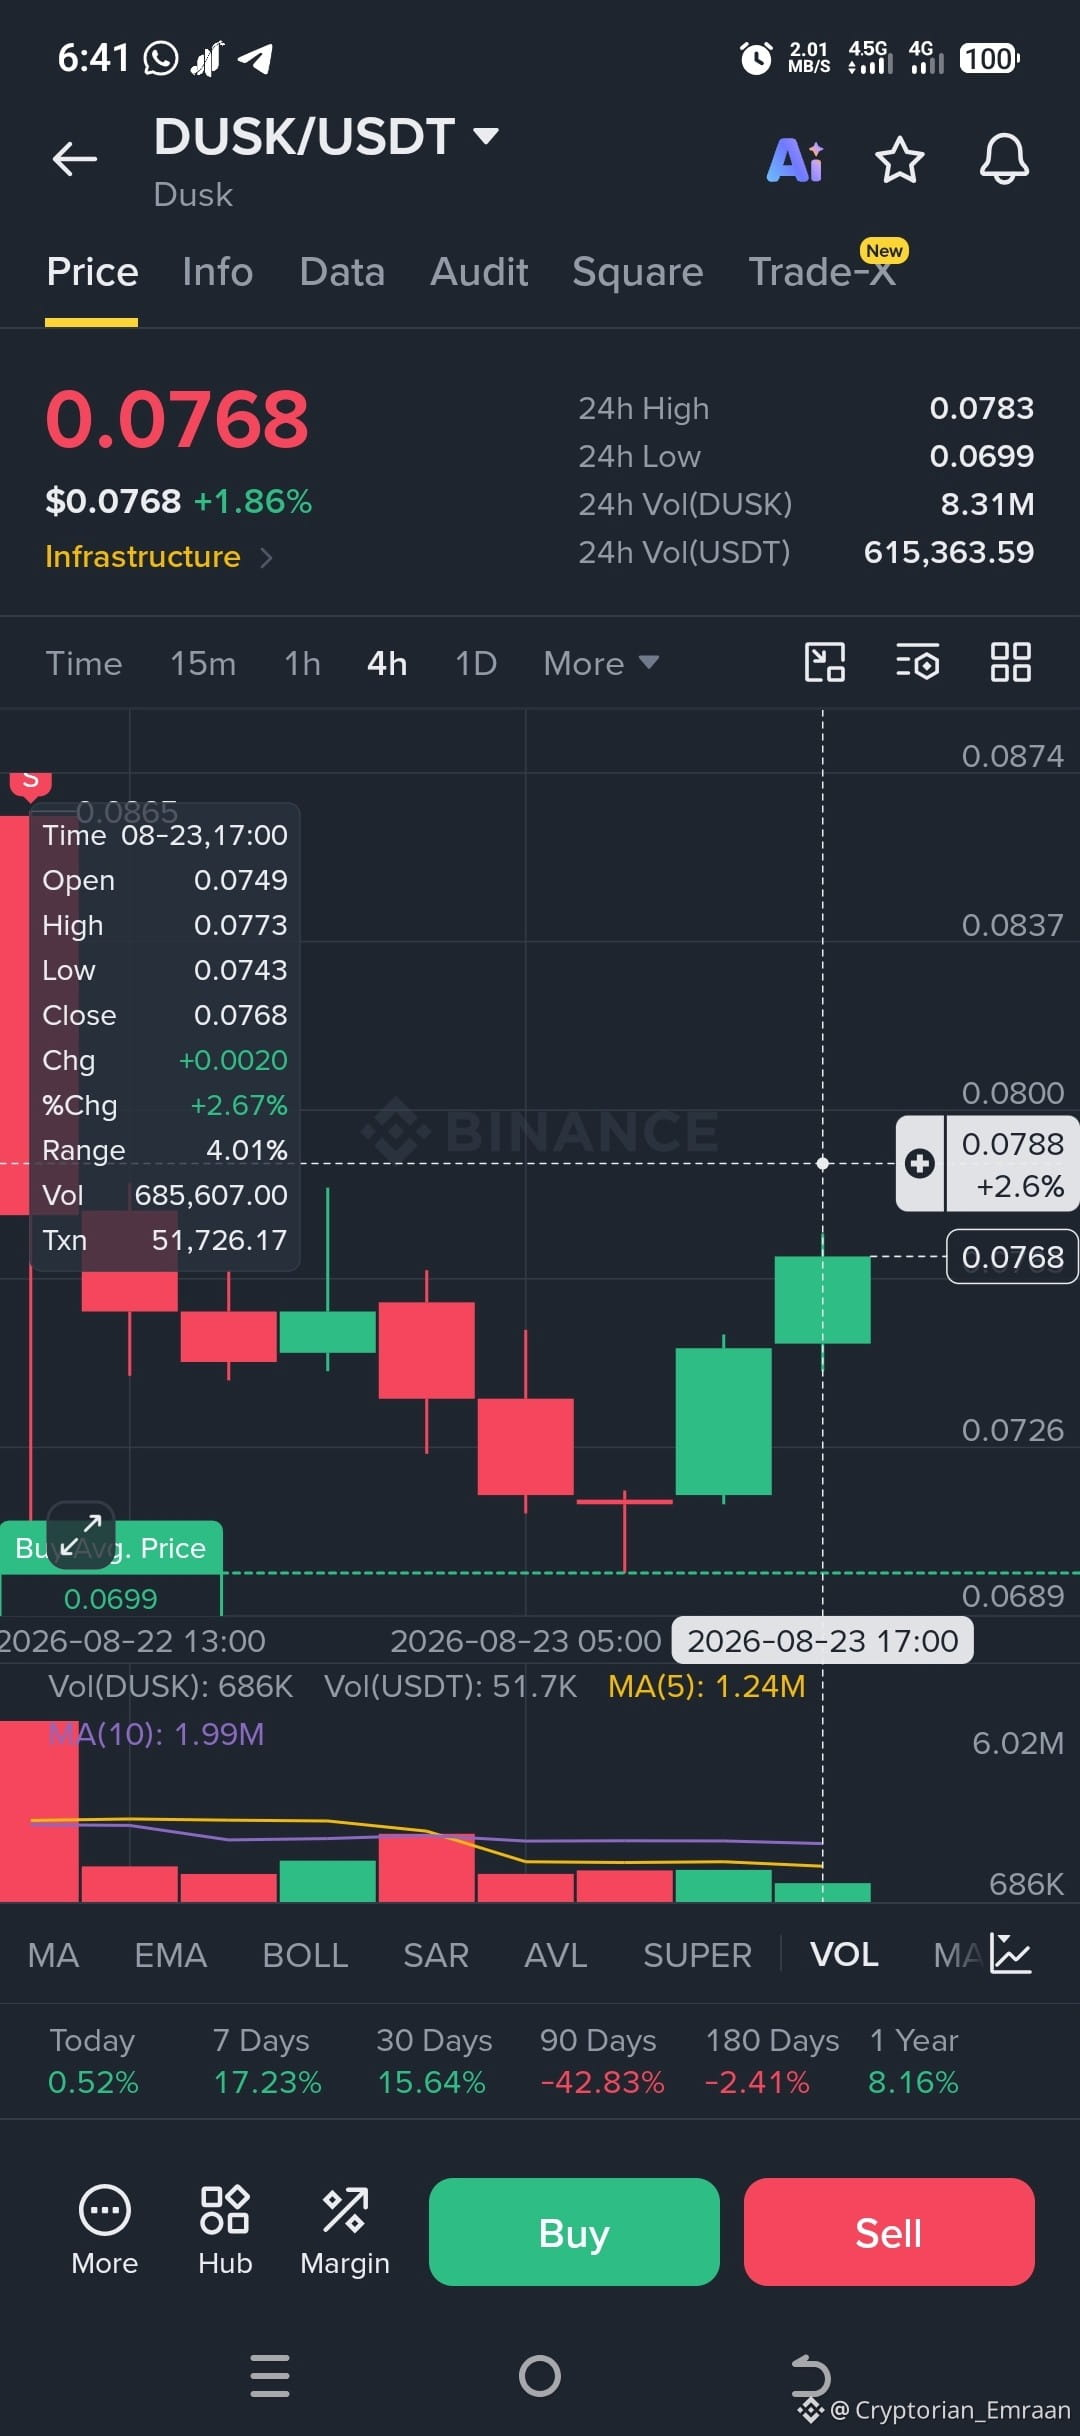
🔥 $DUSK SPOT BUY? The Rebound Is Testing a Critical Supply Zone.
📊 DUSK/USDT - 4H Technical Breakdown
Current price: $0.0768
Verdict: 🟢 Conditional Spot BUY
Probability: 68/100
Risk: Medium
The chart shows a short-term bullish recovery from the $0.0699 demand zone, with buyers producing consecutive strong green candles and reclaiming the $0.0740–$0.0750 area.
Market Structure:
Recent price action is shifting toward higher lows + higher highs, but confirmation is still needed above the $0.0783–$0.0788 resistance.
🎯 Key Levels
• Support: $0.0743 / $0.0726 / $0.0699
• Resistance: $0.0783–$0.0788 / $0.0800 / $0.0837 / $0.0874
🟢 Preferred Entry: $0.0740–$0.0752 on a controlled pullback.
🚀 Breakout Entry: Above $0.0788 after a confirmed 4H close and retest.
🛑 Stop-Loss: $0.0694
🎯 TP1: $0.0800
🎯 TP2: $0.0837
🎯 TP3: $0.0874
📈 Volume: The rebound is occurring with improving buying activity, but current volume remains below the larger MA volume averages. A breakout with strong volume would significantly improve confirmation.
⚠️ RSI, MACD and Bollinger Bands are not displayed on the attached chart, so they cannot be reliably assessed without inventing data.
Bullish invalidation: A decisive 4H close below $0.0699 would weaken the recovery thesis and invalidate this setup.
🧠 Trader’s Summary: DUSK is recovering strongly from demand, but price is now approaching major resistance. I prefer buying a confirmed pullback rather than chasing the current candle.
💰 For spot trading, keep position size controlled and risk only a small portion of capital. Consider scaling in rather than entering the entire position at once.
⚠️ This analysis is based solely on the attached chart and is not financial advice. DYOR before investing.
❓ Will $DUSK break $0.0788 with volume, or will sellers reject the rally again?
#dusk #DUSKUSDT #crypto #Binance @Dusk_Foundation
🔥 $DUSK SPOT BUY? The Rebound Is Testing a Critical Supply Zone.
📊 DUSK/USDT - 4H Technical Breakdown
Current price: $0.0768
Verdict: 🟢 Conditional Spot BUY
Probability: 68/100
Risk: Medium
The chart shows a short-term bullish recovery from the $0.0699 demand zone, with buyers producing consecutive strong green candles and reclaiming the $0.0740–$0.0750 area.
Market Structure:
Recent price action is shifting toward higher lows + higher highs, but confirmation is still needed above the $0.0783–$0.0788 resistance.
🎯 Key Levels
• Support: $0.0743 / $0.0726 / $0.0699
• Resistance: $0.0783–$0.0788 / $0.0800 / $0.0837 / $0.0874
🟢 Preferred Entry: $0.0740–$0.0752 on a controlled pullback.
🚀 Breakout Entry: Above $0.0788 after a confirmed 4H close and retest.
🛑 Stop-Loss: $0.0694
🎯 TP1: $0.0800
🎯 TP2: $0.0837
🎯 TP3: $0.0874
📈 Volume: The rebound is occurring with improving buying activity, but current volume remains below the larger MA volume averages. A breakout with strong volume would significantly improve confirmation.
⚠️ RSI, MACD and Bollinger Bands are not displayed on the attached chart, so they cannot be reliably assessed without inventing data.
Bullish invalidation: A decisive 4H close below $0.0699 would weaken the recovery thesis and invalidate this setup.
🧠 Trader’s Summary: DUSK is recovering strongly from demand, but price is now approaching major resistance. I prefer buying a confirmed pullback rather than chasing the current candle.
💰 For spot trading, keep position size controlled and risk only a small portion of capital. Consider scaling in rather than entering the entire position at once.
⚠️ This analysis is based solely on the attached chart and is not financial advice. DYOR before investing.
❓ Will $DUSK break $0.0788 with volume, or will sellers reject the rally again?
#dusk #DUSKUSDT #crypto #Binance @Dusk
📊 DUSK/USDT - 4H Technical Breakdown
Current price: $0.0768
Verdict: 🟢 Conditional Spot BUY
Probability: 68/100
Risk: Medium
The chart shows a short-term bullish recovery from the $0.0699 demand zone, with buyers producing consecutive strong green candles and reclaiming the $0.0740–$0.0750 area.
Market Structure:
Recent price action is shifting toward higher lows + higher highs, but confirmation is still needed above the $0.0783–$0.0788 resistance.
🎯 Key Levels
• Support: $0.0743 / $0.0726 / $0.0699
• Resistance: $0.0783–$0.0788 / $0.0800 / $0.0837 / $0.0874
🟢 Preferred Entry: $0.0740–$0.0752 on a controlled pullback.
🚀 Breakout Entry: Above $0.0788 after a confirmed 4H close and retest.
🛑 Stop-Loss: $0.0694
🎯 TP1: $0.0800
🎯 TP2: $0.0837
🎯 TP3: $0.0874
📈 Volume: The rebound is occurring with improving buying activity, but current volume remains below the larger MA volume averages. A breakout with strong volume would significantly improve confirmation.
⚠️ RSI, MACD and Bollinger Bands are not displayed on the attached chart, so they cannot be reliably assessed without inventing data.
Bullish invalidation: A decisive 4H close below $0.0699 would weaken the recovery thesis and invalidate this setup.
🧠 Trader’s Summary: DUSK is recovering strongly from demand, but price is now approaching major resistance. I prefer buying a confirmed pullback rather than chasing the current candle.
💰 For spot trading, keep position size controlled and risk only a small portion of capital. Consider scaling in rather than entering the entire position at once.
⚠️ This analysis is based solely on the attached chart and is not financial advice. DYOR before investing.
❓ Will $DUSK break $0.0788 with volume, or will sellers reject the rally again?
#dusk #DUSKUSDT #crypto #Binance @Dusk
2
1
3
100
🚨 $DUSK +17%: Breakout or the Perfect Bull Trap?
DUSK/USDT ➡️1D Spot Analysis
Dusk is showing a clear bullish market structure, with higher highs and higher lows. Price has pushed from the $0.0599 area to $0.0884, breaking above the previous $0.0773 resistance.
📍 Current Price: $0.0845
🟢 Trend: Bullish
🟢 Momentum: Buyers in control
⚠️ Risk: Medium → High → price is extended after a +17% daily move.
Key Levels
Resistance: $0.0884 → $0.0899 → $0.0950 → $0.1020
Support: $0.0817 → $0.0773 → $0.0710 → $0.0681–$0.0688
🎯 Spot Strategy
Preferred Entry: $0.0790–$0.0817 on a confirmed pullback.
Stop-Loss: $0.0765
→ TP1: $0.0884
→ TP2: $0.0950
→ TP3: $0.1020
At an average entry around $0.0805, the approximate R:R is 1:2 → 1:3.6 → 1:5.4.
Technical Read
Fibonacci retracement from $0.0599 to $0.0884 places the 23.6% level near $0.0817 and 38.2% near $0.0775, making this pullback zone technically important.
Volume supported the breakout, but the latest volume bars are declining while price remains elevated. That creates a momentum-divergence risk and makes chasing the current price less attractive.
RSI, MACD, price MAs and Bollinger Bands are not visible on the supplied chart, so they cannot be reliably confirmed.
📊 Buy Probability: 72% if price retests support and confirms a bounce; lower if buying at $0.0845.
Invalidation: A sustained daily close below $0.0773 weakens the bullish structure significantly.
🟡 FINAL VERDICT: WAIT FOR CONFIRMATION
The trend is bullish, but $DUSK is already extended. The higher-probability spot approach is to wait for a controlled pullback toward $0.0790–$0.0817 and look for buyer confirmation rather than chasing the breakout.
Use position sizing and never risk more than you can afford to lose. This analysis is based solely on the attached chart and is not financial advice. DYOR.
🔥 Technical question: Can $DUSK reclaim and hold $0.0884, or will this breakout turn into a bull trap?
#DUSK #Crypto #Binance #TechnicalAnalysis @Dusk_Foundation
🚨 $DUSK +17%: Breakout or the Perfect Bull Trap?
DUSK/USDT ➡️1D Spot Analysis
Dusk is showing a clear bullish market structure, with higher highs and higher lows. Price has pushed from the $0.0599 area to $0.0884, breaking above the previous $0.0773 resistance.
📍 Current Price: $0.0845
🟢 Trend: Bullish
🟢 Momentum: Buyers in control
⚠️ Risk: Medium → High → price is extended after a +17% daily move.
Key Levels
Resistance: $0.0884 → $0.0899 → $0.0950 → $0.1020
Support: $0.0817 → $0.0773 → $0.0710 → $0.0681–$0.0688
🎯 Spot Strategy
Preferred Entry: $0.0790–$0.0817 on a confirmed pullback.
Stop-Loss: $0.0765
→ TP1: $0.0884
→ TP2: $0.0950
→ TP3: $0.1020
At an average entry around $0.0805, the approximate R:R is 1:2 → 1:3.6 → 1:5.4.
Technical Read
Fibonacci retracement from $0.0599 to $0.0884 places the 23.6% level near $0.0817 and 38.2% near $0.0775, making this pullback zone technically important.
Volume supported the breakout, but the latest volume bars are declining while price remains elevated. That creates a momentum-divergence risk and makes chasing the current price less attractive.
RSI, MACD, price MAs and Bollinger Bands are not visible on the supplied chart, so they cannot be reliably confirmed.
📊 Buy Probability: 72% if price retests support and confirms a bounce; lower if buying at $0.0845.
Invalidation: A sustained daily close below $0.0773 weakens the bullish structure significantly.
🟡 FINAL VERDICT: WAIT FOR CONFIRMATION
The trend is bullish, but $DUSK is already extended. The higher-probability spot approach is to wait for a controlled pullback toward $0.0790–$0.0817 and look for buyer confirmation rather than chasing the breakout.
Use position sizing and never risk more than you can afford to lose. This analysis is based solely on the attached chart and is not financial advice. DYOR.
🔥 Technical question: Can $DUSK reclaim and hold $0.0884, or will this breakout turn into a bull trap?
#DUSK #Crypto #Binance #TechnicalAnalysis @Dusk
DUSK/USDT ➡️1D Spot Analysis
Dusk is showing a clear bullish market structure, with higher highs and higher lows. Price has pushed from the $0.0599 area to $0.0884, breaking above the previous $0.0773 resistance.
📍 Current Price: $0.0845
🟢 Trend: Bullish
🟢 Momentum: Buyers in control
⚠️ Risk: Medium → High → price is extended after a +17% daily move.
Key Levels
Resistance: $0.0884 → $0.0899 → $0.0950 → $0.1020
Support: $0.0817 → $0.0773 → $0.0710 → $0.0681–$0.0688
🎯 Spot Strategy
Preferred Entry: $0.0790–$0.0817 on a confirmed pullback.
Stop-Loss: $0.0765
→ TP1: $0.0884
→ TP2: $0.0950
→ TP3: $0.1020
At an average entry around $0.0805, the approximate R:R is 1:2 → 1:3.6 → 1:5.4.
Technical Read
Fibonacci retracement from $0.0599 to $0.0884 places the 23.6% level near $0.0817 and 38.2% near $0.0775, making this pullback zone technically important.
Volume supported the breakout, but the latest volume bars are declining while price remains elevated. That creates a momentum-divergence risk and makes chasing the current price less attractive.
RSI, MACD, price MAs and Bollinger Bands are not visible on the supplied chart, so they cannot be reliably confirmed.
📊 Buy Probability: 72% if price retests support and confirms a bounce; lower if buying at $0.0845.
Invalidation: A sustained daily close below $0.0773 weakens the bullish structure significantly.
🟡 FINAL VERDICT: WAIT FOR CONFIRMATION
The trend is bullish, but $DUSK is already extended. The higher-probability spot approach is to wait for a controlled pullback toward $0.0790–$0.0817 and look for buyer confirmation rather than chasing the breakout.
Use position sizing and never risk more than you can afford to lose. This analysis is based solely on the attached chart and is not financial advice. DYOR.
🔥 Technical question: Can $DUSK reclaim and hold $0.0884, or will this breakout turn into a bull trap?
#DUSK #Crypto #Binance #TechnicalAnalysis @Dusk
3
3
101
🎙️ When the market is looking good, you should go all in and make bold moves—come in and listen to how to handle the next steps!

End
02 h 01 m 16 s
1.3k
3
4
·
--
Bullish
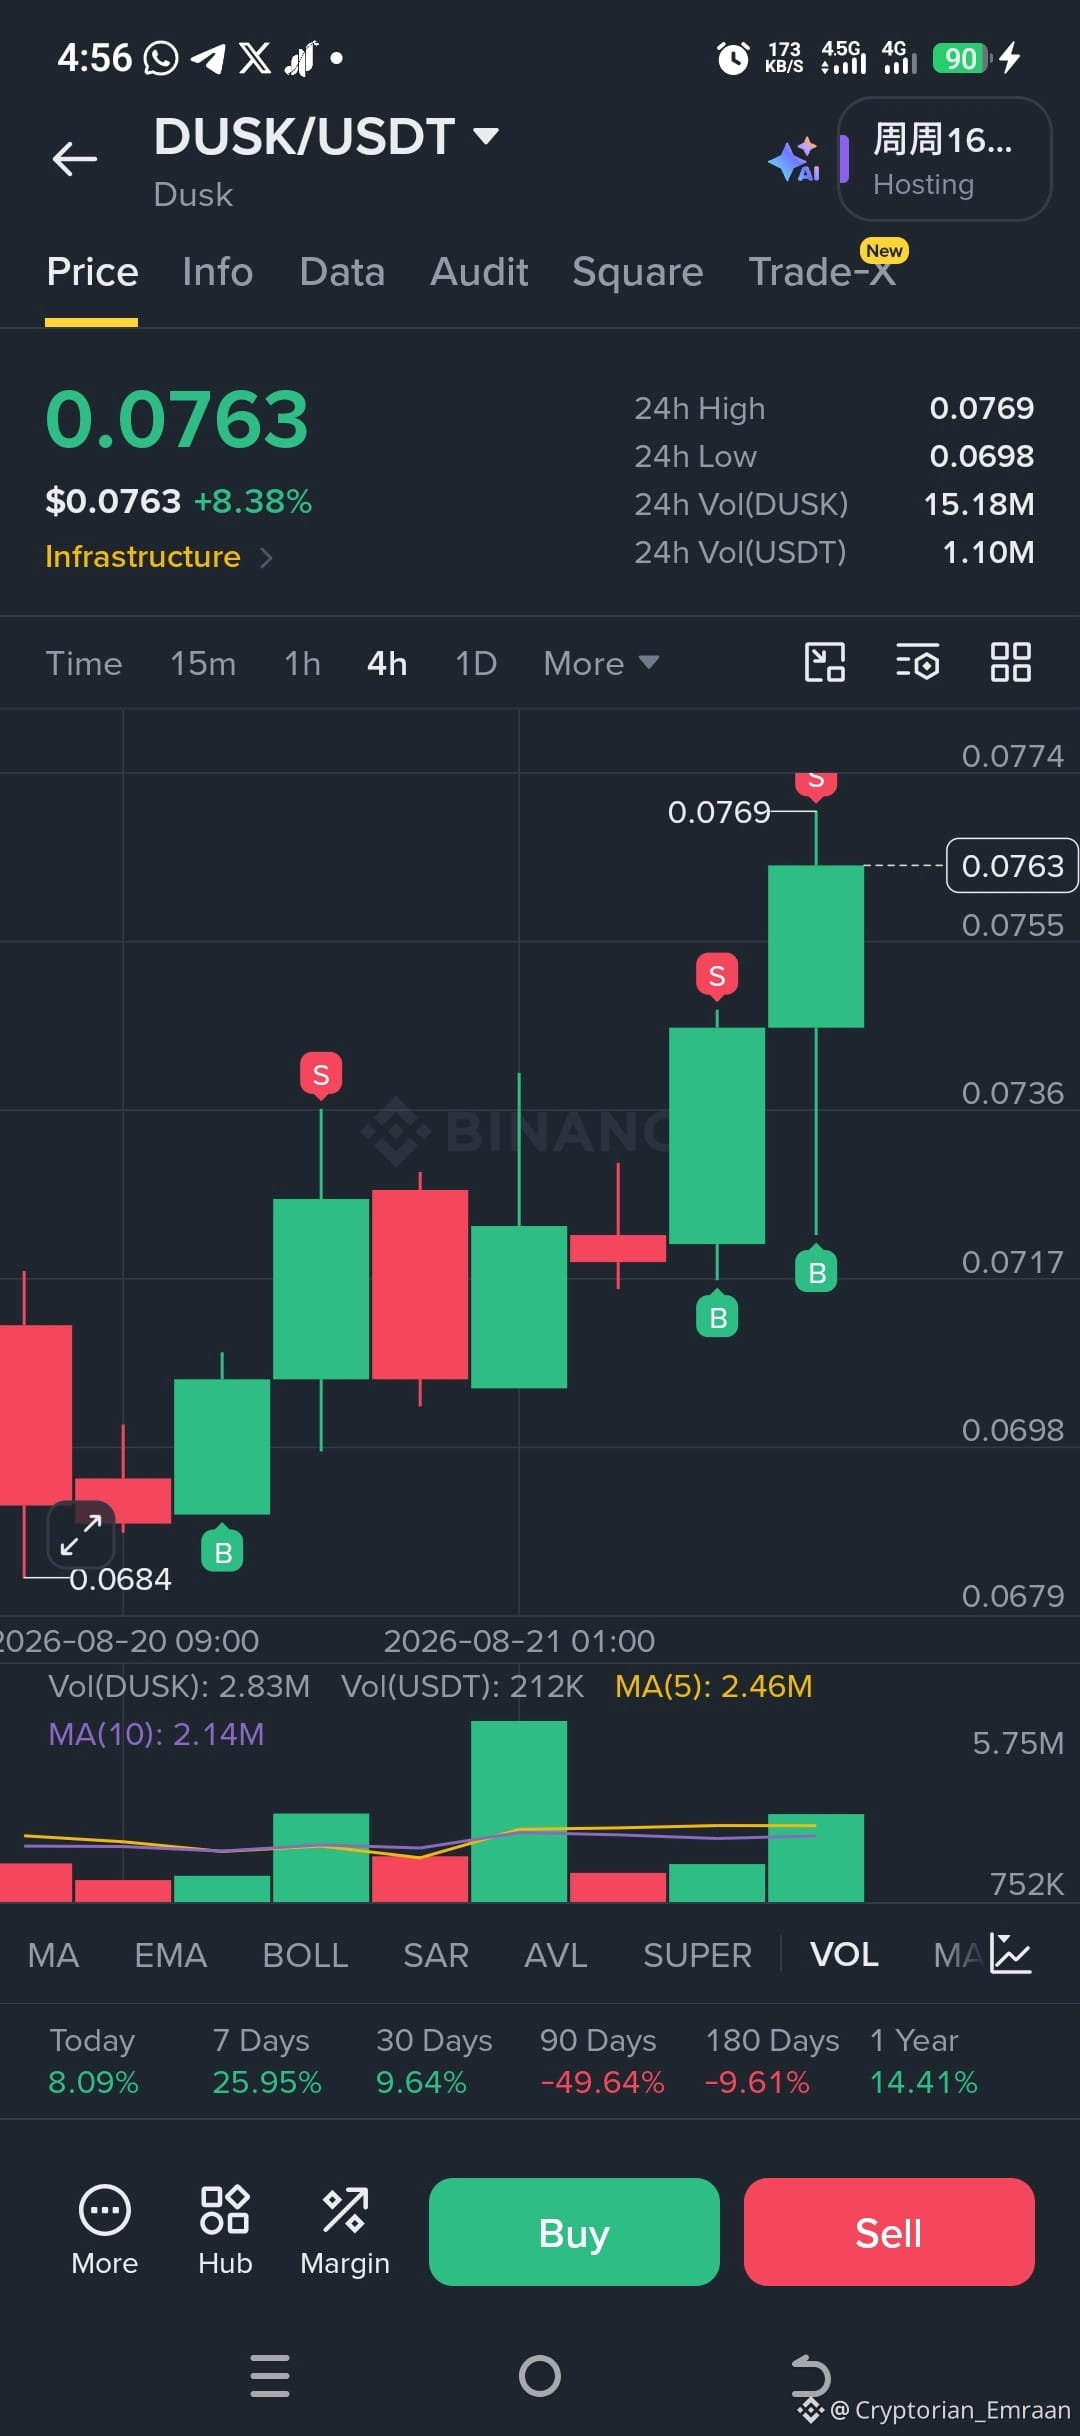
$DUSK Based on the 4H DUSK/USDT chart, the structure is currently bullish, with higher lows and strong green candles.
📊 Major Support & Resistance
🟢 Support zones
$0.0735– $0.0737 - Immediate support; recent breakout area.
$0.0715– $0.0720 - Stronger support and previous consolidation zone.
$0.0698– $0.0702 -Major support; important if the current structure breaks.
$0.0684 - Key swing-low support visible on the chart.
🔴 Resistance zones
$0.0769–$0.0774 - Immediate/major resistance. Current price is testing this area.
$0.0785–$0.0800 - If $0.0774 breaks convincingly, this becomes the next psychological resistance zone.
Above $0.0800, the chart would need fresh price action to establish the next resistance.
🔥 What I'm watching
At $0.0763, DUSK is sitting just below the $0.0769–$0.0774 resistance.
A 4H close above $0.0774 with strong volume would strengthen the bullish breakout case.
If rejected, the first pullback area I'd watch is $0.0735–$0.0737, followed by $0.0715–$0.0720.
Key level: $0.0774
Bullish above: $0.0774
Risk increases below: $0.0735
Major structural support: $0.0715–$0.0720
#Dusk/usdt✅ #Binance
{spot}(DUSKUSDT)
{spot}(BTCUSDT)
$DUSK Based on the 4H DUSK/USDT chart, the structure is currently bullish, with higher lows and strong green candles.
📊 Major Support & Resistance
🟢 Support zones
$0.0735– $0.0737 - Immediate support; recent breakout area.
$0.0715– $0.0720 - Stronger support and previous consolidation zone.
$0.0698– $0.0702 -Major support; important if the current structure breaks.
$0.0684 - Key swing-low support visible on the chart.
🔴 Resistance zones
$0.0769–$0.0774 - Immediate/major resistance. Current price is testing this area.
$0.0785–$0.0800 - If $0.0774 breaks convincingly, this becomes the next psychological resistance zone.
Above $0.0800, the chart would need fresh price action to establish the next resistance.
🔥 What I'm watching
At $0.0763, DUSK is sitting just below the $0.0769–$0.0774 resistance.
A 4H close above $0.0774 with strong volume would strengthen the bullish breakout case.
If rejected, the first pullback area I'd watch is $0.0735–$0.0737, followed by $0.0715–$0.0720.
Key level: $0.0774
Bullish above: $0.0774
Risk increases below: $0.0735
Major structural support: $0.0715–$0.0720
#Dusk/usdt✅ #Binance
📊 Major Support & Resistance
🟢 Support zones
$0.0735– $0.0737 - Immediate support; recent breakout area.
$0.0715– $0.0720 - Stronger support and previous consolidation zone.
$0.0698– $0.0702 -Major support; important if the current structure breaks.
$0.0684 - Key swing-low support visible on the chart.
🔴 Resistance zones
$0.0769–$0.0774 - Immediate/major resistance. Current price is testing this area.
$0.0785–$0.0800 - If $0.0774 breaks convincingly, this becomes the next psychological resistance zone.
Above $0.0800, the chart would need fresh price action to establish the next resistance.
🔥 What I'm watching
At $0.0763, DUSK is sitting just below the $0.0769–$0.0774 resistance.
A 4H close above $0.0774 with strong volume would strengthen the bullish breakout case.
If rejected, the first pullback area I'd watch is $0.0735–$0.0737, followed by $0.0715–$0.0720.
Key level: $0.0774
Bullish above: $0.0774
Risk increases below: $0.0735
Major structural support: $0.0715–$0.0720
#Dusk/usdt✅ #Binance
2
4
88
🔐 What if DUSK’s real opportunity isn’t the next pump but the privacy problem in financial markets?
One thing I’ve started looking at differently with $DUSK is the balance between privacy and compliance.
Public blockchains are great for transparency, but traditional financial markets often deal with information that cannot simply be exposed to everyone.
That creates an interesting infrastructure challenge:
• How can transactions remain confidential?
• How can authorised parties still verify what matters?
• Can blockchain privacy work alongside regulatory requirements?
This is where DUSK’s broader thesis becomes interesting to me.
I’m less interested in chasing a candle and more interested in whether the technology can eventually translate into real financial utility and adoption.
For traders, the chart still matters. But for spot investors, I believe the bigger question is whether the fundamental thesis continues strengthening over time.
Trader’s summary: Without the attached chart, I’m avoiding specific entry, target, and stop-loss levels. Spot investors should avoid chasing sharp moves, use sensible position sizing, and define risk before entering.
This analysis is based solely on the available information and is not financial advice. 🚫DYOR before investing.
Technical question: Would you trust a DUSK breakout more if it comes with strong volume and a successful resistance retest?
#dusk $DUSK @Dusk_Foundation
🔐 What if DUSK’s real opportunity isn’t the next pump but the privacy problem in financial markets?
One thing I’ve started looking at differently with $DUSK is the balance between privacy and compliance.
Public blockchains are great for transparency, but traditional financial markets often deal with information that cannot simply be exposed to everyone.
That creates an interesting infrastructure challenge:
• How can transactions remain confidential?
• How can authorised parties still verify what matters?
• Can blockchain privacy work alongside regulatory requirements?
This is where DUSK’s broader thesis becomes interesting to me.
I’m less interested in chasing a candle and more interested in whether the technology can eventually translate into real financial utility and adoption.
For traders, the chart still matters. But for spot investors, I believe the bigger question is whether the fundamental thesis continues strengthening over time.
Trader’s summary: Without the attached chart, I’m avoiding specific entry, target, and stop-loss levels. Spot investors should avoid chasing sharp moves, use sensible position sizing, and define risk before entering.
This analysis is based solely on the available information and is not financial advice. 🚫DYOR before investing.
Technical question: Would you trust a DUSK breakout more if it comes with strong volume and a successful resistance retest?
#dusk $DUSK @Dusk
One thing I’ve started looking at differently with $DUSK is the balance between privacy and compliance.
Public blockchains are great for transparency, but traditional financial markets often deal with information that cannot simply be exposed to everyone.
That creates an interesting infrastructure challenge:
• How can transactions remain confidential?
• How can authorised parties still verify what matters?
• Can blockchain privacy work alongside regulatory requirements?
This is where DUSK’s broader thesis becomes interesting to me.
I’m less interested in chasing a candle and more interested in whether the technology can eventually translate into real financial utility and adoption.
For traders, the chart still matters. But for spot investors, I believe the bigger question is whether the fundamental thesis continues strengthening over time.
Trader’s summary: Without the attached chart, I’m avoiding specific entry, target, and stop-loss levels. Spot investors should avoid chasing sharp moves, use sensible position sizing, and define risk before entering.
This analysis is based solely on the available information and is not financial advice. 🚫DYOR before investing.
Technical question: Would you trust a DUSK breakout more if it comes with strong volume and a successful resistance retest?
#dusk $DUSK @Dusk
1
3
78
📊 Is $DUSK preparing for another breakout?
My current view on $DUSK/USDT is LONG, but with patience. On the 4H chart, price is around $0.0701, after climbing from the $0.0621 swing low toward the $0.0729 24H high.
📈 Trade Setup
• Entry Zone: $0.0679–$0.0687
• 🛑 Stop Loss: $0.0658
• 🎯 TP1: $0.0711
• 🎯 TP2: $0.0729
• 🎯 TP3: $0.0760
The structure remains constructive with higher lows and strong bullish candles. Volume expanded during the rally, while the latest pullback shows sellers have not yet destroyed the structure. Visible MA(5) is around 1.57M and MA(10) around 1.62M. 24H volume is approximately 10.90M DUSK.
The key area I’m watching is $0.0679–$0.0687. Holding it could keep the bullish structure intact, while a clean break above $0.0729 would strengthen the continuation setup.
🧠 Patience is a position too. Good traders manage risk before chasing momentum.
Follow the trend, not your emotions.
NOTE: This analysis reflects my personal research and market perspective. It is not financial advice. Always do your own research (DYOR) before making any investment decisions.
#dusk $DUSK @Dusk_Foundation #BTC #bnb
📊 Is $DUSK preparing for another breakout?
My current view on $DUSK /USDT is LONG, but with patience. On the 4H chart, price is around $0.0701, after climbing from the $0.0621 swing low toward the $0.0729 24H high.
📈 Trade Setup
• Entry Zone: $0.0679–$0.0687
• 🛑 Stop Loss: $0.0658
• 🎯 TP1: $0.0711
• 🎯 TP2: $0.0729
• 🎯 TP3: $0.0760
The structure remains constructive with higher lows and strong bullish candles. Volume expanded during the rally, while the latest pullback shows sellers have not yet destroyed the structure. Visible MA(5) is around 1.57M and MA(10) around 1.62M. 24H volume is approximately 10.90M DUSK.
The key area I’m watching is $0.0679–$0.0687. Holding it could keep the bullish structure intact, while a clean break above $0.0729 would strengthen the continuation setup.
🧠 Patience is a position too. Good traders manage risk before chasing momentum.
Follow the trend, not your emotions.
NOTE: This analysis reflects my personal research and market perspective. It is not financial advice. Always do your own research (DYOR) before making any investment decisions.
#dusk $DUSK @Dusk #BTC #bnb
My current view on $DUSK /USDT is LONG, but with patience. On the 4H chart, price is around $0.0701, after climbing from the $0.0621 swing low toward the $0.0729 24H high.
📈 Trade Setup
• Entry Zone: $0.0679–$0.0687
• 🛑 Stop Loss: $0.0658
• 🎯 TP1: $0.0711
• 🎯 TP2: $0.0729
• 🎯 TP3: $0.0760
The structure remains constructive with higher lows and strong bullish candles. Volume expanded during the rally, while the latest pullback shows sellers have not yet destroyed the structure. Visible MA(5) is around 1.57M and MA(10) around 1.62M. 24H volume is approximately 10.90M DUSK.
The key area I’m watching is $0.0679–$0.0687. Holding it could keep the bullish structure intact, while a clean break above $0.0729 would strengthen the continuation setup.
🧠 Patience is a position too. Good traders manage risk before chasing momentum.
Follow the trend, not your emotions.
NOTE: This analysis reflects my personal research and market perspective. It is not financial advice. Always do your own research (DYOR) before making any investment decisions.
#dusk $DUSK @Dusk #BTC #bnb
2
4
46
·
--
Bullish
Based on your 4H DUSK/USDT chart, I would not chase at $0.0696 after the strong move. Binance’s live data is also around $0.069–$0.070, with the recent 24H high near $0.0726–$0.0729.
📈 Preferred LONG setup
🟢 Entry Zone $0.0665 – $0.0672
🛑 Stop Loss $0.0636
🎯 TP1 $0.0711
🎯 TP2 $0.0729
🚀 TP3 $0.0750
Why: $0.0663 is the nearest visible 4H support, while $0.0711 and $0.0729 are the immediate resistance/high zones on your chart. A previous technical analysis also identified roughly $0.065–$0.068 as a resistance area, so confirmation around this zone matters.
🔥 Breakout alternative
If DUSK gives a 4H candle close above $0.0730 with strong volume:
Entry: $0.0731–$0.0735
SL: $0.0695
TP1: $0.0760
TP2: $0.0790
TP3: $0.0820
My preferred trade: wait for the $0.0665–$0.0672 pullback rather than buying $0.0696. The recent volume expansion supports the bullish momentum, but the $0.0729 high is the key breakout test.
⚠️ DYOR. These are chart-based levels, not guaranteed outcomes.
$DUSK
$BTC
#dusk #BİNANCE #crypto #BinanceSquareFamily
Based on your 4H DUSK/USDT chart, I would not chase at $0.0696 after the strong move. Binance’s live data is also around $0.069–$0.070, with the recent 24H high near $0.0726–$0.0729.
📈 Preferred LONG setup
🟢 Entry Zone $0.0665 – $0.0672
🛑 Stop Loss $0.0636
🎯 TP1 $0.0711
🎯 TP2 $0.0729
🚀 TP3 $0.0750
Why: $0.0663 is the nearest visible 4H support, while $0.0711 and $0.0729 are the immediate resistance/high zones on your chart. A previous technical analysis also identified roughly $0.065–$0.068 as a resistance area, so confirmation around this zone matters.
🔥 Breakout alternative
If DUSK gives a 4H candle close above $0.0730 with strong volume:
Entry: $0.0731–$0.0735
SL: $0.0695
TP1: $0.0760
TP2: $0.0790
TP3: $0.0820
My preferred trade: wait for the $0.0665–$0.0672 pullback rather than buying $0.0696. The recent volume expansion supports the bullish momentum, but the $0.0729 high is the key breakout test.
⚠️ DYOR. These are chart-based levels, not guaranteed outcomes.
$DUSK
$BTC
#dusk #BİNANCE #crypto #BinanceSquareFamily
📈 Preferred LONG setup
🟢 Entry Zone $0.0665 – $0.0672
🛑 Stop Loss $0.0636
🎯 TP1 $0.0711
🎯 TP2 $0.0729
🚀 TP3 $0.0750
Why: $0.0663 is the nearest visible 4H support, while $0.0711 and $0.0729 are the immediate resistance/high zones on your chart. A previous technical analysis also identified roughly $0.065–$0.068 as a resistance area, so confirmation around this zone matters.
🔥 Breakout alternative
If DUSK gives a 4H candle close above $0.0730 with strong volume:
Entry: $0.0731–$0.0735
SL: $0.0695
TP1: $0.0760
TP2: $0.0790
TP3: $0.0820
My preferred trade: wait for the $0.0665–$0.0672 pullback rather than buying $0.0696. The recent volume expansion supports the bullish momentum, but the $0.0729 high is the key breakout test.
⚠️ DYOR. These are chart-based levels, not guaranteed outcomes.
$DUSK
$BTC
#dusk #BİNANCE #crypto #BinanceSquareFamily
3
4
87
Log in to explore more content
Join global crypto users on Binance Square
⚡️ Get latest and useful information about crypto.
💬 Trusted by the world’s largest crypto exchange.
👍 Discover real insights from verified creators.
Email / Phone number
Trending Topics
BinancePick
2.5M views
137,927 Discussing
Join #EarningsSeason: Predict Earnings on Binance Pick, Share Your Take on Binance Square!
Binance Square Official
·400 Likes
·337.1k views
EarningsSeason
4.9M views
23,915 Discussing
ElectrumWalletBugLetRogueServersStealFunds
2,613 views
137 Discussing