
交易大师-小刀
1.4k Posts

交易大师-小刀
Report
Block User
跟单请加聊天室,历经两轮币圈牛熊,以合约现货波段交易著称,出手快、狠、准。作为资深交易者,我凭借深厚洞察力和稳健策略,在市场中屡创佳绩。同时,作为KOL,乐于分享,口碑极佳,是众多投资者心中的传奇人物。
5 Following
4.6K+ Followers
2.6K+ Liked
Posts
All
Quotes
Videos
PINNED
·
--
1. Use Binance to scan the QR code and add the contact
2. For those you’ve already added, remember to check your messages in the top-right corner in your day-to-day!
Add @CryptoDPL —then you can know about market trends and opportunities right away!
#美联储纪要显示不支持降息
1. Use Binance to scan the QR code and add the contact
2. For those you’ve already added, remember to check your messages in the top-right corner in your day-to-day!
Add @交易大师-小刀 —then you can know about market trends and opportunities right away!
#美联储纪要显示不支持降息
2. For those you’ve already added, remember to check your messages in the top-right corner in your day-to-day!
Add @交易大师-小刀 —then you can know about market trends and opportunities right away!
#美联储纪要显示不支持降息

2
319
·
--
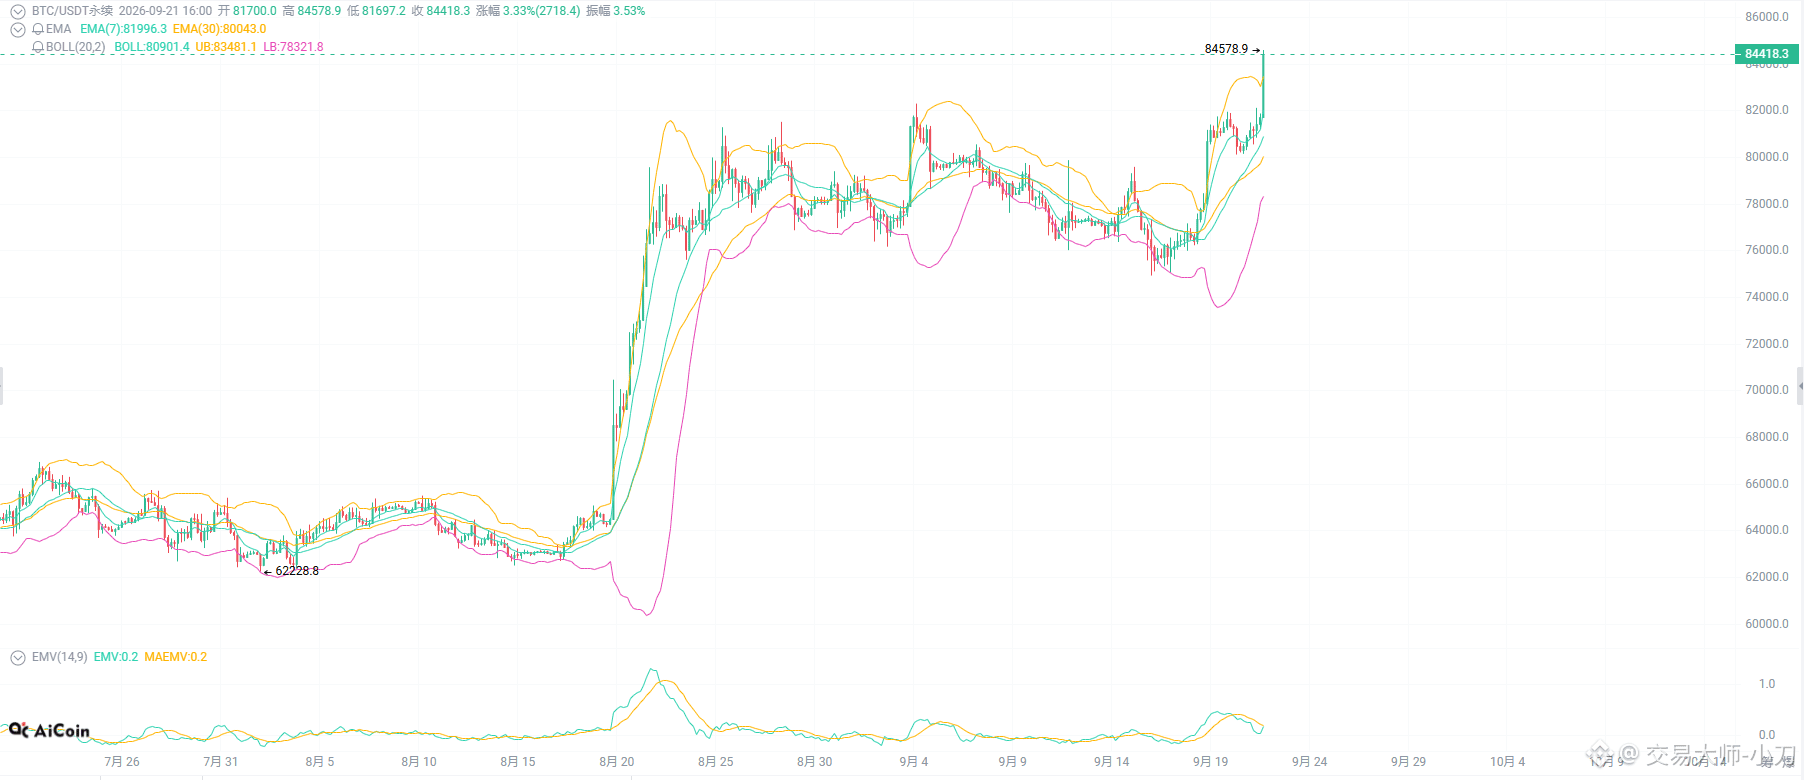
Now BTC has already broken through 8.4w. Keep looking at this chart. I think the main difference between these two scenarios boils down to one key level: whether 8.4w can truly hold.
Because 8.4w itself is already the recent high point and also a clearly visible resistance level in this market cycle.
If BTC can effectively hold above 84,000, and then after a pullback it can still hold, that would indicate that the sell pressure overhead has been largely absorbed, and the market structure would be stronger as a result. Then moving toward 85,000 and even making new highs would be much smoother.
But if it only briefly breaks above 8.4w and then quickly drops back down, then the significance of the breakout isn’t very meaningful—it’s more like a false breakout. In that case, the market is likely to keep ranging.
#Canary二次修订质押SEI现货ETF申请
Now BTC has already broken through 8.4w. Keep looking at this chart. I think the main difference between these two scenarios boils down to one key level: whether 8.4w can truly hold.
Because 8.4w itself is already the recent high point and also a clearly visible resistance level in this market cycle.
If BTC can effectively hold above 84,000, and then after a pullback it can still hold, that would indicate that the sell pressure overhead has been largely absorbed, and the market structure would be stronger as a result. Then moving toward 85,000 and even making new highs would be much smoother.
But if it only briefly breaks above 8.4w and then quickly drops back down, then the significance of the breakout isn’t very meaningful—it’s more like a false breakout. In that case, the market is likely to keep ranging.
#Canary二次修订质押SEI现货ETF申请
Because 8.4w itself is already the recent high point and also a clearly visible resistance level in this market cycle.
If BTC can effectively hold above 84,000, and then after a pullback it can still hold, that would indicate that the sell pressure overhead has been largely absorbed, and the market structure would be stronger as a result. Then moving toward 85,000 and even making new highs would be much smoother.
But if it only briefly breaks above 8.4w and then quickly drops back down, then the significance of the breakout isn’t very meaningful—it’s more like a false breakout. In that case, the market is likely to keep ranging.
#Canary二次修订质押SEI现货ETF申请
233
·
--
After the early-morning rate hike, BTC and the US stock market have been jumping up and down—what are contract traders supposed to do? This hike itself isn’t surprising; what really needs attention is the rate path that comes next.
The Fed raised rates by 25 basis points, bringing the rate to 3.75%—4%. This is the first rate hike since 2023, and it was approved unanimously by all 12 votes.
The latest dot plot shows the year-end median rate rising to 4.1%, which implies there is a high likelihood of another hike before year-end. More importantly, the expected rate for 2027 was also revised up from 3.6% to 4.1%.
Why do they dare to keep hiking?
Because the US economy hasn’t shown clear signs of weakening. The Fed raised its GDP growth forecast for this year to 2.3% and cut its unemployment rate forecast to 4.1%; however, August CPI year-over-year is still 3.4%, and PPI has even reached 5.4%. If the economy can hold up and inflation can’t be brought down, the Fed has no reason to stop abruptly.
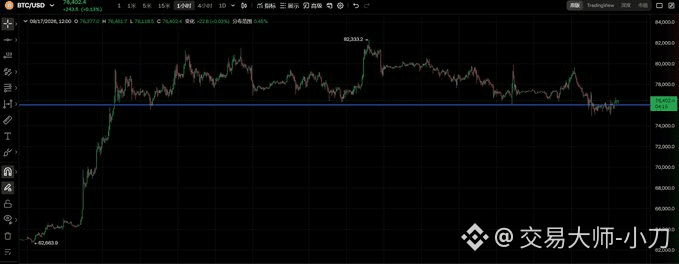
Now I think $76,000 is an important level—because the recent support has been around $76,000, and the current price has also been consolidating around that area. The blue line in the chart is $76,000; you can keep an eye on it.
#美联储加息25基点美股收跌
After the early-morning rate hike, BTC and the US stock market have been jumping up and down—what are contract traders supposed to do? This hike itself isn’t surprising; what really needs attention is the rate path that comes next.
The Fed raised rates by 25 basis points, bringing the rate to 3.75%—4%. This is the first rate hike since 2023, and it was approved unanimously by all 12 votes.
The latest dot plot shows the year-end median rate rising to 4.1%, which implies there is a high likelihood of another hike before year-end. More importantly, the expected rate for 2027 was also revised up from 3.6% to 4.1%.
Why do they dare to keep hiking?
Because the US economy hasn’t shown clear signs of weakening. The Fed raised its GDP growth forecast for this year to 2.3% and cut its unemployment rate forecast to 4.1%; however, August CPI year-over-year is still 3.4%, and PPI has even reached 5.4%. If the economy can hold up and inflation can’t be brought down, the Fed has no reason to stop abruptly.
Now I think $76,000 is an important level—because the recent support has been around $76,000, and the current price has also been consolidating around that area. The blue line in the chart is $76,000; you can keep an eye on it.
#美联储加息25基点美股收跌
The Fed raised rates by 25 basis points, bringing the rate to 3.75%—4%. This is the first rate hike since 2023, and it was approved unanimously by all 12 votes.
The latest dot plot shows the year-end median rate rising to 4.1%, which implies there is a high likelihood of another hike before year-end. More importantly, the expected rate for 2027 was also revised up from 3.6% to 4.1%.
Why do they dare to keep hiking?
Because the US economy hasn’t shown clear signs of weakening. The Fed raised its GDP growth forecast for this year to 2.3% and cut its unemployment rate forecast to 4.1%; however, August CPI year-over-year is still 3.4%, and PPI has even reached 5.4%. If the economy can hold up and inflation can’t be brought down, the Fed has no reason to stop abruptly.
Now I think $76,000 is an important level—because the recent support has been around $76,000, and the current price has also been consolidating around that area. The blue line in the chart is $76,000; you can keep an eye on it.
#美联储加息25基点美股收跌
1
305
·
--
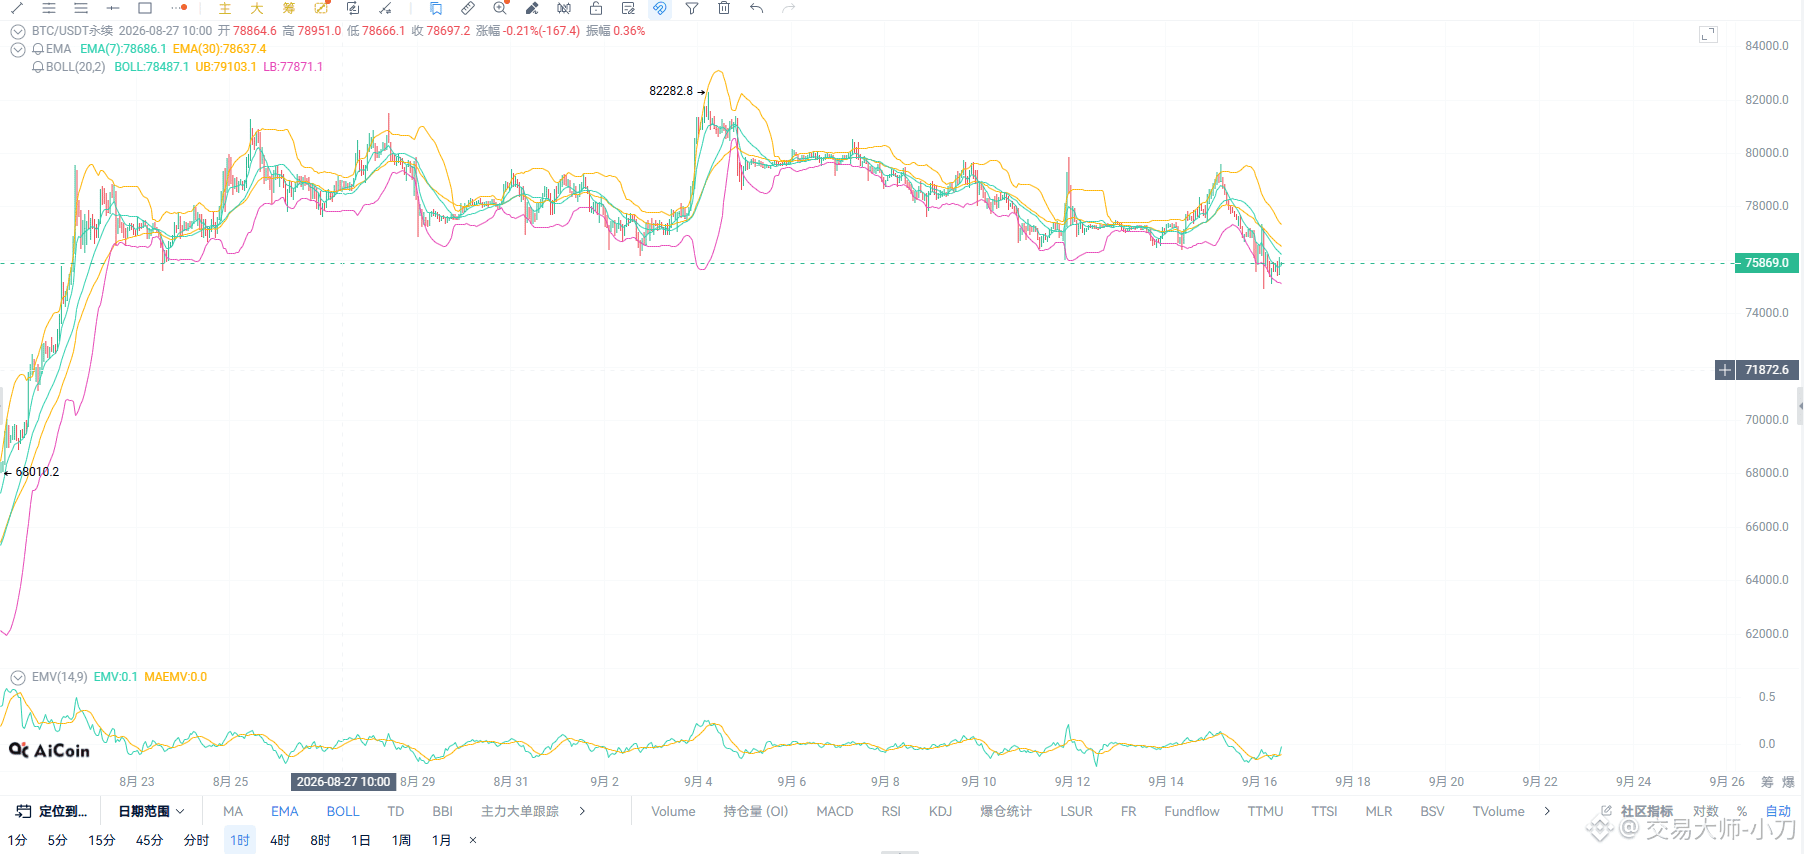
The Clear Act didn’t pass. This is within normal expectations: this morning BTC’s low hit $74,800, and it has now pulled back up to around $76,000.
This time it’s not the final vote, but a procedural vote. To keep moving forward, 60 votes are needed, and in the end there were only 49 in favor and 50 against, so the bill is temporarily stalled.
The most important thing about this bill is to clearly define the U.S. Crypto regulatory boundaries: how the SEC and CFTC should split responsibilities, how trading platforms should be registered, and how DeFi should be regulated.
The problem is also very clear now:
Crypto isn’t afraid of strict regulation—it’s afraid that regulation will be stuck in meetings forever.
At least bad news can be priced in; the hardest part is when the rules are kept hanging.
But this isn’t completely over either—there’s still room for it to be reconsidered later.
#比特币跌至7.6万美元
The Clear Act didn’t pass. This is within normal expectations: this morning BTC’s low hit $74,800, and it has now pulled back up to around $76,000.
This time it’s not the final vote, but a procedural vote. To keep moving forward, 60 votes are needed, and in the end there were only 49 in favor and 50 against, so the bill is temporarily stalled.
The most important thing about this bill is to clearly define the U.S. Crypto regulatory boundaries: how the SEC and CFTC should split responsibilities, how trading platforms should be registered, and how DeFi should be regulated.
The problem is also very clear now:
Crypto isn’t afraid of strict regulation—it’s afraid that regulation will be stuck in meetings forever.
At least bad news can be priced in; the hardest part is when the rules are kept hanging.
But this isn’t completely over either—there’s still room for it to be reconsidered later.
#比特币跌至7.6万美元
This time it’s not the final vote, but a procedural vote. To keep moving forward, 60 votes are needed, and in the end there were only 49 in favor and 50 against, so the bill is temporarily stalled.
The most important thing about this bill is to clearly define the U.S. Crypto regulatory boundaries: how the SEC and CFTC should split responsibilities, how trading platforms should be registered, and how DeFi should be regulated.
The problem is also very clear now:
Crypto isn’t afraid of strict regulation—it’s afraid that regulation will be stuck in meetings forever.
At least bad news can be priced in; the hardest part is when the rules are kept hanging.
But this isn’t completely over either—there’s still room for it to be reconsidered later.
#比特币跌至7.6万美元
1
620
·
--
SK hynix pre-market analysis
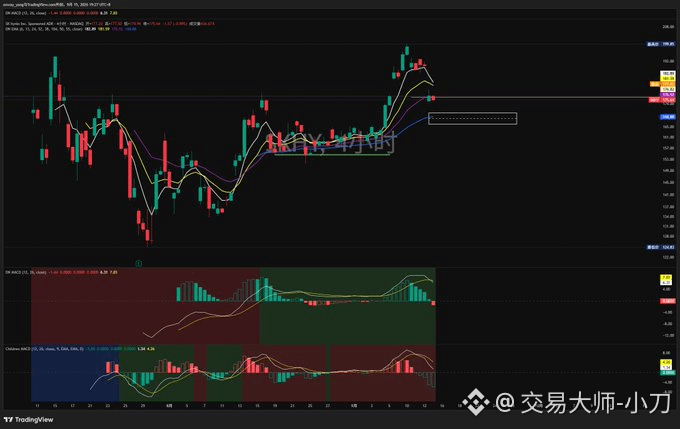
Review of yesterday’s view: Even though SK hynix has entered a pullback, the 4-hour structure is still relatively strong. The market may complete a base-building process in the 168–176 range while we wait for signs of stabilization on the chart.
Last night saw a choppy adjustment. SK hynix dipped to as low as 174, then stopped falling. The current pre-market price is 177, which means it has already moved into the pullback support zone we marked.
The 4-hour MACD is still at a high level. The downside momentum has not been fully released yet. It’s possible the market will build a base using sideways consolidation instead of a continued sell-off.
Next, focus on the 170–166 zone and watch how much buying support appears when price tests this area.
If this zone can be held effectively, there will be a chance for a rebound; otherwise, price may continue to probe lower.
With the Fed meeting approaching, volatility in the memory sector is increasing—stay observant and mainly watch for setups.
Follow Brother Dao—only practical experience that can help you survive in the circle. If you’re still repeatedly losing and starting over, message me and we’ll talk. I’ll show you how to make trading simpler.
#比特币现货ETF净流入1.6亿美元
SK hynix pre-market analysis
Review of yesterday’s view: Even though SK hynix has entered a pullback, the 4-hour structure is still relatively strong. The market may complete a base-building process in the 168–176 range while we wait for signs of stabilization on the chart.
Last night saw a choppy adjustment. SK hynix dipped to as low as 174, then stopped falling. The current pre-market price is 177, which means it has already moved into the pullback support zone we marked.
The 4-hour MACD is still at a high level. The downside momentum has not been fully released yet. It’s possible the market will build a base using sideways consolidation instead of a continued sell-off.
Next, focus on the 170–166 zone and watch how much buying support appears when price tests this area.
If this zone can be held effectively, there will be a chance for a rebound; otherwise, price may continue to probe lower.
With the Fed meeting approaching, volatility in the memory sector is increasing—stay observant and mainly watch for setups.
Follow Brother Dao—only practical experience that can help you survive in the circle. If you’re still repeatedly losing and starting over, message me and we’ll talk. I’ll show you how to make trading simpler.
#比特币现货ETF净流入1.6亿美元
Review of yesterday’s view: Even though SK hynix has entered a pullback, the 4-hour structure is still relatively strong. The market may complete a base-building process in the 168–176 range while we wait for signs of stabilization on the chart.
Last night saw a choppy adjustment. SK hynix dipped to as low as 174, then stopped falling. The current pre-market price is 177, which means it has already moved into the pullback support zone we marked.
The 4-hour MACD is still at a high level. The downside momentum has not been fully released yet. It’s possible the market will build a base using sideways consolidation instead of a continued sell-off.
Next, focus on the 170–166 zone and watch how much buying support appears when price tests this area.
If this zone can be held effectively, there will be a chance for a rebound; otherwise, price may continue to probe lower.
With the Fed meeting approaching, volatility in the memory sector is increasing—stay observant and mainly watch for setups.
Follow Brother Dao—only practical experience that can help you survive in the circle. If you’re still repeatedly losing and starting over, message me and we’ll talk. I’ll show you how to make trading simpler.
#比特币现货ETF净流入1.6亿美元
354
·
--
This week, BTC will face a triple test from regulation, interest rates, and liquidity.
All times listed below are Beijing time.
Around 02:15 on September 16, the U.S. Senate will hold a key procedural vote on the <CLARITY Act>. This is not a final passage vote; it will determine whether the bill can move into formal debate. If it advances smoothly, it could help reduce long-term policy risk for the crypto market. If it does not reach the 60-vote threshold, the legislative process may continue to be delayed.
At 20:30 on September 16, the U.S. will release August retail sales. At 02:00 on September 17, the Federal Reserve will announce its interest rate decision and economic projections, followed by a press conference at 02:30. The market currently assigns a probability of about 85% to a 25-basis-point rate hike. So the key may no longer be “whether or not” there is a hike, but rather the dot plot and the post-meeting wording: is this a one-off hike, or the start of a new tightening cycle?
At 19:00 on September 17, the Bank of England will release its interest rate decision. At 14:30 (expected), the Bank of Japan will publish its policy meeting results on September 18. The release time is usually not fixed, but a press conference is expected at 14:30. If global bond yields continue rising, or if the yen carry trade reverses further, volatility in risk assets could be amplified.
At 16:00 on September 18, Deribit’s BTC options expire this week. Based on currently available public data, the biggest pain point is near $78,000, but that level will shift with positioning. Before settlement, you can watch the tug-of-war around that area; after settlement, you should pay attention to whether volatility re-emerges.
I previously thought there would be a pullback, but BTC’s performance has actually been stronger and it has pushed higher. It seems that the market is still mainly range-bound for now, and I still believe it will first move downward later. I have a feeling that the direction is about to break out—quick, make a move! #比特币涨1.64%突破78000美元
This week, BTC will face a triple test from regulation, interest rates, and liquidity.
All times listed below are Beijing time.
Around 02:15 on September 16, the U.S. Senate will hold a key procedural vote on the <CLARITY Act>. This is not a final passage vote; it will determine whether the bill can move into formal debate. If it advances smoothly, it could help reduce long-term policy risk for the crypto market. If it does not reach the 60-vote threshold, the legislative process may continue to be delayed.
At 20:30 on September 16, the U.S. will release August retail sales. At 02:00 on September 17, the Federal Reserve will announce its interest rate decision and economic projections, followed by a press conference at 02:30. The market currently assigns a probability of about 85% to a 25-basis-point rate hike. So the key may no longer be “whether or not” there is a hike, but rather the dot plot and the post-meeting wording: is this a one-off hike, or the start of a new tightening cycle?
At 19:00 on September 17, the Bank of England will release its interest rate decision. At 14:30 (expected), the Bank of Japan will publish its policy meeting results on September 18. The release time is usually not fixed, but a press conference is expected at 14:30. If global bond yields continue rising, or if the yen carry trade reverses further, volatility in risk assets could be amplified.
At 16:00 on September 18, Deribit’s BTC options expire this week. Based on currently available public data, the biggest pain point is near $78,000, but that level will shift with positioning. Before settlement, you can watch the tug-of-war around that area; after settlement, you should pay attention to whether volatility re-emerges.
I previously thought there would be a pullback, but BTC’s performance has actually been stronger and it has pushed higher. It seems that the market is still mainly range-bound for now, and I still believe it will first move downward later. I have a feeling that the direction is about to break out—quick, make a move! #比特币涨1.64%突破78000美元
All times listed below are Beijing time.
Around 02:15 on September 16, the U.S. Senate will hold a key procedural vote on the <CLARITY Act>. This is not a final passage vote; it will determine whether the bill can move into formal debate. If it advances smoothly, it could help reduce long-term policy risk for the crypto market. If it does not reach the 60-vote threshold, the legislative process may continue to be delayed.
At 20:30 on September 16, the U.S. will release August retail sales. At 02:00 on September 17, the Federal Reserve will announce its interest rate decision and economic projections, followed by a press conference at 02:30. The market currently assigns a probability of about 85% to a 25-basis-point rate hike. So the key may no longer be “whether or not” there is a hike, but rather the dot plot and the post-meeting wording: is this a one-off hike, or the start of a new tightening cycle?
At 19:00 on September 17, the Bank of England will release its interest rate decision. At 14:30 (expected), the Bank of Japan will publish its policy meeting results on September 18. The release time is usually not fixed, but a press conference is expected at 14:30. If global bond yields continue rising, or if the yen carry trade reverses further, volatility in risk assets could be amplified.
At 16:00 on September 18, Deribit’s BTC options expire this week. Based on currently available public data, the biggest pain point is near $78,000, but that level will shift with positioning. Before settlement, you can watch the tug-of-war around that area; after settlement, you should pay attention to whether volatility re-emerges.
I previously thought there would be a pullback, but BTC’s performance has actually been stronger and it has pushed higher. It seems that the market is still mainly range-bound for now, and I still believe it will first move downward later. I have a feeling that the direction is about to break out—quick, make a move! #比特币涨1.64%突破78000美元

1.1k
·
--
SK hynix pre-market analysis
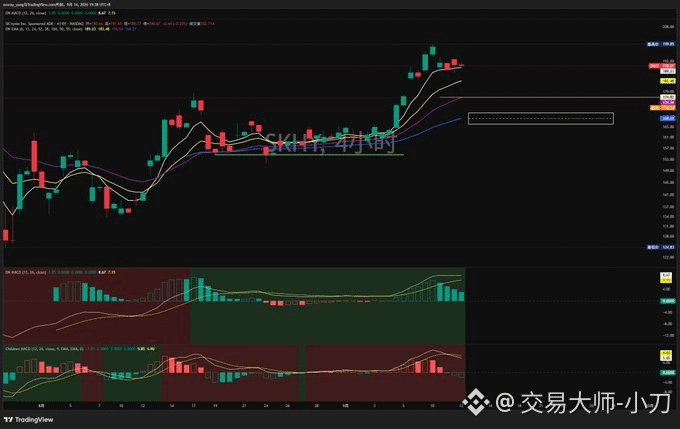
Last Friday, I already reminded that after reaching a new high, investors should be cautious of the pullback risk. At that time, the pullback observation range I marked was 185‑176
Currently, SK hynix’s pre-market price is around 167.6, and it has already fallen back into the anticipated pullback range. The current price is sitting at a support level on the two-hour timeframe. The key focus is the strength of support here
Although we are in a pullback phase, the four-hour chart is still showing strength. There is a chance that the market can form a base in the 176‑168 range and then produce a short-term rebound
SK hynix is a stock that signals a pullback in advance. Next, I will closely watch the price action around key support levels. If any abnormal situation occurs during the trading session, I will update again #AnthropicCEO呼吁放缓AI发展
SK hynix pre-market analysis
Last Friday, I already reminded that after reaching a new high, investors should be cautious of the pullback risk. At that time, the pullback observation range I marked was 185‑176
Currently, SK hynix’s pre-market price is around 167.6, and it has already fallen back into the anticipated pullback range. The current price is sitting at a support level on the two-hour timeframe. The key focus is the strength of support here
Although we are in a pullback phase, the four-hour chart is still showing strength. There is a chance that the market can form a base in the 176‑168 range and then produce a short-term rebound
SK hynix is a stock that signals a pullback in advance. Next, I will closely watch the price action around key support levels. If any abnormal situation occurs during the trading session, I will update again #AnthropicCEO呼吁放缓AI发展
Last Friday, I already reminded that after reaching a new high, investors should be cautious of the pullback risk. At that time, the pullback observation range I marked was 185‑176
Currently, SK hynix’s pre-market price is around 167.6, and it has already fallen back into the anticipated pullback range. The current price is sitting at a support level on the two-hour timeframe. The key focus is the strength of support here
Although we are in a pullback phase, the four-hour chart is still showing strength. There is a chance that the market can form a base in the 176‑168 range and then produce a short-term rebound
SK hynix is a stock that signals a pullback in advance. Next, I will closely watch the price action around key support levels. If any abnormal situation occurs during the trading session, I will update again #AnthropicCEO呼吁放缓AI发展
365
·
--
XAU GOLD Gold recap of last Saturday’s outlook:
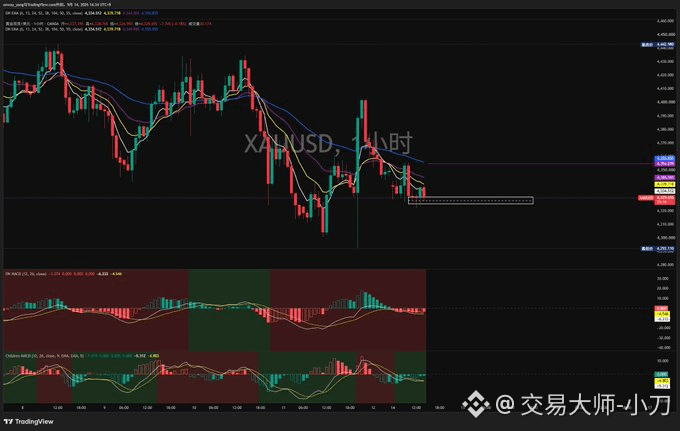
At that time, the gold price was moving at the 30-minute MACD zero axis, indicating that it was not advisable to continue probing lower. The key short-term defense level was 4330
If it effectively breaks down, the daily structure would also be breached, and the market would see deeper downside moves
On Monday’s open, gold rose to a high of 4356, then pulled back. The current price is now exactly at the 4330 key support level
Next, focus on whether 4330 can effectively stop the decline and trigger an upside rebound
The intraday resistance zone above remains 4355
Only by breaking through and holding above that level can we declare that the 1-hour timeframe has successfully formed a bottom. If it fails to break, the market remains weak
The daily-level rebound structure is still intact. Don’t jump to conclusions—give gold a bit more patience and wait for the bottoming to complete, with indicators crossing #比特币四周内第三次单块重组
XAU GOLD Gold recap of last Saturday’s outlook:
At that time, the gold price was moving at the 30-minute MACD zero axis, indicating that it was not advisable to continue probing lower. The key short-term defense level was 4330
If it effectively breaks down, the daily structure would also be breached, and the market would see deeper downside moves
On Monday’s open, gold rose to a high of 4356, then pulled back. The current price is now exactly at the 4330 key support level
Next, focus on whether 4330 can effectively stop the decline and trigger an upside rebound
The intraday resistance zone above remains 4355
Only by breaking through and holding above that level can we declare that the 1-hour timeframe has successfully formed a bottom. If it fails to break, the market remains weak
The daily-level rebound structure is still intact. Don’t jump to conclusions—give gold a bit more patience and wait for the bottoming to complete, with indicators crossing #比特币四周内第三次单块重组
At that time, the gold price was moving at the 30-minute MACD zero axis, indicating that it was not advisable to continue probing lower. The key short-term defense level was 4330
If it effectively breaks down, the daily structure would also be breached, and the market would see deeper downside moves
On Monday’s open, gold rose to a high of 4356, then pulled back. The current price is now exactly at the 4330 key support level
Next, focus on whether 4330 can effectively stop the decline and trigger an upside rebound
The intraday resistance zone above remains 4355
Only by breaking through and holding above that level can we declare that the 1-hour timeframe has successfully formed a bottom. If it fails to break, the market remains weak
The daily-level rebound structure is still intact. Don’t jump to conclusions—give gold a bit more patience and wait for the bottoming to complete, with indicators crossing #比特币四周内第三次单块重组
241
·
--
XAU GOLD GOLD Review of Yesterday’s View: Gold has been moving downward from the high of 4435, with the low touching 4325 and already breaking below the daily EMA52 support
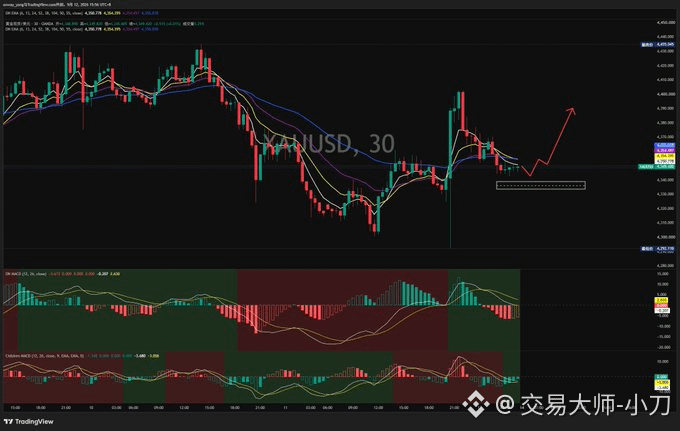
Update the key defense level at 4260—this is the 5-day core lifeline. Once it is broken, the 10-day rebound scenario is effectively invalidated. Don’t be overly optimistic; focus on how the market forms a bottom
When the CPI data was released, gold played out a V-shaped turnaround—down first, then up. The lowest point dipped to 4292, but it did not break through the key defense level at 4260. Afterwards, it rebounded, rallying back up to 4403. After reaching the high, it fell again. The market is currently closed, and the halted price is 4349, without making a fresh lower low
Price has just pulled back to the 30-minute MACD zero-line support area. Theoretically, it should not continue to probe lower from here. If this level is broken again, the daily support will also be breached, which could trigger a deeper selloff
I’m more inclined to expect gold to hold this support, then rebound upward again on the 30-minute timeframe. Slowly build a strong 4-hour bottom structure, and only after the 4-hour MACD crosses above the zero line can the daily-level rebound be considered officially underway
In the short term, the bottom line: try not to see an effective break below 4330
Weekend market pause—sit tight and wait for Monday’s open, then observe whether gold follows the expected path
#英伟达洽谈至多100亿美元投资Anthropic
XAU GOLD GOLD Review of Yesterday’s View: Gold has been moving downward from the high of 4435, with the low touching 4325 and already breaking below the daily EMA52 support
Update the key defense level at 4260—this is the 5-day core lifeline. Once it is broken, the 10-day rebound scenario is effectively invalidated. Don’t be overly optimistic; focus on how the market forms a bottom
When the CPI data was released, gold played out a V-shaped turnaround—down first, then up. The lowest point dipped to 4292, but it did not break through the key defense level at 4260. Afterwards, it rebounded, rallying back up to 4403. After reaching the high, it fell again. The market is currently closed, and the halted price is 4349, without making a fresh lower low
Price has just pulled back to the 30-minute MACD zero-line support area. Theoretically, it should not continue to probe lower from here. If this level is broken again, the daily support will also be breached, which could trigger a deeper selloff
I’m more inclined to expect gold to hold this support, then rebound upward again on the 30-minute timeframe. Slowly build a strong 4-hour bottom structure, and only after the 4-hour MACD crosses above the zero line can the daily-level rebound be considered officially underway
In the short term, the bottom line: try not to see an effective break below 4330
Weekend market pause—sit tight and wait for Monday’s open, then observe whether gold follows the expected path
#英伟达洽谈至多100亿美元投资Anthropic
Update the key defense level at 4260—this is the 5-day core lifeline. Once it is broken, the 10-day rebound scenario is effectively invalidated. Don’t be overly optimistic; focus on how the market forms a bottom
When the CPI data was released, gold played out a V-shaped turnaround—down first, then up. The lowest point dipped to 4292, but it did not break through the key defense level at 4260. Afterwards, it rebounded, rallying back up to 4403. After reaching the high, it fell again. The market is currently closed, and the halted price is 4349, without making a fresh lower low
Price has just pulled back to the 30-minute MACD zero-line support area. Theoretically, it should not continue to probe lower from here. If this level is broken again, the daily support will also be breached, which could trigger a deeper selloff
I’m more inclined to expect gold to hold this support, then rebound upward again on the 30-minute timeframe. Slowly build a strong 4-hour bottom structure, and only after the 4-hour MACD crosses above the zero line can the daily-level rebound be considered officially underway
In the short term, the bottom line: try not to see an effective break below 4330
Weekend market pause—sit tight and wait for Monday’s open, then observe whether gold follows the expected path
#英伟达洽谈至多100亿美元投资Anthropic
318
·
--
⚠️Key Alert|Tonight 20:30 U.S. Aug CPI makes a major debut
The probability of a Fed rate hike in September is already at 75%
Once the data comes in above expectations, rate-hike expectations will climb further;
BTC and gold will both come under pressure, increasing risk
Tonight’s data is the key turning point for short-term market moves
#苹果发布iPhone Duo股价涨3.56%
⚠️Key Alert|Tonight 20:30 U.S. Aug CPI makes a major debut
The probability of a Fed rate hike in September is already at 75%
Once the data comes in above expectations, rate-hike expectations will climb further;
BTC and gold will both come under pressure, increasing risk
Tonight’s data is the key turning point for short-term market moves
#苹果发布iPhone Duo股价涨3.56%
The probability of a Fed rate hike in September is already at 75%
Once the data comes in above expectations, rate-hike expectations will climb further;
BTC and gold will both come under pressure, increasing risk
Tonight’s data is the key turning point for short-term market moves
#苹果发布iPhone Duo股价涨3.56%

428
·
--
BTC is back around $77000.
As of this afternoon, BTC has been trading in a tight range around $77,000. The pullback isn’t particularly large, but what’s truly troubling now is the macro picture.
The U.S. August PPI rose 5.4% year over year, higher than July’s 4.8%. Even after excluding food, energy, and trade services, it still rose 4.7% year over year.
Meanwhile, Brent crude oil briefly surged to around $108. With oil prices staying elevated, transportation and production cost pressures are starting to move higher again. Whether the Federal Reserve will raise rates next week has returned as a question the market needs to seriously consider.
So tonight’s U.S. CPI at 20:30 is crucial.
What the market is most worried about is that this chain of events could re-form:
Oil prices rise → inflation rebounds → the Fed keeps tightening → U.S. Treasury yields and the dollar strengthen → BTC and tech stocks face pressure.
Tonight:
If the CPI comes in below expectations, BTC can reclaim above $78,000 and short-term pressure will ease.
If the CPI remains too hot and BTC effectively breaks below $76,000, then be careful—macro pressure could continue transmitting lower.
Let’s see how the market plays out.
#沙特原油产量创1990年来新低
BTC is back around $77000.
As of this afternoon, BTC has been trading in a tight range around $77,000. The pullback isn’t particularly large, but what’s truly troubling now is the macro picture.
The U.S. August PPI rose 5.4% year over year, higher than July’s 4.8%. Even after excluding food, energy, and trade services, it still rose 4.7% year over year.
Meanwhile, Brent crude oil briefly surged to around $108. With oil prices staying elevated, transportation and production cost pressures are starting to move higher again. Whether the Federal Reserve will raise rates next week has returned as a question the market needs to seriously consider.
So tonight’s U.S. CPI at 20:30 is crucial.
What the market is most worried about is that this chain of events could re-form:
Oil prices rise → inflation rebounds → the Fed keeps tightening → U.S. Treasury yields and the dollar strengthen → BTC and tech stocks face pressure.
Tonight:
If the CPI comes in below expectations, BTC can reclaim above $78,000 and short-term pressure will ease.
If the CPI remains too hot and BTC effectively breaks below $76,000, then be careful—macro pressure could continue transmitting lower.
Let’s see how the market plays out.
#沙特原油产量创1990年来新低
As of this afternoon, BTC has been trading in a tight range around $77,000. The pullback isn’t particularly large, but what’s truly troubling now is the macro picture.
The U.S. August PPI rose 5.4% year over year, higher than July’s 4.8%. Even after excluding food, energy, and trade services, it still rose 4.7% year over year.
Meanwhile, Brent crude oil briefly surged to around $108. With oil prices staying elevated, transportation and production cost pressures are starting to move higher again. Whether the Federal Reserve will raise rates next week has returned as a question the market needs to seriously consider.
So tonight’s U.S. CPI at 20:30 is crucial.
What the market is most worried about is that this chain of events could re-form:
Oil prices rise → inflation rebounds → the Fed keeps tightening → U.S. Treasury yields and the dollar strengthen → BTC and tech stocks face pressure.
Tonight:
If the CPI comes in below expectations, BTC can reclaim above $78,000 and short-term pressure will ease.
If the CPI remains too hot and BTC effectively breaks below $76,000, then be careful—macro pressure could continue transmitting lower.
Let’s see how the market plays out.
#沙特原油产量创1990年来新低

244
·
--
SK hynix pre-market analysis
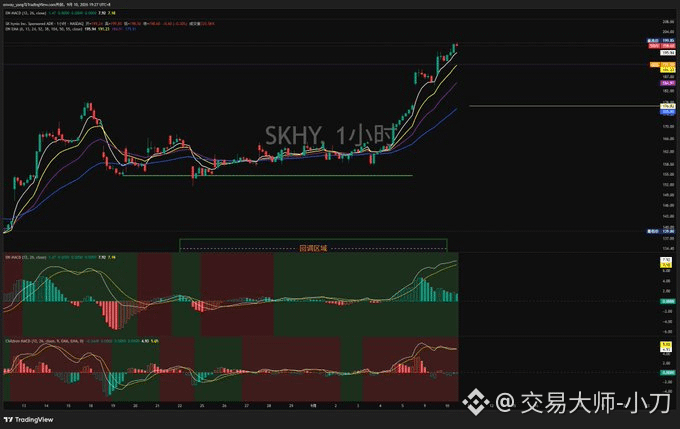
Review yesterday’s view: To keep moving higher, focus on support at 181. As long as it doesn’t break down below, it will continue to test the previous high at 194.
Yesterday’s price action was very strong. It broke through resistance directly, peaking at 199.85 and nearly hitting the $200 level. The current pre-market price is 190.91, and the overall trend remains strong.
The stock has already made a new high. Pay close attention to how support holds at the current level. The pre-market level around 191 is a key point on the trend line. It must not break down effectively; only then will there be enough momentum to move higher. Once it breaks, there is a risk of a surge-and-retrace.
If a pullback occurs, the new support zone to watch is 185–176. If it revisits this range without a deep selloff, you can consider a rebound trade.
For those holding spot positions: since it has already broken above the prior high, you can first realize some profits. Going forward, watch the overhead resistance—if it fails to break through, you may do short-term selling on strength and buying back on dips.
The main rally phase on the 1-hour timeframe hasn’t ended yet. This pullback is likely part of a continuation structure during an ongoing uptrend.
#苹果发布首款折叠屏手机
SK hynix pre-market analysis
Review yesterday’s view: To keep moving higher, focus on support at 181. As long as it doesn’t break down below, it will continue to test the previous high at 194.
Yesterday’s price action was very strong. It broke through resistance directly, peaking at 199.85 and nearly hitting the $200 level. The current pre-market price is 190.91, and the overall trend remains strong.
The stock has already made a new high. Pay close attention to how support holds at the current level. The pre-market level around 191 is a key point on the trend line. It must not break down effectively; only then will there be enough momentum to move higher. Once it breaks, there is a risk of a surge-and-retrace.
If a pullback occurs, the new support zone to watch is 185–176. If it revisits this range without a deep selloff, you can consider a rebound trade.
For those holding spot positions: since it has already broken above the prior high, you can first realize some profits. Going forward, watch the overhead resistance—if it fails to break through, you may do short-term selling on strength and buying back on dips.
The main rally phase on the 1-hour timeframe hasn’t ended yet. This pullback is likely part of a continuation structure during an ongoing uptrend.
#苹果发布首款折叠屏手机
Review yesterday’s view: To keep moving higher, focus on support at 181. As long as it doesn’t break down below, it will continue to test the previous high at 194.
Yesterday’s price action was very strong. It broke through resistance directly, peaking at 199.85 and nearly hitting the $200 level. The current pre-market price is 190.91, and the overall trend remains strong.
The stock has already made a new high. Pay close attention to how support holds at the current level. The pre-market level around 191 is a key point on the trend line. It must not break down effectively; only then will there be enough momentum to move higher. Once it breaks, there is a risk of a surge-and-retrace.
If a pullback occurs, the new support zone to watch is 185–176. If it revisits this range without a deep selloff, you can consider a rebound trade.
For those holding spot positions: since it has already broken above the prior high, you can first realize some profits. Going forward, watch the overhead resistance—if it fails to break through, you may do short-term selling on strength and buying back on dips.
The main rally phase on the 1-hour timeframe hasn’t ended yet. This pullback is likely part of a continuation structure during an ongoing uptrend.
#苹果发布首款折叠屏手机
398
·
--
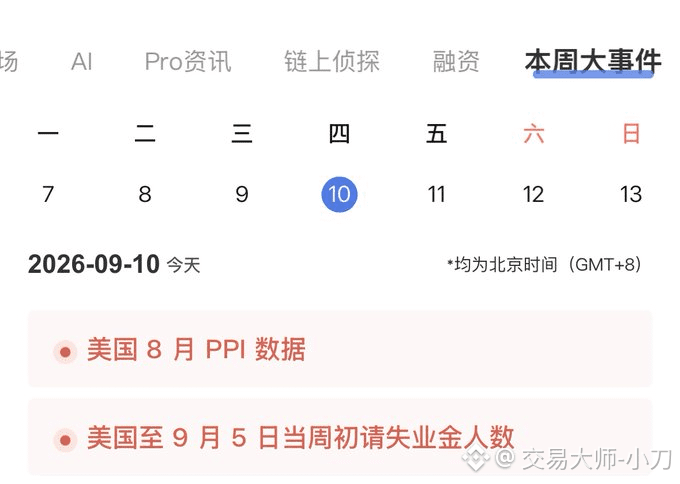
Tonight 20:30: Pay close attention to the US August PPI data + initial jobless claims
PPI is a leading inflation indicator. The data’s strength or weakness will directly affect market expectations for the Fed’s interest-rate outlook. Tonight, focus on whether this set of data will bring further shocks to the market.
If the inflation data comes in higher than expected, the US dollar will likely keep strengthening, which will continue to weigh on gold and crypto assets; if the data is weaker than expected, it may help ease the current downside pressure
#伊朗称已准备升级对美战争
Tonight 20:30: Pay close attention to the US August PPI data + initial jobless claims
PPI is a leading inflation indicator. The data’s strength or weakness will directly affect market expectations for the Fed’s interest-rate outlook. Tonight, focus on whether this set of data will bring further shocks to the market.
If the inflation data comes in higher than expected, the US dollar will likely keep strengthening, which will continue to weigh on gold and crypto assets; if the data is weaker than expected, it may help ease the current downside pressure
#伊朗称已准备升级对美战争
PPI is a leading inflation indicator. The data’s strength or weakness will directly affect market expectations for the Fed’s interest-rate outlook. Tonight, focus on whether this set of data will bring further shocks to the market.
If the inflation data comes in higher than expected, the US dollar will likely keep strengthening, which will continue to weigh on gold and crypto assets; if the data is weaker than expected, it may help ease the current downside pressure
#伊朗称已准备升级对美战争
294
·
--
Hynix SKHY Pre-market Analysis
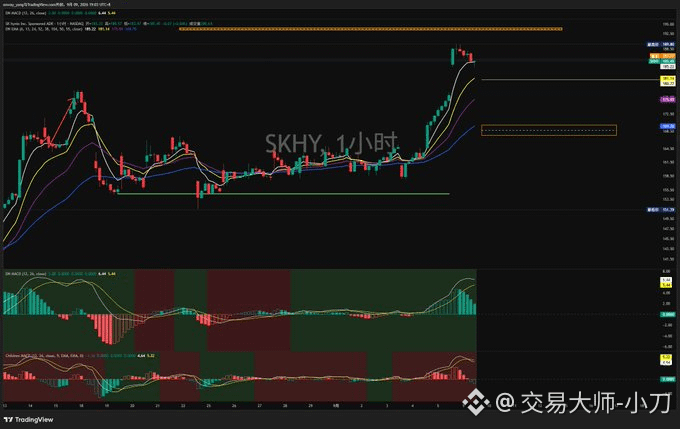
Review of yesterday’s view: The market is in a 4-hour and 1-hour rebound structure. The key focus is whether it can hold the 194 level. Only after it stabilizes there should we decide the next direction.
Last night, U.S. stocks opened and surged, reaching a high of 189, then pulled back. The current pre-market price is 186.
For today to continue strengthening, the key to watch is support at 181. As long as it does not break below, we can continue to look for a rebound to test 194.
Hynix’s market logic is relatively straightforward. If it pulls back again, the key support below is around 170. If 170 is not broken, the rebound outlook remains intact.
#灰度ZcashETF资产突破5亿美元
Hynix SKHY Pre-market Analysis
Review of yesterday’s view: The market is in a 4-hour and 1-hour rebound structure. The key focus is whether it can hold the 194 level. Only after it stabilizes there should we decide the next direction.
Last night, U.S. stocks opened and surged, reaching a high of 189, then pulled back. The current pre-market price is 186.
For today to continue strengthening, the key to watch is support at 181. As long as it does not break below, we can continue to look for a rebound to test 194.
Hynix’s market logic is relatively straightforward. If it pulls back again, the key support below is around 170. If 170 is not broken, the rebound outlook remains intact.
#灰度ZcashETF资产突破5亿美元
Review of yesterday’s view: The market is in a 4-hour and 1-hour rebound structure. The key focus is whether it can hold the 194 level. Only after it stabilizes there should we decide the next direction.
Last night, U.S. stocks opened and surged, reaching a high of 189, then pulled back. The current pre-market price is 186.
For today to continue strengthening, the key to watch is support at 181. As long as it does not break below, we can continue to look for a rebound to test 194.
Hynix’s market logic is relatively straightforward. If it pulls back again, the key support below is around 170. If 170 is not broken, the rebound outlook remains intact.
#灰度ZcashETF资产突破5亿美元
322
·
--
📝SK hynix SKHY pre-market analysis
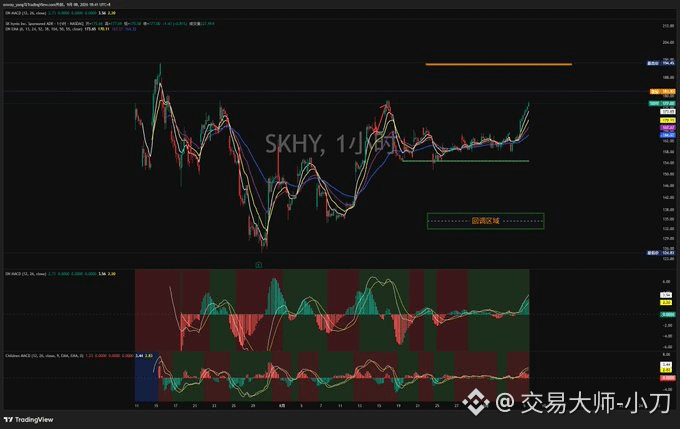
In the earlier stage, the trend was relatively weak, repeatedly testing the 154 support and nearly breaking down.
Last Friday, boosted by favorable news for the storage sector, HBM demand surged, and it finally broke through the box range upper resistance at 167.
Currently, it is approaching 182 pre-market, fully exiting the long-term consolidation range.
If the market continues to maintain strength, there is potential to challenge the prior high at 194.
The storage sector is turning collectively bullish, and the main storyline is returning.
The chart is showing a rebound structure on the 4-hour and 1-hour timeframes.
Pay close attention after the market opens to the test of the 194 area, and see whether it can hold firmly there—then decide on the next direction. Overall, the bias is mainly bullish for now.
#美伊互袭油轮冲突升级
📝SK hynix SKHY pre-market analysis
In the earlier stage, the trend was relatively weak, repeatedly testing the 154 support and nearly breaking down.
Last Friday, boosted by favorable news for the storage sector, HBM demand surged, and it finally broke through the box range upper resistance at 167.
Currently, it is approaching 182 pre-market, fully exiting the long-term consolidation range.
If the market continues to maintain strength, there is potential to challenge the prior high at 194.
The storage sector is turning collectively bullish, and the main storyline is returning.
The chart is showing a rebound structure on the 4-hour and 1-hour timeframes.
Pay close attention after the market opens to the test of the 194 area, and see whether it can hold firmly there—then decide on the next direction. Overall, the bias is mainly bullish for now.
#美伊互袭油轮冲突升级
In the earlier stage, the trend was relatively weak, repeatedly testing the 154 support and nearly breaking down.
Last Friday, boosted by favorable news for the storage sector, HBM demand surged, and it finally broke through the box range upper resistance at 167.
Currently, it is approaching 182 pre-market, fully exiting the long-term consolidation range.
If the market continues to maintain strength, there is potential to challenge the prior high at 194.
The storage sector is turning collectively bullish, and the main storyline is returning.
The chart is showing a rebound structure on the 4-hour and 1-hour timeframes.
Pay close attention after the market opens to the test of the 194 area, and see whether it can hold firmly there—then decide on the next direction. Overall, the bias is mainly bullish for now.
#美伊互袭油轮冲突升级
261
·
--
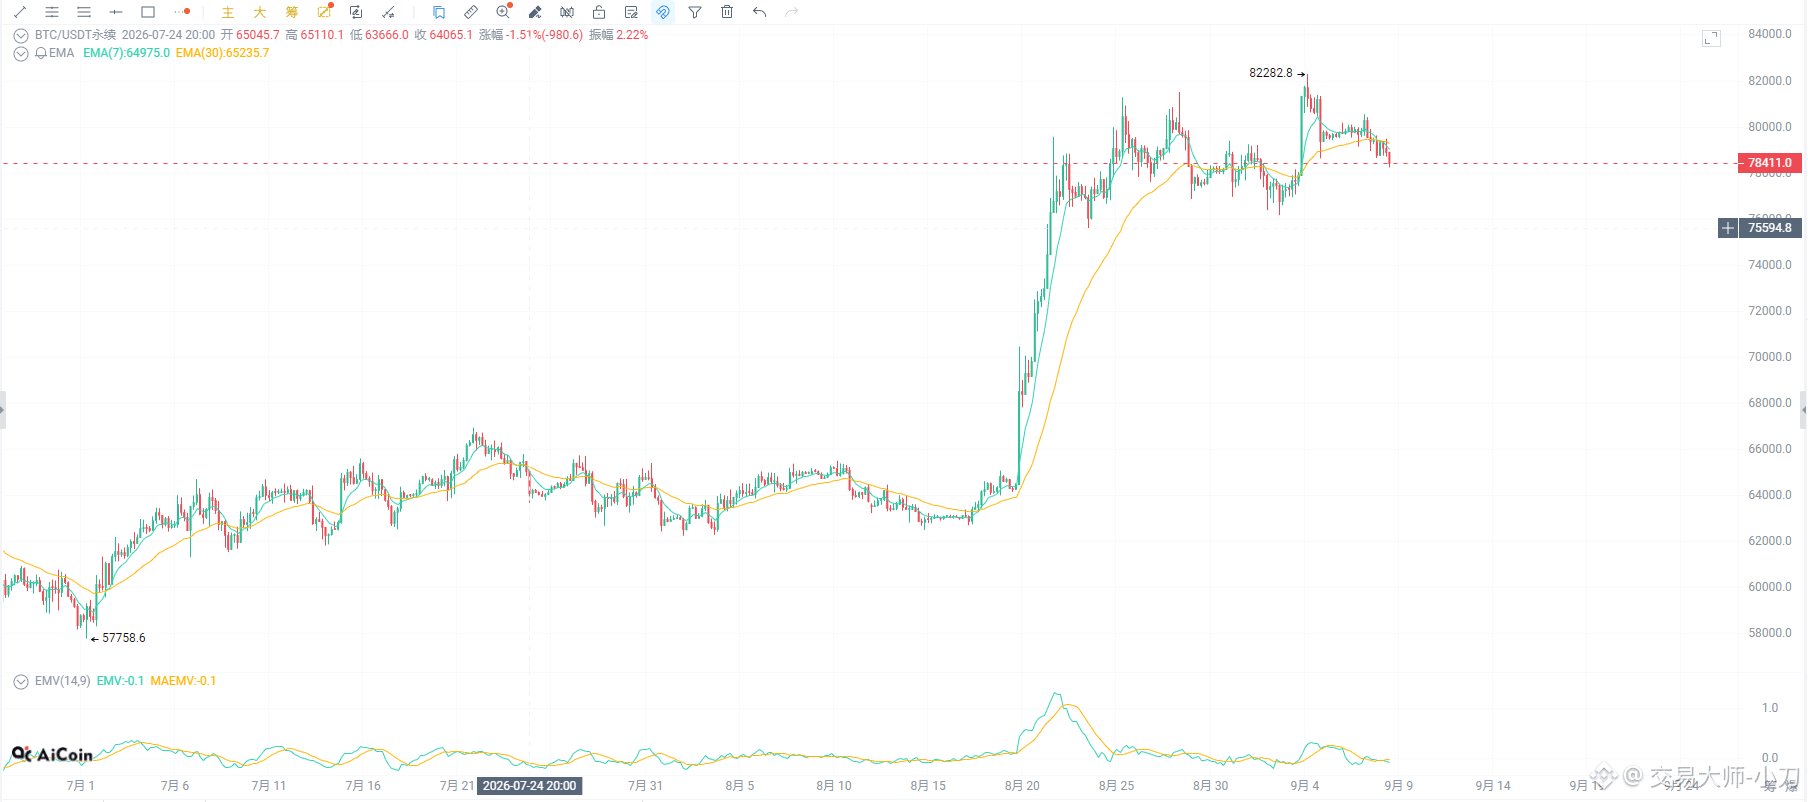
BTC has recently fallen from around $82,000 to $78.8k, but short-term holders have not yet entered a collective loss state.
CryptoQuant’s STH-SOPR shows that during the quick rebound in late August, the indicator rose to above 1.04 at one point, suggesting that chips held for between 1 hour and 155 days realized clear profits when they moved.
After that, the price dropped again, and the STH-SOPR fell rapidly as well. Currently, the daily line is about 1.004, and the 7-day moving average is around 1.007, but both remain above the breakeven line of 1.
It’s important to note that STH-SOPR measures the profit/loss status when these coins are spent or transferred, and it does not necessarily mean these BTC are definitely being sold to exchanges. However, when the indicator pulls back from a high level, it at least suggests that the profits that recent holders can realize are declining, and the market’s ability to withstand further downside is weakening.
The key next is still this line: 1.
If STH-SOPR briefly falls below 1 and quickly recovers, it means the market can still absorb short-term holders’ losing coins, and the current pullback is closer to a cost-resetting move. If the indicator stays below 1 while BTC’s rebound lacks momentum, then it would mean recent buyers are beginning to exit in a continuous loss, and the adjustment would shift from profit-taking to short-term holder capitulation.
At present, on-chain conditions are somewhat neutral: profit realization has clearly cooled, but real panic has not appeared.
#加拿大拟对美商品加征15%至50%关税
BTC has recently fallen from around $82,000 to $78.8k, but short-term holders have not yet entered a collective loss state.
CryptoQuant’s STH-SOPR shows that during the quick rebound in late August, the indicator rose to above 1.04 at one point, suggesting that chips held for between 1 hour and 155 days realized clear profits when they moved.
After that, the price dropped again, and the STH-SOPR fell rapidly as well. Currently, the daily line is about 1.004, and the 7-day moving average is around 1.007, but both remain above the breakeven line of 1.
It’s important to note that STH-SOPR measures the profit/loss status when these coins are spent or transferred, and it does not necessarily mean these BTC are definitely being sold to exchanges. However, when the indicator pulls back from a high level, it at least suggests that the profits that recent holders can realize are declining, and the market’s ability to withstand further downside is weakening.
The key next is still this line: 1.
If STH-SOPR briefly falls below 1 and quickly recovers, it means the market can still absorb short-term holders’ losing coins, and the current pullback is closer to a cost-resetting move. If the indicator stays below 1 while BTC’s rebound lacks momentum, then it would mean recent buyers are beginning to exit in a continuous loss, and the adjustment would shift from profit-taking to short-term holder capitulation.
At present, on-chain conditions are somewhat neutral: profit realization has clearly cooled, but real panic has not appeared.
#加拿大拟对美商品加征15%至50%关税
CryptoQuant’s STH-SOPR shows that during the quick rebound in late August, the indicator rose to above 1.04 at one point, suggesting that chips held for between 1 hour and 155 days realized clear profits when they moved.
After that, the price dropped again, and the STH-SOPR fell rapidly as well. Currently, the daily line is about 1.004, and the 7-day moving average is around 1.007, but both remain above the breakeven line of 1.
It’s important to note that STH-SOPR measures the profit/loss status when these coins are spent or transferred, and it does not necessarily mean these BTC are definitely being sold to exchanges. However, when the indicator pulls back from a high level, it at least suggests that the profits that recent holders can realize are declining, and the market’s ability to withstand further downside is weakening.
The key next is still this line: 1.
If STH-SOPR briefly falls below 1 and quickly recovers, it means the market can still absorb short-term holders’ losing coins, and the current pullback is closer to a cost-resetting move. If the indicator stays below 1 while BTC’s rebound lacks momentum, then it would mean recent buyers are beginning to exit in a continuous loss, and the adjustment would shift from profit-taking to short-term holder capitulation.
At present, on-chain conditions are somewhat neutral: profit realization has clearly cooled, but real panic has not appeared.
#加拿大拟对美商品加征15%至50%关税
1
246
·
--
Verified
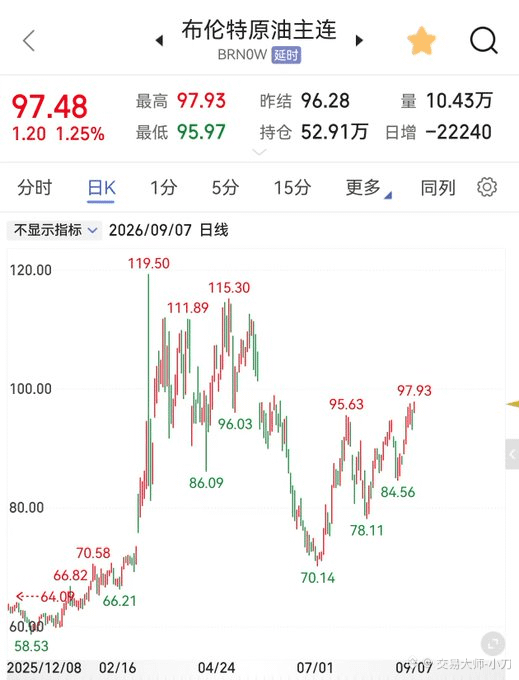
Is oil prices taking the place of the Fed rate hikes?
Brent crude is once again edging back toward $100.
Tensions between the U.S. and Iran are escalating, transport through the Strait of Hormuz is constrained, and OPEC+ has once again paused increasing production—energy inflation is back to being a key market variable.
And then, in the U.S., August nonfarm payrolls added 162,000 jobs—there’s no obvious economic slowdown. Since the economy is still holding up, the Fed has even more reason to keep interest rates at elevated levels. If oil prices keep rising, they will further push inflation expectations up.
In a sense, this is like oil prices tightening the Fed’s financial conditions.
For the market, the trouble is that earnings may not necessarily deteriorate right away, but high interest rates will first compress valuations—technology stocks are especially affected.
Next, I suggest you look at two things: whether oil can hold above $95, and whether this week’s CPI will further reinforce the assessment of persistent inflation stickiness.
Look at whether oil will face greater inflation pressure going forward, and look at whether inflation is actually cooling now, according to CPI.
What do you think—will the Fed raise rates again later?
#IMF称萨尔瓦多购币未用公共资金
Is oil prices taking the place of the Fed rate hikes?
Brent crude is once again edging back toward $100.
Tensions between the U.S. and Iran are escalating, transport through the Strait of Hormuz is constrained, and OPEC+ has once again paused increasing production—energy inflation is back to being a key market variable.
And then, in the U.S., August nonfarm payrolls added 162,000 jobs—there’s no obvious economic slowdown. Since the economy is still holding up, the Fed has even more reason to keep interest rates at elevated levels. If oil prices keep rising, they will further push inflation expectations up.
In a sense, this is like oil prices tightening the Fed’s financial conditions.
For the market, the trouble is that earnings may not necessarily deteriorate right away, but high interest rates will first compress valuations—technology stocks are especially affected.
Next, I suggest you look at two things: whether oil can hold above $95, and whether this week’s CPI will further reinforce the assessment of persistent inflation stickiness.
Look at whether oil will face greater inflation pressure going forward, and look at whether inflation is actually cooling now, according to CPI.
What do you think—will the Fed raise rates again later?
#IMF称萨尔瓦多购币未用公共资金
Brent crude is once again edging back toward $100.
Tensions between the U.S. and Iran are escalating, transport through the Strait of Hormuz is constrained, and OPEC+ has once again paused increasing production—energy inflation is back to being a key market variable.
And then, in the U.S., August nonfarm payrolls added 162,000 jobs—there’s no obvious economic slowdown. Since the economy is still holding up, the Fed has even more reason to keep interest rates at elevated levels. If oil prices keep rising, they will further push inflation expectations up.
In a sense, this is like oil prices tightening the Fed’s financial conditions.
For the market, the trouble is that earnings may not necessarily deteriorate right away, but high interest rates will first compress valuations—technology stocks are especially affected.
Next, I suggest you look at two things: whether oil can hold above $95, and whether this week’s CPI will further reinforce the assessment of persistent inflation stickiness.
Look at whether oil will face greater inflation pressure going forward, and look at whether inflation is actually cooling now, according to CPI.
What do you think—will the Fed raise rates again later?
#IMF称萨尔瓦多购币未用公共资金
1.1k
·
--
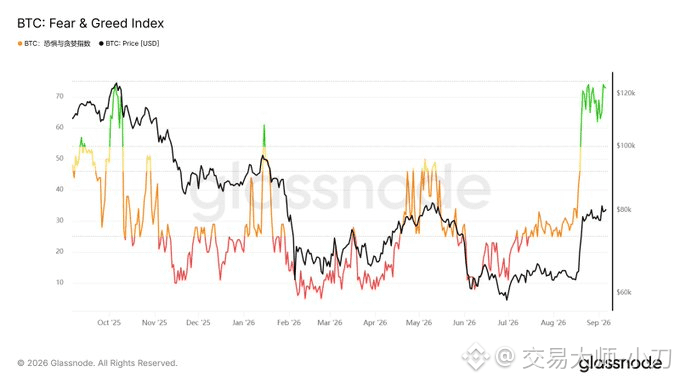
BTC has returned to around $80,000, yet market sentiment has already recovered to the same level of optimism seen last December when it was above $120,000, which makes me cautious about chasing the rally.
Glassnode data shows the Fear and Greed Index has climbed back above 70, approaching last October's highs. In May this year, when BTC was also close to $80,000, the index was mostly still between 30 and 50.
Prices are similar, but expectations for further gains are even stronger.
High sentiment does not mean a top, but if price fails to keep breaking higher, elevated sentiment requires more buying to absorb profit-taking. Once the rise fails to live up to expectations, funds that entered after the rebound are also more likely to waver.
So I am more wary of a pullback after a failed push higher. What matters next is not how optimistic the market is, but whether there is sustained buying support behind that optimism.
#中国八大金融机构注资3600亿元
BTC has returned to around $80,000, yet market sentiment has already recovered to the same level of optimism seen last December when it was above $120,000, which makes me cautious about chasing the rally.
Glassnode data shows the Fear and Greed Index has climbed back above 70, approaching last October's highs. In May this year, when BTC was also close to $80,000, the index was mostly still between 30 and 50.
Prices are similar, but expectations for further gains are even stronger.
High sentiment does not mean a top, but if price fails to keep breaking higher, elevated sentiment requires more buying to absorb profit-taking. Once the rise fails to live up to expectations, funds that entered after the rebound are also more likely to waver.
So I am more wary of a pullback after a failed push higher. What matters next is not how optimistic the market is, but whether there is sustained buying support behind that optimism.
#中国八大金融机构注资3600亿元
Glassnode data shows the Fear and Greed Index has climbed back above 70, approaching last October's highs. In May this year, when BTC was also close to $80,000, the index was mostly still between 30 and 50.
Prices are similar, but expectations for further gains are even stronger.
High sentiment does not mean a top, but if price fails to keep breaking higher, elevated sentiment requires more buying to absorb profit-taking. Once the rise fails to live up to expectations, funds that entered after the rebound are also more likely to waver.
So I am more wary of a pullback after a failed push higher. What matters next is not how optimistic the market is, but whether there is sustained buying support behind that optimism.
#中国八大金融机构注资3600亿元
394
·
--
GOLD Gold Market Analysis
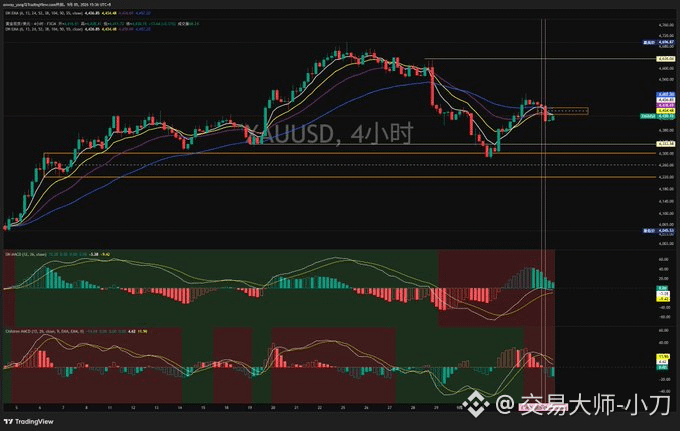
Affected by the stronger-than-expected non-farm payroll revision data, gold was hit hard from around 4464, dropping to a low of 4366
Compared with Bitcoin, gold showed stronger resilience, quickly completed a bottom test and rebound, and closed back at 4430, returning to our resistance zone
However, risks still cannot be ignored. The key one-hour support has already been broken, and downward pressure on the 4-hour timeframe remains. A further pullback is still possible
Next, focus on the 4333 support zone
If a retest of this level holds, you can try a small long position
#美国8月新增就业16.2万近预期三倍
GOLD Gold Market Analysis
Affected by the stronger-than-expected non-farm payroll revision data, gold was hit hard from around 4464, dropping to a low of 4366
Compared with Bitcoin, gold showed stronger resilience, quickly completed a bottom test and rebound, and closed back at 4430, returning to our resistance zone
However, risks still cannot be ignored. The key one-hour support has already been broken, and downward pressure on the 4-hour timeframe remains. A further pullback is still possible
Next, focus on the 4333 support zone
If a retest of this level holds, you can try a small long position
#美国8月新增就业16.2万近预期三倍
Affected by the stronger-than-expected non-farm payroll revision data, gold was hit hard from around 4464, dropping to a low of 4366
Compared with Bitcoin, gold showed stronger resilience, quickly completed a bottom test and rebound, and closed back at 4430, returning to our resistance zone
However, risks still cannot be ignored. The key one-hour support has already been broken, and downward pressure on the 4-hour timeframe remains. A further pullback is still possible
Next, focus on the 4333 support zone
If a retest of this level holds, you can try a small long position
#美国8月新增就业16.2万近预期三倍
358
·
--
Verified
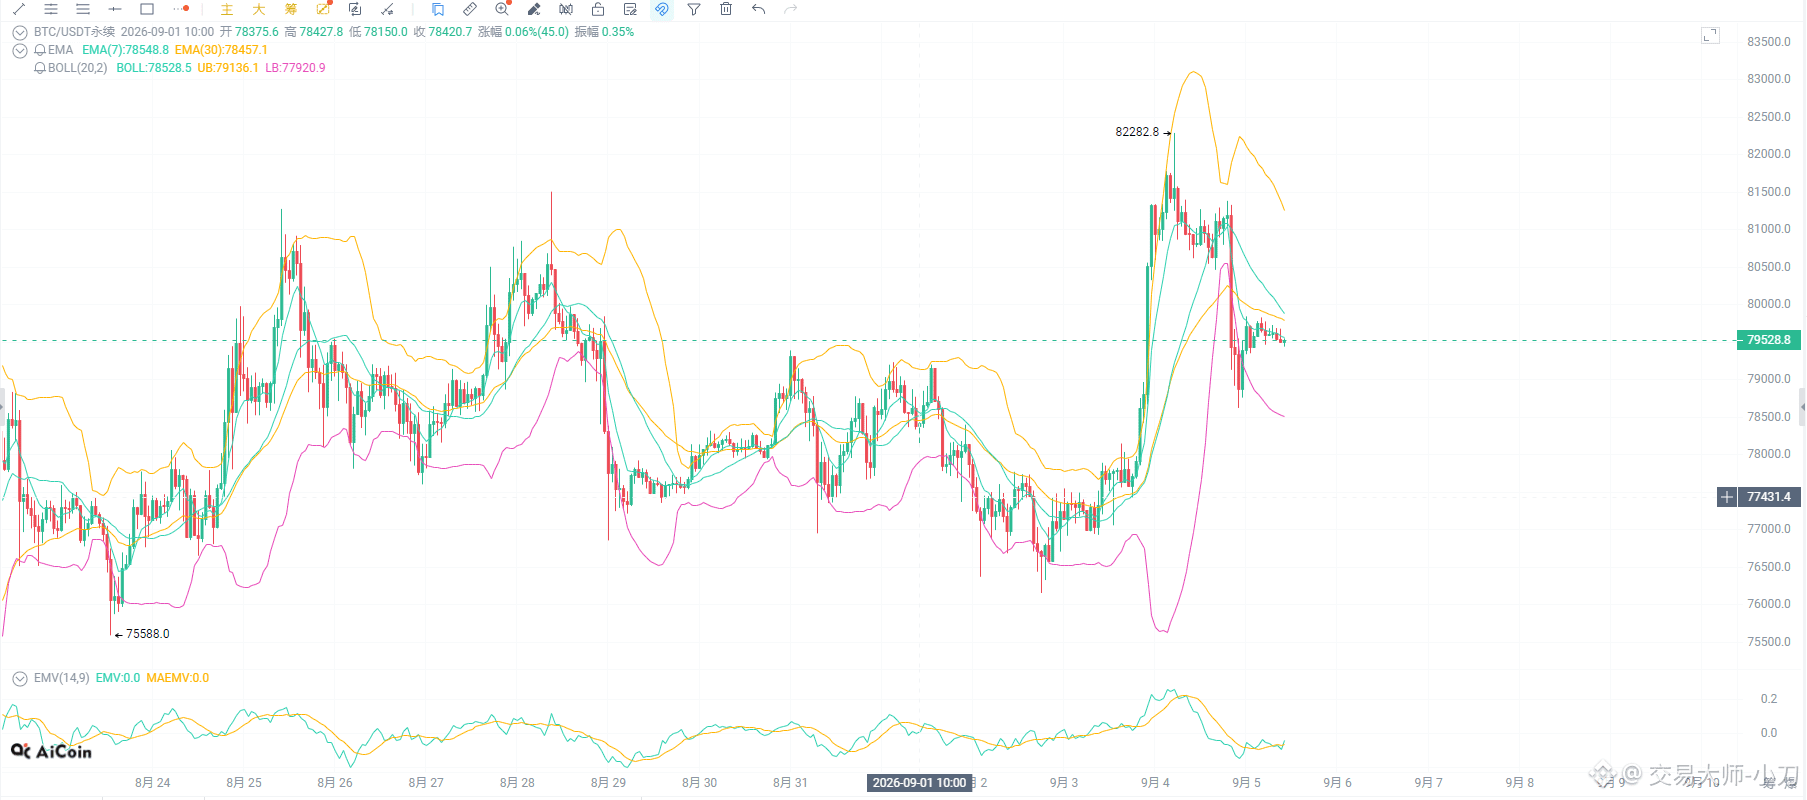
After the nonfarm payrolls data came out last night, BTC was pushed down again by macro factors.
August nonfarm payrolls increased by 162,000, well above expectations, and the unemployment rate stayed at 4.1%.
The stronger the job market, the more confidence the Fed has to stay hawkish, and the probability of a September rate hike has also climbed back to around 60%.
So what BTC is really waiting for now is no longer nonfarm payrolls, but next week’s CPI.
If inflation comes in above expectations again, the macro pressure in September may not be over yet.
Let’s see how the market digests this over the weekend.
#比特币ETF创1月以来最大单日流入
After the nonfarm payrolls data came out last night, BTC was pushed down again by macro factors.
August nonfarm payrolls increased by 162,000, well above expectations, and the unemployment rate stayed at 4.1%.
The stronger the job market, the more confidence the Fed has to stay hawkish, and the probability of a September rate hike has also climbed back to around 60%.
So what BTC is really waiting for now is no longer nonfarm payrolls, but next week’s CPI.
If inflation comes in above expectations again, the macro pressure in September may not be over yet.
Let’s see how the market digests this over the weekend.
#比特币ETF创1月以来最大单日流入
August nonfarm payrolls increased by 162,000, well above expectations, and the unemployment rate stayed at 4.1%.
The stronger the job market, the more confidence the Fed has to stay hawkish, and the probability of a September rate hike has also climbed back to around 60%.
So what BTC is really waiting for now is no longer nonfarm payrolls, but next week’s CPI.
If inflation comes in above expectations again, the macro pressure in September may not be over yet.
Let’s see how the market digests this over the weekend.
#比特币ETF创1月以来最大单日流入
1.1k
Log in to explore more content
Join global crypto users on Binance Square
⚡️ Get latest and useful information about crypto.
💬 Trusted by the world’s largest crypto exchange.
👍 Discover real insights from verified creators.
Email / Phone number
Trending Topics
SouthAfricaProposesCryptoExchangeControls
319 views
108 Discussing
🚨 South Africa's Crypto Exit Question...
#SouthAfricaProposesCryptoExchangeControls
South Africa isn't proposing to ban crypto.
It's proposing to bring crypto's movement across its borders under exchange-control rules.
That sounds reasonable — until you consider where crypto is increasingly being used.
The draft framework would treat transfers from a domestic authorised crypto provider to an offshore provider or a non-custodial wallet as cross-border events that must be reported to FinSurv.
Individuals would have a route to externalise crypto through existing foreign-exchange allowances.
But companies would not have the same proposed route.
And that's where the debate gets interesting.
A South African business could use crypto domestically, but the proposed framework would restrict corporate cross-border crypto flows — potentially affecting use cases such as international settlement and offshore digital-asset treasury activity. Industry groups argue this could push activity toward offshore platforms rather than eliminate it.
The regulator's objective is different: close potential exchange-control loopholes and improve visibility over cross-border capital flows and illicit finance.
So the real question isn't:
“Is South Africa banning crypto?”
It isn't.
The question is:
Can tighter controls on regulated crypto rails increase visibility — or could some activity simply move beyond those rails?
The proposal is still open for comment until September 30.
Where do you think the line should be drawn?
$BTC $SAGA $SUI
#CryptoRegulation #BinanceSquare #Stablecoins
Stink meaner
·1 Likes
·33 views
SolanaCutsTargetSlotTimeTo250ms
1,972 views
124 Discussing
EthereumSurpasses$2700
6,240 views
150 Discussing