

CryptoBuzz
182 Posts

CryptoBuzz
Report
Block User
Welcome to CryptoBuzz - Your daily dose of cryptocurrency trends and insights! 💰 #CryptoNews Here from year 2017
Open Trade

BNB Holder
High-Frequency Trader
6.2 Years
20 Following
139 Followers
213 Liked
Posts
Portfolio
All
Quotes
·
--
$BTW i have taken long here at 0.95 for $BTW, Holding the position now
Whos with me in this????
$BTW i have taken long here at 0.95 for $BTW , Holding the position now
Whos with me in this????
Whos with me in this????
3
511
·
--
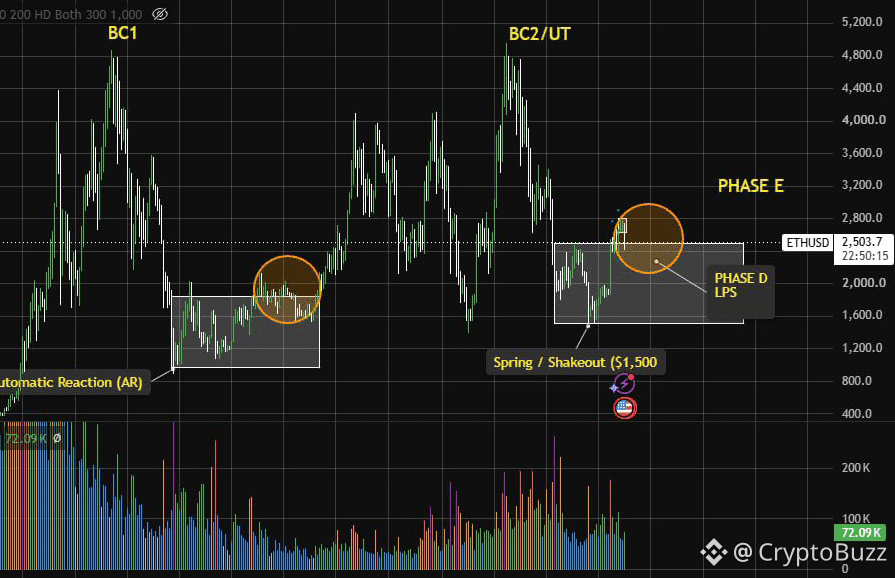
$ETH 1W
ON THE EDGE OF THE BOX, NOT YET IN PHASE E
Ethereum hovering around $2,500, right at the circle in the Box Last time this structure also went sideways, dipped, then only broke out. ( circle on the left )
This time there's already been a spring around $1,500, price pulled back to the upper edge. Closing above $2800 to confirm phase E
If it follows the previous circle pattern , $ETH price COULD pull back to at least $2290 -$2100 ( LPS phase D )
What do you think $ETH NEEDS. To retest the $2100 area first or will it sweep at $2500 and enter phase E ?
#EthereumSurpasses2500USDT #eth
1
317
·
--
Bitcoin Price on 4th of July
2010: $0.01
2011: $15
2012: $7
2013: $77
2014: $640
2015: $260
2016: $670
2017: $2,600
2018: $6,580
2019: $11,765
2020: $9,080
2021: $34,975
2022: $19,750
2023: $31,050
2024: $58,660
2025: $108,100
2026: $62,500
$BTC #bitcoin
Bitcoin Price on 4th of July
2010: $0.01
2011: $15
2012: $7
2013: $77
2014: $640
2015: $260
2016: $670
2017: $2,600
2018: $6,580
2019: $11,765
2020: $9,080
2021: $34,975
2022: $19,750
2023: $31,050
2024: $58,660
2025: $108,100
2026: $62,500
$BTC #bitcoin
2010: $0.01
2011: $15
2012: $7
2013: $77
2014: $640
2015: $260
2016: $670
2017: $2,600
2018: $6,580
2019: $11,765
2020: $9,080
2021: $34,975
2022: $19,750
2023: $31,050
2024: $58,660
2025: $108,100
2026: $62,500
$BTC #bitcoin
5
·
--
#CrudeFuturesSink i feel still bullish for this … who all Agree with me?
The global news is still on the negative side .. $CRUDE going to hit $95 again..
#CrudeFuturesSink i feel still bullish for this … who all Agree with me?
The global news is still on the negative side .. $CRUDE going to hit $95 again..
The global news is still on the negative side .. $CRUDE going to hit $95 again..
146
·
--
$AIGENSYN Whats happening with this Coin?
What will you be doing with this coin when you recieve 400 $AIGENSYN from a friend?
$AIGENSYN Whats happening with this Coin?
What will you be doing with this coin when you recieve 400 $AIGENSYN from a friend?
What will you be doing with this coin when you recieve 400 $AIGENSYN from a friend?
Buy More
48%
Sell It
26%
Hold It
26%
100 votes • Voting closed
1
4
1.9k
·
--
$TON whats happening here? 109% up in three days like really?
$TON whats happening here? 109% up in three days like really?
1
135
·
--
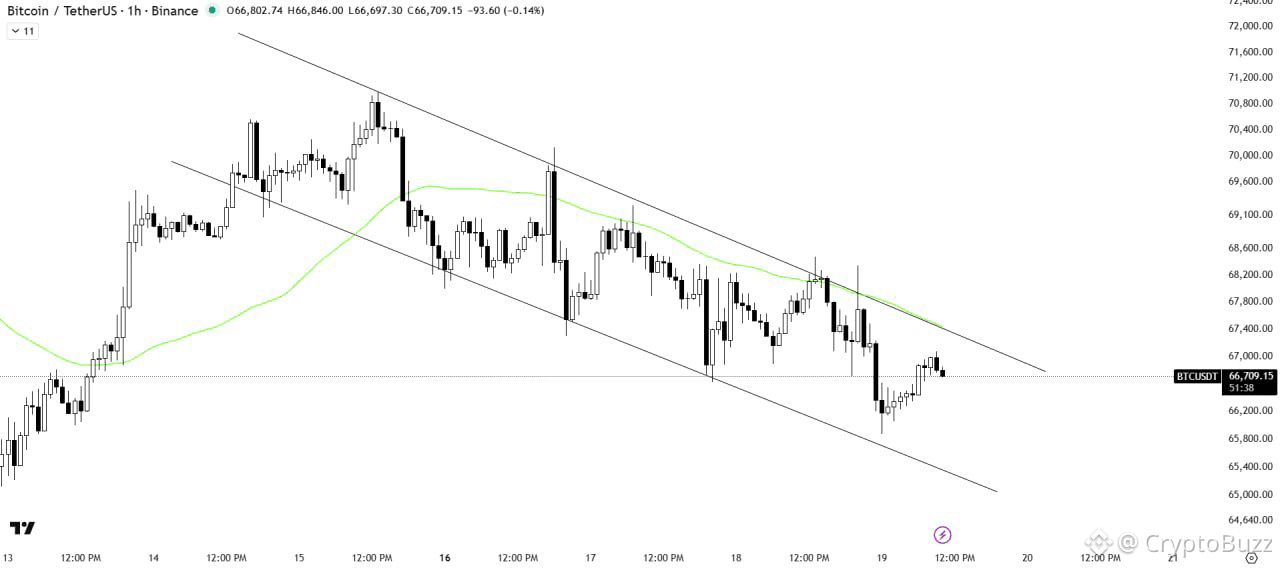
#BTC/USDT ANALYSIS
Bitcoin is consolidating within a descending channel and is currently trading below the channel’s resistance trendline, where the 50MA is acting as a resistance barrier.
A decisive breakout above the channel could trigger a bullish rally in the market. Otherwise, price may continue to move within the channel.
#bitcoin #StrategyBTCPurchase
1
8
·
--

Article
$BTC has never been red in January & FebruaryYou know what this means, right?
From historical data across sources (CoinGlass, CryptoRank, Newhedge heatmaps, and various analyses):
• In prior years where January was negative (e.g., 2015, 2018, 2019, 2022, and others), February typically delivered positive returns, often acting as a rebound month.
• This “never both red” streak held from Bitcoin’s tradable history (roughly 2011/2013 onward through 2025).
• 2026 marks the first time both opening months have closed negative, breaking that long-standing seasonal pattern.
Current context (as of mid/late February 2026):
• Bitcoin is trading around $66,900–$69,000 (down significantly from late-2025 highs, with YTD returns around -22%).
• This makes 2026’s start one of the weakest on record (weakest Q1 opening since 2018 in some metrics).
• February’s decline ranks among the larger historical February drops.
What this means in the crypto/TA community context (especially on X, where such stats get hyped):
It’s classic “this time it’s different” vs. “history rhymes” debate.
Many bullish posters use the old pattern to signal “buy the dip” — implying February should have bounced after a red January, so a double-red setup is “extremely rare/bullish reversal incoming” (FOMO fuel: “the streak breaking means epic pump next”).
But bears/counterpoints highlight:
• Patterns break, especially as Bitcoin matures (post-ETF era, more correlated to macro/rates, institutional flows turning negative recently).
• This could signal deeper weakness: longest monthly losing streak in years if March continues down, macro headwinds (e.g., liquidity, risk-off), or cycle dynamics shifting.
• No guarantee of reversal — stats are backward-looking, and 2026 already shattered the “never both red” rule.
In short: It means the old seasonal “safety net” for early-year dips is gone for the first time. Whether that’s bullish capitulation fuel or bearish confirmation depends on your bias — but it’s definitely notable and sparking a lot of discussion right now. If March turns green and reclaims $80k+, the narrative flips hard to “pattern broken = new bull leg.” Otherwise, more pain possible.
HODL strong, or whatever your strategy is. 🚀📉 What’s your take — reversal soon or more downside?
#MarketRebound #BTCFellBelow$69,000Again
$BTC has never been red in January & February
You know what this means, right?
From historical data across sources (CoinGlass, CryptoRank, Newhedge heatmaps, and various analyses):
• In prior years where January was negative (e.g., 2015, 2018, 2019, 2022, and others), February typically delivered positive returns, often acting as a rebound month.
• This “never both red” streak held from Bitcoin’s tradable history (roughly 2011/2013 onward through 2025).
• 2026 marks the first time both opening months have closed negative, breaking that long-standing seasonal pattern.
Current context (as of mid/late February 2026):
• Bitcoin is trading around $66,900–$69,000 (down significantly from late-2025 highs, with YTD returns around -22%).
• This makes 2026’s start one of the weakest on record (weakest Q1 opening since 2018 in some metrics).
• February’s decline ranks among the larger historical February drops.
What this means in the crypto/TA community context (especially on X, where such stats get hyped):
It’s classic “this time it’s different” vs. “history rhymes” debate.
Many bullish posters use the old pattern to signal “buy the dip” — implying February should have bounced after a red January, so a double-red setup is “extremely rare/bullish reversal incoming” (FOMO fuel: “the streak breaking means epic pump next”).
But bears/counterpoints highlight:
• Patterns break, especially as Bitcoin matures (post-ETF era, more correlated to macro/rates, institutional flows turning negative recently).
• This could signal deeper weakness: longest monthly losing streak in years if March continues down, macro headwinds (e.g., liquidity, risk-off), or cycle dynamics shifting.
• No guarantee of reversal — stats are backward-looking, and 2026 already shattered the “never both red” rule.
In short: It means the old seasonal “safety net” for early-year dips is gone for the first time. Whether that’s bullish capitulation fuel or bearish confirmation depends on your bias — but it’s definitely notable and sparking a lot of discussion right now. If March turns green and reclaims $80k+, the narrative flips hard to “pattern broken = new bull leg.” Otherwise, more pain possible.
HODL strong, or whatever your strategy is. 🚀📉 What’s your take — reversal soon or more downside?
#MarketRebound #BTCFellBelow$69,000Again
5
252
·
--
Bearish
Here’s what’s driving the crypto market down today Feb 16 2026
📉 1 Bitcoin weakness is pulling the whole market down
• Bitcoin failed to stay above key resistance 70K and slid below 68K which triggered selling pressure across most coins
• Bitcoins recent rejection at that level increased uncertainty and pushed traders into a risk off mindset
📊 2 Negative market sentiment and risk off trading
• Traders are reducing exposure to risk assets like crypto ahead of major macroeconomic data US inflation and Fed minutes which often impacts crypto sentiment just like stocks
• Liquidations and broader profit taking have elevated selling pressure
🪙 3 Altcoins falling harder than Bitcoin
• Ether XRP Solana and meme coins like Dogecoin are all down as investors pull money out of smaller or speculative tokens following BTC weakness
🧠 4 Weak market catalysts and fading ETF enthusiasm
• Inflows into spot BitcoinETFs have slowed which can reduce institutional buying support that had been helping price rallies
📉 5 Broader macro uncertainty and trading slowdown
• Global markets and traditional assets show cautious sentiment making traders less willing to chase high volatility cryptos
• Slow crypto trading volumes highlighted by Coinbases recent earnings also reflect reduced market participation $BTC
Follow for more updates! #Write2Earn!
{spot}(BTCUSDT)
Here’s what’s driving the crypto market down today Feb 16 2026
📉 1 Bitcoin weakness is pulling the whole market down
• Bitcoin failed to stay above key resistance 70K and slid below 68K which triggered selling pressure across most coins
• Bitcoins recent rejection at that level increased uncertainty and pushed traders into a risk off mindset
📊 2 Negative market sentiment and risk off trading
• Traders are reducing exposure to risk assets like crypto ahead of major macroeconomic data US inflation and Fed minutes which often impacts crypto sentiment just like stocks
• Liquidations and broader profit taking have elevated selling pressure
🪙 3 Altcoins falling harder than Bitcoin
• Ether XRP Solana and meme coins like Dogecoin are all down as investors pull money out of smaller or speculative tokens following BTC weakness
🧠 4 Weak market catalysts and fading ETF enthusiasm
• Inflows into spot BitcoinETFs have slowed which can reduce institutional buying support that had been helping price rallies
📉 5 Broader macro uncertainty and trading slowdown
• Global markets and traditional assets show cautious sentiment making traders less willing to chase high volatility cryptos
• Slow crypto trading volumes highlighted by Coinbases recent earnings also reflect reduced market participation $BTC
Follow for more updates! #Write2Earn!
32
·
--
GarrettBullish has been LIQUIDATED on his $500m $ETH ETH position
He went from $142m in unrealized gains to $128m in unrealized LOSSES
The modern day Su Zhu has been liquidated
Whats happening in Crypto? Its All Down
🚨 𝗡𝗘𝗫𝗧 𝗪𝗘𝗘𝗞 = 𝗛𝗜𝗚𝗛 𝗩𝗢𝗟𝗔𝗧𝗜𝗟𝗜𝗧𝗬 𝗔𝗟𝗘𝗥𝗧 🚨
📅 Monday: U.S. GDP sets the macro mood
💧 Tuesday: Fed liquidity ops under the spotlight
🏦 Wednesday: FOMC decision — markets hold their breath
📊 Thursday: Fed balance sheet update = liquidity clues
🌍 Friday: Major U.S. data → China reserves over the weekend
Buckle up. Volatility stays elevated.
Are you positioned or just watching? 👀📈
Follow me for more crypto updates 🔔
#MarketCorrection #FedHoldsRates #WhoIsNextFedChair
1
5
·
--
JUST IN: 🇺🇸 Robinhood CEO Vlad Tenev meets with US government to discuss crypto market structure legislation
#StrategyBTCPurchase
JUST IN: 🇺🇸 Robinhood CEO Vlad Tenev meets with US government to discuss crypto market structure legislation
#StrategyBTCPurchase
#StrategyBTCPurchase
10
·
--
Bullish
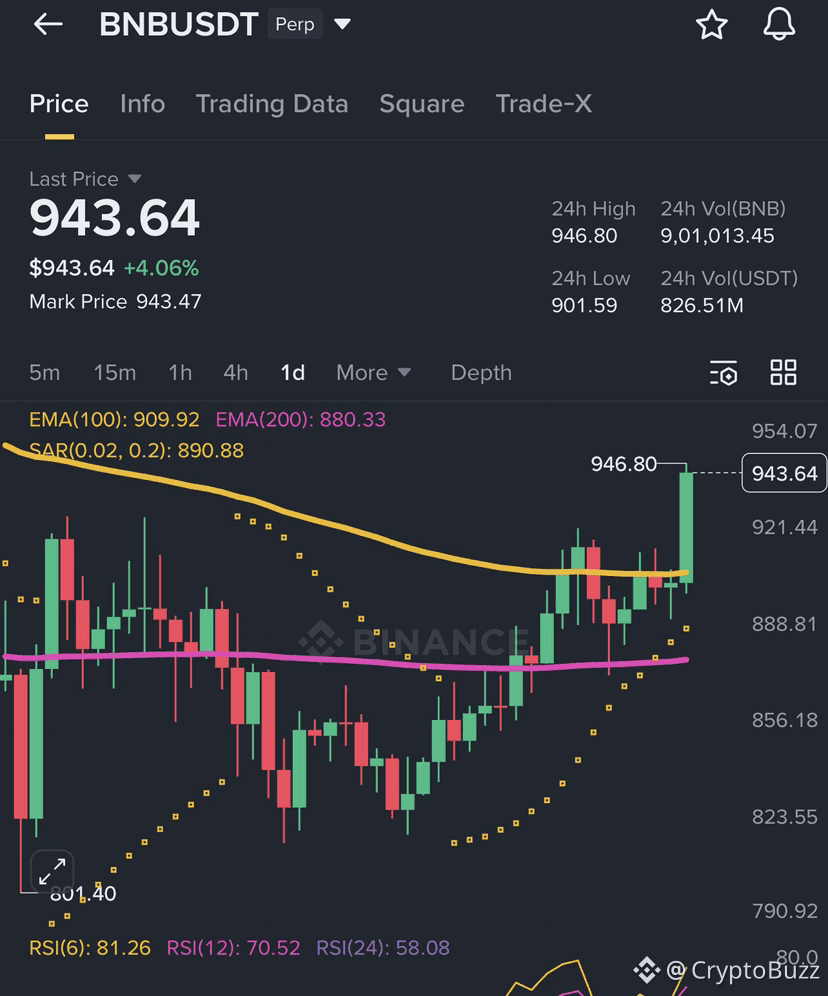
$BNB strength is clear, buyers are fully in control, and momentum is still hot
Next target: $1000+
$BNB
Stay focused, manage your trade properly, and don’t lose discipline here
Winners keep winning ... and we’re not done yet🔥🥳
#USNonFarmPayrollReport #CPIWatch #BNB金铲子挖矿
$BNB strength is clear, buyers are fully in control, and momentum is still hot
Next target: $1000+
$BNB
Stay focused, manage your trade properly, and don’t lose discipline here
Winners keep winning ... and we’re not done yet🔥🥳
#USNonFarmPayrollReport #CPIWatch #BNB金铲子挖矿
Next target: $1000+
$BNB
Stay focused, manage your trade properly, and don’t lose discipline here
Winners keep winning ... and we’re not done yet🔥🥳
#USNonFarmPayrollReport #CPIWatch #BNB金铲子挖矿
1
81
·
--
Look at the funding fee you already paid for this one !
Look at the funding fee you already paid for this one !

CATsu
·
--
BearishI'm so sad😭
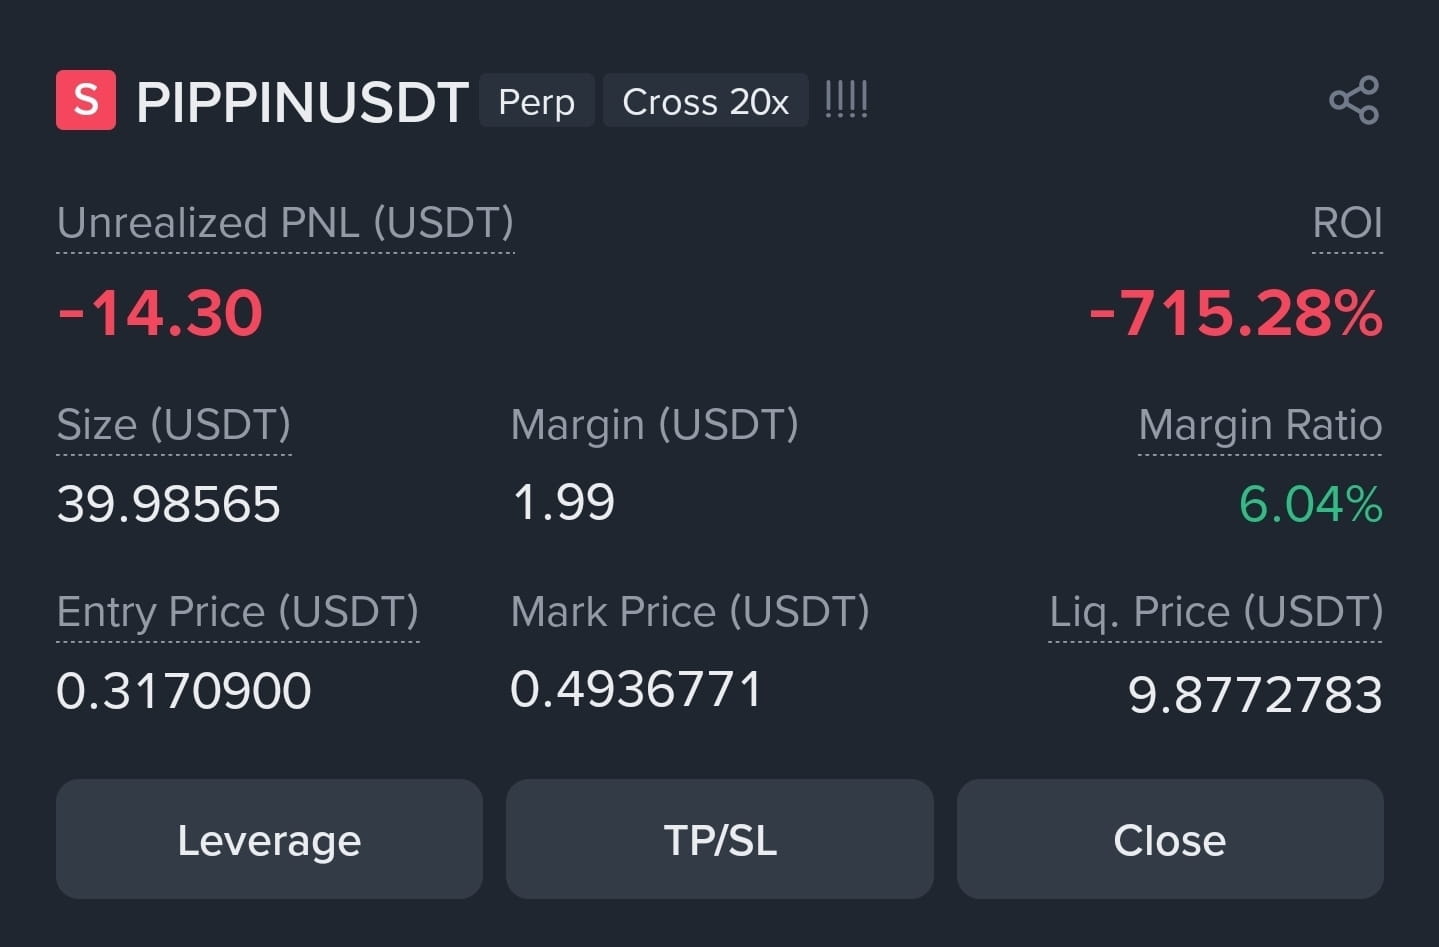
I shorted $PIPPIN and I lost my entire life savings 😭
what should I do with $PIPPIN ? 😭
I shorted $PIPPIN and I lost my entire life savings 😭
what should I do with $PIPPIN ? 😭

9
Log in to explore more content
Join global crypto users on Binance Square
⚡️ Get latest and useful information about crypto.
💬 Trusted by the world’s largest crypto exchange.
👍 Discover real insights from verified creators.
Email / Phone number