
Crypto_Vazima
5.3k Posts

Crypto_Vazima
Report
Block User
Fresh crypto news EVERY DAY! Subscribe now! Official STON.fi Ambassador! @crypto_vazima
30 Following
908 Followers
4.8K+ Liked
Posts
All
Quotes
·
--
Bullish
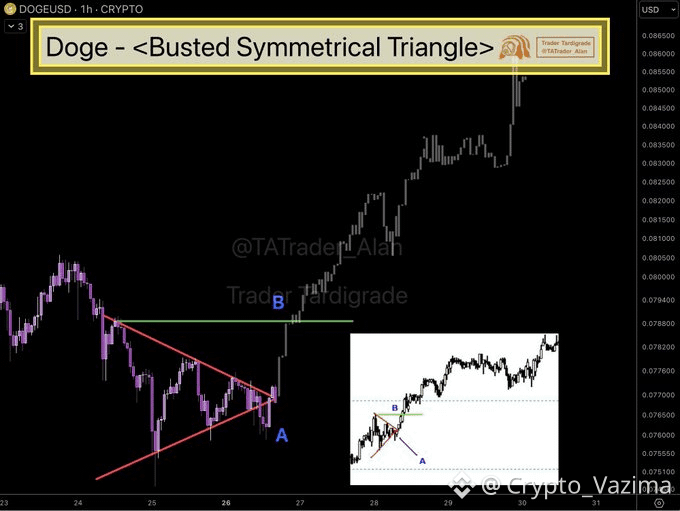
DOGE Bulls Just Busted the Triangle and Price Is Running 🔥
This hourly structure flipped from potential breakdown to clean upside in fast fashion, and the reaction is hard to ignore.
🗣 What Trader Tardigrade said
He noted the symmetrical triangle busted with a shallow breakdown then a move beyond the opposite side, arguing it "could bring a stronger uptrend than non-busted one."
🔥 Why the reaction stands out
- Downside probe failed quickly.
- Price exploded back through the triangle.
- Impulse candles show buyers stepping in hard.
🎯 My trade idea
- Bias: Long after confirmation
- Trigger: Hold above the breakout or retest of ~0.080
- Estimated entry zone: 0.080-0.082
- TP1: ~0.090
- Invalidation: clean loss of 0.076
- Est. odds: ~60% (subjective) for TP1 before SL once confirmed
I would not chase the first spike. Let the market prove the busted pattern holds.
Where do you place invalidation on this one? 👇
Tell me where you would place invalidation.
Not investment advice - research on your own! 🚀
$DOGE
{future}(DOGEUSDT)
DOGE Bulls Just Busted the Triangle and Price Is Running 🔥
This hourly structure flipped from potential breakdown to clean upside in fast fashion, and the reaction is hard to ignore.
🗣 What Trader Tardigrade said
He noted the symmetrical triangle busted with a shallow breakdown then a move beyond the opposite side, arguing it "could bring a stronger uptrend than non-busted one."
🔥 Why the reaction stands out
- Downside probe failed quickly.
- Price exploded back through the triangle.
- Impulse candles show buyers stepping in hard.
🎯 My trade idea
- Bias: Long after confirmation
- Trigger: Hold above the breakout or retest of ~0.080
- Estimated entry zone: 0.080-0.082
- TP1: ~0.090
- Invalidation: clean loss of 0.076
- Est. odds: ~60% (subjective) for TP1 before SL once confirmed
I would not chase the first spike. Let the market prove the busted pattern holds.
Where do you place invalidation on this one? 👇
Tell me where you would place invalidation.
Not investment advice - research on your own! 🚀
$DOGE
This hourly structure flipped from potential breakdown to clean upside in fast fashion, and the reaction is hard to ignore.
🗣 What Trader Tardigrade said
He noted the symmetrical triangle busted with a shallow breakdown then a move beyond the opposite side, arguing it "could bring a stronger uptrend than non-busted one."
🔥 Why the reaction stands out
- Downside probe failed quickly.
- Price exploded back through the triangle.
- Impulse candles show buyers stepping in hard.
🎯 My trade idea
- Bias: Long after confirmation
- Trigger: Hold above the breakout or retest of ~0.080
- Estimated entry zone: 0.080-0.082
- TP1: ~0.090
- Invalidation: clean loss of 0.076
- Est. odds: ~60% (subjective) for TP1 before SL once confirmed
I would not chase the first spike. Let the market prove the busted pattern holds.
Where do you place invalidation on this one? 👇
Tell me where you would place invalidation.
Not investment advice - research on your own! 🚀
$DOGE
96
·
--
Bullish
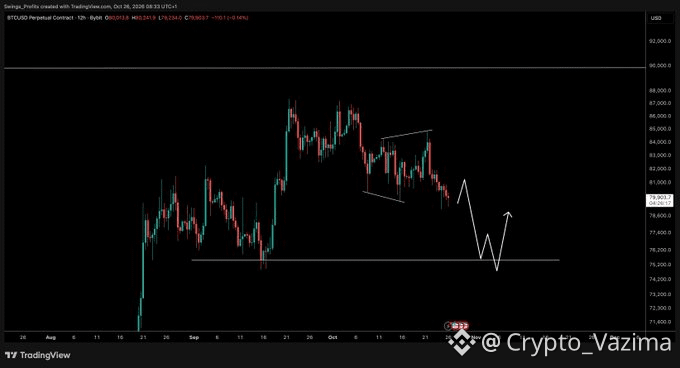
BTC Could Still Dip Before Any Bounce Feels Real ⚡
This chart sketch from CryptoTony is getting attention because the path looks so straightforward.
🗣 Original view
CryptoTony called it "an idea for now, but this would be good to work off."
The white line on the 12h chart shows a further drop then a recovery.
🔥 Why I am watching
- Price is hovering around 80k after the recent slide.
- The sketch aims for a lower low near 75.5k before any upside.
- That zone lines up with visible structure on the chart.
🚀 Our independent take
- Momentum has cooled and the chart is not screaming strength yet.
- A clean sweep of the lower area could set up a bounce, but only if buyers step in hard.
- Until then the idea stays speculative.
🎯 My trade idea
- Bias: Wait for the sketched dip
- Trigger: Strong reversal candle near the 75.5k-76k area
- Entry: Approx. 76k on confirmation
- TP1: Approx. 80.5k
- Invalidation: Daily close under 75k
- Confidence: Low until the reaction is clear
Are you watching for that lower sweep or already out? 👇
Drop the confirmation signal you want to see first.
Not investment advice - research on your own! 🚀
$BTC
{future}(BTCUSDT)
BTC Could Still Dip Before Any Bounce Feels Real ⚡
This chart sketch from CryptoTony is getting attention because the path looks so straightforward.
🗣 Original view
CryptoTony called it "an idea for now, but this would be good to work off."
The white line on the 12h chart shows a further drop then a recovery.
🔥 Why I am watching
- Price is hovering around 80k after the recent slide.
- The sketch aims for a lower low near 75.5k before any upside.
- That zone lines up with visible structure on the chart.
🚀 Our independent take
- Momentum has cooled and the chart is not screaming strength yet.
- A clean sweep of the lower area could set up a bounce, but only if buyers step in hard.
- Until then the idea stays speculative.
🎯 My trade idea
- Bias: Wait for the sketched dip
- Trigger: Strong reversal candle near the 75.5k-76k area
- Entry: Approx. 76k on confirmation
- TP1: Approx. 80.5k
- Invalidation: Daily close under 75k
- Confidence: Low until the reaction is clear
Are you watching for that lower sweep or already out? 👇
Drop the confirmation signal you want to see first.
Not investment advice - research on your own! 🚀
$BTC
This chart sketch from CryptoTony is getting attention because the path looks so straightforward.
🗣 Original view
CryptoTony called it "an idea for now, but this would be good to work off."
The white line on the 12h chart shows a further drop then a recovery.
🔥 Why I am watching
- Price is hovering around 80k after the recent slide.
- The sketch aims for a lower low near 75.5k before any upside.
- That zone lines up with visible structure on the chart.
🚀 Our independent take
- Momentum has cooled and the chart is not screaming strength yet.
- A clean sweep of the lower area could set up a bounce, but only if buyers step in hard.
- Until then the idea stays speculative.
🎯 My trade idea
- Bias: Wait for the sketched dip
- Trigger: Strong reversal candle near the 75.5k-76k area
- Entry: Approx. 76k on confirmation
- TP1: Approx. 80.5k
- Invalidation: Daily close under 75k
- Confidence: Low until the reaction is clear
Are you watching for that lower sweep or already out? 👇
Drop the confirmation signal you want to see first.
Not investment advice - research on your own! 🚀
$BTC
1
1
127
·
--
Bullish
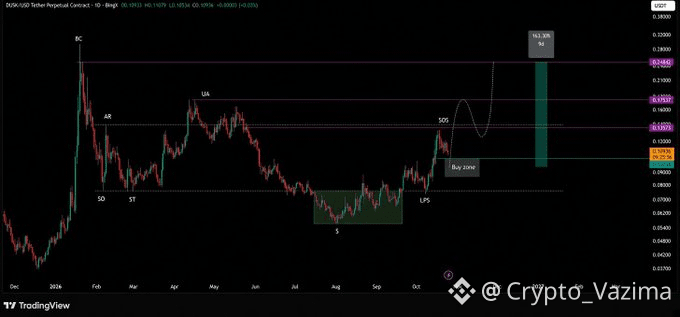
DUSK Buyers Waiting for Signs of Strength Soon 🚀
This one feels close to a decision point after the deep correction.
🗣 What the analyst said
Green Crypto Signals expects signs of strength soon after a pullback, but warns the pattern fails if price goes too deep below the initial move.
🔥 Why I am watching
- The chart has that spring-and-recovery look.
- Buyers have a clear zone to defend around the lower structure.
- A clean hold could open the next leg higher.
🎯 My trade idea
- Bias: Long after confirmation, not before.
- Trigger: Strength candle or reclaim after the expected pullback.
- Estimated entry: 0.107-0.111 range on stabilization.
- TP1: 0.135 (visible resistance).
- TP2: 0.175 if it runs.
- Invalidation: Break below ~0.100 with no recovery.
- Est. odds: ~60% chance of hitting TP1 first if the trigger fires (purely subjective).
🛡 Where I step back
No chase if it fails to hold the base. Pattern risk is real here.
Are you seeing strength or just more consolidation? 👇
Share your cleanest invalidation level below.
Not investment advice - research on your own! 🚀
$DUSK
{future}(DUSKUSDT)
DUSK Buyers Waiting for Signs of Strength Soon 🚀
This one feels close to a decision point after the deep correction.
🗣 What the analyst said
Green Crypto Signals expects signs of strength soon after a pullback, but warns the pattern fails if price goes too deep below the initial move.
🔥 Why I am watching
- The chart has that spring-and-recovery look.
- Buyers have a clear zone to defend around the lower structure.
- A clean hold could open the next leg higher.
🎯 My trade idea
- Bias: Long after confirmation, not before.
- Trigger: Strength candle or reclaim after the expected pullback.
- Estimated entry: 0.107-0.111 range on stabilization.
- TP1: 0.135 (visible resistance).
- TP2: 0.175 if it runs.
- Invalidation: Break below ~0.100 with no recovery.
- Est. odds: ~60% chance of hitting TP1 first if the trigger fires (purely subjective).
🛡 Where I step back
No chase if it fails to hold the base. Pattern risk is real here.
Are you seeing strength or just more consolidation? 👇
Share your cleanest invalidation level below.
Not investment advice - research on your own! 🚀
$DUSK
This one feels close to a decision point after the deep correction.
🗣 What the analyst said
Green Crypto Signals expects signs of strength soon after a pullback, but warns the pattern fails if price goes too deep below the initial move.
🔥 Why I am watching
- The chart has that spring-and-recovery look.
- Buyers have a clear zone to defend around the lower structure.
- A clean hold could open the next leg higher.
🎯 My trade idea
- Bias: Long after confirmation, not before.
- Trigger: Strength candle or reclaim after the expected pullback.
- Estimated entry: 0.107-0.111 range on stabilization.
- TP1: 0.135 (visible resistance).
- TP2: 0.175 if it runs.
- Invalidation: Break below ~0.100 with no recovery.
- Est. odds: ~60% chance of hitting TP1 first if the trigger fires (purely subjective).
🛡 Where I step back
No chase if it fails to hold the base. Pattern risk is real here.
Are you seeing strength or just more consolidation? 👇
Share your cleanest invalidation level below.
Not investment advice - research on your own! 🚀
$DUSK
157
·
--
Bullish
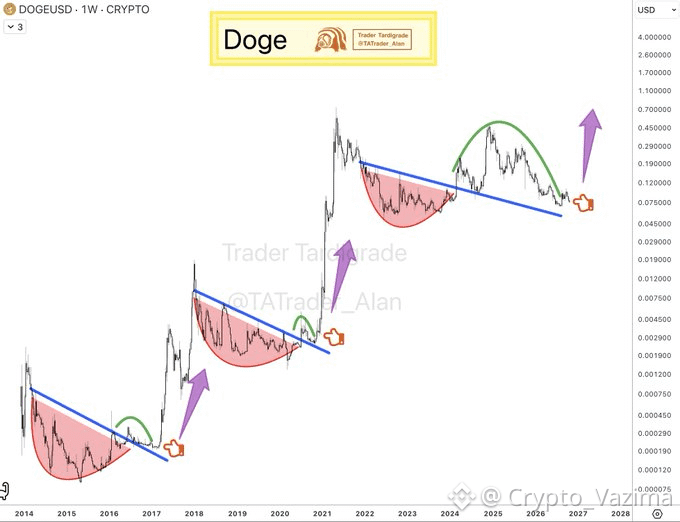
DOGE Sitting on the Line Again - History Says Watch Closely
This weekly setup has played out twice before and the chart is lining up for a third look.
🗣 Original analyst's view
Trader Tardigrade notes DOGE has run the same script three times: rounded base under a falling trendline, breakout, retest that holds, then the surge. He says 2016 and 2020 both delivered massive moves off the retest and price is sitting on the line again.
🔥 Why I am watching
- The pink rounded bases and blue falling lines match across the cycles on the weekly chart.
- Current candles are testing that same line right now near 0.077.
- Past holds of this retest zone were followed by strong purple-arrow upside.
🚀 Breakout trigger
- I want a clear weekly bounce or close that defends the line.
- No confirmation means no chase for me.
- Volume expansion on the hold would strengthen the case.
🎯 My trade idea
- Bias: Long after the retest proves itself.
- Estimated entry: 0.075-0.079 if it holds.
- TP1: 0.12 area.
- TP2: 0.18-0.20 based on prior cycle scale.
- Invalidation: weekly close under 0.065.
- Est. odds after confirmed hold: ~55-65% chance of TP1 before stop (subjective).
Are you waiting for the hold or already positioning? 👇
Tell me the confirmation signal you trust most here.
Not investment advice - research on your own! 🚀
$DOGE
{future}(DOGEUSDT)
DOGE Sitting on the Line Again - History Says Watch Closely
This weekly setup has played out twice before and the chart is lining up for a third look.
🗣 Original analyst's view
Trader Tardigrade notes DOGE has run the same script three times: rounded base under a falling trendline, breakout, retest that holds, then the surge. He says 2016 and 2020 both delivered massive moves off the retest and price is sitting on the line again.
🔥 Why I am watching
- The pink rounded bases and blue falling lines match across the cycles on the weekly chart.
- Current candles are testing that same line right now near 0.077.
- Past holds of this retest zone were followed by strong purple-arrow upside.
🚀 Breakout trigger
- I want a clear weekly bounce or close that defends the line.
- No confirmation means no chase for me.
- Volume expansion on the hold would strengthen the case.
🎯 My trade idea
- Bias: Long after the retest proves itself.
- Estimated entry: 0.075-0.079 if it holds.
- TP1: 0.12 area.
- TP2: 0.18-0.20 based on prior cycle scale.
- Invalidation: weekly close under 0.065.
- Est. odds after confirmed hold: ~55-65% chance of TP1 before stop (subjective).
Are you waiting for the hold or already positioning? 👇
Tell me the confirmation signal you trust most here.
Not investment advice - research on your own! 🚀
$DOGE
This weekly setup has played out twice before and the chart is lining up for a third look.
🗣 Original analyst's view
Trader Tardigrade notes DOGE has run the same script three times: rounded base under a falling trendline, breakout, retest that holds, then the surge. He says 2016 and 2020 both delivered massive moves off the retest and price is sitting on the line again.
🔥 Why I am watching
- The pink rounded bases and blue falling lines match across the cycles on the weekly chart.
- Current candles are testing that same line right now near 0.077.
- Past holds of this retest zone were followed by strong purple-arrow upside.
🚀 Breakout trigger
- I want a clear weekly bounce or close that defends the line.
- No confirmation means no chase for me.
- Volume expansion on the hold would strengthen the case.
🎯 My trade idea
- Bias: Long after the retest proves itself.
- Estimated entry: 0.075-0.079 if it holds.
- TP1: 0.12 area.
- TP2: 0.18-0.20 based on prior cycle scale.
- Invalidation: weekly close under 0.065.
- Est. odds after confirmed hold: ~55-65% chance of TP1 before stop (subjective).
Are you waiting for the hold or already positioning? 👇
Tell me the confirmation signal you trust most here.
Not investment advice - research on your own! 🚀
$DOGE
36
·
--
Bullish
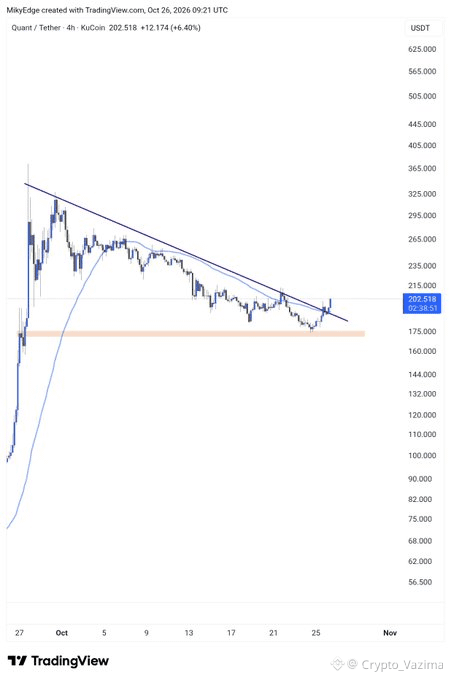
QNT Looks Ready for a Bounce After That Dip 🔥
The latest retest on QNT has traders talking. Price dipped into support and is trying to reclaim momentum right now.
🗣 Original analyst's view
According to MikybullCrypto, QNT is about to pull a good rally after the retest.
🔥 Why I am watching
- The 4h structure shows a clear descending trendline being challenged.
- Support near 175-185 absorbed the last sell-off.
- Bounce is underway, but early candles still need follow-through.
🎯 My trade idea
- Bias: Long after proof the retest sticks.
- Trigger: Hold above 195 with no sharp rejection.
- Estimated entry: 198-205 zone on confirmation.
- TP1: around 220.
- TP2: around 250 if buyers step up.
- Invalidation: sustained break under 180.
- Rough upside to TP1: ~10% from 200, downside to SL ~10%.
- Subjective odds after confirmation: ~60%.
🚀 Market flow
Buyers are testing the trendline. One strong close changes the tone fast.
Are you seeing strength or still waiting for proof? 👇
Tell me where you would place the risk line.
Not investment advice - research on your own! 🚀
$QNT
{future}(QNTUSDT)
QNT Looks Ready for a Bounce After That Dip 🔥
The latest retest on QNT has traders talking. Price dipped into support and is trying to reclaim momentum right now.
🗣 Original analyst's view
According to MikybullCrypto, QNT is about to pull a good rally after the retest.
🔥 Why I am watching
- The 4h structure shows a clear descending trendline being challenged.
- Support near 175-185 absorbed the last sell-off.
- Bounce is underway, but early candles still need follow-through.
🎯 My trade idea
- Bias: Long after proof the retest sticks.
- Trigger: Hold above 195 with no sharp rejection.
- Estimated entry: 198-205 zone on confirmation.
- TP1: around 220.
- TP2: around 250 if buyers step up.
- Invalidation: sustained break under 180.
- Rough upside to TP1: ~10% from 200, downside to SL ~10%.
- Subjective odds after confirmation: ~60%.
🚀 Market flow
Buyers are testing the trendline. One strong close changes the tone fast.
Are you seeing strength or still waiting for proof? 👇
Tell me where you would place the risk line.
Not investment advice - research on your own! 🚀
$QNT
The latest retest on QNT has traders talking. Price dipped into support and is trying to reclaim momentum right now.
🗣 Original analyst's view
According to MikybullCrypto, QNT is about to pull a good rally after the retest.
🔥 Why I am watching
- The 4h structure shows a clear descending trendline being challenged.
- Support near 175-185 absorbed the last sell-off.
- Bounce is underway, but early candles still need follow-through.
🎯 My trade idea
- Bias: Long after proof the retest sticks.
- Trigger: Hold above 195 with no sharp rejection.
- Estimated entry: 198-205 zone on confirmation.
- TP1: around 220.
- TP2: around 250 if buyers step up.
- Invalidation: sustained break under 180.
- Rough upside to TP1: ~10% from 200, downside to SL ~10%.
- Subjective odds after confirmation: ~60%.
🚀 Market flow
Buyers are testing the trendline. One strong close changes the tone fast.
Are you seeing strength or still waiting for proof? 👇
Tell me where you would place the risk line.
Not investment advice - research on your own! 🚀
$QNT
160
·
--
Bullish
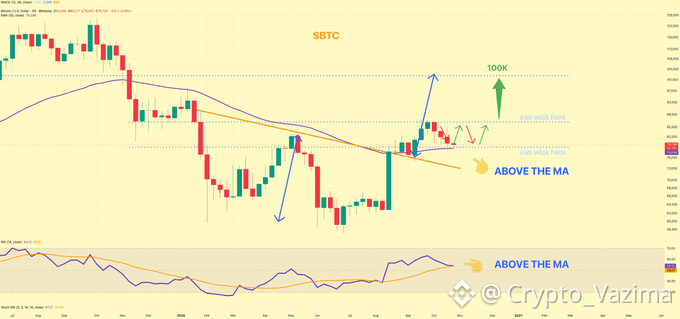
BTC Still Has Eyes on 100K If Buyers Defend This Weekly MA 💪
The short and mid-term BTC plan is not dead yet according to the latest weekly update.
🗣 Original view
Vuori Trading says the plan stays intact as long as price action and RSI hold above the 50 EMA, with 100K still the destination.
🔥 Why this still matters
- Price has bounced and is sitting above the key weekly moving average.
- RSI is also above its MA, matching the author's condition.
- The chart allows for some wick lower before higher prices.
- Loss of the MA would change the short-term picture quickly.
🎯 Our trade idea
- Bias: Long only while the weekly hold continues.
- Trigger: RSI and price both stay above their respective MAs.
- Entry: Pullbacks that find support near the MA zone.
- Target: Continuation toward the marked 100K area.
- Invalidation: Clear weekly break and close below the 50 EMA.
- Management: Tighten if RSI starts rolling over.
Is 100K still realistic from here or has the path changed for you? 👇
Drop the level that would flip your BTC bias.
Not investment advice - research on your own! 🚀
$BTC
{future}(BTCUSDT)
BTC Still Has Eyes on 100K If Buyers Defend This Weekly MA 💪
The short and mid-term BTC plan is not dead yet according to the latest weekly update.
🗣 Original view
Vuori Trading says the plan stays intact as long as price action and RSI hold above the 50 EMA, with 100K still the destination.
🔥 Why this still matters
- Price has bounced and is sitting above the key weekly moving average.
- RSI is also above its MA, matching the author's condition.
- The chart allows for some wick lower before higher prices.
- Loss of the MA would change the short-term picture quickly.
🎯 Our trade idea
- Bias: Long only while the weekly hold continues.
- Trigger: RSI and price both stay above their respective MAs.
- Entry: Pullbacks that find support near the MA zone.
- Target: Continuation toward the marked 100K area.
- Invalidation: Clear weekly break and close below the 50 EMA.
- Management: Tighten if RSI starts rolling over.
Is 100K still realistic from here or has the path changed for you? 👇
Drop the level that would flip your BTC bias.
Not investment advice - research on your own! 🚀
$BTC
The short and mid-term BTC plan is not dead yet according to the latest weekly update.
🗣 Original view
Vuori Trading says the plan stays intact as long as price action and RSI hold above the 50 EMA, with 100K still the destination.
🔥 Why this still matters
- Price has bounced and is sitting above the key weekly moving average.
- RSI is also above its MA, matching the author's condition.
- The chart allows for some wick lower before higher prices.
- Loss of the MA would change the short-term picture quickly.
🎯 Our trade idea
- Bias: Long only while the weekly hold continues.
- Trigger: RSI and price both stay above their respective MAs.
- Entry: Pullbacks that find support near the MA zone.
- Target: Continuation toward the marked 100K area.
- Invalidation: Clear weekly break and close below the 50 EMA.
- Management: Tighten if RSI starts rolling over.
Is 100K still realistic from here or has the path changed for you? 👇
Drop the level that would flip your BTC bias.
Not investment advice - research on your own! 🚀
$BTC
38
·
--
Bullish
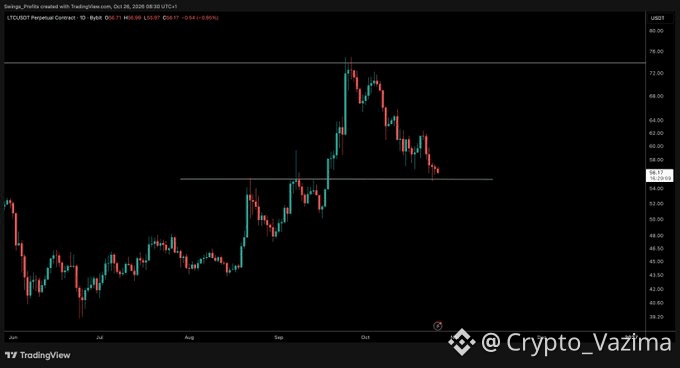
LTC Sits on Support and Traders Still Want Proof
The chart is testing support, but the energy for a long is missing right now. Crypto Tony pointed it out cleanly.
🗣 Original view
Crypto Tony notes LTC is on support yet sees no follow-through for any long potential at the moment.
🔥 Why the setup feels stuck
- Price has been grinding lower for weeks after the October peak.
- The support line is holding for now, but candles stay weak.
- No volume spike or higher low has appeared to flip the short-term momentum.
👀 What would change it
- A strong daily close back above 58.
- Clear rejection of lower prices with buyers stepping in.
- Failure of that would keep sellers in control.
🎯 My conditional idea
- Bias: Wait
- Trigger: confirmed bounce and reclaim of the mid-58s
- Estimated entry: only after that proof, around 57.5-58
- TP1 approx 61, TP2 near 65 if momentum builds
- Invalidation: clean break and close under the support line ~55
- Confidence: uncertain until the chart shows real strength
Is this support enough for you or do you need a clean break higher first? 👇
Tell me the one signal that would make you consider a long here.
Not investment advice - research on your own! 🚀
$LTC
{future}(LTCUSDT)
LTC Sits on Support and Traders Still Want Proof
The chart is testing support, but the energy for a long is missing right now. Crypto Tony pointed it out cleanly.
🗣 Original view
Crypto Tony notes LTC is on support yet sees no follow-through for any long potential at the moment.
🔥 Why the setup feels stuck
- Price has been grinding lower for weeks after the October peak.
- The support line is holding for now, but candles stay weak.
- No volume spike or higher low has appeared to flip the short-term momentum.
👀 What would change it
- A strong daily close back above 58.
- Clear rejection of lower prices with buyers stepping in.
- Failure of that would keep sellers in control.
🎯 My conditional idea
- Bias: Wait
- Trigger: confirmed bounce and reclaim of the mid-58s
- Estimated entry: only after that proof, around 57.5-58
- TP1 approx 61, TP2 near 65 if momentum builds
- Invalidation: clean break and close under the support line ~55
- Confidence: uncertain until the chart shows real strength
Is this support enough for you or do you need a clean break higher first? 👇
Tell me the one signal that would make you consider a long here.
Not investment advice - research on your own! 🚀
$LTC
The chart is testing support, but the energy for a long is missing right now. Crypto Tony pointed it out cleanly.
🗣 Original view
Crypto Tony notes LTC is on support yet sees no follow-through for any long potential at the moment.
🔥 Why the setup feels stuck
- Price has been grinding lower for weeks after the October peak.
- The support line is holding for now, but candles stay weak.
- No volume spike or higher low has appeared to flip the short-term momentum.
👀 What would change it
- A strong daily close back above 58.
- Clear rejection of lower prices with buyers stepping in.
- Failure of that would keep sellers in control.
🎯 My conditional idea
- Bias: Wait
- Trigger: confirmed bounce and reclaim of the mid-58s
- Estimated entry: only after that proof, around 57.5-58
- TP1 approx 61, TP2 near 65 if momentum builds
- Invalidation: clean break and close under the support line ~55
- Confidence: uncertain until the chart shows real strength
Is this support enough for you or do you need a clean break higher first? 👇
Tell me the one signal that would make you consider a long here.
Not investment advice - research on your own! 🚀
$LTC
118
·
--
Bullish
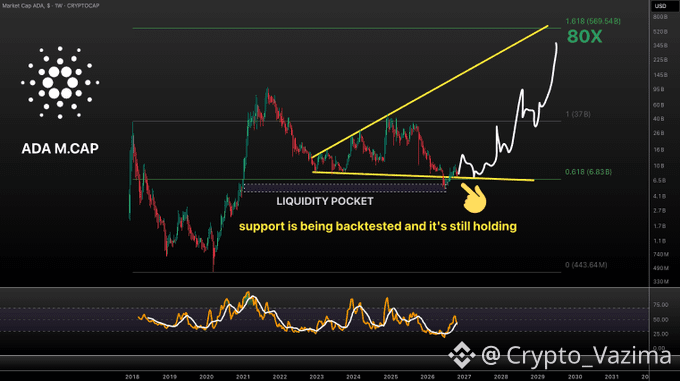
ADA Could Still Be Building Toward That Big Market Cap Move If Support Stays Firm 🔥
This weekly ADA market cap chart from VuoriTrading is keeping the long-term bullish case alive for now.
🗣 Original view
"Still holding the reclaimed support! Nothing bearish here!"
Target remains 569B over a few years.
🚀 Why the structure matters
- Support reclaimed earlier is now being tested again and has not failed yet.
- The rising yellow trendline is acting as the key line in the sand.
- Bottom oscillator is recovering rather than rolling over hard.
🎯 My conditional map
- Bias: Wait-and-see long bias while the reclaim holds.
- Entry idea: Prefer confirmation that the backtest continues to stick.
- Invalidation: Loss of the trendline and the ~6.8B zone flips the short-term picture.
- Exit plan: Reassess hard if weekly closes start failing the support.
The multi-year 569B goal is ambitious and depends entirely on the structure remaining intact.
Are you treating this as a long hold or waiting for more proof? 👇
Tell me what would make the setup invalid for you.
Not investment advice - research on your own! 🚀
$ADA
{future}(ADAUSDT)
ADA Could Still Be Building Toward That Big Market Cap Move If Support Stays Firm 🔥
This weekly ADA market cap chart from VuoriTrading is keeping the long-term bullish case alive for now.
🗣 Original view
"Still holding the reclaimed support! Nothing bearish here!"
Target remains 569B over a few years.
🚀 Why the structure matters
- Support reclaimed earlier is now being tested again and has not failed yet.
- The rising yellow trendline is acting as the key line in the sand.
- Bottom oscillator is recovering rather than rolling over hard.
🎯 My conditional map
- Bias: Wait-and-see long bias while the reclaim holds.
- Entry idea: Prefer confirmation that the backtest continues to stick.
- Invalidation: Loss of the trendline and the ~6.8B zone flips the short-term picture.
- Exit plan: Reassess hard if weekly closes start failing the support.
The multi-year 569B goal is ambitious and depends entirely on the structure remaining intact.
Are you treating this as a long hold or waiting for more proof? 👇
Tell me what would make the setup invalid for you.
Not investment advice - research on your own! 🚀
$ADA
This weekly ADA market cap chart from VuoriTrading is keeping the long-term bullish case alive for now.
🗣 Original view
"Still holding the reclaimed support! Nothing bearish here!"
Target remains 569B over a few years.
🚀 Why the structure matters
- Support reclaimed earlier is now being tested again and has not failed yet.
- The rising yellow trendline is acting as the key line in the sand.
- Bottom oscillator is recovering rather than rolling over hard.
🎯 My conditional map
- Bias: Wait-and-see long bias while the reclaim holds.
- Entry idea: Prefer confirmation that the backtest continues to stick.
- Invalidation: Loss of the trendline and the ~6.8B zone flips the short-term picture.
- Exit plan: Reassess hard if weekly closes start failing the support.
The multi-year 569B goal is ambitious and depends entirely on the structure remaining intact.
Are you treating this as a long hold or waiting for more proof? 👇
Tell me what would make the setup invalid for you.
Not investment advice - research on your own! 🚀
$ADA
237
·
--
Bullish
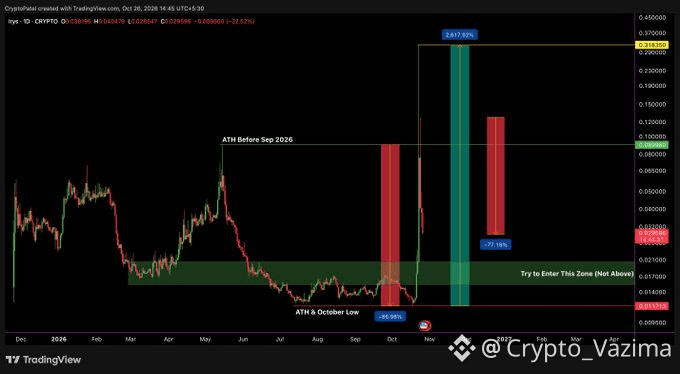
IRYS Just Got Crushed After the Pump – Did You Survive It? 😱
Three days ago IRYS was flying. Now it is down roughly 94% from the peak and the lesson is brutal.
🗣 Original analyst’s view
Crypto Patel says he warned not to chase the vertical pump and to let price come to his $0.015–$0.020 demand zone. He is still not buying the current drop and will wait for confirmation instead of catching the knife.
🔥 Why this move matters
- Extreme pumps often reverse just as hard.
- Current price remains well above the zone he marked on the chart.
- Protecting capital beats trying to catch every bounce.
- The structure still looks like distribution after the spike.
👀 What I am watching
- Whether price can stabilize above 0.025 or keeps sliding.
- Reaction if it finally reaches the 0.015–0.020 band.
- Any volume absorption or higher low once it gets there.
🎯 My plan
- Bias: Wait
- Trigger: Clean rejection or base inside the demand zone
- Estimated entry: 0.015–0.020 only with confirmation
- Stop / invalidation: Below the October low near 0.0117
- No chase above the zone
Did you avoid the IRYS trap or get caught? 👇
Drop the level that would make you interested again.
Not investment advice - research on your own! 🚀
$IRYS
{alpha}(560x91152b4ef635403efbae860edd0f8c321d7c035d)
IRYS Just Got Crushed After the Pump – Did You Survive It? 😱
Three days ago IRYS was flying. Now it is down roughly 94% from the peak and the lesson is brutal.
🗣 Original analyst’s view
Crypto Patel says he warned not to chase the vertical pump and to let price come to his $0.015–$0.020 demand zone. He is still not buying the current drop and will wait for confirmation instead of catching the knife.
🔥 Why this move matters
- Extreme pumps often reverse just as hard.
- Current price remains well above the zone he marked on the chart.
- Protecting capital beats trying to catch every bounce.
- The structure still looks like distribution after the spike.
👀 What I am watching
- Whether price can stabilize above 0.025 or keeps sliding.
- Reaction if it finally reaches the 0.015–0.020 band.
- Any volume absorption or higher low once it gets there.
🎯 My plan
- Bias: Wait
- Trigger: Clean rejection or base inside the demand zone
- Estimated entry: 0.015–0.020 only with confirmation
- Stop / invalidation: Below the October low near 0.0117
- No chase above the zone
Did you avoid the IRYS trap or get caught? 👇
Drop the level that would make you interested again.
Not investment advice - research on your own! 🚀
$IRYS
Three days ago IRYS was flying. Now it is down roughly 94% from the peak and the lesson is brutal.
🗣 Original analyst’s view
Crypto Patel says he warned not to chase the vertical pump and to let price come to his $0.015–$0.020 demand zone. He is still not buying the current drop and will wait for confirmation instead of catching the knife.
🔥 Why this move matters
- Extreme pumps often reverse just as hard.
- Current price remains well above the zone he marked on the chart.
- Protecting capital beats trying to catch every bounce.
- The structure still looks like distribution after the spike.
👀 What I am watching
- Whether price can stabilize above 0.025 or keeps sliding.
- Reaction if it finally reaches the 0.015–0.020 band.
- Any volume absorption or higher low once it gets there.
🎯 My plan
- Bias: Wait
- Trigger: Clean rejection or base inside the demand zone
- Estimated entry: 0.015–0.020 only with confirmation
- Stop / invalidation: Below the October low near 0.0117
- No chase above the zone
Did you avoid the IRYS trap or get caught? 👇
Drop the level that would make you interested again.
Not investment advice - research on your own! 🚀
$IRYS
598
·
--
Bullish
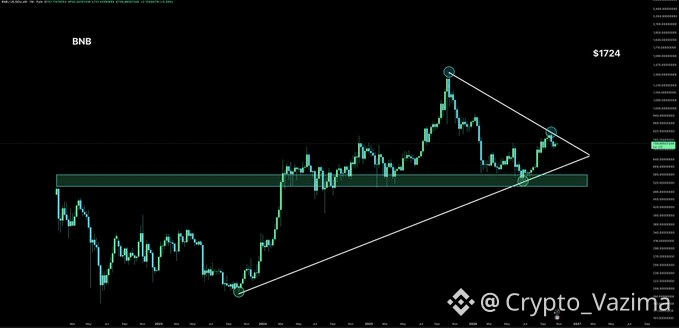
BNB Is Quiet Right Now, But the Chart Says a Huge Run Is Loading
GordonGekko just posted a long-term BNB chart calling for a new all-time high.
🗣 Original view
"It’s only a matter of time before BNB has a huge run and makes a new ATH."
🔥 Why I am watching
- Higher lows from the deep 2023 low are still clean.
- The green support band has acted as a floor multiple times.
- Triangle lines are squeezing price toward the right side.
- Current price near 735 sits well below the old peak.
🚀 Breakout trigger
I like the idea only after price clears the upper white line and holds. No confirmation, no chase. The ecosystem story is strong, but the chart needs to prove the breakout first.
🎯 My trade idea
- Bias: Long on breakout confirmation
- Trigger: Clean close above descending resistance
- Entry: Break or successful retest
- TP1: Next major swing high
- TP2: New highs beyond previous ATH
- Invalidation: Breakdown below the horizontal support zone
- Est. odds of TP1 before SL after trigger: ~55-65% (subjective)
If the triangle fails and support gives way, I step aside.
Would you wait for the break or look for an early entry? 👇
Drop the confirmation you are watching most.
Not investment advice - research on your own! 🚀
$BNB
{future}(BNBUSDT)
BNB Is Quiet Right Now, But the Chart Says a Huge Run Is Loading
GordonGekko just posted a long-term BNB chart calling for a new all-time high.
🗣 Original view
"It’s only a matter of time before BNB has a huge run and makes a new ATH."
🔥 Why I am watching
- Higher lows from the deep 2023 low are still clean.
- The green support band has acted as a floor multiple times.
- Triangle lines are squeezing price toward the right side.
- Current price near 735 sits well below the old peak.
🚀 Breakout trigger
I like the idea only after price clears the upper white line and holds. No confirmation, no chase. The ecosystem story is strong, but the chart needs to prove the breakout first.
🎯 My trade idea
- Bias: Long on breakout confirmation
- Trigger: Clean close above descending resistance
- Entry: Break or successful retest
- TP1: Next major swing high
- TP2: New highs beyond previous ATH
- Invalidation: Breakdown below the horizontal support zone
- Est. odds of TP1 before SL after trigger: ~55-65% (subjective)
If the triangle fails and support gives way, I step aside.
Would you wait for the break or look for an early entry? 👇
Drop the confirmation you are watching most.
Not investment advice - research on your own! 🚀
$BNB
GordonGekko just posted a long-term BNB chart calling for a new all-time high.
🗣 Original view
"It’s only a matter of time before BNB has a huge run and makes a new ATH."
🔥 Why I am watching
- Higher lows from the deep 2023 low are still clean.
- The green support band has acted as a floor multiple times.
- Triangle lines are squeezing price toward the right side.
- Current price near 735 sits well below the old peak.
🚀 Breakout trigger
I like the idea only after price clears the upper white line and holds. No confirmation, no chase. The ecosystem story is strong, but the chart needs to prove the breakout first.
🎯 My trade idea
- Bias: Long on breakout confirmation
- Trigger: Clean close above descending resistance
- Entry: Break or successful retest
- TP1: Next major swing high
- TP2: New highs beyond previous ATH
- Invalidation: Breakdown below the horizontal support zone
- Est. odds of TP1 before SL after trigger: ~55-65% (subjective)
If the triangle fails and support gives way, I step aside.
Would you wait for the break or look for an early entry? 👇
Drop the confirmation you are watching most.
Not investment advice - research on your own! 🚀
$BNB
67
·
--
Bearish
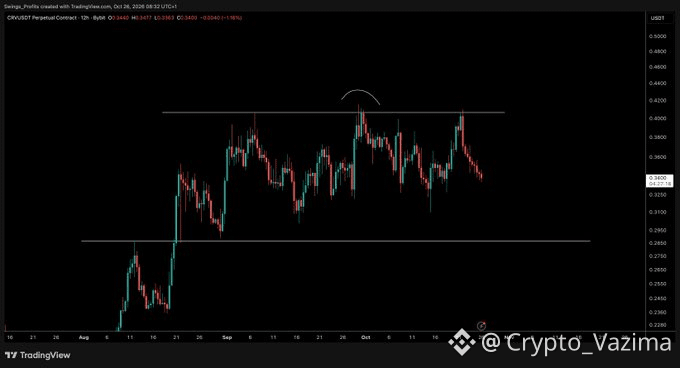
CRV Just Swept the Highs and the Lows Look Next 🔥
Tony is calling the classic range rotation on CRV and the chart is backing the idea for now.
🗣 Original view
"A move to $0.29c is coming IMO. Range play here. Highs swept, now time for the lows."
🔥 Why this stands out
- Highs near 0.41 were taken and price failed to hold.
- The move looks more like a liquidity grab than a real breakout.
- Mid-range price around 0.34 keeps the lower boundary in play.
🚀 What the chart is showing
- Clean horizontal range visible on the 12h.
- Failed upper test increases the odds of a rotation lower.
- Support zone around 0.29 is the logical next magnet if sellers stay in control.
🎯 Our trade idea
- Bias: Short the range
- Trigger: Price stays rejected and loses short-term structure
- Entry zone: approx 0.34-0.35
- Targets: 0.32 then 0.29
- Invalidation: strong reclaim of the 0.41 area
- Estimated odds of reaching the range low first: ~55-60% subjective
Would you fade this range or wait for a cleaner breakdown? 👇
Drop the level that would flip you bullish here.
Not investment advice - research on your own! 🚀
$CRV
{future}(CRVUSDT)
CRV Just Swept the Highs and the Lows Look Next 🔥
Tony is calling the classic range rotation on CRV and the chart is backing the idea for now.
🗣 Original view
"A move to $0.29c is coming IMO. Range play here. Highs swept, now time for the lows."
🔥 Why this stands out
- Highs near 0.41 were taken and price failed to hold.
- The move looks more like a liquidity grab than a real breakout.
- Mid-range price around 0.34 keeps the lower boundary in play.
🚀 What the chart is showing
- Clean horizontal range visible on the 12h.
- Failed upper test increases the odds of a rotation lower.
- Support zone around 0.29 is the logical next magnet if sellers stay in control.
🎯 Our trade idea
- Bias: Short the range
- Trigger: Price stays rejected and loses short-term structure
- Entry zone: approx 0.34-0.35
- Targets: 0.32 then 0.29
- Invalidation: strong reclaim of the 0.41 area
- Estimated odds of reaching the range low first: ~55-60% subjective
Would you fade this range or wait for a cleaner breakdown? 👇
Drop the level that would flip you bullish here.
Not investment advice - research on your own! 🚀
$CRV
Tony is calling the classic range rotation on CRV and the chart is backing the idea for now.
🗣 Original view
"A move to $0.29c is coming IMO. Range play here. Highs swept, now time for the lows."
🔥 Why this stands out
- Highs near 0.41 were taken and price failed to hold.
- The move looks more like a liquidity grab than a real breakout.
- Mid-range price around 0.34 keeps the lower boundary in play.
🚀 What the chart is showing
- Clean horizontal range visible on the 12h.
- Failed upper test increases the odds of a rotation lower.
- Support zone around 0.29 is the logical next magnet if sellers stay in control.
🎯 Our trade idea
- Bias: Short the range
- Trigger: Price stays rejected and loses short-term structure
- Entry zone: approx 0.34-0.35
- Targets: 0.32 then 0.29
- Invalidation: strong reclaim of the 0.41 area
- Estimated odds of reaching the range low first: ~55-60% subjective
Would you fade this range or wait for a cleaner breakdown? 👇
Drop the level that would flip you bullish here.
Not investment advice - research on your own! 🚀
$CRV
186
·
--
Bullish
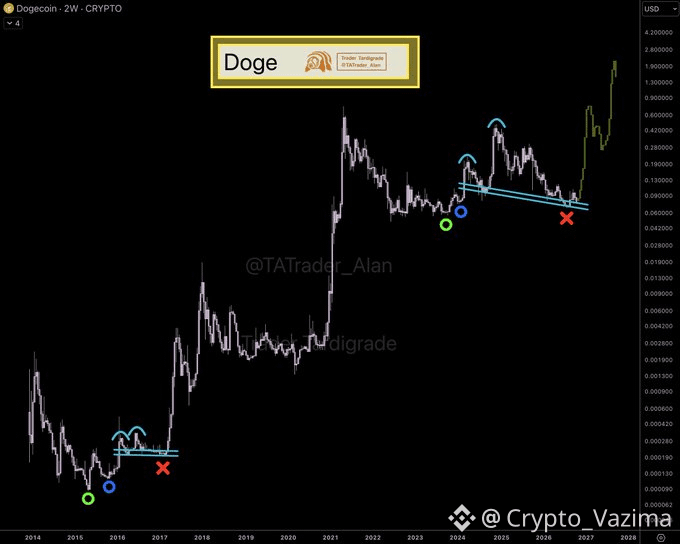
DOGE Is Quiet Now, But This Cycle Pattern Is Loud
The chart is whispering a familiar story while price sits near multi-year lows.
🗣 Original view
Trader Tardigrade says the 3rd cycle is repeating the 1st, with the same sequence of markers and a projected vertical move.
🔥 Why I am watching
- Historical lows lined up with the same colored markers.
- Price is currently pressing the same type of support zone that preceded earlier ramps.
- The projection is aggressive, so proof matters more than hope.
🎯 My conditional plan
- Bias: Long only after hold
- Trigger: Weekly close back above the descending blue line
- Entry: Near 0.072-0.080 zone (estimated)
- TP1: 0.18 area
- TP2: 0.40 zone if momentum builds
- Invalidation: Break and close below 0.055-0.060
- Subjective confidence: moderate until the hold confirms
Would you wait for the reclaim or start scaling earlier? 👇
Drop your cleanest chart read below.
Not investment advice - research on your own! 🚀
$DOGE
{future}(DOGEUSDT)
DOGE Is Quiet Now, But This Cycle Pattern Is Loud
The chart is whispering a familiar story while price sits near multi-year lows.
🗣 Original view
Trader Tardigrade says the 3rd cycle is repeating the 1st, with the same sequence of markers and a projected vertical move.
🔥 Why I am watching
- Historical lows lined up with the same colored markers.
- Price is currently pressing the same type of support zone that preceded earlier ramps.
- The projection is aggressive, so proof matters more than hope.
🎯 My conditional plan
- Bias: Long only after hold
- Trigger: Weekly close back above the descending blue line
- Entry: Near 0.072-0.080 zone (estimated)
- TP1: 0.18 area
- TP2: 0.40 zone if momentum builds
- Invalidation: Break and close below 0.055-0.060
- Subjective confidence: moderate until the hold confirms
Would you wait for the reclaim or start scaling earlier? 👇
Drop your cleanest chart read below.
Not investment advice - research on your own! 🚀
$DOGE
The chart is whispering a familiar story while price sits near multi-year lows.
🗣 Original view
Trader Tardigrade says the 3rd cycle is repeating the 1st, with the same sequence of markers and a projected vertical move.
🔥 Why I am watching
- Historical lows lined up with the same colored markers.
- Price is currently pressing the same type of support zone that preceded earlier ramps.
- The projection is aggressive, so proof matters more than hope.
🎯 My conditional plan
- Bias: Long only after hold
- Trigger: Weekly close back above the descending blue line
- Entry: Near 0.072-0.080 zone (estimated)
- TP1: 0.18 area
- TP2: 0.40 zone if momentum builds
- Invalidation: Break and close below 0.055-0.060
- Subjective confidence: moderate until the hold confirms
Would you wait for the reclaim or start scaling earlier? 👇
Drop your cleanest chart read below.
Not investment advice - research on your own! 🚀
$DOGE
63
·
--
Bullish
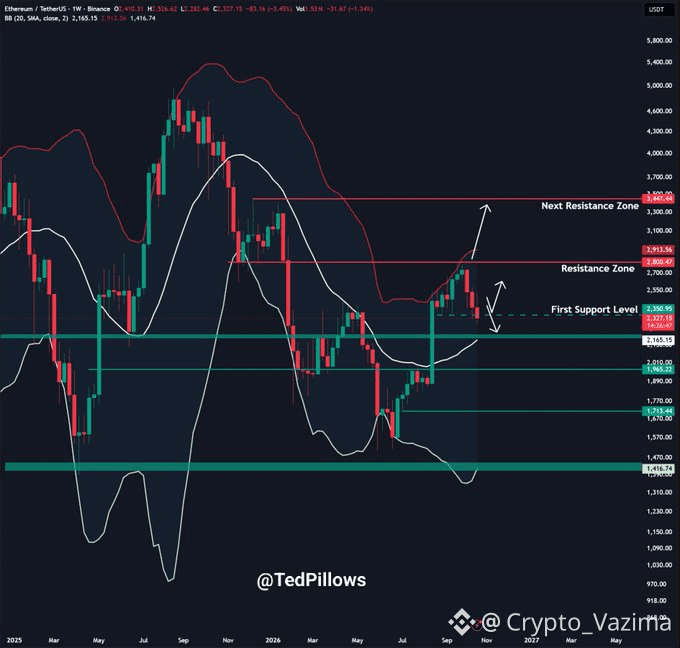
ETH Might Wake Up Hard If Buyers Defend This Lower Zone 🔥
The absence of spot buyers has the chart looking soft, but the demand area below still looks interesting.
🗣 Original analyst's view
Ted argues spot buyers are absent and expects strong demand around 2200 followed by a reversal above 3000.
🔥 Why this matters
- Weekly structure shows price testing the first support band near 2320-2350.
- A dip toward 2165 would line up with the zone Ted highlighted.
- Clearing 2800-2900 is still required before 3000 becomes realistic.
🎯 My trade idea
- Bias: Conditional Long after proof.
- Trigger: Bounce and hold from the 2200 area or a clean reclaim higher.
- Estimated entry: near 2200-2280.
- TP1: 2800.
- TP2: above 3000.
- SL: below 2100.
- Exit plan: scale out into resistance, reassess if volume stays weak.
- Est. odds: moderate lean once confirmation appears (subjective).
How low do you think ETH needs to go before buyers return? 👇
Tell me the risk line that would change your view.
Not investment advice - research on your own! 🚀
$ETH
{future}(ETHUSDT)
ETH Might Wake Up Hard If Buyers Defend This Lower Zone 🔥
The absence of spot buyers has the chart looking soft, but the demand area below still looks interesting.
🗣 Original analyst's view
Ted argues spot buyers are absent and expects strong demand around 2200 followed by a reversal above 3000.
🔥 Why this matters
- Weekly structure shows price testing the first support band near 2320-2350.
- A dip toward 2165 would line up with the zone Ted highlighted.
- Clearing 2800-2900 is still required before 3000 becomes realistic.
🎯 My trade idea
- Bias: Conditional Long after proof.
- Trigger: Bounce and hold from the 2200 area or a clean reclaim higher.
- Estimated entry: near 2200-2280.
- TP1: 2800.
- TP2: above 3000.
- SL: below 2100.
- Exit plan: scale out into resistance, reassess if volume stays weak.
- Est. odds: moderate lean once confirmation appears (subjective).
How low do you think ETH needs to go before buyers return? 👇
Tell me the risk line that would change your view.
Not investment advice - research on your own! 🚀
$ETH
The absence of spot buyers has the chart looking soft, but the demand area below still looks interesting.
🗣 Original analyst's view
Ted argues spot buyers are absent and expects strong demand around 2200 followed by a reversal above 3000.
🔥 Why this matters
- Weekly structure shows price testing the first support band near 2320-2350.
- A dip toward 2165 would line up with the zone Ted highlighted.
- Clearing 2800-2900 is still required before 3000 becomes realistic.
🎯 My trade idea
- Bias: Conditional Long after proof.
- Trigger: Bounce and hold from the 2200 area or a clean reclaim higher.
- Estimated entry: near 2200-2280.
- TP1: 2800.
- TP2: above 3000.
- SL: below 2100.
- Exit plan: scale out into resistance, reassess if volume stays weak.
- Est. odds: moderate lean once confirmation appears (subjective).
How low do you think ETH needs to go before buyers return? 👇
Tell me the risk line that would change your view.
Not investment advice - research on your own! 🚀
$ETH
13
·
--
Bullish
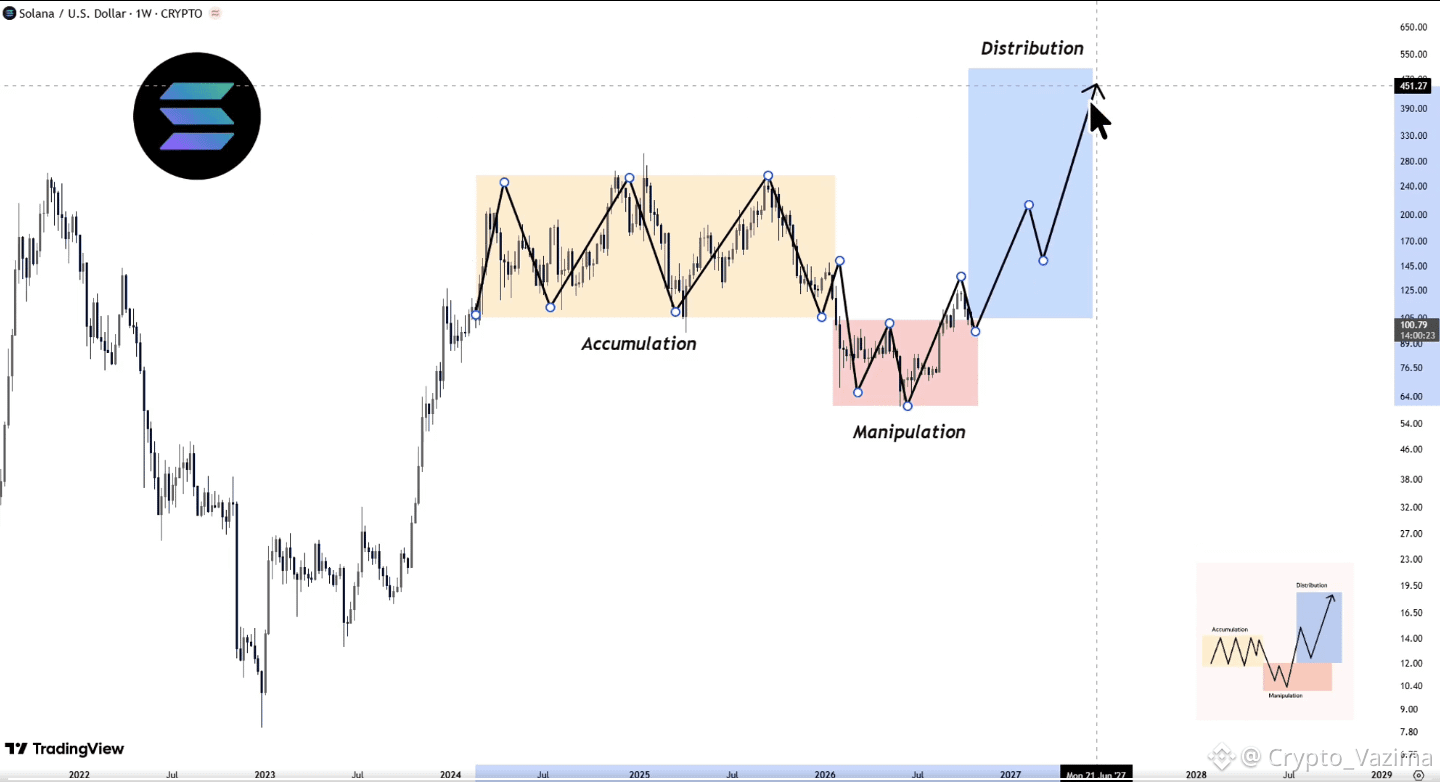
SOL Is Quietly Reclaiming Its Old Floor and the Chart Is Waking Up 🔥
This is the kind of setup that gets interesting when the market stops ignoring it.
🗣 Original analyst's view
CryptoGerla argues SOL is gearing up for a massive run after two years of accumulation, a shakeout to 60, and a reclaim of the old range floor near 100, with a longer-term path toward 500.
🚀 Why this reclaim matters
- Price is back near the level that capped the prior range for a long time.
- The shakeout to 60 flushed weak hands and created the classic spring.
- A successful hold here shifts the structure from defense to potential offense.
- Momentum is still early, so this is not a blind chase.
👀 The part that matters
- The chart needs to prove the reclaim is real.
- A push and hold above recent swing highs would confirm buyers are in control.
- Failure here would keep SOL stuck in the same range.
🎯 Our trade idea
- Bias: Long on confirmation
- Trigger: Hold above 100-105 with rising lows
- Entry zone: ~100-110 if structure stays intact
- Take profit: First partial near 150-180, next near 250
- Stop / invalidation: Below 90-95 or a close back under the floor
- Exit plan: Scale out into strength, tighten if volume fades
- Est. odds for the next leg: ~55-65% (subjective, after confirmation)
I want the market to show me the floor is real before I get interested.
Are you watching the 100 hold or waiting for a stronger break? 👇
Drop your cleanest confirmation signal below.
Not investment advice - research on your own! 🚀
$SOL
{future}(SOLUSDT)
SOL Is Quietly Reclaiming Its Old Floor and the Chart Is Waking Up 🔥
This is the kind of setup that gets interesting when the market stops ignoring it.
🗣 Original analyst's view
CryptoGerla argues SOL is gearing up for a massive run after two years of accumulation, a shakeout to 60, and a reclaim of the old range floor near 100, with a longer-term path toward 500.
🚀 Why this reclaim matters
- Price is back near the level that capped the prior range for a long time.
- The shakeout to 60 flushed weak hands and created the classic spring.
- A successful hold here shifts the structure from defense to potential offense.
- Momentum is still early, so this is not a blind chase.
👀 The part that matters
- The chart needs to prove the reclaim is real.
- A push and hold above recent swing highs would confirm buyers are in control.
- Failure here would keep SOL stuck in the same range.
🎯 Our trade idea
- Bias: Long on confirmation
- Trigger: Hold above 100-105 with rising lows
- Entry zone: ~100-110 if structure stays intact
- Take profit: First partial near 150-180, next near 250
- Stop / invalidation: Below 90-95 or a close back under the floor
- Exit plan: Scale out into strength, tighten if volume fades
- Est. odds for the next leg: ~55-65% (subjective, after confirmation)
I want the market to show me the floor is real before I get interested.
Are you watching the 100 hold or waiting for a stronger break? 👇
Drop your cleanest confirmation signal below.
Not investment advice - research on your own! 🚀
$SOL
This is the kind of setup that gets interesting when the market stops ignoring it.
🗣 Original analyst's view
CryptoGerla argues SOL is gearing up for a massive run after two years of accumulation, a shakeout to 60, and a reclaim of the old range floor near 100, with a longer-term path toward 500.
🚀 Why this reclaim matters
- Price is back near the level that capped the prior range for a long time.
- The shakeout to 60 flushed weak hands and created the classic spring.
- A successful hold here shifts the structure from defense to potential offense.
- Momentum is still early, so this is not a blind chase.
👀 The part that matters
- The chart needs to prove the reclaim is real.
- A push and hold above recent swing highs would confirm buyers are in control.
- Failure here would keep SOL stuck in the same range.
🎯 Our trade idea
- Bias: Long on confirmation
- Trigger: Hold above 100-105 with rising lows
- Entry zone: ~100-110 if structure stays intact
- Take profit: First partial near 150-180, next near 250
- Stop / invalidation: Below 90-95 or a close back under the floor
- Exit plan: Scale out into strength, tighten if volume fades
- Est. odds for the next leg: ~55-65% (subjective, after confirmation)
I want the market to show me the floor is real before I get interested.
Are you watching the 100 hold or waiting for a stronger break? 👇
Drop your cleanest confirmation signal below.
Not investment advice - research on your own! 🚀
$SOL
70
·
--
Bullish
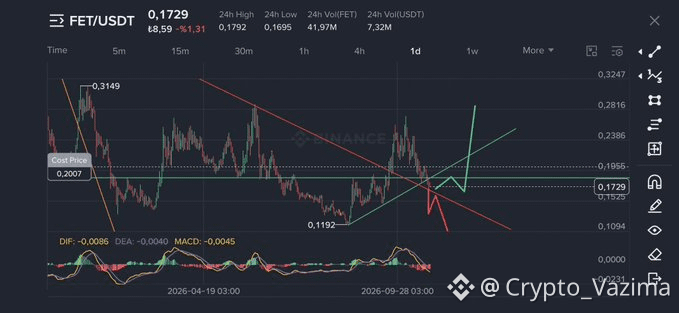
FET Eyes Are on 0.28 or 0.11 - The Chart Is Quiet 🔥
One post just put the big question out there: is FET about to push higher or slide lower from this 0.17 area?
🗣 What the analyst said
NedimKayaX shared the FET chart and asked which way is calling: 0.28 or 0.11.
🔥 Why I am watching
- Price is sitting right under a descending red trendline.
- Green support lines are still holding the recent bounce.
- MACD is below zero and has not crossed higher yet.
🚀 Breakout trigger
- I want a clear close above the descending line before thinking upside.
- Or a clean break under the recent base if the downside is next.
- No strong volume expansion so far.
🎯 My trade idea
- Bias: Wait for direction
- Trigger: break and hold of ~0.195 or loss of ~0.152
- Estimated entry: retest of the broken level
- TP1: ~0.23 upside or ~0.12 downside (chart estimates)
- SL: opposite side of the break
- Odds: too early for a number
Which way are you calling it? 👇
Share your cleanest confirmation signal.
Not investment advice - research on your own! 🚀
$FET
{future}(FETUSDT)
FET Eyes Are on 0.28 or 0.11 - The Chart Is Quiet 🔥
One post just put the big question out there: is FET about to push higher or slide lower from this 0.17 area?
🗣 What the analyst said
NedimKayaX shared the FET chart and asked which way is calling: 0.28 or 0.11.
🔥 Why I am watching
- Price is sitting right under a descending red trendline.
- Green support lines are still holding the recent bounce.
- MACD is below zero and has not crossed higher yet.
🚀 Breakout trigger
- I want a clear close above the descending line before thinking upside.
- Or a clean break under the recent base if the downside is next.
- No strong volume expansion so far.
🎯 My trade idea
- Bias: Wait for direction
- Trigger: break and hold of ~0.195 or loss of ~0.152
- Estimated entry: retest of the broken level
- TP1: ~0.23 upside or ~0.12 downside (chart estimates)
- SL: opposite side of the break
- Odds: too early for a number
Which way are you calling it? 👇
Share your cleanest confirmation signal.
Not investment advice - research on your own! 🚀
$FET
One post just put the big question out there: is FET about to push higher or slide lower from this 0.17 area?
🗣 What the analyst said
NedimKayaX shared the FET chart and asked which way is calling: 0.28 or 0.11.
🔥 Why I am watching
- Price is sitting right under a descending red trendline.
- Green support lines are still holding the recent bounce.
- MACD is below zero and has not crossed higher yet.
🚀 Breakout trigger
- I want a clear close above the descending line before thinking upside.
- Or a clean break under the recent base if the downside is next.
- No strong volume expansion so far.
🎯 My trade idea
- Bias: Wait for direction
- Trigger: break and hold of ~0.195 or loss of ~0.152
- Estimated entry: retest of the broken level
- TP1: ~0.23 upside or ~0.12 downside (chart estimates)
- SL: opposite side of the break
- Odds: too early for a number
Which way are you calling it? 👇
Share your cleanest confirmation signal.
Not investment advice - research on your own! 🚀
$FET
232
·
--
Bearish
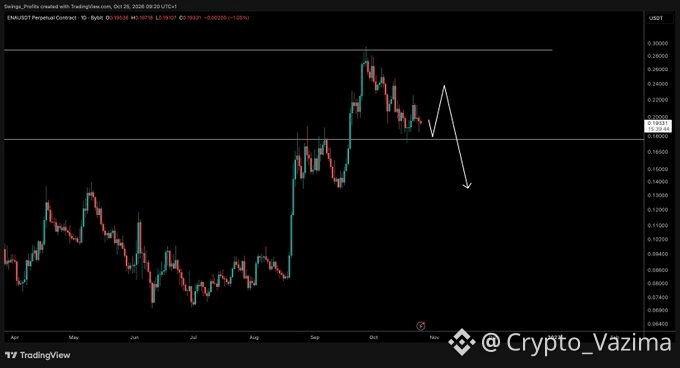
ENA Could Chill in a Range Before the Lows Get Hit 🔥
Tony is not chasing the bounce. He wants ENA to settle into a range first, then look for a sweep of the lows. That keeps the short-term bias cautious.
🗣 Original analyst view
CryptoTony is watching for a range to form before any sweep of the lows. No exact targets given, just the sequence.
🚀 Why the range matters
After the rejection from the 0.30 area, price has been grinding lower and is now sitting near 0.193. A tight range would let sellers reload and set up a cleaner liquidity grab below recent lows.
- Current structure looks more like digestion than reversal.
- Holding the old breakout line is the only bullish note so far.
- A failed range high would confirm the next leg lower.
🎯 My trade idea
- Bias: Short only after range failure or low sweep.
- Trigger: Range high rejection or decisive break under recent lows with no reclaim.
- Entry zone: After the sweep, or on a retest of the range low.
- TP1: ~0.17.
- TP2: Toward the drawn 0.14 zone.
- Invalidation: Strong daily close above 0.22.
- Odds: Subjective ~55% chance of TP1 before SL once the range confirms and fails.
No rush. The range is the setup. The sweep is the trigger.
Where would you place the range high before getting interested? 👇
Drop the exact level that would make you short this.
Not investment advice - research on your own! 🚀
$ENA
{future}(ENAUSDT)
ENA Could Chill in a Range Before the Lows Get Hit 🔥
Tony is not chasing the bounce. He wants ENA to settle into a range first, then look for a sweep of the lows. That keeps the short-term bias cautious.
🗣 Original analyst view
CryptoTony is watching for a range to form before any sweep of the lows. No exact targets given, just the sequence.
🚀 Why the range matters
After the rejection from the 0.30 area, price has been grinding lower and is now sitting near 0.193. A tight range would let sellers reload and set up a cleaner liquidity grab below recent lows.
- Current structure looks more like digestion than reversal.
- Holding the old breakout line is the only bullish note so far.
- A failed range high would confirm the next leg lower.
🎯 My trade idea
- Bias: Short only after range failure or low sweep.
- Trigger: Range high rejection or decisive break under recent lows with no reclaim.
- Entry zone: After the sweep, or on a retest of the range low.
- TP1: ~0.17.
- TP2: Toward the drawn 0.14 zone.
- Invalidation: Strong daily close above 0.22.
- Odds: Subjective ~55% chance of TP1 before SL once the range confirms and fails.
No rush. The range is the setup. The sweep is the trigger.
Where would you place the range high before getting interested? 👇
Drop the exact level that would make you short this.
Not investment advice - research on your own! 🚀
$ENA
Tony is not chasing the bounce. He wants ENA to settle into a range first, then look for a sweep of the lows. That keeps the short-term bias cautious.
🗣 Original analyst view
CryptoTony is watching for a range to form before any sweep of the lows. No exact targets given, just the sequence.
🚀 Why the range matters
After the rejection from the 0.30 area, price has been grinding lower and is now sitting near 0.193. A tight range would let sellers reload and set up a cleaner liquidity grab below recent lows.
- Current structure looks more like digestion than reversal.
- Holding the old breakout line is the only bullish note so far.
- A failed range high would confirm the next leg lower.
🎯 My trade idea
- Bias: Short only after range failure or low sweep.
- Trigger: Range high rejection or decisive break under recent lows with no reclaim.
- Entry zone: After the sweep, or on a retest of the range low.
- TP1: ~0.17.
- TP2: Toward the drawn 0.14 zone.
- Invalidation: Strong daily close above 0.22.
- Odds: Subjective ~55% chance of TP1 before SL once the range confirms and fails.
No rush. The range is the setup. The sweep is the trigger.
Where would you place the range high before getting interested? 👇
Drop the exact level that would make you short this.
Not investment advice - research on your own! 🚀
$ENA
169
Log in to explore more content
Join global crypto users on Binance Square
⚡️ Get latest and useful information about crypto.
💬 Trusted by the world’s largest crypto exchange.
👍 Discover real insights from verified creators.
Email / Phone number
Trending Topics
HotCPIDecemberHikePriced
90,035 views
1,071 Discussing
CPI Market Watch | US CPI Rises 0.4% in October, Hotter Than 0.3% Forecast
Binance News
·27 Likes
·41.4k views
TrumpMediaAdds1510BTCInQ3
1,772 views
66 Discussing
AnthropicRejectsIPODelayValuationinQuestion
215,734 views
1,811 Discussing