
CRYPTO LIFE MNE
7.4k Posts

CRYPTO LIFE MNE
Report
Block User
Trading Crypto Since 2021 🚀 Believer in Web3 and Market Trends 📊 Sharing My Thoughts and Analysis on Square 💛
High-Frequency Trader
4.2 Years
73 Following
10.0K+ Followers
16.5K+ Liked
Posts
All
Quotes
Videos
PINNED
🚀 We Are BACK! Let’s Get Back to the Charts 📈
Hey everyone! 👋....
I know I’ve been offline since June 4th. I was away handling some important personal documentation work (CNIC updates & verification process), which took longer than expected.
Thank you to everyone who checked in and stayed patient. 🙏
What’s Next?
Daily Market Updates: Regular $BTC & Altcoin analysis is back soon!
Key Levels & Setups: High-value chart breakdowns key support/resistance zones and market trends.
The market has shifted a lot over the last two months, but we are back to navigate it together.
Drop a comment below: What token are you trading today??..
🚀 We Are BACK! Let’s Get Back to the Charts 📈
Hey everyone! 👋....
I know I’ve been offline since June 4th. I was away handling some important personal documentation work (CNIC updates & verification process), which took longer than expected.
Thank you to everyone who checked in and stayed patient. 🙏
What’s Next?
Daily Market Updates: Regular $BTC & Altcoin analysis is back soon!
Key Levels & Setups: High-value chart breakdowns key support/resistance zones and market trends.
The market has shifted a lot over the last two months, but we are back to navigate it together.
Drop a comment below: What token are you trading today??..
Hey everyone! 👋....
I know I’ve been offline since June 4th. I was away handling some important personal documentation work (CNIC updates & verification process), which took longer than expected.
Thank you to everyone who checked in and stayed patient. 🙏
What’s Next?
Daily Market Updates: Regular $BTC & Altcoin analysis is back soon!
Key Levels & Setups: High-value chart breakdowns key support/resistance zones and market trends.
The market has shifted a lot over the last two months, but we are back to navigate it together.
Drop a comment below: What token are you trading today??..
2
2
219
PINNED
Many people are struggling and asking, "How can we control these emotions?"
Does this happen to you too? You feel afraid before taking a trade, even when your analysis is solid and the setup looks strong. You end up walking away out of fear, only to watch the market move exactly according to your plan.
Other times, when you finally take the trade and it goes into a loss, you freeze. You stay in the trade, hoping it will return to your entry point, but instead, you end up facing a massive loss.
This fear eventually leads many people to quit trading altogether—that is the harsh reality.
How to Survive?
The key is to trade emotionlessly. You must have everything planned before you enter
:
Know exactly where your entry is.
Know exactly where your exit is.
Understand that if the price drops below a certain point, your setup is invalidated, and you must close the trade immediately.
In trading, you aren't just battling a massive market; you are battling yourself. To be a successful trader, you have to win that internal conflict.
One more thing: Never give up. It is better to try and stumble than to do nothing at all. And never pay those "experts" or join paid groups—they are all useless!!
Many people are struggling and asking, "How can we control these emotions?"
Does this happen to you too? You feel afraid before taking a trade, even when your analysis is solid and the setup looks strong. You end up walking away out of fear, only to watch the market move exactly according to your plan.
Other times, when you finally take the trade and it goes into a loss, you freeze. You stay in the trade, hoping it will return to your entry point, but instead, you end up facing a massive loss.
This fear eventually leads many people to quit trading altogether—that is the harsh reality.
How to Survive?
The key is to trade emotionlessly. You must have everything planned before you enter
:
Know exactly where your entry is.
Know exactly where your exit is.
Understand that if the price drops below a certain point, your setup is invalidated, and you must close the trade immediately.
In trading, you aren't just battling a massive market; you are battling yourself. To be a successful trader, you have to win that internal conflict.
One more thing: Never give up. It is better to try and stumble than to do nothing at all. And never pay those "experts" or join paid groups—they are all useless!!
Does this happen to you too? You feel afraid before taking a trade, even when your analysis is solid and the setup looks strong. You end up walking away out of fear, only to watch the market move exactly according to your plan.
Other times, when you finally take the trade and it goes into a loss, you freeze. You stay in the trade, hoping it will return to your entry point, but instead, you end up facing a massive loss.
This fear eventually leads many people to quit trading altogether—that is the harsh reality.
How to Survive?
The key is to trade emotionlessly. You must have everything planned before you enter
:
Know exactly where your entry is.
Know exactly where your exit is.
Understand that if the price drops below a certain point, your setup is invalidated, and you must close the trade immediately.
In trading, you aren't just battling a massive market; you are battling yourself. To be a successful trader, you have to win that internal conflict.
One more thing: Never give up. It is better to try and stumble than to do nothing at all. And never pay those "experts" or join paid groups—they are all useless!!

2
484
·
--
Bullish
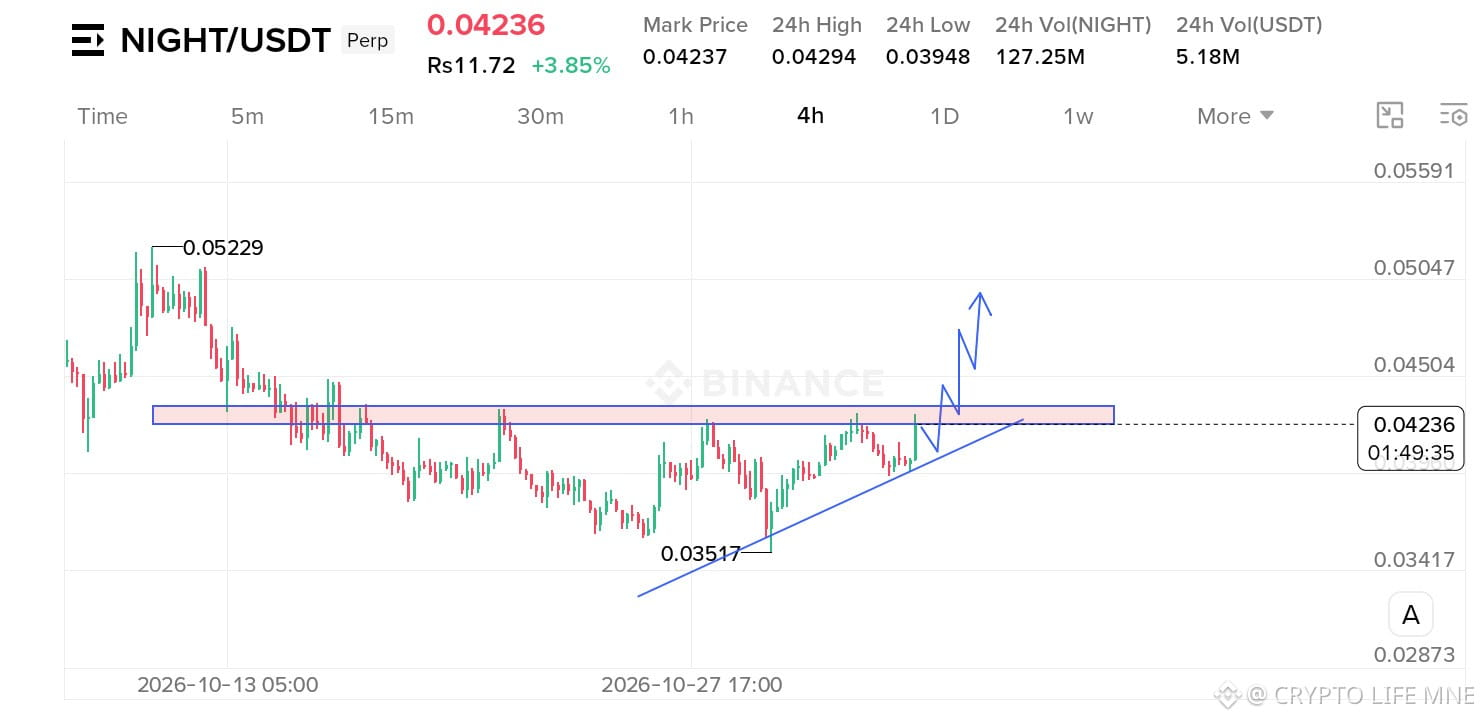
$NIGHT /USDT is bouncing from the ascending triangle pattern's support level. 📈
A successful breakout and hold above the horizontal resistance will trigger a rally toward the upper resistance levels of $0.047 to $0.049. 🎯
Keep an eye on this one—it needs a breakout and hold above $0.0430.
$NIGHT
{future}(NIGHTUSDT)
#night
$NIGHT /USDT is bouncing from the ascending triangle pattern's support level. 📈
A successful breakout and hold above the horizontal resistance will trigger a rally toward the upper resistance levels of $0.047 to $0.049. 🎯
Keep an eye on this one—it needs a breakout and hold above $0.0430.
$NIGHT
#night
A successful breakout and hold above the horizontal resistance will trigger a rally toward the upper resistance levels of $0.047 to $0.049. 🎯
Keep an eye on this one—it needs a breakout and hold above $0.0430.
$NIGHT
#night
1
573
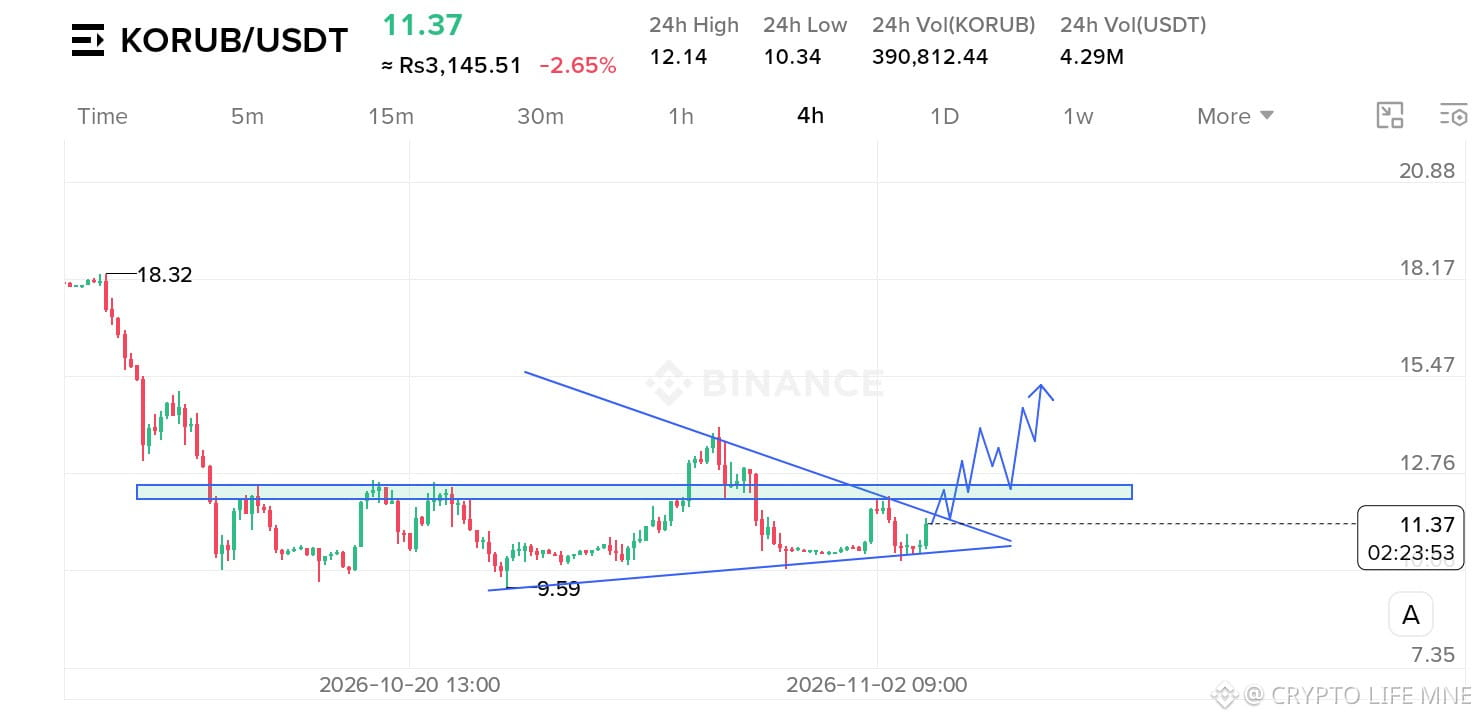
$KORUB /USDT Bouncing From Symmetrical Triangle Patten's Support Level 📈.
Wait for a clear breakout of this pattern. A successful breakout or hold above $12.00 will confirm the momentum shift.
Keep an aye on this one 👍🏻
$KORUB
$KORUB /USDT Bouncing From Symmetrical Triangle Patten's Support Level 📈.
Wait for a clear breakout of this pattern. A successful breakout or hold above $12.00 will confirm the momentum shift.
Keep an aye on this one 👍🏻
$KORUB
Wait for a clear breakout of this pattern. A successful breakout or hold above $12.00 will confirm the momentum shift.
Keep an aye on this one 👍🏻
$KORUB
3
606
$LAB /USDT Failure To Hold Above Key Level 📈.
Small SL Hit 🎯 And We Are Safely Out! Will Recover Soon No Need To Go For Revenge Trading.
$LAB /USDT Failure To Hold Above Key Level 📈.
Small SL Hit 🎯 And We Are Safely Out! Will Recover Soon No Need To Go For Revenge Trading.
Small SL Hit 🎯 And We Are Safely Out! Will Recover Soon No Need To Go For Revenge Trading.
CRYPTO LIFE MNE
·
--
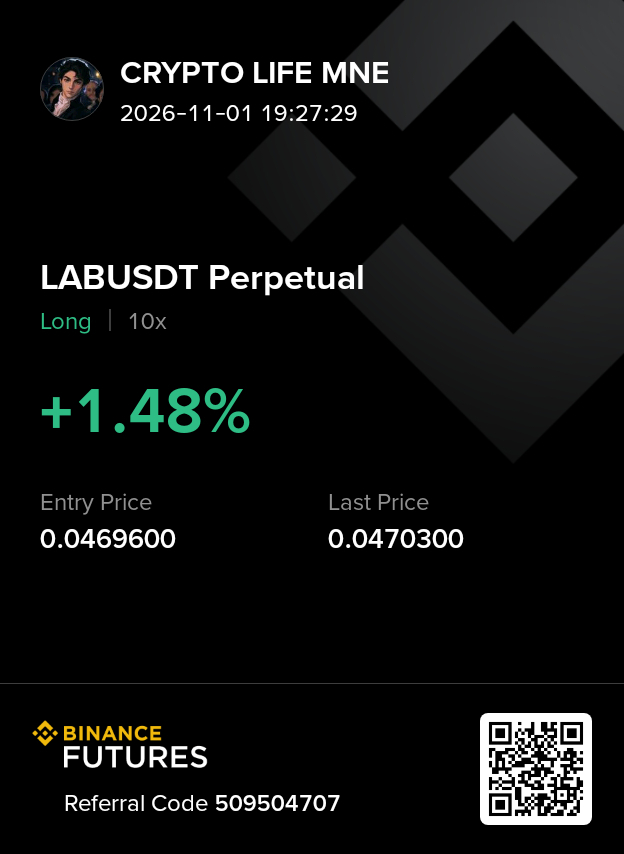
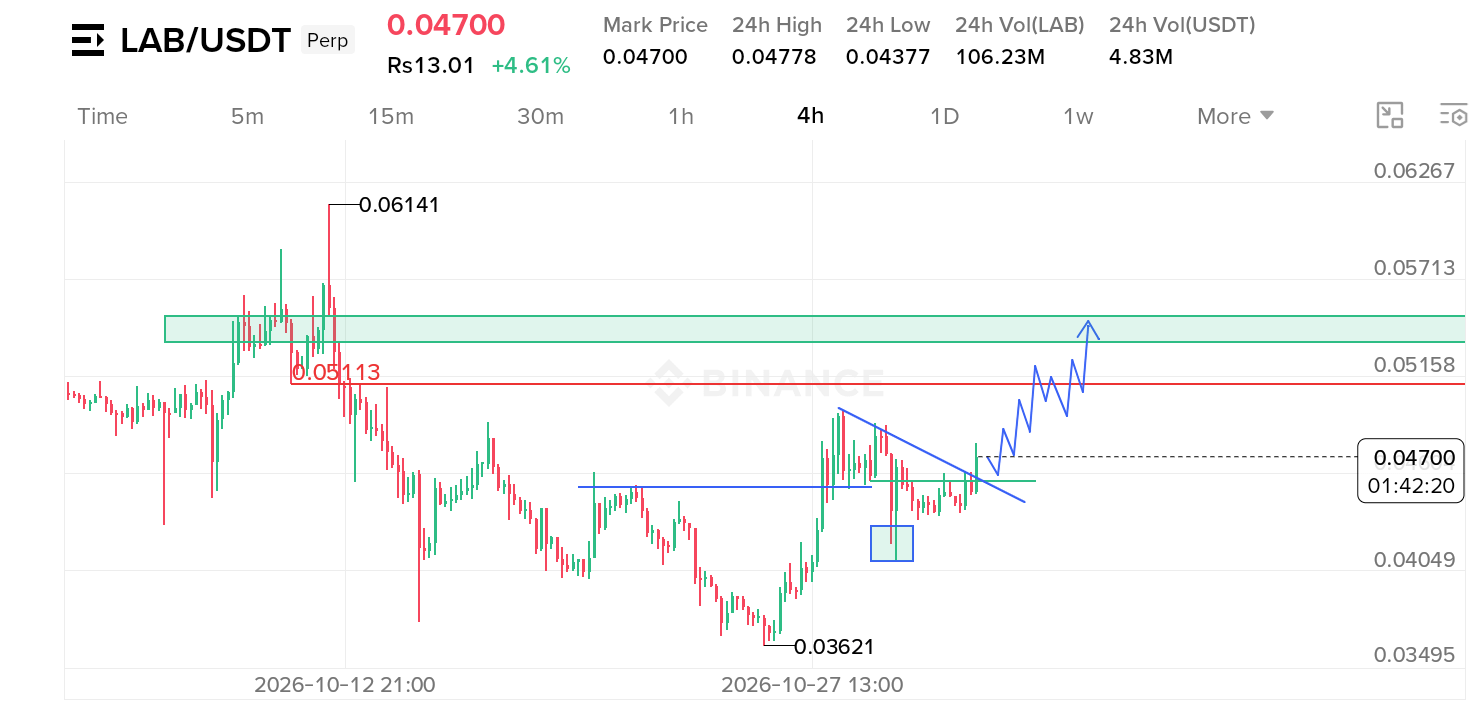
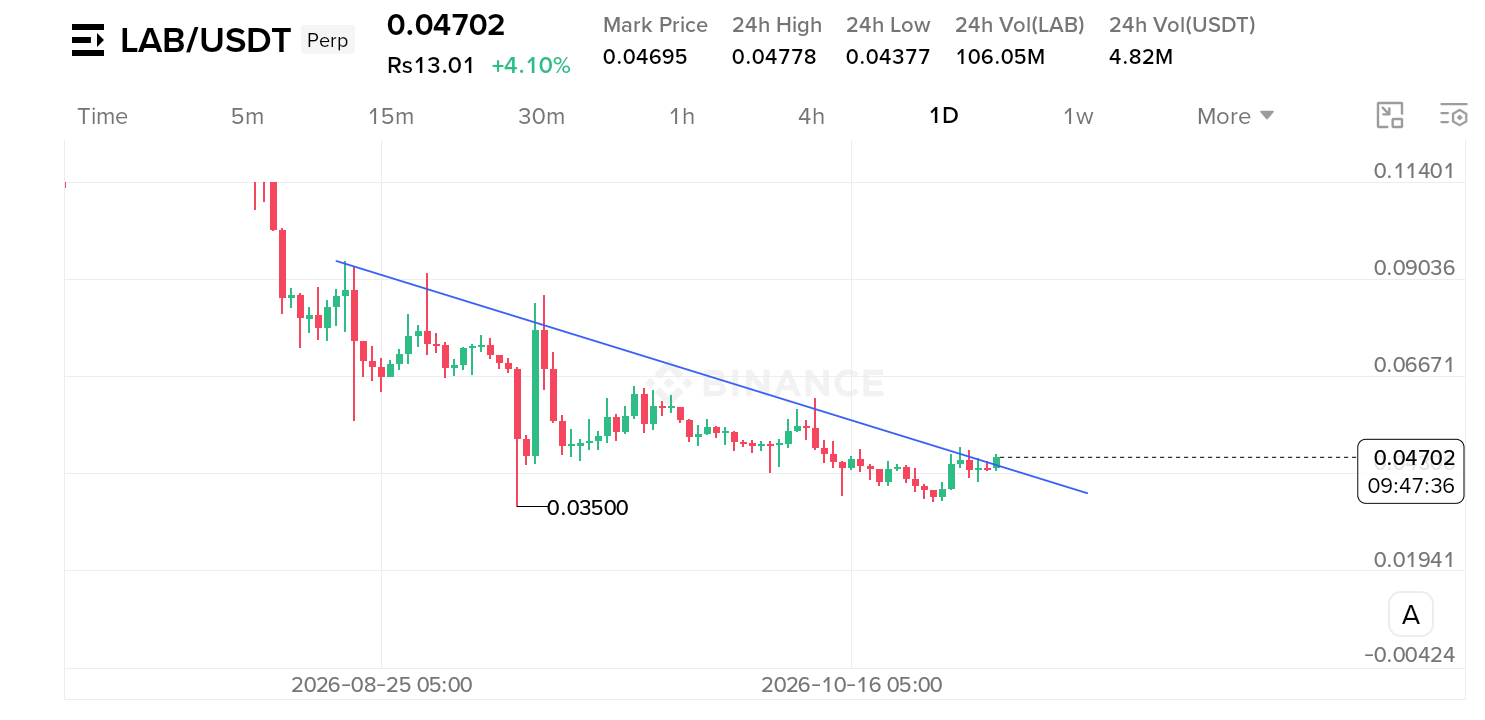
Bullish10X Long On $LAB / USDT Looking For A Breakout 📈
The chart is looking solid! The coin is breaking out above daily trendline resistance, though full confirmation will come after the daily candle close.
The overall structure looks very bullish: we saw a trend flip on the 4-hour chart, where price broke the previous swing high and formed a higher low—opening the door for a clean buy-side setup.
Entry Zone: $0.04580 – $0.04710
Targets (TP) 🎯: $0.04830 | $0.05100 | $0.05310 | $0.05500
Stop-Loss (SL): 4-hour candle close below $0.04500
The setup looks great—stick to the plan and remain patient!
NFA. DYOR.
$LAB
#Labs #TradeNTell
The chart is looking solid! The coin is breaking out above daily trendline resistance, though full confirmation will come after the daily candle close.
The overall structure looks very bullish: we saw a trend flip on the 4-hour chart, where price broke the previous swing high and formed a higher low—opening the door for a clean buy-side setup.
Entry Zone: $0.04580 – $0.04710
Targets (TP) 🎯: $0.04830 | $0.05100 | $0.05310 | $0.05500
Stop-Loss (SL): 4-hour candle close below $0.04500
The setup looks great—stick to the plan and remain patient!
NFA. DYOR.
$LAB
#Labs #TradeNTell
1
735
·
--
Bullish
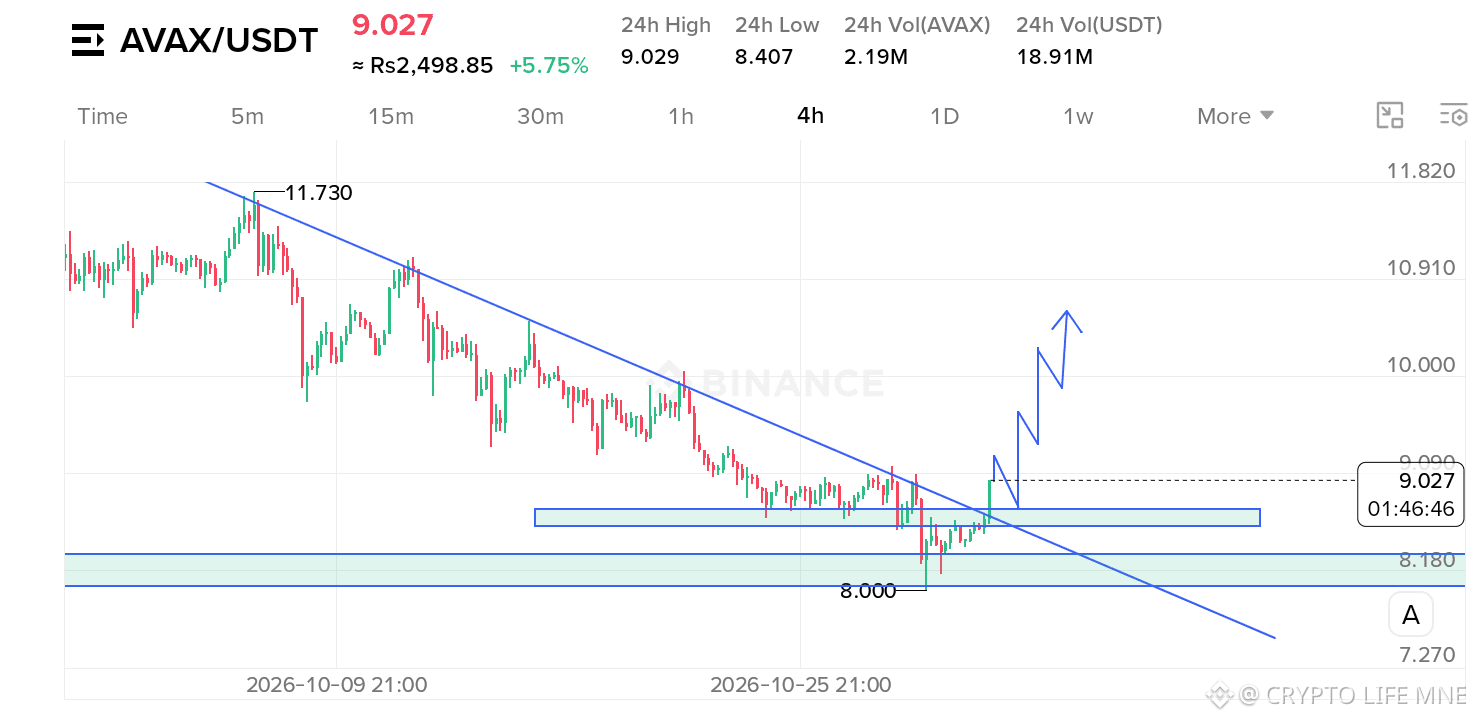
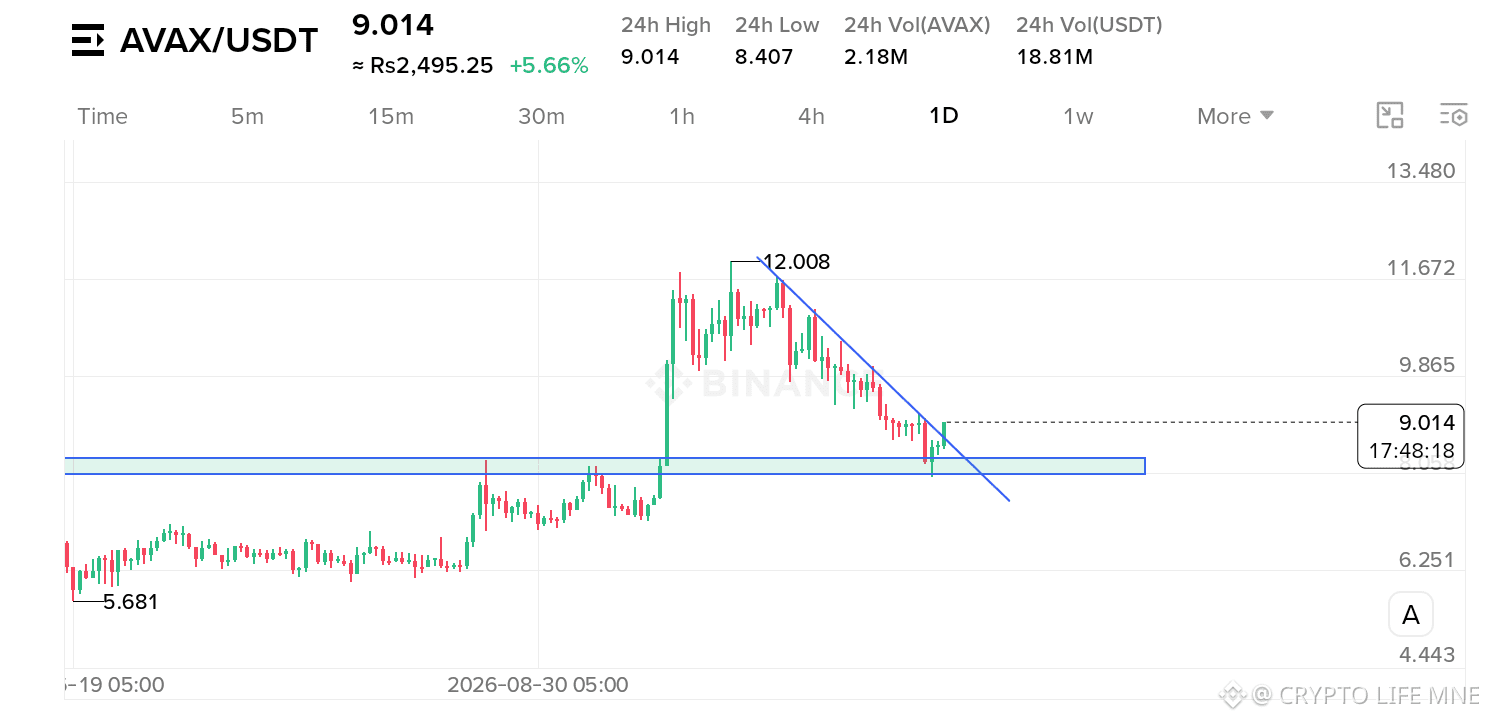
$AVAX /USDT Breaking Out Above Trendline Resistance 📈
Buying and holding $AVAX for a few days—it has just shown a strong reaction from the daily key support zone.
It has also broken out above the trendline resistance with a strong momentum candle, which is a bullish sign 📈.
Potential Next Targets 🎯
$9.60
$9.80
$10.40
$11.00
These are the next upside levels I'm watching over the coming days.
$AVAX
{future}(AVAXUSDT)
#AVAX #Breakout
$AVAX /USDT Breaking Out Above Trendline Resistance 📈
Buying and holding $AVAX for a few days—it has just shown a strong reaction from the daily key support zone.
It has also broken out above the trendline resistance with a strong momentum candle, which is a bullish sign 📈.
Potential Next Targets 🎯
$9.60
$9.80
$10.40
$11.00
These are the next upside levels I'm watching over the coming days.
$AVAX
#AVAX #Breakout
Buying and holding $AVAX for a few days—it has just shown a strong reaction from the daily key support zone.
It has also broken out above the trendline resistance with a strong momentum candle, which is a bullish sign 📈.
Potential Next Targets 🎯
$9.60
$9.80
$10.40
$11.00
These are the next upside levels I'm watching over the coming days.
$AVAX
#AVAX #Breakout
1
589
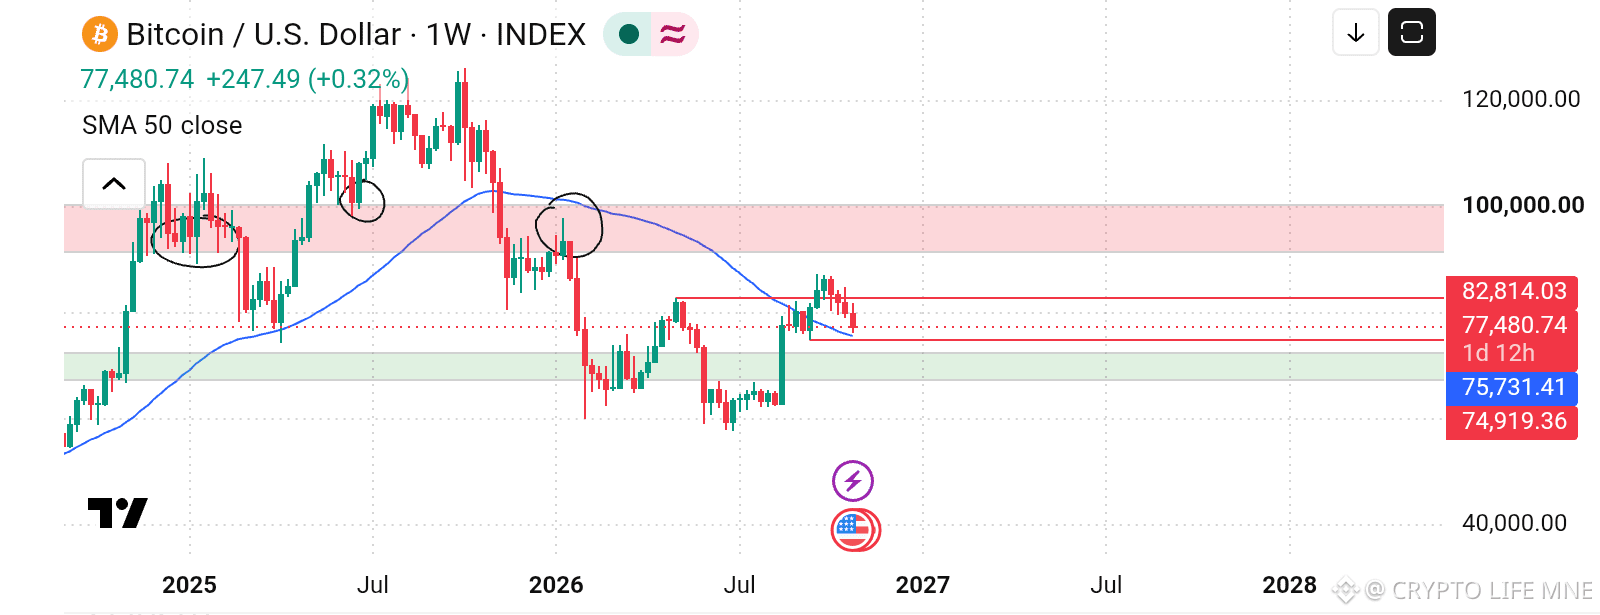
The next few weeks are very important for Bitcoin $BTC as it is about to decide its next move...
Currently, it is holding just above the 50 SMA. The $76k to $75k range serves as a strong support level, as it combines with a 50 SMA retest.
There are two possible ways to find a good buy entry:
Plan A: Successful SMA 50 Retest
The price holds above $75k. Wicks below this level are acceptable for liquidity grabs, but a daily or weekly close must remain above it. A bullish green reaction on the daily or weekly chart will provide a strong buy-side trade setup.
Plan B: Lower Liquidity Sweep and Demand Zone Test
If we get a weekly close below the 50 SMA and under $75k, the price is likely to take lower liquidity and test the marked green demand zone.
This green zone, ranging from $72k to $67k, is a key demand area. It features a Fibonacci Golden Pocket as well as an inverted Fair Value Gap (IFVG) in the exact same region.
Summary
First Plan: Watch for a hold or bullish reaction above $75k.
Second Plan: If that level fails to hold, look for a dip entry between $72k and $67k.
Wait and watch the charts; confirmation should arrive soon....
$BTC
{future}(BTCUSDT)
The next few weeks are very important for Bitcoin $BTC as it is about to decide its next move...
Currently, it is holding just above the 50 SMA. The $76k to $75k range serves as a strong support level, as it combines with a 50 SMA retest.
There are two possible ways to find a good buy entry:
Plan A: Successful SMA 50 Retest
The price holds above $75k. Wicks below this level are acceptable for liquidity grabs, but a daily or weekly close must remain above it. A bullish green reaction on the daily or weekly chart will provide a strong buy-side trade setup.
Plan B: Lower Liquidity Sweep and Demand Zone Test
If we get a weekly close below the 50 SMA and under $75k, the price is likely to take lower liquidity and test the marked green demand zone.
This green zone, ranging from $72k to $67k, is a key demand area. It features a Fibonacci Golden Pocket as well as an inverted Fair Value Gap (IFVG) in the exact same region.
Summary
First Plan: Watch for a hold or bullish reaction above $75k.
Second Plan: If that level fails to hold, look for a dip entry between $72k and $67k.
Wait and watch the charts; confirmation should arrive soon....
$BTC
Currently, it is holding just above the 50 SMA. The $76k to $75k range serves as a strong support level, as it combines with a 50 SMA retest.
There are two possible ways to find a good buy entry:
Plan A: Successful SMA 50 Retest
The price holds above $75k. Wicks below this level are acceptable for liquidity grabs, but a daily or weekly close must remain above it. A bullish green reaction on the daily or weekly chart will provide a strong buy-side trade setup.
Plan B: Lower Liquidity Sweep and Demand Zone Test
If we get a weekly close below the 50 SMA and under $75k, the price is likely to take lower liquidity and test the marked green demand zone.
This green zone, ranging from $72k to $67k, is a key demand area. It features a Fibonacci Golden Pocket as well as an inverted Fair Value Gap (IFVG) in the exact same region.
Summary
First Plan: Watch for a hold or bullish reaction above $75k.
Second Plan: If that level fails to hold, look for a dip entry between $72k and $67k.
Wait and watch the charts; confirmation should arrive soon....
$BTC
1
572
·
--
Bullish
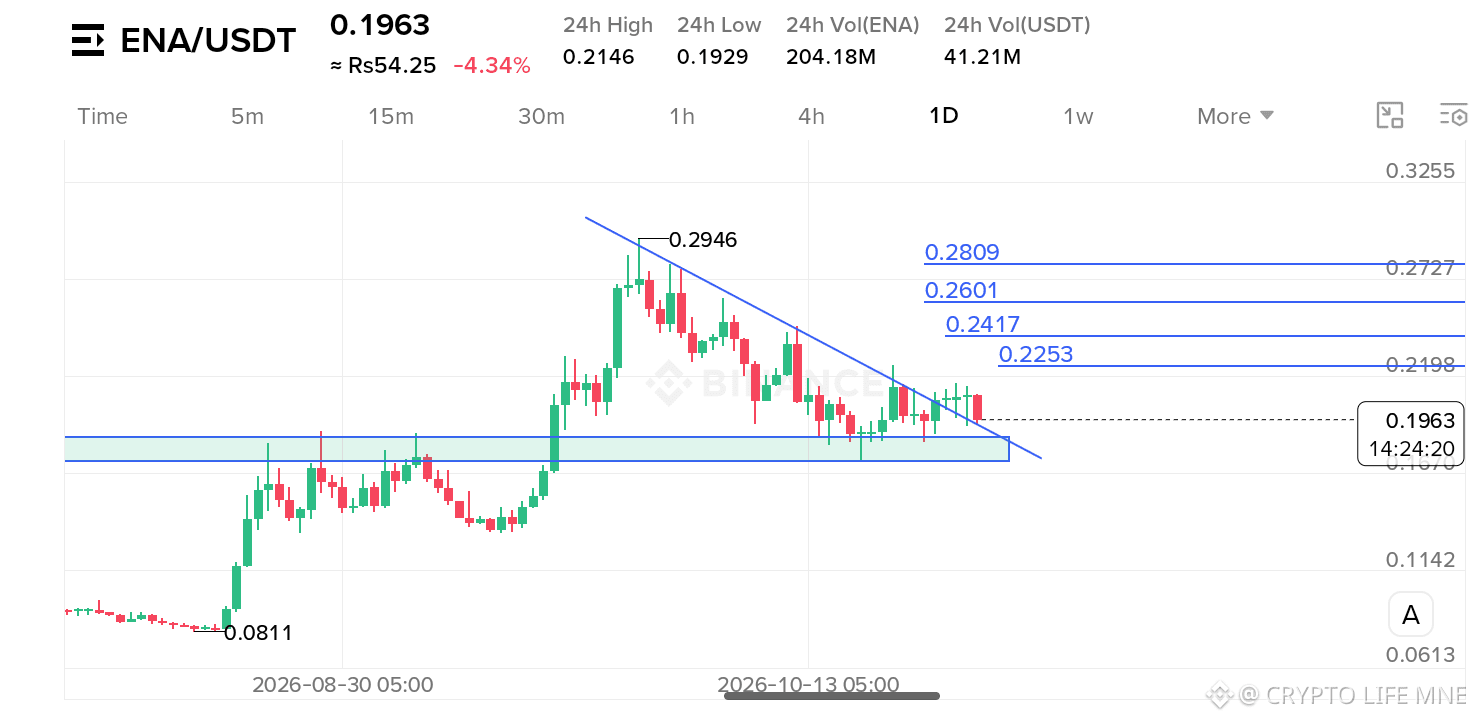
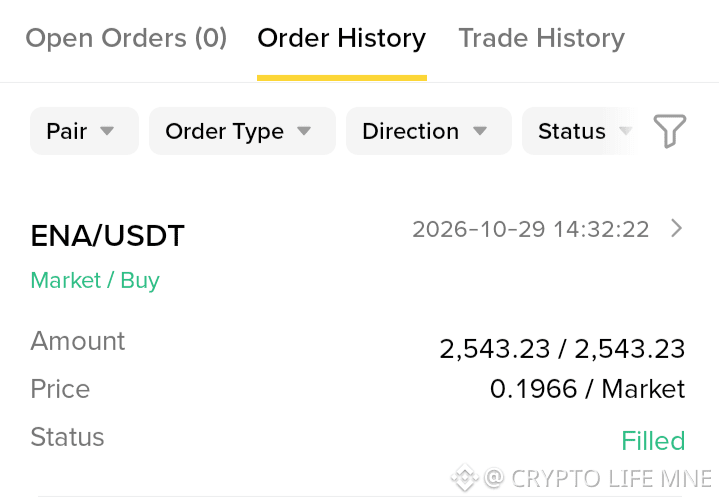
Buying and holding $ENA /USDT here on spot for a few days 📈. Breakout play!
Something good is cooking behind that accumulation. For the fourth day, the price is holding above the breakout resistance, showing signs of whale accumulation.
Potential next target levels 🎯:
$0.2253
$0.2417
$0.2601
$0.2809 (near the previous swing high)
$ENA
{spot}(ENAUSDT)
#ENA #Breakout
Buying and holding $ENA /USDT here on spot for a few days 📈. Breakout play!
Something good is cooking behind that accumulation. For the fourth day, the price is holding above the breakout resistance, showing signs of whale accumulation.
Potential next target levels 🎯:
$0.2253
$0.2417
$0.2601
$0.2809 (near the previous swing high)
$ENA
#ENA #Breakout
Something good is cooking behind that accumulation. For the fourth day, the price is holding above the breakout resistance, showing signs of whale accumulation.
Potential next target levels 🎯:
$0.2253
$0.2417
$0.2601
$0.2809 (near the previous swing high)
$ENA
#ENA #Breakout
1
1
1.1k
·
--
Bullish
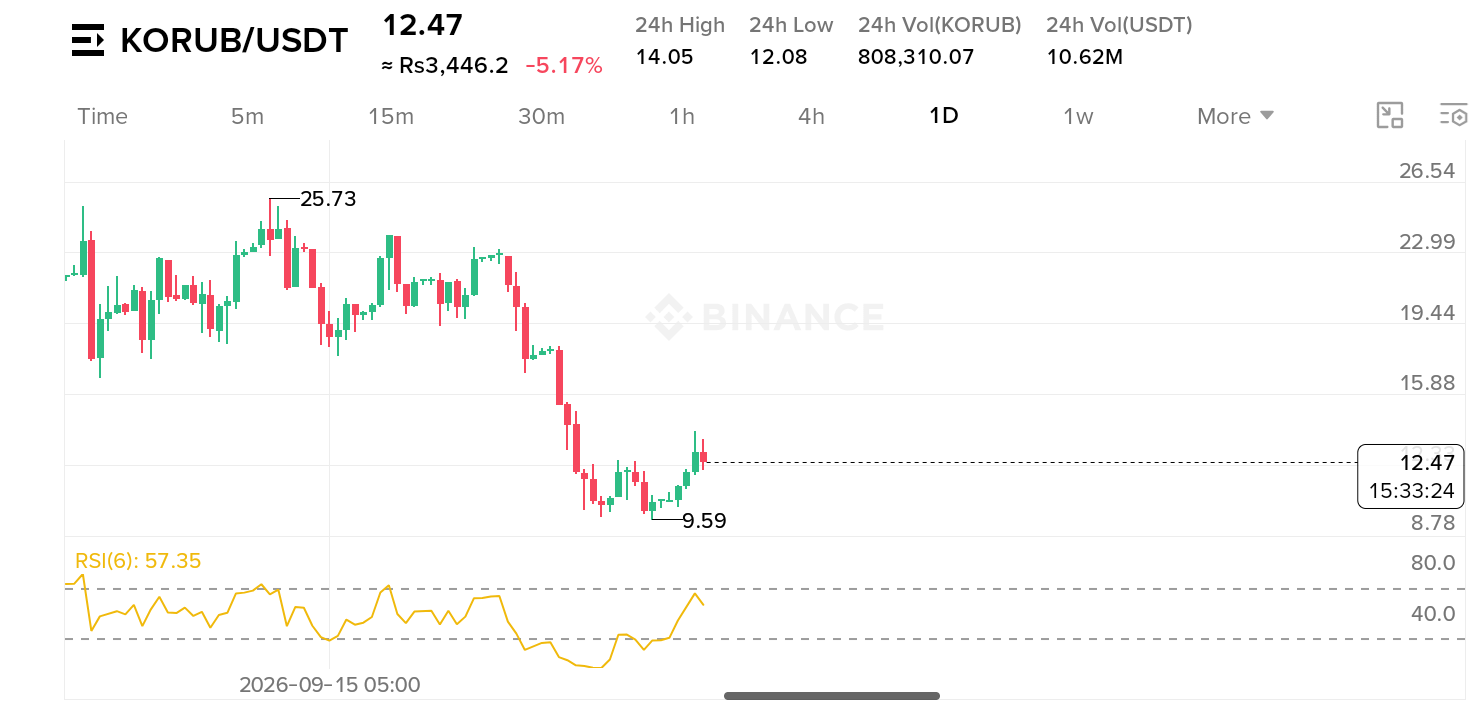
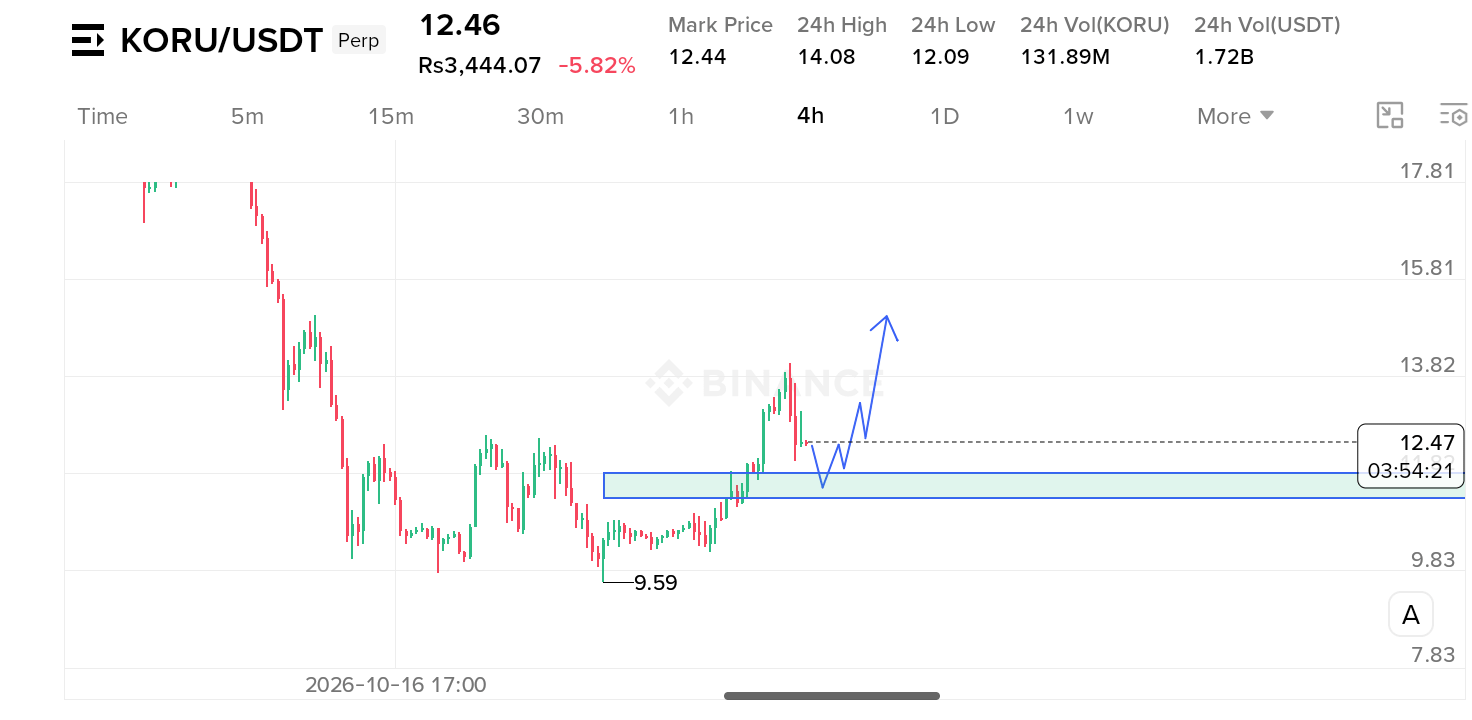
Adding some $KORUB /USDT to the spot bag! 📈
Chart looks solid here: Double bottom formation on the daily timeframe + RSI bullish divergence.
Plus, we recently got a market structure shift with a higher swing high on the 4-hour timeframe.
Just need a confirmed higher high from marked fibonacci golden pocket zone, and then we can target higher levels.
Potential Target Levels 🎯
$13.50
$14.50
$15.80
$16.60
DOYOR
{spot}(KORUBUSDT)
Adding some $KORUB /USDT to the spot bag! 📈
Chart looks solid here: Double bottom formation on the daily timeframe + RSI bullish divergence.
Plus, we recently got a market structure shift with a higher swing high on the 4-hour timeframe.
Just need a confirmed higher high from marked fibonacci golden pocket zone, and then we can target higher levels.
Potential Target Levels 🎯
$13.50
$14.50
$15.80
$16.60
DOYOR
Chart looks solid here: Double bottom formation on the daily timeframe + RSI bullish divergence.
Plus, we recently got a market structure shift with a higher swing high on the 4-hour timeframe.
Just need a confirmed higher high from marked fibonacci golden pocket zone, and then we can target higher levels.
Potential Target Levels 🎯
$13.50
$14.50
$15.80
$16.60
DOYOR
2
406
$ENA /USDT Starts Pumping From The Support Level 📈.
A Sucessfull breakout and hold above this pattern will opens the doors for Higher levels.
$ENA
{future}(ENAUSDT)
$ENA /USDT Starts Pumping From The Support Level 📈.
A Sucessfull breakout and hold above this pattern will opens the doors for Higher levels.
$ENA
A Sucessfull breakout and hold above this pattern will opens the doors for Higher levels.
$ENA
CRYPTO LIFE MNE
·
--
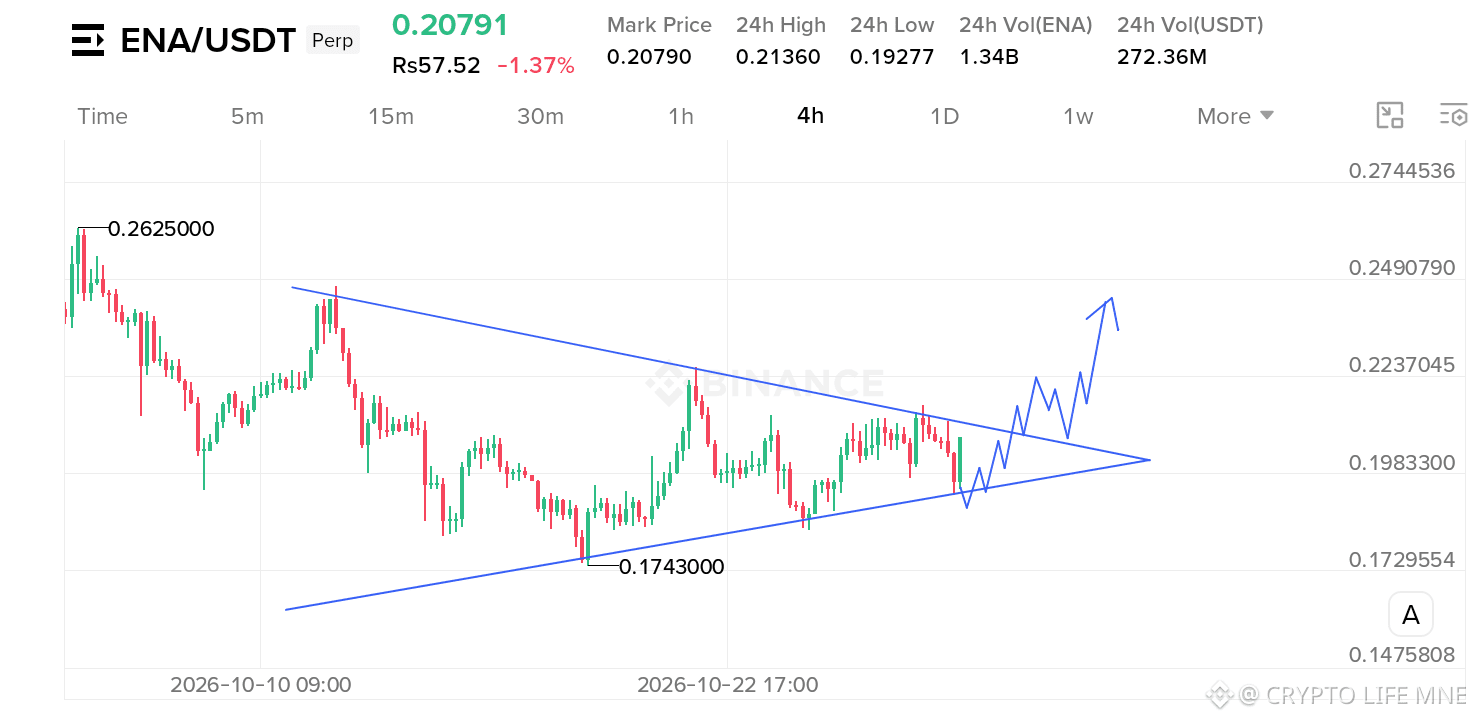
$ENA /USDT Near The Symmetrical Triangle Pattern Support Line.
Need to hold that level a bounce from here can still drive price higher or a closing below that level will invalidate all bullish thesis do or die.
$ENA
Need to hold that level a bounce from here can still drive price higher or a closing below that level will invalidate all bullish thesis do or die.
$ENA
446
🇺🇸 FEDERAL RESERVE LEAVES INTEREST RATES UNCHANGED, REMAINS AT 3.75% - 4.00%.
🇺🇸 FEDERAL RESERVE LEAVES INTEREST RATES UNCHANGED, REMAINS AT 3.75% - 4.00%.
2
193
·
--
Bullish
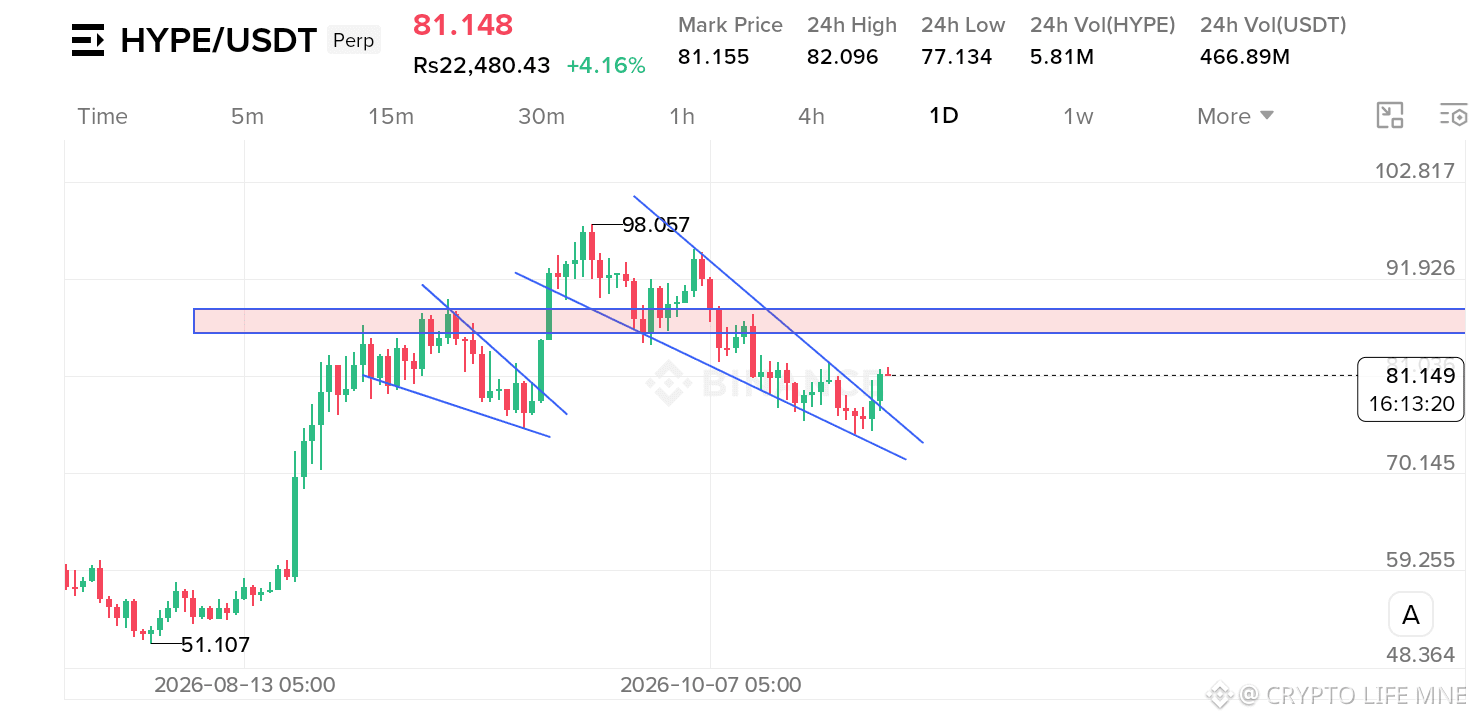
$HYPE /USDT Is Looking Bullish 📈 It Can Pump More.
The coin just broke out above the Falling Wedge pattern on key daily timeframe chart.
I am expecting a move up atleast toward that marked zone which is combined with Fibonacci golden pocket.
Potential Next Target's 🎯
$84.00
$86.00
$88.00
Or more if momentum sustains and we got a breakout above that marked key horizontal resistance zone.
$HYPE
{future}(HYPEUSDT)
#hype
$HYPE /USDT Is Looking Bullish 📈 It Can Pump More.
The coin just broke out above the Falling Wedge pattern on key daily timeframe chart.
I am expecting a move up atleast toward that marked zone which is combined with Fibonacci golden pocket.
Potential Next Target's 🎯
$84.00
$86.00
$88.00
Or more if momentum sustains and we got a breakout above that marked key horizontal resistance zone.
$HYPE
#hype
The coin just broke out above the Falling Wedge pattern on key daily timeframe chart.
I am expecting a move up atleast toward that marked zone which is combined with Fibonacci golden pocket.
Potential Next Target's 🎯
$84.00
$86.00
$88.00
Or more if momentum sustains and we got a breakout above that marked key horizontal resistance zone.
$HYPE
#hype
3
619
·
--
Bullish
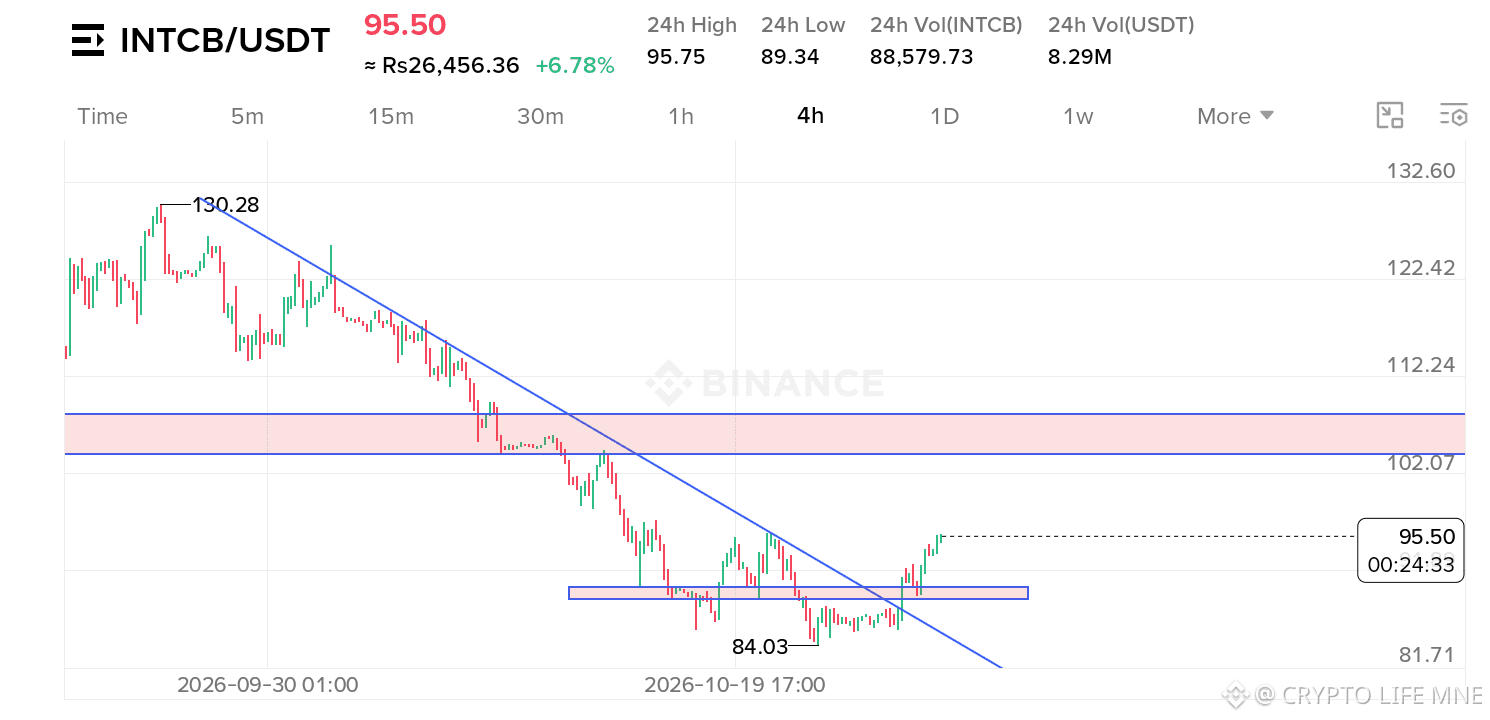
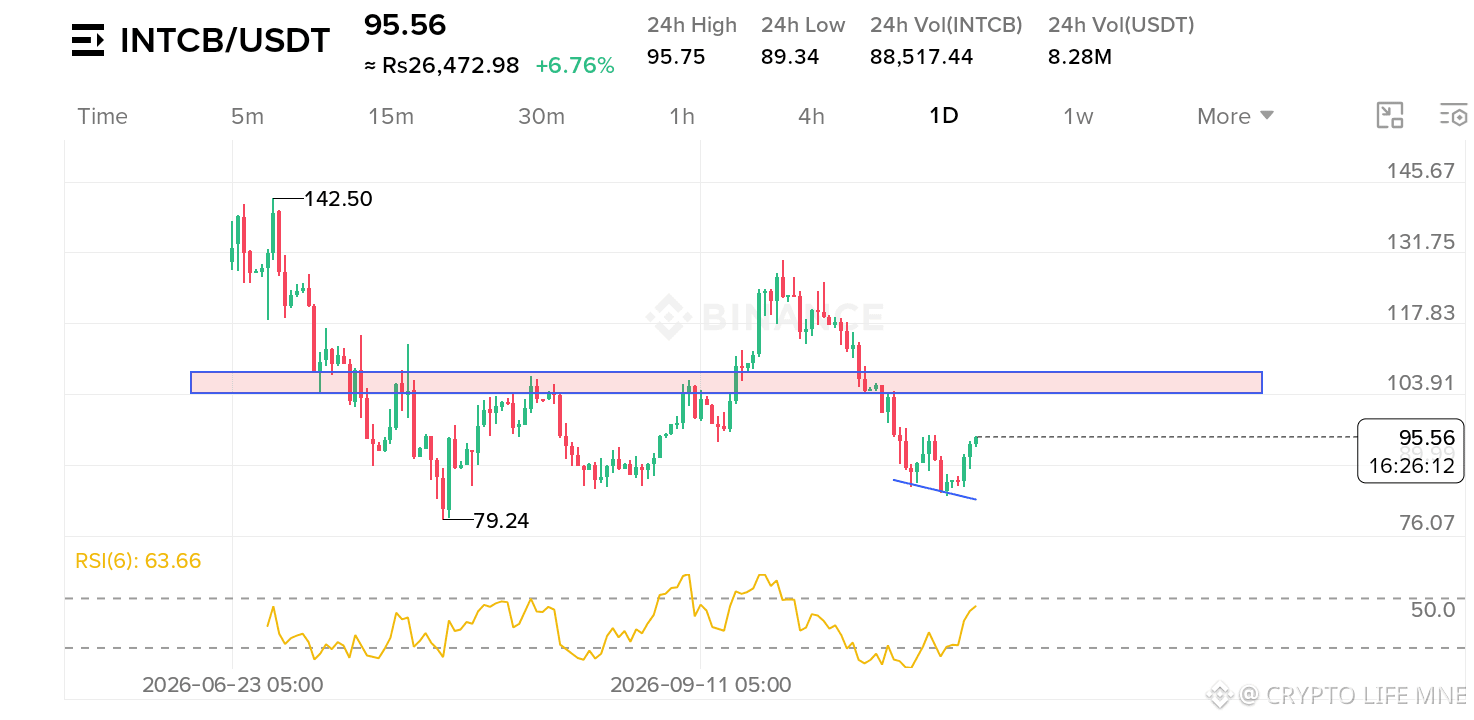
$INTCB /USDT Bullish Breakout 📈 Buyers Are Stepping In.
The coin is looking good to add here we saw a clear bullish RSI divergence in daily timeframe chart .
Or also it gives us a breakout above the 4-hour timeframe trendline resistance. Expecting a move up toward that marked zone.
Potential Next Target's 🎯:
$98.00
$100.00
$102.00
$105.00
$107,00
These are the key levels on minor resistance levels and on the marked key horizontal zone 📈.
$INTCB
{spot}(INTCBUSDT)
$INTCB /USDT Bullish Breakout 📈 Buyers Are Stepping In.
The coin is looking good to add here we saw a clear bullish RSI divergence in daily timeframe chart .
Or also it gives us a breakout above the 4-hour timeframe trendline resistance. Expecting a move up toward that marked zone.
Potential Next Target's 🎯:
$98.00
$100.00
$102.00
$105.00
$107,00
These are the key levels on minor resistance levels and on the marked key horizontal zone 📈.
$INTCB
The coin is looking good to add here we saw a clear bullish RSI divergence in daily timeframe chart .
Or also it gives us a breakout above the 4-hour timeframe trendline resistance. Expecting a move up toward that marked zone.
Potential Next Target's 🎯:
$98.00
$100.00
$102.00
$105.00
$107,00
These are the key levels on minor resistance levels and on the marked key horizontal zone 📈.
$INTCB
1
177
·
--
Bullish
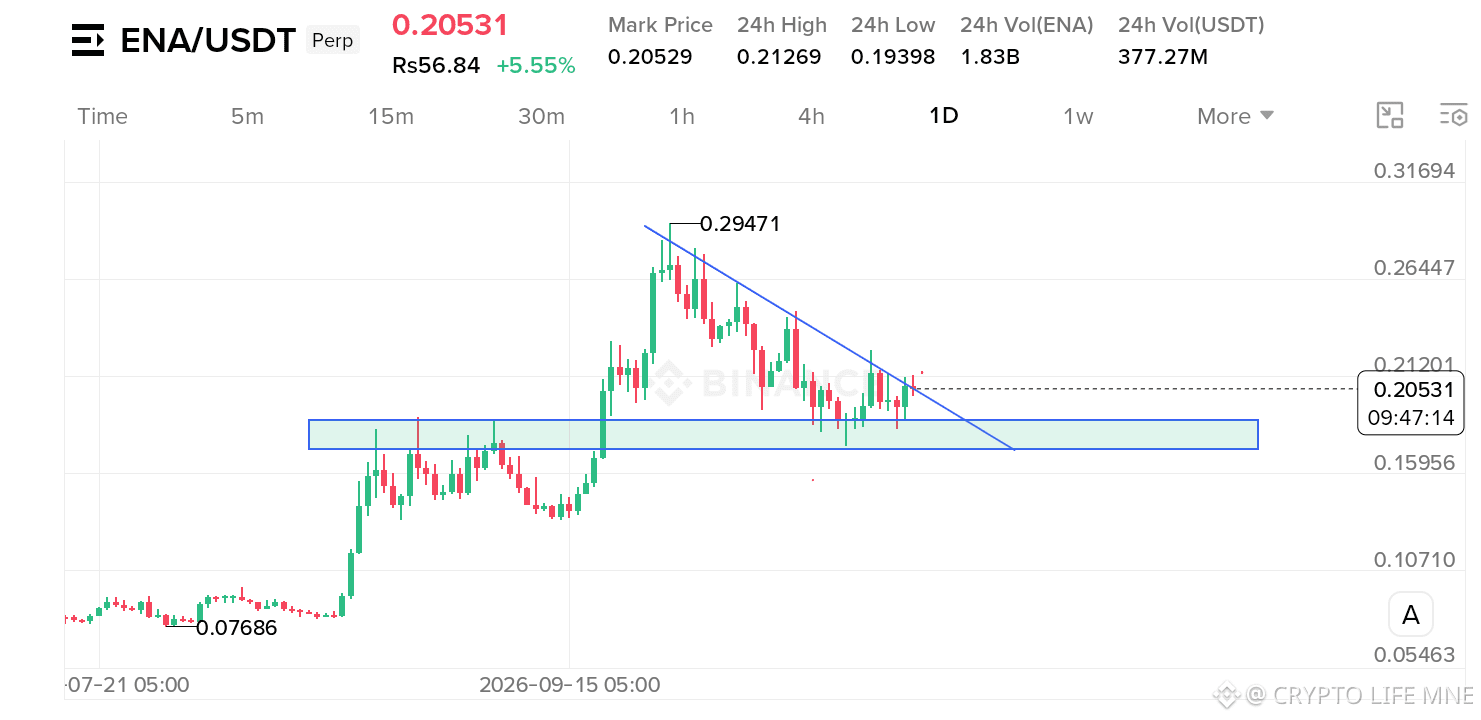
$ENA /USDT: Worth watching here as bullish signals remain strong 📈
We saw a higher-low formation on the 4-hour chart, which is a very positive sign for bulls, and the price is currently holding above its key daily support zone.
With 9 hours left until the daily candle close, I want to see it break and close above the trendline resistance—specifically above $0.2130—for further confirmation 📈.
I will share an update here, so stay tuned!
$ENA
{future}(ENAUSDT)
#ENA
$ENA /USDT: Worth watching here as bullish signals remain strong 📈
We saw a higher-low formation on the 4-hour chart, which is a very positive sign for bulls, and the price is currently holding above its key daily support zone.
With 9 hours left until the daily candle close, I want to see it break and close above the trendline resistance—specifically above $0.2130—for further confirmation 📈.
I will share an update here, so stay tuned!
$ENA
#ENA
We saw a higher-low formation on the 4-hour chart, which is a very positive sign for bulls, and the price is currently holding above its key daily support zone.
With 9 hours left until the daily candle close, I want to see it break and close above the trendline resistance—specifically above $0.2130—for further confirmation 📈.
I will share an update here, so stay tuned!
$ENA
#ENA
CRYPTO LIFE MNE
·
--
BullishAdding $ENA /USDT here. The chart looks ready for the breakout 📈. The pump begins...
$ENA is holding strong above the daily key horizontal support zone, which is a good signal that the structure is still intact 📈.
On the 4-hour timeframe chart, we just saw our first higher low formation, confirming a shift in momentum.
This is a good time to add to it, expecting a move up soon.
Further Next Targets 🎯
$0.2100
$0.2150
$0.2180
Potential Key Targets for Swing Traders 🎯
$0.2300
$0.2460
$0.2600 (Near the previous swing high)
Or it can go above $0.29 📈 and make a new higher high. The trend is bullish, the structure is bullish, and we just got a higher low confirmation on the 4-hour timeframe chart.
Let's go, $ENA !
#ENA #Breakout !
$ENA is holding strong above the daily key horizontal support zone, which is a good signal that the structure is still intact 📈.
On the 4-hour timeframe chart, we just saw our first higher low formation, confirming a shift in momentum.
This is a good time to add to it, expecting a move up soon.
Further Next Targets 🎯
$0.2100
$0.2150
$0.2180
Potential Key Targets for Swing Traders 🎯
$0.2300
$0.2460
$0.2600 (Near the previous swing high)
Or it can go above $0.29 📈 and make a new higher high. The trend is bullish, the structure is bullish, and we just got a higher low confirmation on the 4-hour timeframe chart.
Let's go, $ENA !
#ENA #Breakout !
1
311
·
--
Bullish
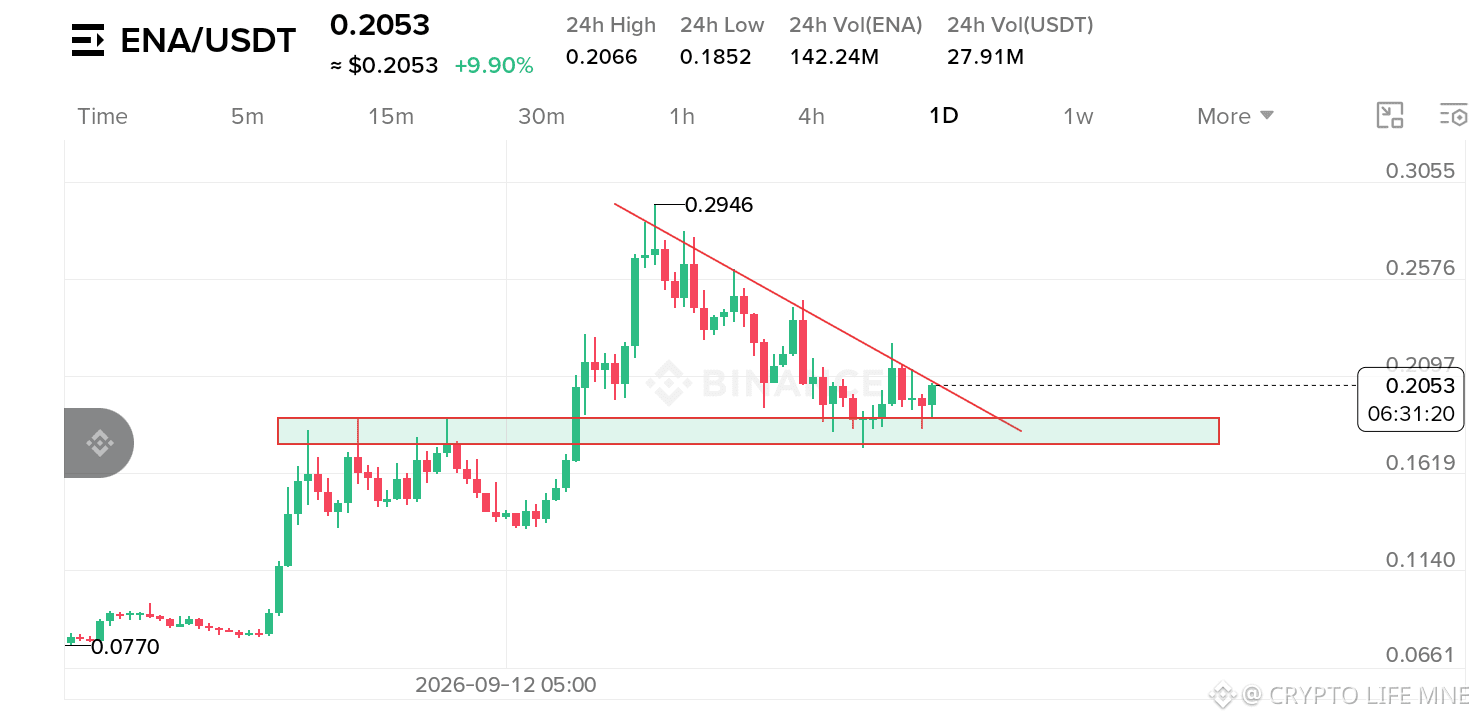
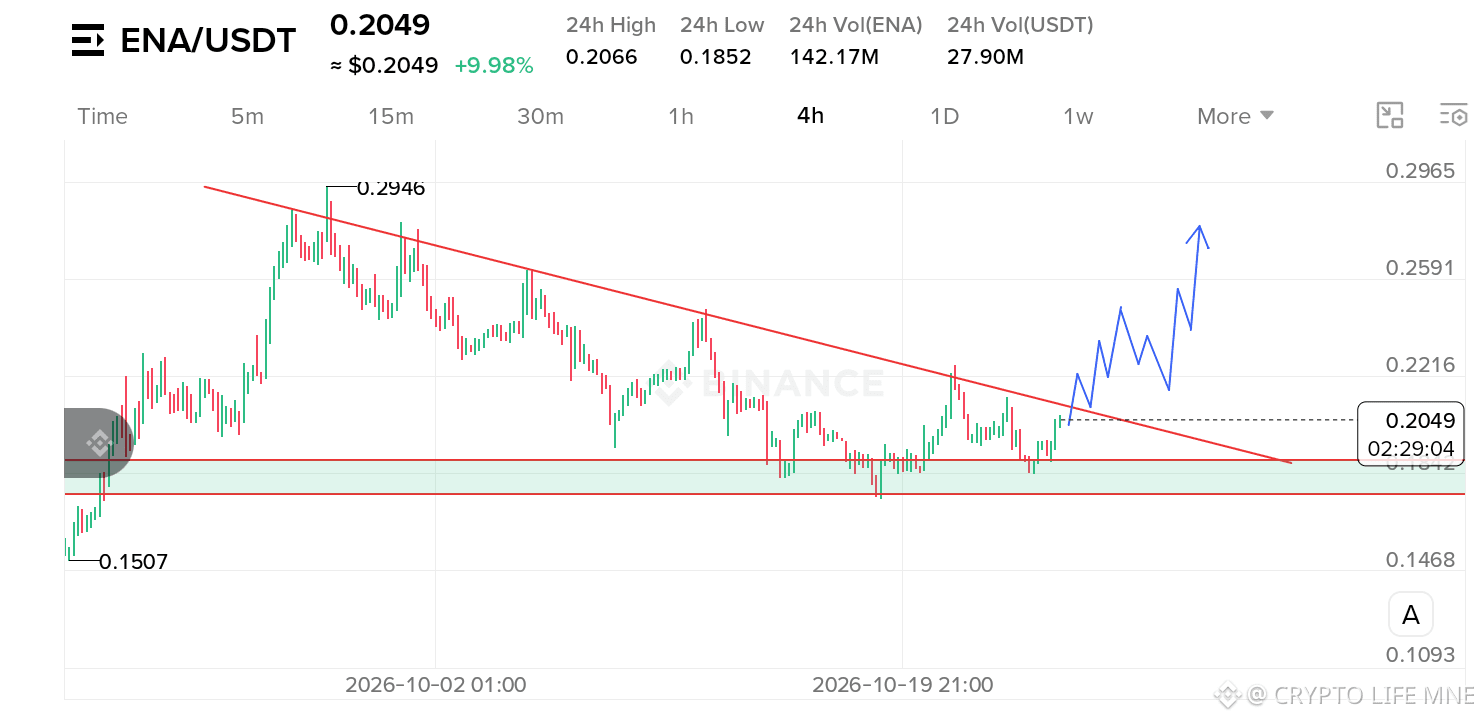
Adding $ENA /USDT here. The chart looks ready for the breakout 📈. The pump begins...
$ENA is holding strong above the daily key horizontal support zone, which is a good signal that the structure is still intact 📈.
On the 4-hour timeframe chart, we just saw our first higher low formation, confirming a shift in momentum.
This is a good time to add to it, expecting a move up soon.
Further Next Targets 🎯
$0.2100
$0.2150
$0.2180
Potential Key Targets for Swing Traders 🎯
$0.2300
$0.2460
$0.2600 (Near the previous swing high)
Or it can go above $0.29 📈 and make a new higher high. The trend is bullish, the structure is bullish, and we just got a higher low confirmation on the 4-hour timeframe chart.
Let's go, $ENA !
{future}(ENAUSDT)
#ENA #Breakout !
Adding $ENA /USDT here. The chart looks ready for the breakout 📈. The pump begins...
$ENA is holding strong above the daily key horizontal support zone, which is a good signal that the structure is still intact 📈.
On the 4-hour timeframe chart, we just saw our first higher low formation, confirming a shift in momentum.
This is a good time to add to it, expecting a move up soon.
Further Next Targets 🎯
$0.2100
$0.2150
$0.2180
Potential Key Targets for Swing Traders 🎯
$0.2300
$0.2460
$0.2600 (Near the previous swing high)
Or it can go above $0.29 📈 and make a new higher high. The trend is bullish, the structure is bullish, and we just got a higher low confirmation on the 4-hour timeframe chart.
Let's go, $ENA !
#ENA #Breakout !
$ENA is holding strong above the daily key horizontal support zone, which is a good signal that the structure is still intact 📈.
On the 4-hour timeframe chart, we just saw our first higher low formation, confirming a shift in momentum.
This is a good time to add to it, expecting a move up soon.
Further Next Targets 🎯
$0.2100
$0.2150
$0.2180
Potential Key Targets for Swing Traders 🎯
$0.2300
$0.2460
$0.2600 (Near the previous swing high)
Or it can go above $0.29 📈 and make a new higher high. The trend is bullish, the structure is bullish, and we just got a higher low confirmation on the 4-hour timeframe chart.
Let's go, $ENA !
#ENA #Breakout !
1
3
1.4k
·
--
Bullish
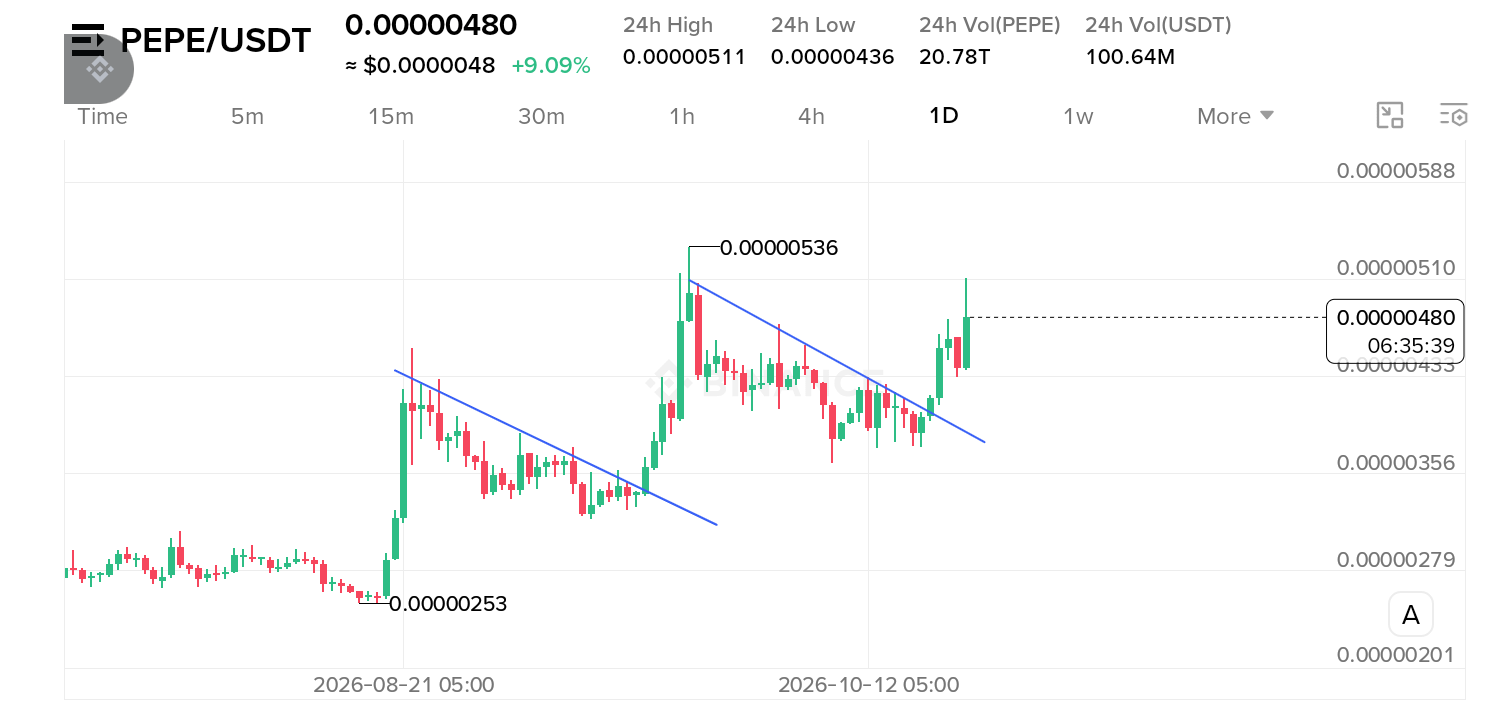
$PEPE /USDT Sets A New 24 Hour High At $0.0000051+ 😉📈.
$PEPE /USDT Sets A New 24 Hour High At $0.0000051+ 😉📈.
CRYPTO LIFE MNE
·
--
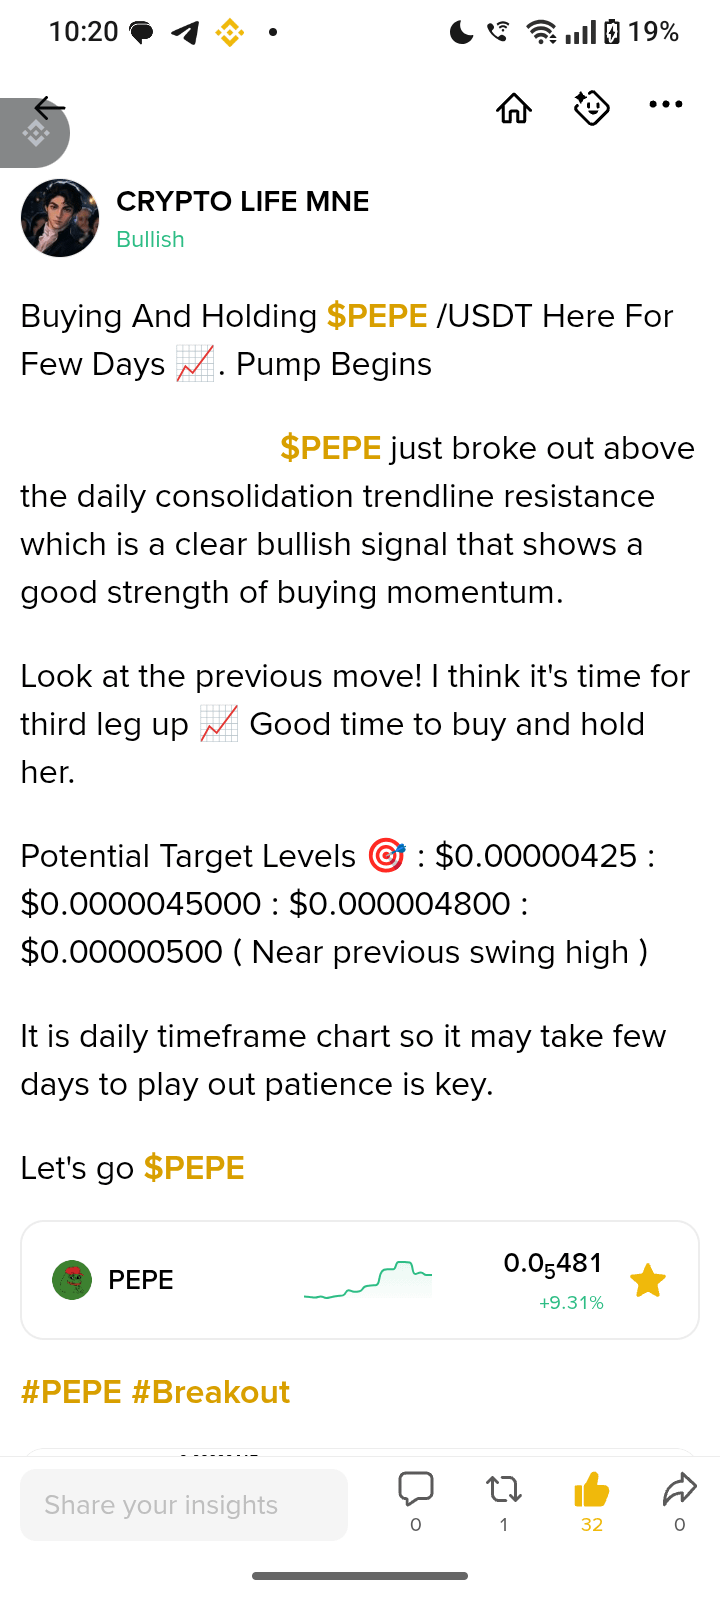
BullishBuying And Holding $PEPE /USDT Here For Few Days 📈. Pump Begins
$PEPE just broke out above the daily consolidation trendline resistance which is a clear bullish signal that shows a good strength of buying momentum.
Look at the previous move! I think it's time for third leg up 📈 Good time to buy and hold her.
Potential Target Levels 🎯 : $0.00000425 : $0.0000045000 : $0.000004800 : $0.00000500 ( Near previous swing high )
It is daily timeframe chart so it may take few days to play out patience is key.
Let's go $PEPE
#PEPE #Breakout
$PEPE just broke out above the daily consolidation trendline resistance which is a clear bullish signal that shows a good strength of buying momentum.
Look at the previous move! I think it's time for third leg up 📈 Good time to buy and hold her.
Potential Target Levels 🎯 : $0.00000425 : $0.0000045000 : $0.000004800 : $0.00000500 ( Near previous swing high )
It is daily timeframe chart so it may take few days to play out patience is key.
Let's go $PEPE
#PEPE #Breakout
2
421
Log in to explore more content
Join global crypto users on Binance Square
⚡️ Get latest and useful information about crypto.
💬 Trusted by the world’s largest crypto exchange.
👍 Discover real insights from verified creators.
Email / Phone number
Trending Topics
BitcoinRebounds$75KAsChipsLead
7,778 views
115 Discussing
Market Watch | Bitcoin Rebounds to $75,600 After Dip Below $75,000 as Chip Stocks Lead Rally on Jobs Beat
Binance News
·16 Likes
·4.7k views
JobsReportRaisesHikeOdds
100,717 views
926 Discussing
US Data Center Rules May Constrain AI Expansion
13,640 views
97 Discussing