
币监会主席
1.3k Posts

币监会主席
Report
Block User
加密市场“气氛组选手”兼实盘“赌徒”(bushi)。盯BTC涨跌比追剧还勤,主打一个在波动里整活——赚了吹牛皮,亏了喊“没法玩”,主打真实。
Open Trade
Frequent Trader
4.4 Years
934 Following
335 Followers
1.9K+ Liked
Posts
Portfolio
All
Quotes
Videos
·
--

Article
Zeroing Out 3,000 Accounts in 2 Seconds—A Lesson the Crypto Market Learned the Hard WaySomething else happened to an overseas platform. This time, it used the banner of "Fangfang Quant."
A broker called Xingqiao Capital lured retail investors into its platform using PowerPoint institution logos and the claim that its "technical staff all come from Fangfang." There is no publicly available connection between Fangfang Quant and this matter.
On the night of August 19, the gold price surged more than 3.6% in a single day. In that same night, within two seconds, the platform pumped enormous gold short positions into thousands of accounts—typically at 184 times the size of the previous trade. MT5 logs show that the gold spread was artificially raised to $13, while the normal level is only $0.2 to $0.5. The 30% stop-loss lines were never triggered even once. More than 3,000 accounts were zeroed out in an instant—some even owed nearly $100,000. Just 2 seconds.
Zeroing Out 3,000 Accounts in 2 Seconds—A Lesson the Crypto Market Learned the Hard Way
Something else happened to an overseas platform. This time, it used the banner of "Fangfang Quant."
A broker called Xingqiao Capital lured retail investors into its platform using PowerPoint institution logos and the claim that its "technical staff all come from Fangfang." There is no publicly available connection between Fangfang Quant and this matter.
On the night of August 19, the gold price surged more than 3.6% in a single day. In that same night, within two seconds, the platform pumped enormous gold short positions into thousands of accounts—typically at 184 times the size of the previous trade. MT5 logs show that the gold spread was artificially raised to $13, while the normal level is only $0.2 to $0.5. The 30% stop-loss lines were never triggered even once. More than 3,000 accounts were zeroed out in an instant—some even owed nearly $100,000. Just 2 seconds.
A broker called Xingqiao Capital lured retail investors into its platform using PowerPoint institution logos and the claim that its "technical staff all come from Fangfang." There is no publicly available connection between Fangfang Quant and this matter.
On the night of August 19, the gold price surged more than 3.6% in a single day. In that same night, within two seconds, the platform pumped enormous gold short positions into thousands of accounts—typically at 184 times the size of the previous trade. MT5 logs show that the gold spread was artificially raised to $13, while the normal level is only $0.2 to $0.5. The 30% stop-loss lines were never triggered even once. More than 3,000 accounts were zeroed out in an instant—some even owed nearly $100,000. Just 2 seconds.
57
·
--

Article
Rate hike at the Fed remains uncertain, and crypto markets are waiting for these two data releasesThe Federal Reserve meets for its rate decision next week, with the probability of a rate hike hovering around 60%.
But the disagreement behind this figure is unusually stark. The path for the Sept. 15–16 meeting depends on Thursday’s PPI and Friday’s CPI.
What the market is watching is core CPI excluding energy. Oil price fluctuations have made the overall data less important. Oil prices moved from below $70 in July back above $100, pushing the August overall CPI month-on-month forecast to 0.4%, with year-on-year around 3.4%. Core CPI is expected to rise 0.2% month-on-month; its year-on-year rate could also slow from 2.5% to 2.4%.
Core CPI at 0.1% month-on-month or lower means the Federal Reserve will most likely keep policy unchanged. At 0.3% or higher, a rate hike is basically certain. If it lands at 0.2%, the split will keep dragging things out. There are really just three tiers. Housing costs have recently been slowing, which is a sign of cooling—and also makes it difficult for officials to completely put the option of tightening aside.
Rate hike at the Fed remains uncertain, and crypto markets are waiting for these two data releases
The Federal Reserve meets for its rate decision next week, with the probability of a rate hike hovering around 60%.
But the disagreement behind this figure is unusually stark. The path for the Sept. 15–16 meeting depends on Thursday’s PPI and Friday’s CPI.
What the market is watching is core CPI excluding energy. Oil price fluctuations have made the overall data less important. Oil prices moved from below $70 in July back above $100, pushing the August overall CPI month-on-month forecast to 0.4%, with year-on-year around 3.4%. Core CPI is expected to rise 0.2% month-on-month; its year-on-year rate could also slow from 2.5% to 2.4%.
Core CPI at 0.1% month-on-month or lower means the Federal Reserve will most likely keep policy unchanged. At 0.3% or higher, a rate hike is basically certain. If it lands at 0.2%, the split will keep dragging things out. There are really just three tiers. Housing costs have recently been slowing, which is a sign of cooling—and also makes it difficult for officials to completely put the option of tightening aside.
But the disagreement behind this figure is unusually stark. The path for the Sept. 15–16 meeting depends on Thursday’s PPI and Friday’s CPI.
What the market is watching is core CPI excluding energy. Oil price fluctuations have made the overall data less important. Oil prices moved from below $70 in July back above $100, pushing the August overall CPI month-on-month forecast to 0.4%, with year-on-year around 3.4%. Core CPI is expected to rise 0.2% month-on-month; its year-on-year rate could also slow from 2.5% to 2.4%.
Core CPI at 0.1% month-on-month or lower means the Federal Reserve will most likely keep policy unchanged. At 0.3% or higher, a rate hike is basically certain. If it lands at 0.2%, the split will keep dragging things out. There are really just three tiers. Housing costs have recently been slowing, which is a sign of cooling—and also makes it difficult for officials to completely put the option of tightening aside.
67
·
--

Article
From an A-share market manipulation case: the most expensive lesson in the on-chain worldOver the past two days, an announcement in China’s financial sector has been making the rounds. An A-share company disclosed the outcome of a second-instance ruling in a securities-market manipulation case involving a former “private fund boss.” More than a dozen cases had their original verdicts upheld; the parties involved are required to compensate dozens of investors with amounts totaling hundreds of millions of yuan. In other cases, the ruling was changed so that an individual bears responsibility alone. The amounts themselves are not astronomical, but they bring that old problem back into the spotlight. When markets are shaped by what people say and do, what exactly protects ordinary investors?
I’m paying attention to this issue—not only for the numbers themselves, but for the message reflected in them: the “chain-on” world, which most loves to brand itself as transparent, where everything supposedly is visible on-chain.
From an A-share market manipulation case: the most expensive lesson in the on-chain world
Over the past two days, an announcement in China’s financial sector has been making the rounds. An A-share company disclosed the outcome of a second-instance ruling in a securities-market manipulation case involving a former “private fund boss.” More than a dozen cases had their original verdicts upheld; the parties involved are required to compensate dozens of investors with amounts totaling hundreds of millions of yuan. In other cases, the ruling was changed so that an individual bears responsibility alone. The amounts themselves are not astronomical, but they bring that old problem back into the spotlight. When markets are shaped by what people say and do, what exactly protects ordinary investors?
I’m paying attention to this issue—not only for the numbers themselves, but for the message reflected in them: the “chain-on” world, which most loves to brand itself as transparent, where everything supposedly is visible on-chain.
I’m paying attention to this issue—not only for the numbers themselves, but for the message reflected in them: the “chain-on” world, which most loves to brand itself as transparent, where everything supposedly is visible on-chain.
36
·
--

Article
Tesla’s Cybercab is on the road, but the story is only just beginningTesla announced on September 3 local time that its Cybercab autonomous ride-hailing service is officially up and running in Austin, USA. The vehicle has no steering wheel, no pedals, and no rear-view mirrors—it handles all transportation needs entirely through its autonomous driving system. It sounds like a scene from a science-fiction movie, but it’s already actually driving on Texas roads.
My first reaction was to check how Tesla’s stock price was reacting. In late July, Musk had just said it would be prudent to roll out robotaxis, and the very next day Tesla’s shares plunged 14.5%. So with this Cybercab now officially becoming a reality, it’s not just a product launch for the capital markets—it’s more like a stress test of Tesla’s valuation logic. Whether the product can strengthen its autonomous vehicle fleet directly influences Wall Street’s judgment.
Tesla’s Cybercab is on the road, but the story is only just beginning
Tesla announced on September 3 local time that its Cybercab autonomous ride-hailing service is officially up and running in Austin, USA. The vehicle has no steering wheel, no pedals, and no rear-view mirrors—it handles all transportation needs entirely through its autonomous driving system. It sounds like a scene from a science-fiction movie, but it’s already actually driving on Texas roads.
My first reaction was to check how Tesla’s stock price was reacting. In late July, Musk had just said it would be prudent to roll out robotaxis, and the very next day Tesla’s shares plunged 14.5%. So with this Cybercab now officially becoming a reality, it’s not just a product launch for the capital markets—it’s more like a stress test of Tesla’s valuation logic. Whether the product can strengthen its autonomous vehicle fleet directly influences Wall Street’s judgment.
My first reaction was to check how Tesla’s stock price was reacting. In late July, Musk had just said it would be prudent to roll out robotaxis, and the very next day Tesla’s shares plunged 14.5%. So with this Cybercab now officially becoming a reality, it’s not just a product launch for the capital markets—it’s more like a stress test of Tesla’s valuation logic. Whether the product can strengthen its autonomous vehicle fleet directly influences Wall Street’s judgment.
44
·
--
$SOL 生态 team visited the National Bank of Georgia, discussing stablecoins, cross-border payments, and open financial tools. When a public chain team directly connects with the central bank, on-chain settlement moves one step closer to the sovereign financial system. Smaller countries’ central banks are often more willing to experiment with trial and error, and regulatory sandboxes typically run faster. The compliant implementation of stablecoins may first break out from these areas, then in turn influence larger mainstream markets.
$SOL 生态 team visited the National Bank of Georgia, discussing stablecoins, cross-border payments, and open financial tools. When a public chain team directly connects with the central bank, on-chain settlement moves one step closer to the sovereign financial system. Smaller countries’ central banks are often more willing to experiment with trial and error, and regulatory sandboxes typically run faster. The compliant implementation of stablecoins may first break out from these areas, then in turn influence larger mainstream markets.

2
97
·
--
On August 31, the Hang Seng Tech Index turned higher in the afternoon. MiniMax-W (00100.HK) saw its gains widen to more than 17%, while Zhipu (02513.HK) rose by over 5%.
Since the listing of Chapter 18C, MiniMax and Zhipu have become sample cases of the “two big model champions” segment in Hong Kong stocks, demonstrating strong sector linkages. Each time the Hang Seng Tech Index adjusts and the constituents of the Stock Connect change, it triggers a wave of impulse trading; after being included in the index, their synchrony has become noticeably stronger.
The liquidity premium in the AI sector is spreading from US stocks such as NVIDIA and Meta to Hong Kong AI equities. This logic chain traces upstream to computing power, electricity, and semiconductors; downstream, it will give rise to more commercialized deployments of encrypted AI agents.
$COTI #港股 #恒生科技 #AI
On August 31, the Hang Seng Tech Index turned higher in the afternoon. MiniMax-W (00100.HK) saw its gains widen to more than 17%, while Zhipu (02513.HK) rose by over 5%.
Since the listing of Chapter 18C, MiniMax and Zhipu have become sample cases of the “two big model champions” segment in Hong Kong stocks, demonstrating strong sector linkages. Each time the Hang Seng Tech Index adjusts and the constituents of the Stock Connect change, it triggers a wave of impulse trading; after being included in the index, their synchrony has become noticeably stronger.
The liquidity premium in the AI sector is spreading from US stocks such as NVIDIA and Meta to Hong Kong AI equities. This logic chain traces upstream to computing power, electricity, and semiconductors; downstream, it will give rise to more commercialized deployments of encrypted AI agents.
$COTI #港股 #恒生科技 #AI
Since the listing of Chapter 18C, MiniMax and Zhipu have become sample cases of the “two big model champions” segment in Hong Kong stocks, demonstrating strong sector linkages. Each time the Hang Seng Tech Index adjusts and the constituents of the Stock Connect change, it triggers a wave of impulse trading; after being included in the index, their synchrony has become noticeably stronger.
The liquidity premium in the AI sector is spreading from US stocks such as NVIDIA and Meta to Hong Kong AI equities. This logic chain traces upstream to computing power, electricity, and semiconductors; downstream, it will give rise to more commercialized deployments of encrypted AI agents.
$COTI #港股 #恒生科技 #AI

2
27
·
--
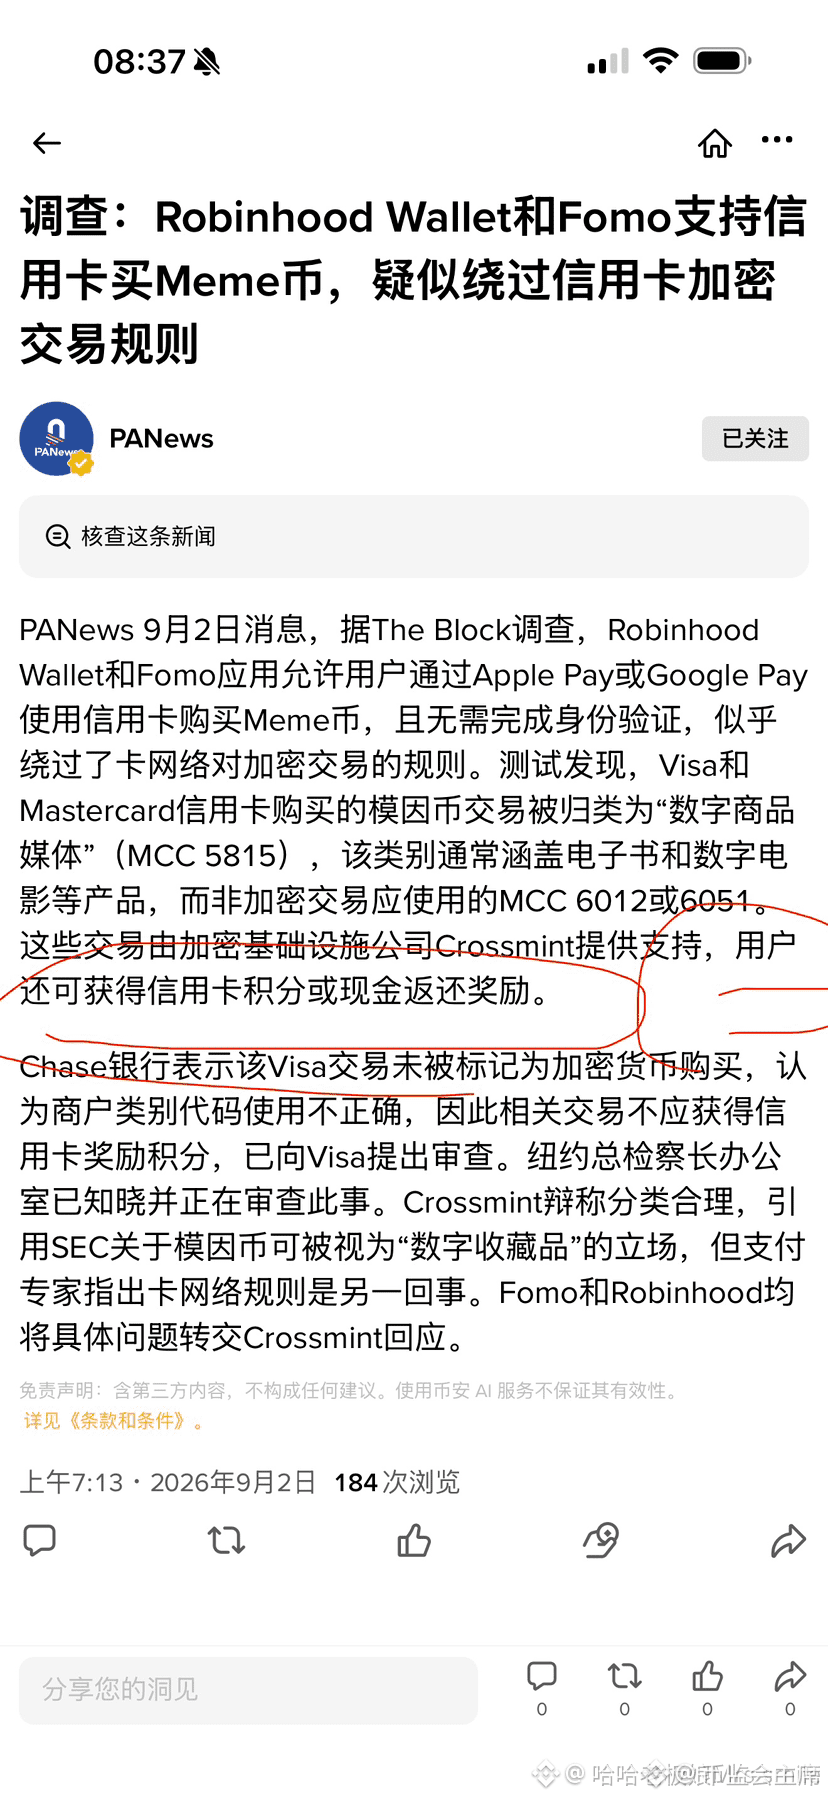
Robinhood Wallet and Fomo exposed as enabling the use of credit cards to buy meme coins; transactions are classified as “digital goods” rather than crypto purchases, circumventing some card network rules. Compliance arbitrage can acquire users in the short term, but in the long run it still depends on how regulators draw the boundaries.
$COTI #Robinhood #Meme币 #compliance
Robinhood Wallet and Fomo exposed as enabling the use of credit cards to buy meme coins; transactions are classified as “digital goods” rather than crypto purchases, circumventing some card network rules. Compliance arbitrage can acquire users in the short term, but in the long run it still depends on how regulators draw the boundaries.
$COTI #Robinhood #Meme币 #compliance
$COTI #Robinhood #Meme币 #compliance
1
81
·
--
BlackRock’s latest disclosed 2026 Q2 holdings show that assets under management on the watchlist stand at $6.7 trillion.
Breaking down the portfolio structure, the weights of technology and semiconductors are already so high that they can no longer be ignored. The top five holdings are Nvidia at 5.8%, Apple at 5.0%, Alphabet at 4.4%, Microsoft at 3.4%, and Amazon at 2.7%. Add Broadcom at 2.3%, Micron at 1.8%, Meta at 1.5%, and Tesla and AMD at 1.3% each, and these hard-tech and platform-type companies together account for nearly one-third of total assets.
For such large institutions, the concentration at the top is largely determined by passive index weighting, rather than purely active bets. But when nearly one-third of the combination held by the world’s largest players is tied to only a handful of technology companies, the effect of valuation fluctuations on the overall market is heavier than what may appear on the surface.
For ordinary investors, buying along with the index means what you’re essentially buying is this weight structure. When the tech stock weight is already in a high range, the portfolio’s risk exposure to a single industry is raised accordingly.
$NVDA $AAPL
BlackRock’s latest disclosed 2026 Q2 holdings show that assets under management on the watchlist stand at $6.7 trillion.
Breaking down the portfolio structure, the weights of technology and semiconductors are already so high that they can no longer be ignored. The top five holdings are Nvidia at 5.8%, Apple at 5.0%, Alphabet at 4.4%, Microsoft at 3.4%, and Amazon at 2.7%. Add Broadcom at 2.3%, Micron at 1.8%, Meta at 1.5%, and Tesla and AMD at 1.3% each, and these hard-tech and platform-type companies together account for nearly one-third of total assets.
For such large institutions, the concentration at the top is largely determined by passive index weighting, rather than purely active bets. But when nearly one-third of the combination held by the world’s largest players is tied to only a handful of technology companies, the effect of valuation fluctuations on the overall market is heavier than what may appear on the surface.
For ordinary investors, buying along with the index means what you’re essentially buying is this weight structure. When the tech stock weight is already in a high range, the portfolio’s risk exposure to a single industry is raised accordingly.
$NVDA $AAPL
Breaking down the portfolio structure, the weights of technology and semiconductors are already so high that they can no longer be ignored. The top five holdings are Nvidia at 5.8%, Apple at 5.0%, Alphabet at 4.4%, Microsoft at 3.4%, and Amazon at 2.7%. Add Broadcom at 2.3%, Micron at 1.8%, Meta at 1.5%, and Tesla and AMD at 1.3% each, and these hard-tech and platform-type companies together account for nearly one-third of total assets.
For such large institutions, the concentration at the top is largely determined by passive index weighting, rather than purely active bets. But when nearly one-third of the combination held by the world’s largest players is tied to only a handful of technology companies, the effect of valuation fluctuations on the overall market is heavier than what may appear on the surface.
For ordinary investors, buying along with the index means what you’re essentially buying is this weight structure. When the tech stock weight is already in a high range, the portfolio’s risk exposure to a single industry is raised accordingly.
$NVDA $AAPL
2
70
·
--
Bitcoin spot ETF trading volume surged week over week to $22 billion, setting a new high for this cycle.
The chart is from checkonchain. The stacked columns show major allocations such as IBIT, FBTC, and ARKB all expanding in tandem, while the black line indicates that BTC’s spot price was in a high-range consolidation during the same period.
A spike in trading volume usually has two interpretations. One is that incremental capital is proactively stepping in; institutions’ willingness to allocate to bitcoin via the ETF channel is heating up. The other is that turnover among existing positions accelerates—heightened price volatility drives short-term funds to enter and exit more frequently. Looking at trading volume alone can’t distinguish between the two; it needs to be assessed together with net inflow data.
Worth noting is that increased activity through the ETF channel can change the structure of BTC’s marginal price-setting power. When spot ETF holdings become large enough, the liquidity rhythm of traditional markets is likely to transmit more into the crypto space, and the volatility characteristics previously determined purely by internal crypto supply and demand may weaken.
$BTC
Bitcoin spot ETF trading volume surged week over week to $22 billion, setting a new high for this cycle.
The chart is from checkonchain. The stacked columns show major allocations such as IBIT, FBTC, and ARKB all expanding in tandem, while the black line indicates that BTC’s spot price was in a high-range consolidation during the same period.
A spike in trading volume usually has two interpretations. One is that incremental capital is proactively stepping in; institutions’ willingness to allocate to bitcoin via the ETF channel is heating up. The other is that turnover among existing positions accelerates—heightened price volatility drives short-term funds to enter and exit more frequently. Looking at trading volume alone can’t distinguish between the two; it needs to be assessed together with net inflow data.
Worth noting is that increased activity through the ETF channel can change the structure of BTC’s marginal price-setting power. When spot ETF holdings become large enough, the liquidity rhythm of traditional markets is likely to transmit more into the crypto space, and the volatility characteristics previously determined purely by internal crypto supply and demand may weaken.
$BTC
The chart is from checkonchain. The stacked columns show major allocations such as IBIT, FBTC, and ARKB all expanding in tandem, while the black line indicates that BTC’s spot price was in a high-range consolidation during the same period.
A spike in trading volume usually has two interpretations. One is that incremental capital is proactively stepping in; institutions’ willingness to allocate to bitcoin via the ETF channel is heating up. The other is that turnover among existing positions accelerates—heightened price volatility drives short-term funds to enter and exit more frequently. Looking at trading volume alone can’t distinguish between the two; it needs to be assessed together with net inflow data.
Worth noting is that increased activity through the ETF channel can change the structure of BTC’s marginal price-setting power. When spot ETF holdings become large enough, the liquidity rhythm of traditional markets is likely to transmit more into the crypto space, and the volatility characteristics previously determined purely by internal crypto supply and demand may weaken.
$BTC
1
74
·
--
Bullish
The informed source from the victim side of the Hangzhou drinking-party incident: The girl sought help to no avail and was briefly unconscious when she resisted and was hospitalized#比特币永续合约资金费率创20个月新高 $AAPL.US
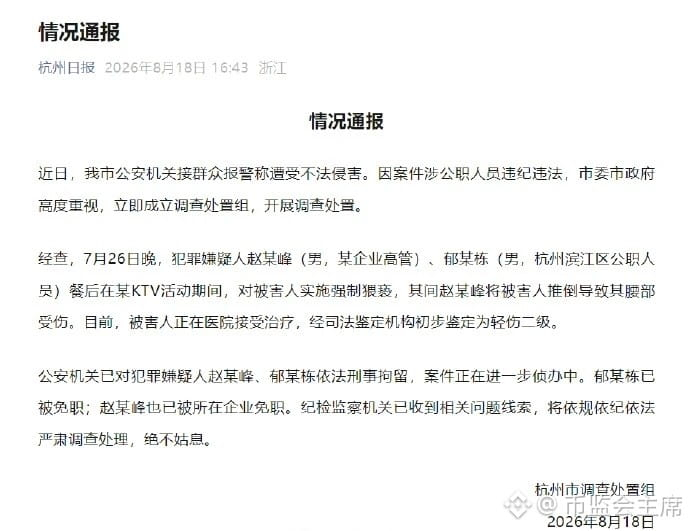
The informed source from the victim side of the Hangzhou drinking-party incident: The girl sought help to no avail and was briefly unconscious when she resisted and was hospitalized#比特币永续合约资金费率创20个月新高 $AAPL.US
14
·
--
Satoshi Nakamoto’s Bitcoin just lies there quietly.
Single signature. The key was created on a computer connected to the internet. No complicated multisig setup. No carefully designed custodial architecture.
17 years later, no one stole them.#中国7月产出零售投资全线不及预期 $GOOGL.US
Satoshi Nakamoto’s Bitcoin just lies there quietly.
Single signature. The key was created on a computer connected to the internet. No complicated multisig setup. No carefully designed custodial architecture.
17 years later, no one stole them.#中国7月产出零售投资全线不及预期 $GOOGL.US
Single signature. The key was created on a computer connected to the internet. No complicated multisig setup. No carefully designed custodial architecture.
17 years later, no one stole them.#中国7月产出零售投资全线不及预期 $GOOGL.US
1
2
90
·
--
#SpaceX股价涨至140美元 $PORTAL Quant Trading Giant Exposed: Loses $15 Billion in a Single Month
In July, U.S. high-frequency trading market maker Jane Street recorded losses of about $15 billion. Insiders said the quant giant disclosed this figure to its lenders. For Jane Street, it is a rare setback. In recent years, Jane Street has become one of the key players in global markets. Before this loss occurred, the firm’s quarterly performance had been setting records for itself. Caixin previously noted that Jane Street achieved a record net trading income of $16.1 billion in the first quarter this year, surpassing Wall Street’s top investment banks and competitors such as Castle Securities and Hudson River Trading. Insiders said that even after factoring in the July loss, Jane Street’s net trading income over the past year through Friday still exceeded $40 billion.
Jane Street’s massive July loss came amid extreme volatility in U.S. artificial intelligence (AI) stocks. After a strong rally during most of 2026, AI shares saw a sharp reversal in July, plunging rapidly. The selloff also hit several hedge funds focused on AI, including Situational Awareness, led by “AI prodigy” Leopold Aschenbrenner—Jane Street is one of the investors in that fund. It is worth noting that Jane Street’s investment in Situational Awareness is unusual: it primarily trades using its own capital. Insiders said the two companies are closely connected—one former Jane Street employee previously worked at Situational Awareness
#SpaceX股价涨至140美元 $PORTAL Quant Trading Giant Exposed: Loses $15 Billion in a Single Month
In July, U.S. high-frequency trading market maker Jane Street recorded losses of about $15 billion. Insiders said the quant giant disclosed this figure to its lenders. For Jane Street, it is a rare setback. In recent years, Jane Street has become one of the key players in global markets. Before this loss occurred, the firm’s quarterly performance had been setting records for itself. Caixin previously noted that Jane Street achieved a record net trading income of $16.1 billion in the first quarter this year, surpassing Wall Street’s top investment banks and competitors such as Castle Securities and Hudson River Trading. Insiders said that even after factoring in the July loss, Jane Street’s net trading income over the past year through Friday still exceeded $40 billion.
Jane Street’s massive July loss came amid extreme volatility in U.S. artificial intelligence (AI) stocks. After a strong rally during most of 2026, AI shares saw a sharp reversal in July, plunging rapidly. The selloff also hit several hedge funds focused on AI, including Situational Awareness, led by “AI prodigy” Leopold Aschenbrenner—Jane Street is one of the investors in that fund. It is worth noting that Jane Street’s investment in Situational Awareness is unusual: it primarily trades using its own capital. Insiders said the two companies are closely connected—one former Jane Street employee previously worked at Situational Awareness
In July, U.S. high-frequency trading market maker Jane Street recorded losses of about $15 billion. Insiders said the quant giant disclosed this figure to its lenders. For Jane Street, it is a rare setback. In recent years, Jane Street has become one of the key players in global markets. Before this loss occurred, the firm’s quarterly performance had been setting records for itself. Caixin previously noted that Jane Street achieved a record net trading income of $16.1 billion in the first quarter this year, surpassing Wall Street’s top investment banks and competitors such as Castle Securities and Hudson River Trading. Insiders said that even after factoring in the July loss, Jane Street’s net trading income over the past year through Friday still exceeded $40 billion.
Jane Street’s massive July loss came amid extreme volatility in U.S. artificial intelligence (AI) stocks. After a strong rally during most of 2026, AI shares saw a sharp reversal in July, plunging rapidly. The selloff also hit several hedge funds focused on AI, including Situational Awareness, led by “AI prodigy” Leopold Aschenbrenner—Jane Street is one of the investors in that fund. It is worth noting that Jane Street’s investment in Situational Awareness is unusual: it primarily trades using its own capital. Insiders said the two companies are closely connected—one former Jane Street employee previously worked at Situational Awareness
2
23
·
--
Reddit (RDDT) confirms inclusion in the S&P 500, effective before market open on August 18, replacing the acquired AVB. It briefly surged about 11% after hours.
Passive buying from index funds is real, tangible demand. But getting added to the index isn’t a free lunch—historically, many stocks have “announced a rise and been included in a decline.”
This is similar to the logic behind ETF approvals in the crypto asset space: forced buying supports underlying structural demand, but “buy the expectation, sell the fact” holds true on both sides. Traditional finance is accelerating its absorption of community-based assets—this is a signal worth watching for the crypto market.
$RDDT.US #美股 #标普500 #被动买盘
Reddit (RDDT) confirms inclusion in the S&P 500, effective before market open on August 18, replacing the acquired AVB. It briefly surged about 11% after hours.
Passive buying from index funds is real, tangible demand. But getting added to the index isn’t a free lunch—historically, many stocks have “announced a rise and been included in a decline.”
This is similar to the logic behind ETF approvals in the crypto asset space: forced buying supports underlying structural demand, but “buy the expectation, sell the fact” holds true on both sides. Traditional finance is accelerating its absorption of community-based assets—this is a signal worth watching for the crypto market.
$RDDT .US #美股 #标普500 #被动买盘
Passive buying from index funds is real, tangible demand. But getting added to the index isn’t a free lunch—historically, many stocks have “announced a rise and been included in a decline.”
This is similar to the logic behind ETF approvals in the crypto asset space: forced buying supports underlying structural demand, but “buy the expectation, sell the fact” holds true on both sides. Traditional finance is accelerating its absorption of community-based assets—this is a signal worth watching for the crypto market.
$RDDT .US #美股 #标普500 #被动买盘
3
84
·
--
This week, the US July CPI and PPI data are set to be released, and market attention is shifting back to the inflation path and rate-cut expectations.
CPI reflects overall price pressure, while PPI provides a leading indication of cost pressures on the corporate side; together, they shape the Federal Reserve’s policy room. If the data come in below expectations, rate-cut expectations often heat up; if they exceed expectations, short-term volatility in risk assets may be amplified.
For the crypto market, expectations for macro liquidity remain an important contextual variable. Volatility typically increases before and after the data release, so position management is often more crucial than directional judgment.
$APR #US July CPI and PPI data to be released this week
This week, the US July CPI and PPI data are set to be released, and market attention is shifting back to the inflation path and rate-cut expectations.
CPI reflects overall price pressure, while PPI provides a leading indication of cost pressures on the corporate side; together, they shape the Federal Reserve’s policy room. If the data come in below expectations, rate-cut expectations often heat up; if they exceed expectations, short-term volatility in risk assets may be amplified.
For the crypto market, expectations for macro liquidity remain an important contextual variable. Volatility typically increases before and after the data release, so position management is often more crucial than directional judgment.
$APR #US July CPI and PPI data to be released this week
CPI reflects overall price pressure, while PPI provides a leading indication of cost pressures on the corporate side; together, they shape the Federal Reserve’s policy room. If the data come in below expectations, rate-cut expectations often heat up; if they exceed expectations, short-term volatility in risk assets may be amplified.
For the crypto market, expectations for macro liquidity remain an important contextual variable. Volatility typically increases before and after the data release, so position management is often more crucial than directional judgment.
$APR #US July CPI and PPI data to be released this week
2
47
·
--
I scrolled to a video about “70 beauty micro-habits” and, after watching, felt that this logic is actually the same as investing.
Nothing in the video—early sleep, exercise, skincare, diet—shows results immediately. Everything relies on building it day by day. Many people give up after three days when they don’t see changes, but what truly widens the gap is precisely the following dozens of days and hundreds of days.
It’s the same in the crypto market. People ask every day: which coin will rise tomorrow, which track will explode next week. But the ones that really run are often those who do a few dull things solidly first—understand their own risk tolerance, set a maximum position limit, don’t panic-buy when it drops, don’t get carried away when it rises, and then simply wait patiently for the cycle.
Compounding fears two things most: interruption and impulsive moves. Hear one theory today and change your strategy once; tomorrow you switch to another asset—time is all spent starting over, while the principal just stays where it is.
My own experience is that treating “do a little every day” as a habit is far more useful than “go all out once in a while.” Whether it’s getting better looking or getting richer, the path is pretty much the same: repeat simple actions until they bring about a qualitative change. Don’t expect shortcuts—most shortcuts are really just taking your principal.
标签 $COTI #复利 #自律 #长期主义
I scrolled to a video about “70 beauty micro-habits” and, after watching, felt that this logic is actually the same as investing.
Nothing in the video—early sleep, exercise, skincare, diet—shows results immediately. Everything relies on building it day by day. Many people give up after three days when they don’t see changes, but what truly widens the gap is precisely the following dozens of days and hundreds of days.
It’s the same in the crypto market. People ask every day: which coin will rise tomorrow, which track will explode next week. But the ones that really run are often those who do a few dull things solidly first—understand their own risk tolerance, set a maximum position limit, don’t panic-buy when it drops, don’t get carried away when it rises, and then simply wait patiently for the cycle.
Compounding fears two things most: interruption and impulsive moves. Hear one theory today and change your strategy once; tomorrow you switch to another asset—time is all spent starting over, while the principal just stays where it is.
My own experience is that treating “do a little every day” as a habit is far more useful than “go all out once in a while.” Whether it’s getting better looking or getting richer, the path is pretty much the same: repeat simple actions until they bring about a qualitative change. Don’t expect shortcuts—most shortcuts are really just taking your principal.
标签 $COTI #复利 #自律 #长期主义
Nothing in the video—early sleep, exercise, skincare, diet—shows results immediately. Everything relies on building it day by day. Many people give up after three days when they don’t see changes, but what truly widens the gap is precisely the following dozens of days and hundreds of days.
It’s the same in the crypto market. People ask every day: which coin will rise tomorrow, which track will explode next week. But the ones that really run are often those who do a few dull things solidly first—understand their own risk tolerance, set a maximum position limit, don’t panic-buy when it drops, don’t get carried away when it rises, and then simply wait patiently for the cycle.
Compounding fears two things most: interruption and impulsive moves. Hear one theory today and change your strategy once; tomorrow you switch to another asset—time is all spent starting over, while the principal just stays where it is.
My own experience is that treating “do a little every day” as a habit is far more useful than “go all out once in a while.” Whether it’s getting better looking or getting richer, the path is pretty much the same: repeat simple actions until they bring about a qualitative change. Don’t expect shortcuts—most shortcuts are really just taking your principal.
标签 $COTI #复利 #自律 #长期主义
2
78
·
--
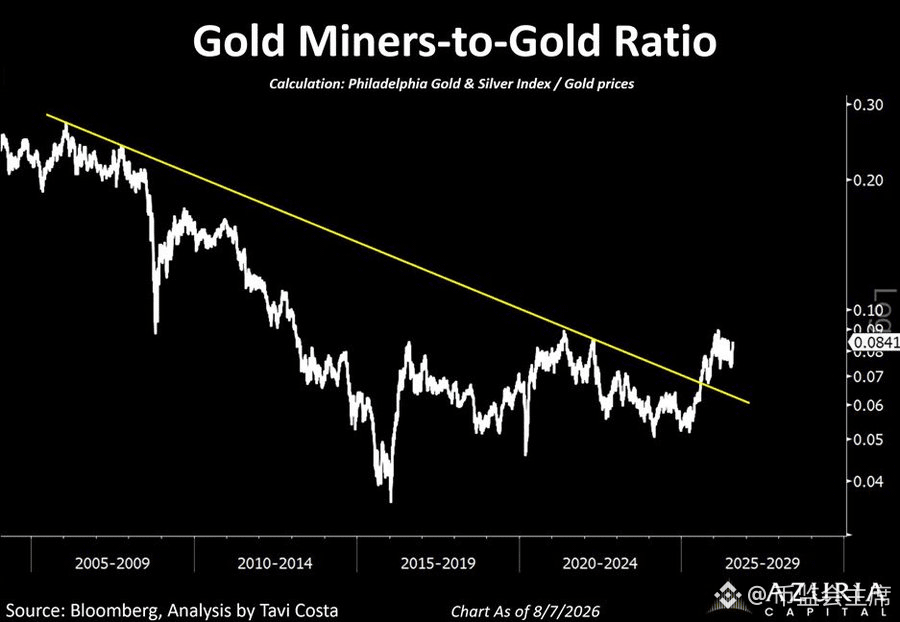
Seeing this chart, the ratio between gold mining stocks and the gold price has finally broken through a downward trend line that has lasted for more than ten years. The current ratio is roughly around 0.084.
Over the past nearly 20 years, the overall performance of gold mining stocks has failed to beat gold itself. The reason is also quite simple: as the gold price rises, costs rise as well; share dilution, environmental protection, and geopolitical risk come in waves one after another, causing the stocks’ sensitivity to weaken over time. But when the ratio breaks the trend line, it implies that capital is starting to re-price “equity that can produce gold” again, beyond just “physical gold.”
I think this has reference value for crypto assets. Many people compare BTC to digital gold, and mining stocks to mining company stocks. But BTC itself does not have the problem of expanding extraction costs, nor does it face resource risk tied to a single country. So, in the “scarcity narrative,” BTC is cleaner than gold mining stocks, but in terms of “discounted cash flow,” it’s not as good as mature mining companies that pay dividends.
In other words, BTC and gold mining stocks are two variants of the gold narrative: one locks in scarcity through protocol rules, and the other amplifies the gold price through corporate earnings. A breakout in the ratio suggests the market is shifting from “buying only gold” to “buying gold-related assets,” with risk appetite moving up one notch.
My own approach is to treat it as an indirect signal: when traditional markets are willing to pay a premium for higher-risk gold-related assets, high-beta positions in the crypto market typically benefit as well. But I don’t chase when it’s already at a high level—I use it only as a reference for position sizing.
Tag $COTI #黄金 #资产配置 #cryptocurrency
Seeing this chart, the ratio between gold mining stocks and the gold price has finally broken through a downward trend line that has lasted for more than ten years. The current ratio is roughly around 0.084.
Over the past nearly 20 years, the overall performance of gold mining stocks has failed to beat gold itself. The reason is also quite simple: as the gold price rises, costs rise as well; share dilution, environmental protection, and geopolitical risk come in waves one after another, causing the stocks’ sensitivity to weaken over time. But when the ratio breaks the trend line, it implies that capital is starting to re-price “equity that can produce gold” again, beyond just “physical gold.”
I think this has reference value for crypto assets. Many people compare BTC to digital gold, and mining stocks to mining company stocks. But BTC itself does not have the problem of expanding extraction costs, nor does it face resource risk tied to a single country. So, in the “scarcity narrative,” BTC is cleaner than gold mining stocks, but in terms of “discounted cash flow,” it’s not as good as mature mining companies that pay dividends.
In other words, BTC and gold mining stocks are two variants of the gold narrative: one locks in scarcity through protocol rules, and the other amplifies the gold price through corporate earnings. A breakout in the ratio suggests the market is shifting from “buying only gold” to “buying gold-related assets,” with risk appetite moving up one notch.
My own approach is to treat it as an indirect signal: when traditional markets are willing to pay a premium for higher-risk gold-related assets, high-beta positions in the crypto market typically benefit as well. But I don’t chase when it’s already at a high level—I use it only as a reference for position sizing.
Tag $COTI #黄金 #资产配置 #cryptocurrency
Over the past nearly 20 years, the overall performance of gold mining stocks has failed to beat gold itself. The reason is also quite simple: as the gold price rises, costs rise as well; share dilution, environmental protection, and geopolitical risk come in waves one after another, causing the stocks’ sensitivity to weaken over time. But when the ratio breaks the trend line, it implies that capital is starting to re-price “equity that can produce gold” again, beyond just “physical gold.”
I think this has reference value for crypto assets. Many people compare BTC to digital gold, and mining stocks to mining company stocks. But BTC itself does not have the problem of expanding extraction costs, nor does it face resource risk tied to a single country. So, in the “scarcity narrative,” BTC is cleaner than gold mining stocks, but in terms of “discounted cash flow,” it’s not as good as mature mining companies that pay dividends.
In other words, BTC and gold mining stocks are two variants of the gold narrative: one locks in scarcity through protocol rules, and the other amplifies the gold price through corporate earnings. A breakout in the ratio suggests the market is shifting from “buying only gold” to “buying gold-related assets,” with risk appetite moving up one notch.
My own approach is to treat it as an indirect signal: when traditional markets are willing to pay a premium for higher-risk gold-related assets, high-beta positions in the crypto market typically benefit as well. But I don’t chase when it’s already at a high level—I use it only as a reference for position sizing.
Tag $COTI #黄金 #资产配置 #cryptocurrency
1
84
·
--
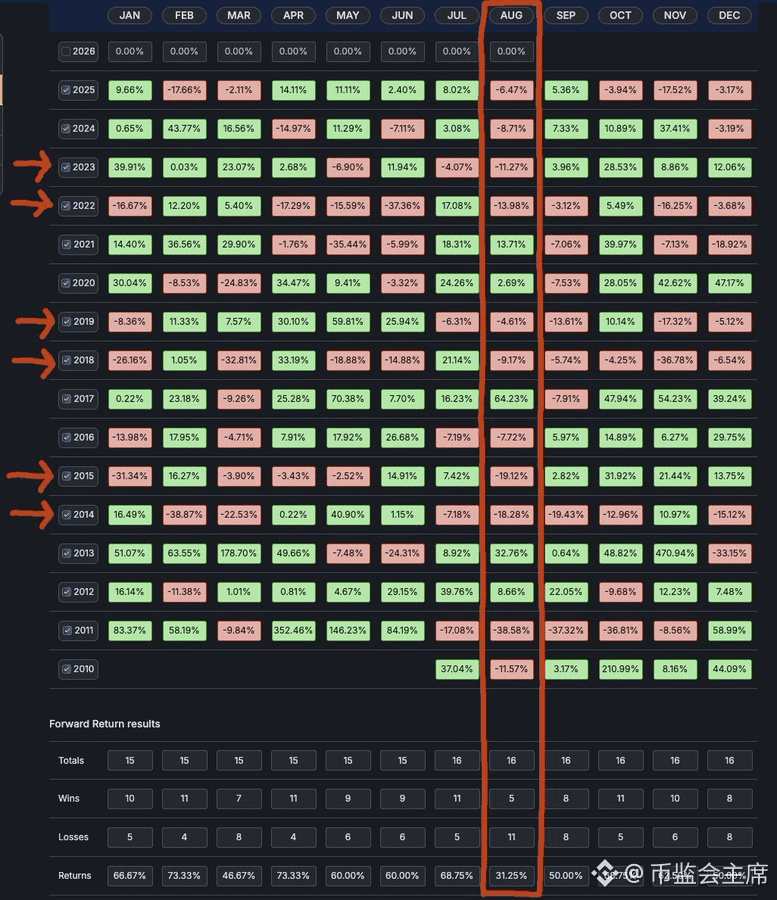
August historical win rate is only 31.25%—when you lay out monthly returns from the past more than ten years, August really is one of the weaker months of the year.
But historical data is just statistics, not a forecast. For a highly volatile asset like crypto, the key isn’t to guess which month will fall—it’s whether you’ve kept enough cash and whether your position sizing can withstand volatility.
Panic and FOMO both easily lead to wrong decisions when emotions are at their peak. Discipline matters more than the month.
$COTI #Web3 #宏观 #risk management
August historical win rate is only 31.25%—when you lay out monthly returns from the past more than ten years, August really is one of the weaker months of the year.
But historical data is just statistics, not a forecast. For a highly volatile asset like crypto, the key isn’t to guess which month will fall—it’s whether you’ve kept enough cash and whether your position sizing can withstand volatility.
Panic and FOMO both easily lead to wrong decisions when emotions are at their peak. Discipline matters more than the month.
$COTI #Web3 #宏观 #risk management
But historical data is just statistics, not a forecast. For a highly volatile asset like crypto, the key isn’t to guess which month will fall—it’s whether you’ve kept enough cash and whether your position sizing can withstand volatility.
Panic and FOMO both easily lead to wrong decisions when emotions are at their peak. Discipline matters more than the month.
$COTI #Web3 #宏观 #risk management
2
100
·
--
Today BTC lowest likely look at 62,350 (day+1H lower Bollinger band resonance support; if it breaks, then further down to 62,350 (day+1H lower Bollinger band resonance support; if it breaks, then down to 62,200 / 58,000), with a high possibly touching 58,000). The high then touched 64,200 (1H upper Bollinger band + day EMA20 resistance pressure). Current price 62,953 has already fallen below 63,800’s key level (the “gate”); most likely it will stay weak and churn within the $62,350–64,200 range corridor.
Today BTC lowest likely look at 62,350 (day+1H lower Bollinger band resonance support; if it breaks, then further down to 62,350 (day+1H lower Bollinger band resonance support; if it breaks, then down to 62,200 / 58,000), with a high possibly touching 58,000). The high then touched 64,200 (1H upper Bollinger band + day EMA20 resistance pressure). Current price 62,953 has already fallen below 63,800’s key level (the “gate”); most likely it will stay weak and churn within the $62,350–64,200 range corridor.
2
76
Log in to explore more content
Join global crypto users on Binance Square
⚡️ Get latest and useful information about crypto.
💬 Trusted by the world’s largest crypto exchange.
👍 Discover real insights from verified creators.
Email / Phone number
Trending Topics
USAugustPPIRisesLessThanExpected
71,040 views
965 Discussing
🚨 US AUG PPI: Rises LESS Than Expected! Bullish for Crypto? 🚀
PPI +0.4% MoM as expected, but CORE PPI only +0.2% vs +0.3% expected - cooling!
What it means:
• Wholesale inflation softer than feared
• Fed rate hike chance now 62% - but dovish signals coming
• Core PCE revisions expected downward - bullish
• BTC usually pumps on softer PPI
Fed meeting Sep 15-16 - Market now expects pause, not hike?
Is this the green light for Q4 rally?
#Bitcoin #PPI #Fed #CryptoNews #BTC#usaugustppiriseslessthanexpected
True News
·2 Likes
·1.4k views
SECApprovesNasdaqTexasCommodityTrustRule
36,483 views
656 Discussing
ECBRaisesRatesSecondTimeTo2.5%
32,273 views
467 Discussing