

chtabishali
4 Posts

chtabishali
Report
Block User
making my way to understand this street
Open Trade

SOL Holder
Occasional Trader
4.2 Years
0 Following
3 Followers
0 Liked
Posts
Portfolio
·
--
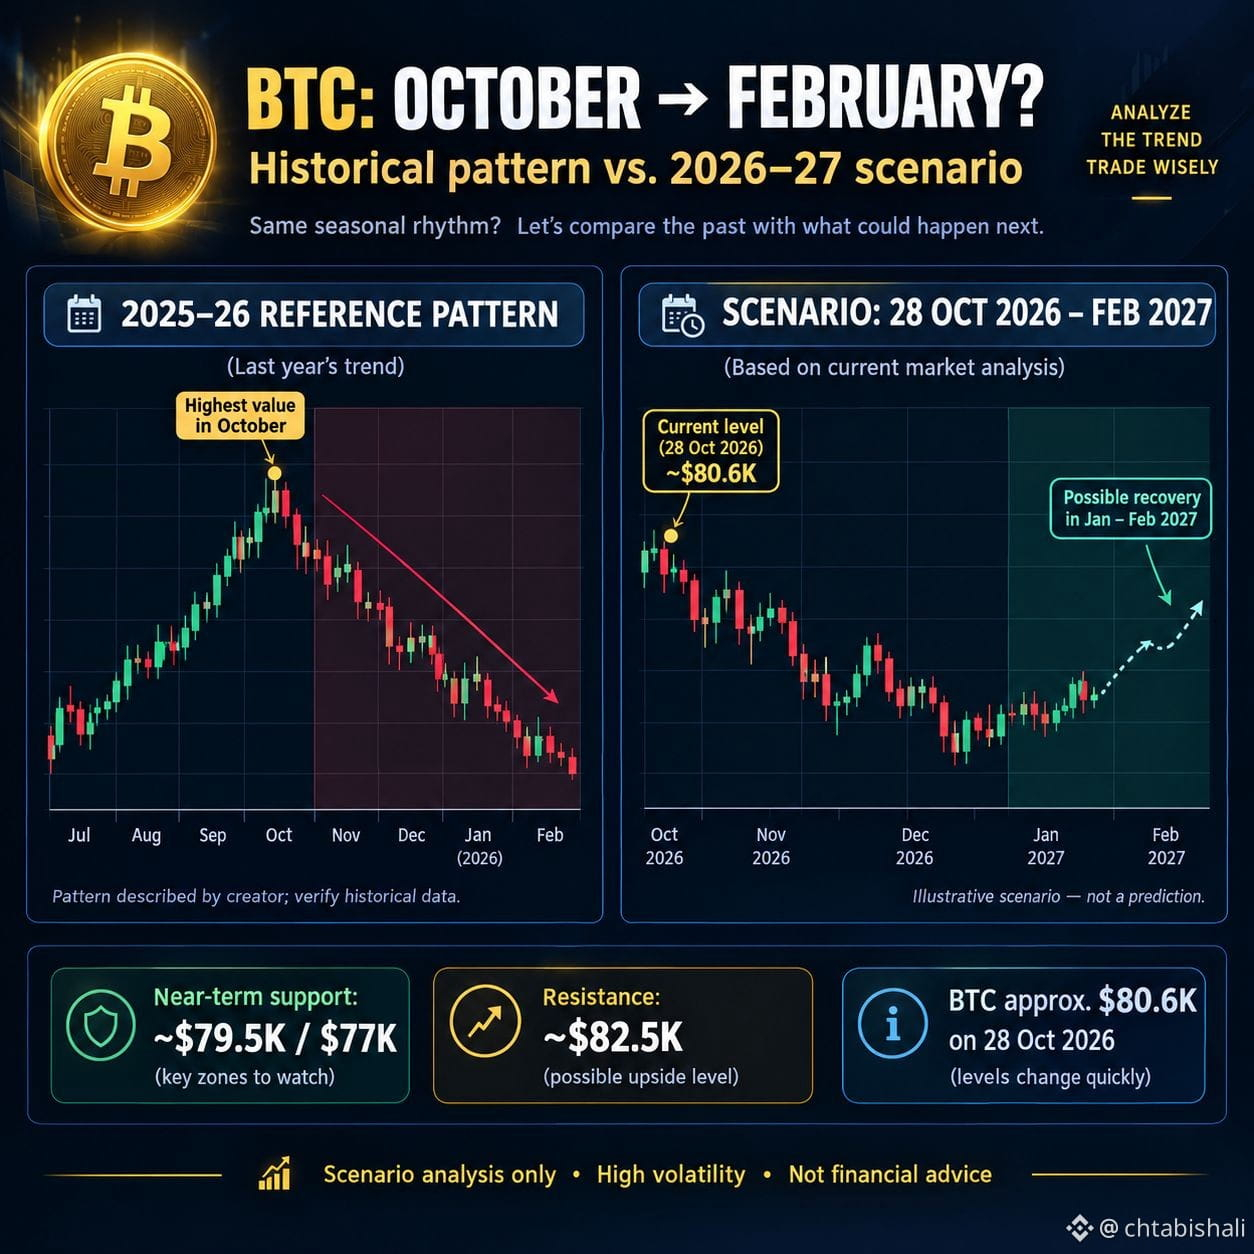
₿ BITCOIN (BTC): WILL HISTORY REPEAT ITSELF? 📉📈
October 2025 – February 2026 vs. October 2026 – February 2027
Bitcoin has experienced powerful market cycles, and one pattern worth investigating is whether an October peak can be followed by several months of weakness into February.
But here's the big question: Will BTC repeat the same pattern this year, or is the market preparing for a recovery?
🔎 MY MARKET ANALYSIS | 28 OCTOBER 2026
BTC is trading around $80,600, with the market facing important technical levels.
📉 BEARISH SCENARIO
If BTC loses the $79,500 support zone and selling pressure increases, the next area to watch is around $77,000. A sustained breakdown could expose the market to further downside.
📈 BULLISH SCENARIO
If BTC reclaims $82,500 and holds above it, buying momentum could strengthen and open the door to a recovery.
🗓️ MY OUTLOOK: OCTOBER 2026 – FEBRUARY 2027
My illustrative scenario allows for continued volatility and a possible further decline before a recovery attempt in January or February.
However, a deeper correction or an earlier bullish reversal remains possible. The market must confirm the direction.
🎯 THE KEY QUESTION
Will February 2027 mark another recovery opportunity, or will Bitcoin surprise everyone by breaking its historical pattern?
💬 What do you think?
1️⃣ BTC drops further before recovering.
2️⃣ BTC starts a new rally before February.
3️⃣ BTC remains bearish into February 2027.
Share your analysis in the comments!
⚠️ Disclaimer: This is an educational market scenario, not a guaranteed forecast or financial advice. Cryptocurrency is highly volatile. Always do your own research and manage your risk.
#Bitcoin #BTC #CryptoAnalysis #BitcoinPrediction #BinanceSquare #CryptoMarket #TechnicalAnalysis
$BTC
{spot}(BTCUSDT)
₿ BITCOIN (BTC): WILL HISTORY REPEAT ITSELF? 📉📈
October 2025 – February 2026 vs. October 2026 – February 2027
Bitcoin has experienced powerful market cycles, and one pattern worth investigating is whether an October peak can be followed by several months of weakness into February.
But here's the big question: Will BTC repeat the same pattern this year, or is the market preparing for a recovery?
🔎 MY MARKET ANALYSIS | 28 OCTOBER 2026
BTC is trading around $80,600, with the market facing important technical levels.
📉 BEARISH SCENARIO
If BTC loses the $79,500 support zone and selling pressure increases, the next area to watch is around $77,000. A sustained breakdown could expose the market to further downside.
📈 BULLISH SCENARIO
If BTC reclaims $82,500 and holds above it, buying momentum could strengthen and open the door to a recovery.
🗓️ MY OUTLOOK: OCTOBER 2026 – FEBRUARY 2027
My illustrative scenario allows for continued volatility and a possible further decline before a recovery attempt in January or February.
However, a deeper correction or an earlier bullish reversal remains possible. The market must confirm the direction.
🎯 THE KEY QUESTION
Will February 2027 mark another recovery opportunity, or will Bitcoin surprise everyone by breaking its historical pattern?
💬 What do you think?
1️⃣ BTC drops further before recovering.
2️⃣ BTC starts a new rally before February.
3️⃣ BTC remains bearish into February 2027.
Share your analysis in the comments!
⚠️ Disclaimer: This is an educational market scenario, not a guaranteed forecast or financial advice. Cryptocurrency is highly volatile. Always do your own research and manage your risk.
#Bitcoin #BTC #CryptoAnalysis #BitcoinPrediction #BinanceSquare #CryptoMarket #TechnicalAnalysis
$BTC
83
·
--
🚀 $SOL Reclaiming Ground: Can Bulls Defend the $100 Floor?
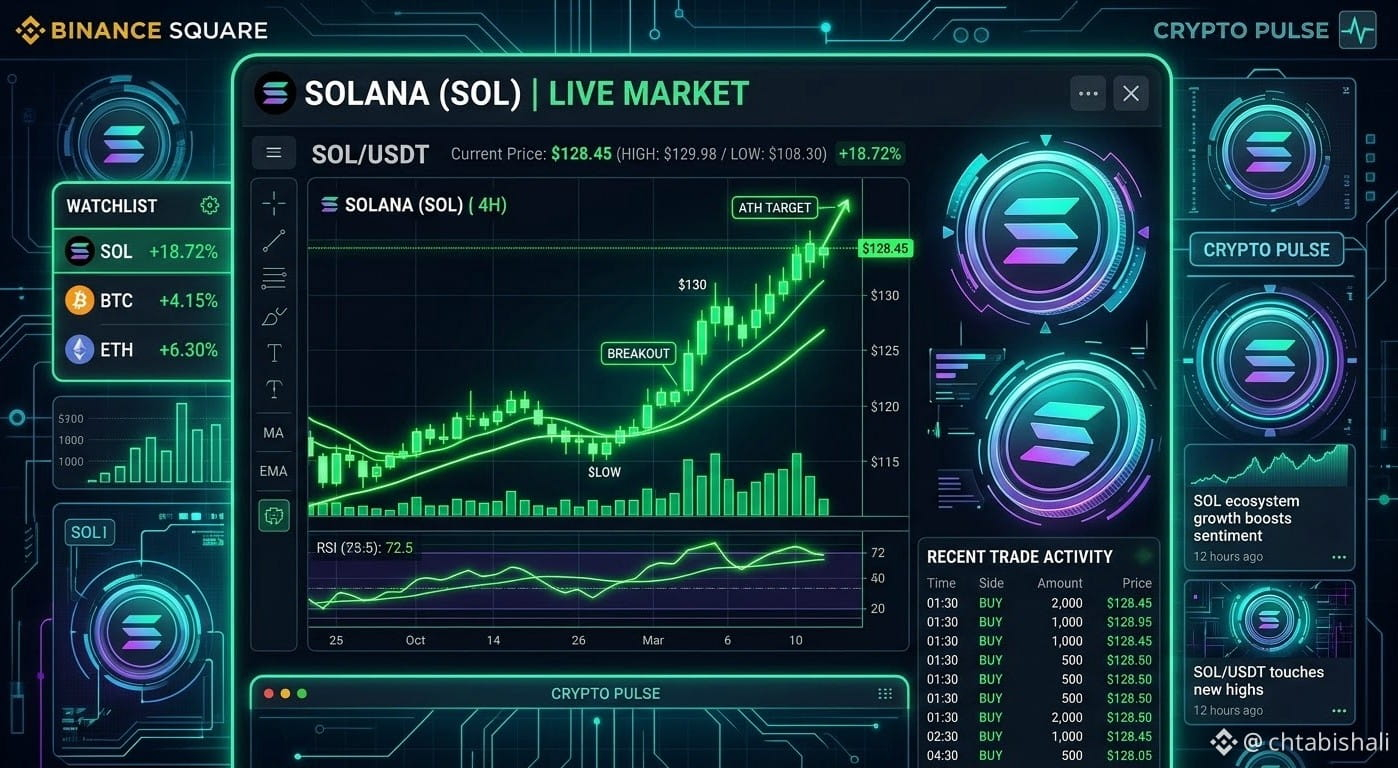
Solana is currently testing the waters around the $101–$102 zone after a solid bounce from its lower range. Buyers continue to strongly defend the psychological $100 support level, showing resilience despite broader market consolidation.
📊 Key Levels to Watch:
🟢 Support Zone: $99.00 – $100.50
⚡ Immediate Resistance: $102.50 – $104.00
🎯 Next Bullish Target: $106.00 – $110.00
With momentum stabilizing on the lower timeframes, a clean breakout above resistance could ignite the next leg upward. However, risk management remains key while the market tests these crucial technical boundaries.
👉 What's your strategy? Are you accumulating at these levels or waiting for a deeper dip? Let's discuss in the comments!
#Solana #SOL #CryptoTrading #BinanceSquare #Write2Earn $SOL
{spot}(SOLUSDT)
🚀 $SOL Reclaiming Ground: Can Bulls Defend the $100 Floor?
Solana is currently testing the waters around the $101–$102 zone after a solid bounce from its lower range. Buyers continue to strongly defend the psychological $100 support level, showing resilience despite broader market consolidation.
📊 Key Levels to Watch:
🟢 Support Zone: $99.00 – $100.50
⚡ Immediate Resistance: $102.50 – $104.00
🎯 Next Bullish Target: $106.00 – $110.00
With momentum stabilizing on the lower timeframes, a clean breakout above resistance could ignite the next leg upward. However, risk management remains key while the market tests these crucial technical boundaries.
👉 What's your strategy? Are you accumulating at these levels or waiting for a deeper dip? Let's discuss in the comments!
#Solana #SOL #CryptoTrading #BinanceSquare #Write2Earn $SOL
92
Log in to explore more content
Join global crypto users on Binance Square
⚡️ Get latest and useful information about crypto.
💬 Trusted by the world’s largest crypto exchange.
👍 Discover real insights from verified creators.
Email / Phone number
Trending Topics
BinanceProcesses$4.65BWithdrawals
20,305 views
107 Discussing
Binance Processes $4.65 Billion in Withdrawals After Reopening, Net Outflow of $3.64 Billion Equals 2.1% of Its $171 Billion in Assets
Binance News
·38 Likes
·10.9k views
WithdrawalsBack: 15 networks live
7,234 views
126 Discussing
BinanceUpdatesProofofReservesAddresses
117,286 views
1,518 Discussing