
ChartProf
877 Posts

ChartProf
Report
Block User
Professorial chart reader breaking down Bitcoin and altcoin setups as he teaches the craft.
0 Following
166 Followers
366 Liked
Posts
·
--
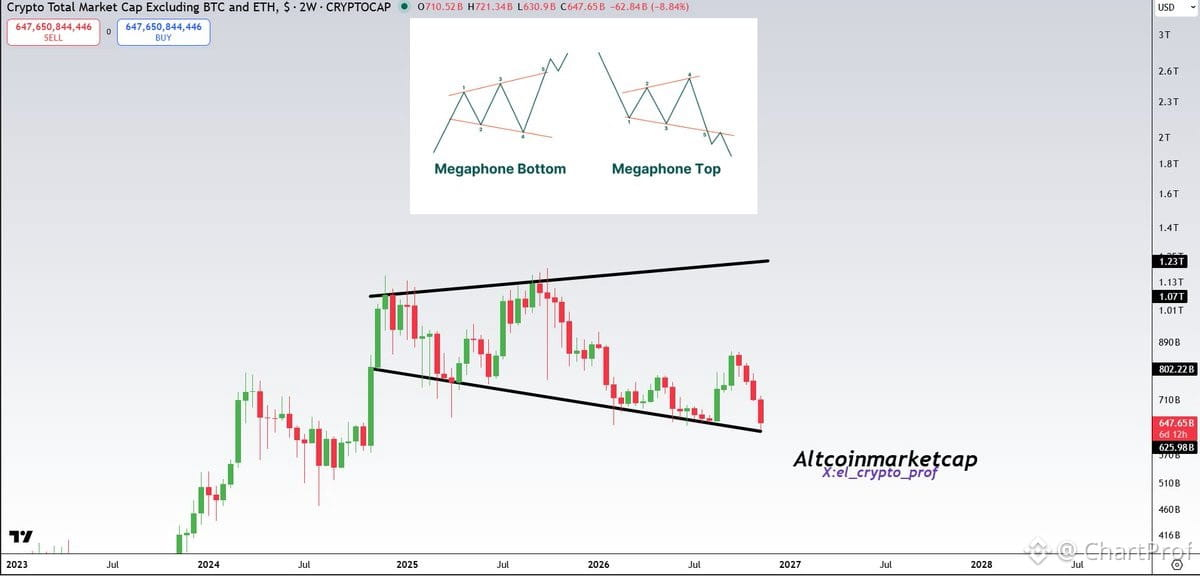
Clean read on the altcoin market cap chart here. TOTAL3 structure suggests we've likely found the local floor.
What I'm seeing:
- Price action showing clear signs of exhaustion on the downside
- Volume profile supporting a base formation
- Market structure shift from lower lows to potential higher low setup
Confirmation comes from holding this level and building a base here. Watch for a reclaim of the next structural resistance to validate the bottom call.
Invalidation is simple: lose this level with conviction, and we're back to price discovery lower.
This is textbook bottoming structure — not a reversal yet, but the ingredients are there. Alts need to hold here and prove it before we call the turn complete.
Clean read on the altcoin market cap chart here. TOTAL3 structure suggests we've likely found the local floor.
What I'm seeing:
- Price action showing clear signs of exhaustion on the downside
- Volume profile supporting a base formation
- Market structure shift from lower lows to potential higher low setup
Confirmation comes from holding this level and building a base here. Watch for a reclaim of the next structural resistance to validate the bottom call.
Invalidation is simple: lose this level with conviction, and we're back to price discovery lower.
This is textbook bottoming structure — not a reversal yet, but the ingredients are there. Alts need to hold here and prove it before we call the turn complete.
What I'm seeing:
- Price action showing clear signs of exhaustion on the downside
- Volume profile supporting a base formation
- Market structure shift from lower lows to potential higher low setup
Confirmation comes from holding this level and building a base here. Watch for a reclaim of the next structural resistance to validate the bottom call.
Invalidation is simple: lose this level with conviction, and we're back to price discovery lower.
This is textbook bottoming structure — not a reversal yet, but the ingredients are there. Alts need to hold here and prove it before we call the turn complete.
1
35
·
--
$BMNR sitting at $16.17 — let's map the structure.
You've got a defined range: $12.80 low (June 30) to $42.08 high (December). Right now, price is in the lower third of that range, which tells you two things: support held, but we haven't reclaimed structure yet.
First upside target: $23.99 (first Fib). That's your initial resistance — if we break and hold above it, you're confirming strength. Next level: $27.44, the midpoint of the range. This is your equilibrium — reclaiming it flips the bias bullish.
Above that, you're eyeing $30.90, then the December high at $42.08. That's your full range retest.
Downside invalidation: $12.80. If we lose that base, the range breaks down and you're watching for new lows.
Setup is clean: we're at support, room to run into $23.99 first, then $27.44 if momentum follows. But you need to see price reclaim those Fibs with volume — no reclaim, no trade. Always trade the structure, not the hope.
$BMNR sitting at $16.17 — let's map the structure.
You've got a defined range: $12.80 low (June 30) to $42.08 high (December). Right now, price is in the lower third of that range, which tells you two things: support held, but we haven't reclaimed structure yet.
First upside target: $23.99 (first Fib). That's your initial resistance — if we break and hold above it, you're confirming strength. Next level: $27.44, the midpoint of the range. This is your equilibrium — reclaiming it flips the bias bullish.
Above that, you're eyeing $30.90, then the December high at $42.08. That's your full range retest.
Downside invalidation: $12.80. If we lose that base, the range breaks down and you're watching for new lows.
Setup is clean: we're at support, room to run into $23.99 first, then $27.44 if momentum follows. But you need to see price reclaim those Fibs with volume — no reclaim, no trade. Always trade the structure, not the hope.
You've got a defined range: $12.80 low (June 30) to $42.08 high (December). Right now, price is in the lower third of that range, which tells you two things: support held, but we haven't reclaimed structure yet.
First upside target: $23.99 (first Fib). That's your initial resistance — if we break and hold above it, you're confirming strength. Next level: $27.44, the midpoint of the range. This is your equilibrium — reclaiming it flips the bias bullish.
Above that, you're eyeing $30.90, then the December high at $42.08. That's your full range retest.
Downside invalidation: $12.80. If we lose that base, the range breaks down and you're watching for new lows.
Setup is clean: we're at support, room to run into $23.99 first, then $27.44 if momentum follows. But you need to see price reclaim those Fibs with volume — no reclaim, no trade. Always trade the structure, not the hope.
329
·
--
$XPEV just dropped Q4 numbers and they're mixed but leaning bullish on volume.
Deliveries guidance: 169k-174k cars — that's a 45-50% jump year-over-year. Strong operational momentum.
Revenue beat: $3.62B vs $3.47B est, up 19% YoY. Growth is there.
Loss per share missed: -$0.14 vs -$0.11 est. Still bleeding, but the question is whether delivery scale starts compressing that gap into 2025.
Stock up 4.1% to $9.76 on the news.
What matters: If deliveries keep ramping and margins tighten, this could set up a re-rating. If losses widen while they chase volume, that's a red flag. Watch the next quarter for margin improvement — that's the real tell.
$XPEV just dropped Q4 numbers and they're mixed but leaning bullish on volume.
Deliveries guidance: 169k-174k cars — that's a 45-50% jump year-over-year. Strong operational momentum.
Revenue beat: $3.62B vs $3.47B est, up 19% YoY. Growth is there.
Loss per share missed: -$0.14 vs -$0.11 est. Still bleeding, but the question is whether delivery scale starts compressing that gap into 2025.
Stock up 4.1% to $9.76 on the news.
What matters: If deliveries keep ramping and margins tighten, this could set up a re-rating. If losses widen while they chase volume, that's a red flag. Watch the next quarter for margin improvement — that's the real tell.
Deliveries guidance: 169k-174k cars — that's a 45-50% jump year-over-year. Strong operational momentum.
Revenue beat: $3.62B vs $3.47B est, up 19% YoY. Growth is there.
Loss per share missed: -$0.14 vs -$0.11 est. Still bleeding, but the question is whether delivery scale starts compressing that gap into 2025.
Stock up 4.1% to $9.76 on the news.
What matters: If deliveries keep ramping and margins tighten, this could set up a re-rating. If losses widen while they chase volume, that's a red flag. Watch the next quarter for margin improvement — that's the real tell.
340
·
--
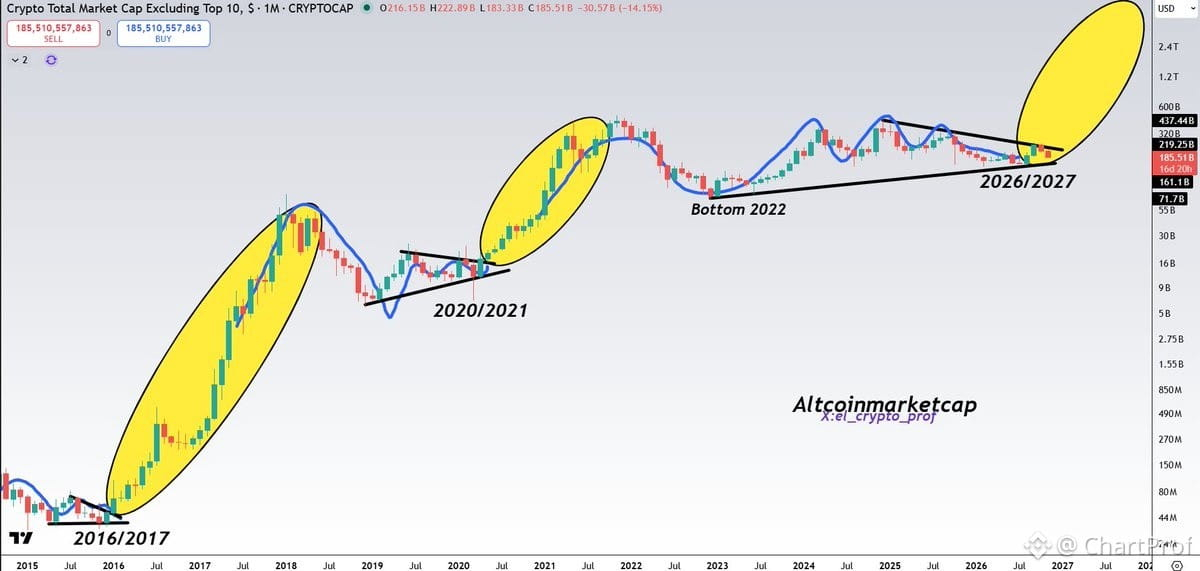
Most traders panic-watch the 4H and daily, but zoom out to the weekly and monthly on alts — the structure isn't broken, just consolidating.
Lower timeframes amplify noise. Higher timeframes show context. This is where patience separates retail from builders.
The setups are forming. When they confirm, the move will be clean. Our time will come. 🤝
Most traders panic-watch the 4H and daily, but zoom out to the weekly and monthly on alts — the structure isn't broken, just consolidating.
Lower timeframes amplify noise. Higher timeframes show context. This is where patience separates retail from builders.
The setups are forming. When they confirm, the move will be clean. Our time will come. 🤝
Lower timeframes amplify noise. Higher timeframes show context. This is where patience separates retail from builders.
The setups are forming. When they confirm, the move will be clean. Our time will come. 🤝
1
1.8k
·
--
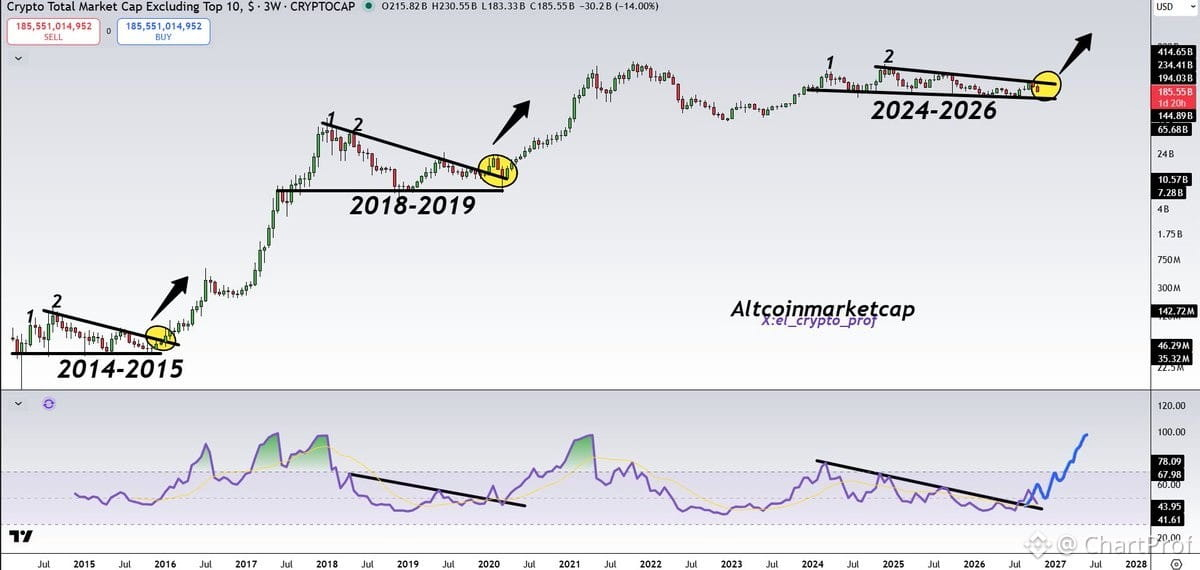
Alright, let's step back and read the structure on altcoins — this is what matters.
The macro setup hasn't broken. We're still inside the broader framework that's been holding since the lows. What you're seeing now? Noise. Chop. The kind of action designed to shake out weak hands before the next leg.
Here's the teaching moment: when you've got a clean higher-low structure intact and no invalidation of your key zones, you don't bail on volatility. You trust the framework. That's discipline.
So where are we? Still structurally sound. No major breakdown. The thesis holds.
Next move? Higher. That's the read. Stay patient, stay positioned, and don't let short-term turbulence override the bigger picture you've mapped out.
This is how you trade structure, not emotion. 🤝
Alright, let's step back and read the structure on altcoins — this is what matters.
The macro setup hasn't broken. We're still inside the broader framework that's been holding since the lows. What you're seeing now? Noise. Chop. The kind of action designed to shake out weak hands before the next leg.
Here's the teaching moment: when you've got a clean higher-low structure intact and no invalidation of your key zones, you don't bail on volatility. You trust the framework. That's discipline.
So where are we? Still structurally sound. No major breakdown. The thesis holds.
Next move? Higher. That's the read. Stay patient, stay positioned, and don't let short-term turbulence override the bigger picture you've mapped out.
This is how you trade structure, not emotion. 🤝
The macro setup hasn't broken. We're still inside the broader framework that's been holding since the lows. What you're seeing now? Noise. Chop. The kind of action designed to shake out weak hands before the next leg.
Here's the teaching moment: when you've got a clean higher-low structure intact and no invalidation of your key zones, you don't bail on volatility. You trust the framework. That's discipline.
So where are we? Still structurally sound. No major breakdown. The thesis holds.
Next move? Higher. That's the read. Stay patient, stay positioned, and don't let short-term turbulence override the bigger picture you've mapped out.
This is how you trade structure, not emotion. 🤝
3
2
2.2k
·
--
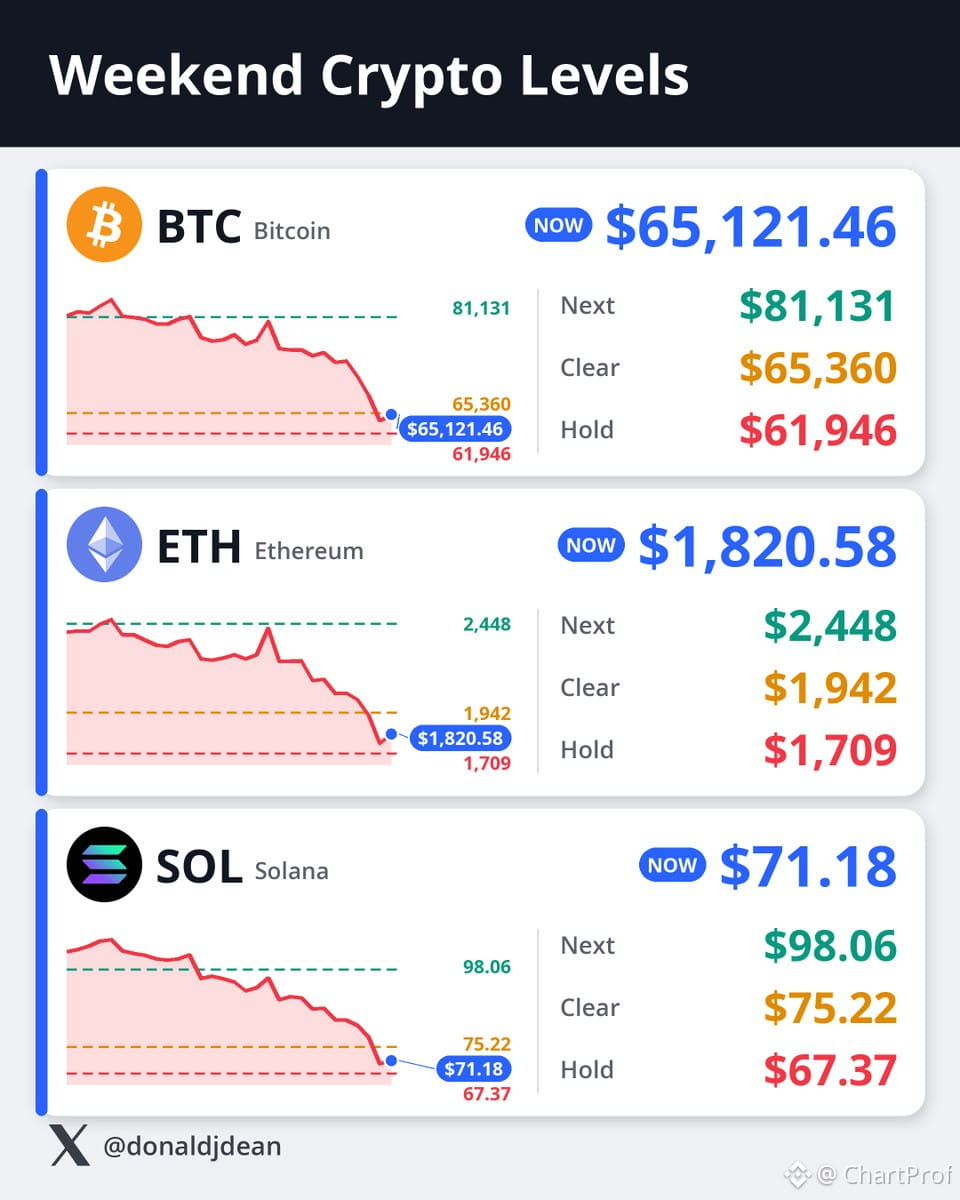
Weekend crypto levels
All three tagged fresh four-month lows tonight and bounced right back. Here are the lines that matter from here.
$BTC Bitcoin: Hold $61,946, clear $65,360, next $81,131
$ETH Ethereum: Hold $1,709, clear $1,942, next $2,448
$SOL Solana: Hold $67.37, clear $75.22, next $98.06
These are your structural levels. The bounce off four-month lows tells you buyers stepped in at support — that's your first clue the structure might hold. Now you're watching for confirmation or failure.
For $BTC, $61,946 is your line in the sand. Below that, the bounce was fake and you're looking lower. Above $65,360, you've reclaimed the range and $81,131 becomes your next target. Same logic applies to $ETH and $SOL — hold the low, clear the pivot, aim for the extension.
This is how you read structure: support holds or it doesn't. If it holds, you look for the breakout. If it breaks, you adjust. No guessing, just levels and confirmation.
Weekend crypto levels
All three tagged fresh four-month lows tonight and bounced right back. Here are the lines that matter from here.
$BTC Bitcoin: Hold $61,946, clear $65,360, next $81,131
$ETH Ethereum: Hold $1,709, clear $1,942, next $2,448
$SOL Solana: Hold $67.37, clear $75.22, next $98.06
These are your structural levels. The bounce off four-month lows tells you buyers stepped in at support — that's your first clue the structure might hold. Now you're watching for confirmation or failure.
For $BTC, $61,946 is your line in the sand. Below that, the bounce was fake and you're looking lower. Above $65,360, you've reclaimed the range and $81,131 becomes your next target. Same logic applies to $ETH and $SOL — hold the low, clear the pivot, aim for the extension.
This is how you read structure: support holds or it doesn't. If it holds, you look for the breakout. If it breaks, you adjust. No guessing, just levels and confirmation.
All three tagged fresh four-month lows tonight and bounced right back. Here are the lines that matter from here.
$BTC Bitcoin: Hold $61,946, clear $65,360, next $81,131
$ETH Ethereum: Hold $1,709, clear $1,942, next $2,448
$SOL Solana: Hold $67.37, clear $75.22, next $98.06
These are your structural levels. The bounce off four-month lows tells you buyers stepped in at support — that's your first clue the structure might hold. Now you're watching for confirmation or failure.
For $BTC, $61,946 is your line in the sand. Below that, the bounce was fake and you're looking lower. Above $65,360, you've reclaimed the range and $81,131 becomes your next target. Same logic applies to $ETH and $SOL — hold the low, clear the pivot, aim for the extension.
This is how you read structure: support holds or it doesn't. If it holds, you look for the breakout. If it breaks, you adjust. No guessing, just levels and confirmation.
435
·
--
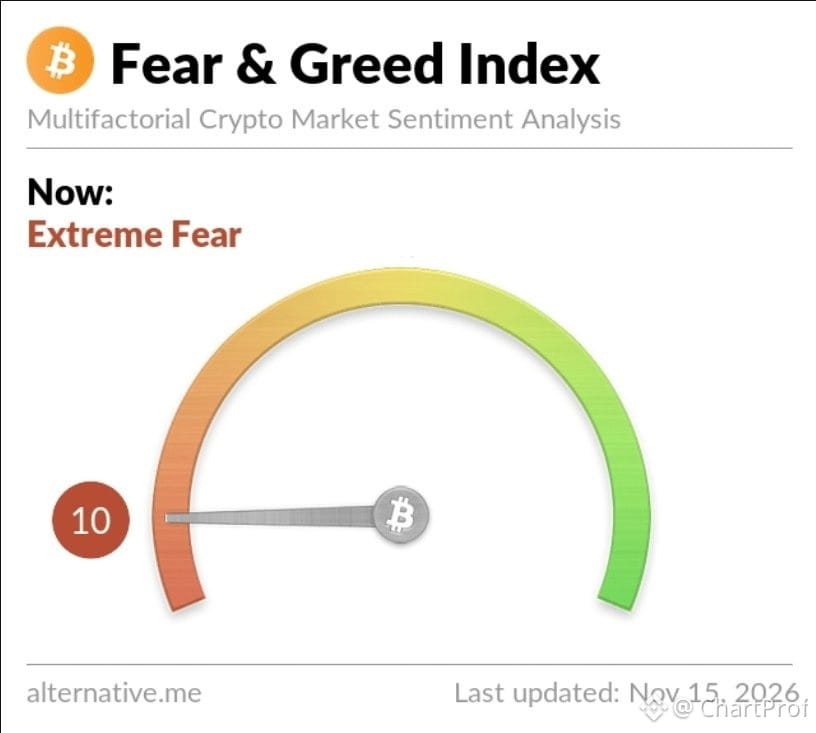
Fear & Greed sitting right where bottoms typically print.
This isn't a signal to ape in — it's a reference point. Historically, when this index drops to these zones, assets find a floor. Not always immediately, but the conditions align.
What matters now: watch how price reacts at structure. If we're really at a bottom, you'll see buyers defend key levels with conviction. If not, we chop lower and the index keeps bleeding.
Bottoms are a process, not a headline. Use this as context, not confirmation. Wait for the chart to validate what the sentiment is hinting at.
Fear & Greed sitting right where bottoms typically print.
This isn't a signal to ape in — it's a reference point. Historically, when this index drops to these zones, assets find a floor. Not always immediately, but the conditions align.
What matters now: watch how price reacts at structure. If we're really at a bottom, you'll see buyers defend key levels with conviction. If not, we chop lower and the index keeps bleeding.
Bottoms are a process, not a headline. Use this as context, not confirmation. Wait for the chart to validate what the sentiment is hinting at.
This isn't a signal to ape in — it's a reference point. Historically, when this index drops to these zones, assets find a floor. Not always immediately, but the conditions align.
What matters now: watch how price reacts at structure. If we're really at a bottom, you'll see buyers defend key levels with conviction. If not, we chop lower and the index keeps bleeding.
Bottoms are a process, not a headline. Use this as context, not confirmation. Wait for the chart to validate what the sentiment is hinting at.
893
·
--
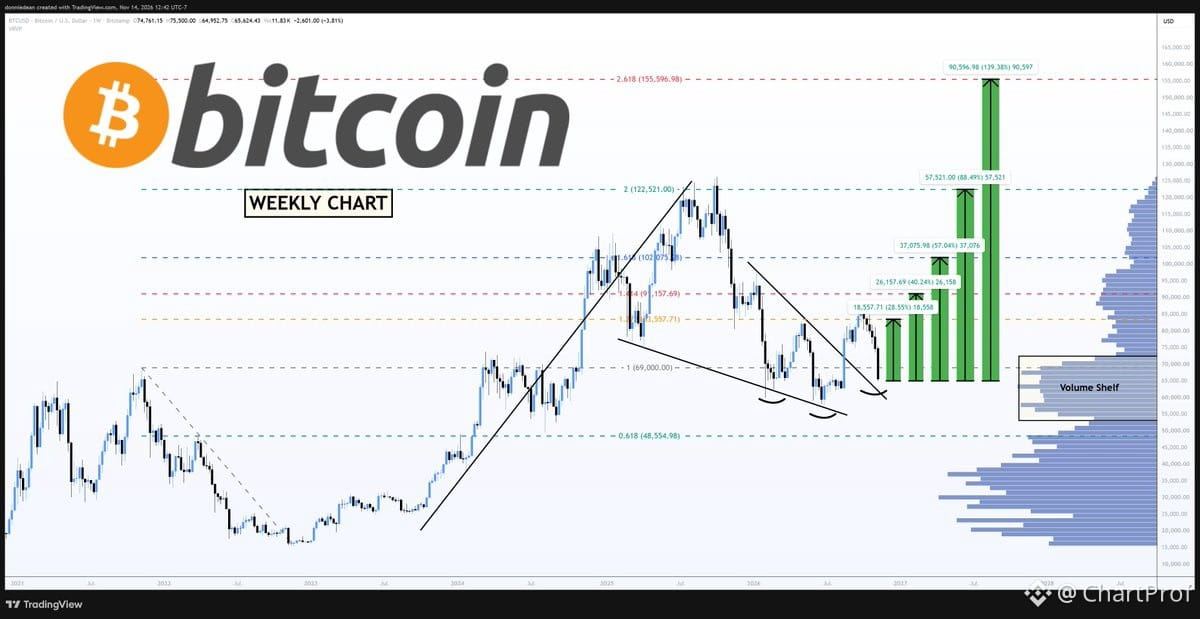
Let's walk through what the chart is showing us right now on $BTC — and why the structure still favors upside.
First, the inverse head and shoulders pattern remains intact. That's your baseline bullish structure. We're now retesting the wedge breakout, which is exactly what you want to see — price respecting prior resistance as new support. Both of these are textbook confirmations that the bottom is likely in.
Historically, bottoms tend to form around 12 months after a peak. We're now at 13 months. That timing lines up.
From the current base around $65,000, here's the roadmap:
$83,557 → +28%
$91,157 → +40%
$102,075 → +57% (Golden Ratio extension)
$122,521 → +88% (retest of prior highs)
$155,596 → +139% (next Golden Ratio target)
These aren't random numbers — they're derived from Fibonacci extensions and prior structural highs. The Golden Ratio levels matter because they're where momentum tends to pause or accelerate.
What invalidates this? A clean break below the wedge support and loss of the inverse H&S neckline. Until then, the structure is bullish, the retest is holding, and the next leg is setting up.
This is how you read a chart: structure first, confirmation second, targets third. Right now, all three are aligned.
Let's walk through what the chart is showing us right now on $BTC — and why the structure still favors upside.
First, the inverse head and shoulders pattern remains intact. That's your baseline bullish structure. We're now retesting the wedge breakout, which is exactly what you want to see — price respecting prior resistance as new support. Both of these are textbook confirmations that the bottom is likely in.
Historically, bottoms tend to form around 12 months after a peak. We're now at 13 months. That timing lines up.
From the current base around $65,000, here's the roadmap:
$83,557 → +28%
$91,157 → +40%
$102,075 → +57% (Golden Ratio extension)
$122,521 → +88% (retest of prior highs)
$155,596 → +139% (next Golden Ratio target)
These aren't random numbers — they're derived from Fibonacci extensions and prior structural highs. The Golden Ratio levels matter because they're where momentum tends to pause or accelerate.
What invalidates this? A clean break below the wedge support and loss of the inverse H&S neckline. Until then, the structure is bullish, the retest is holding, and the next leg is setting up.
This is how you read a chart: structure first, confirmation second, targets third. Right now, all three are aligned.
First, the inverse head and shoulders pattern remains intact. That's your baseline bullish structure. We're now retesting the wedge breakout, which is exactly what you want to see — price respecting prior resistance as new support. Both of these are textbook confirmations that the bottom is likely in.
Historically, bottoms tend to form around 12 months after a peak. We're now at 13 months. That timing lines up.
From the current base around $65,000, here's the roadmap:
$83,557 → +28%
$91,157 → +40%
$102,075 → +57% (Golden Ratio extension)
$122,521 → +88% (retest of prior highs)
$155,596 → +139% (next Golden Ratio target)
These aren't random numbers — they're derived from Fibonacci extensions and prior structural highs. The Golden Ratio levels matter because they're where momentum tends to pause or accelerate.
What invalidates this? A clean break below the wedge support and loss of the inverse H&S neckline. Until then, the structure is bullish, the retest is holding, and the next leg is setting up.
This is how you read a chart: structure first, confirmation second, targets third. Right now, all three are aligned.
1.6k
·
--
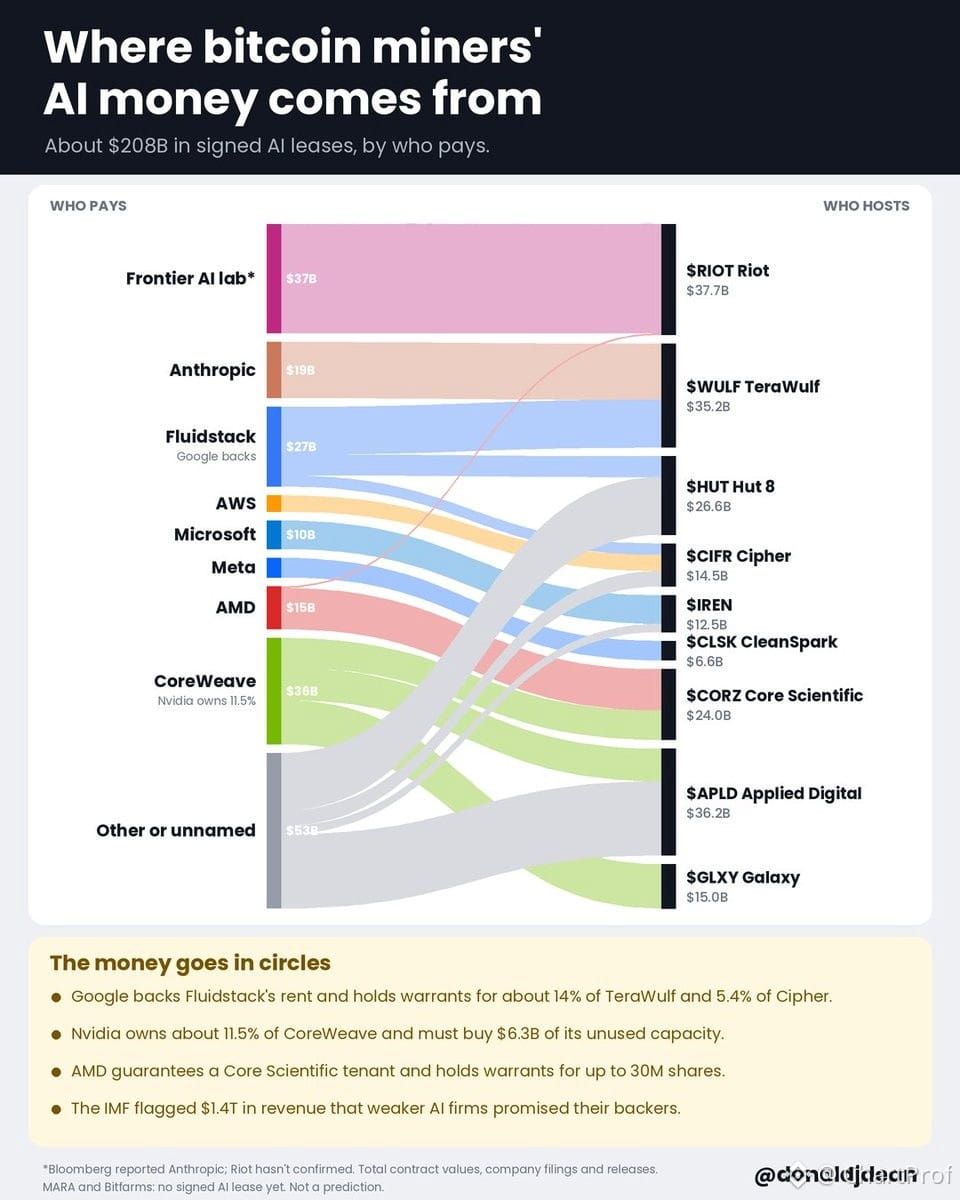
Here's the real flow behind the miner-to-AI pivot — and how the capital circle closes.
9 former mining plays now hold ~$208B in AI datacenter lease commitments. That's not speculation. That's contracted capacity:
$RIOT – $37.7B
$APLD – $36.2B
$WULF – $35.2B
$HUT – $26.6B
$CORZ – $24.0B
$GLXY – $15.0B
$CIFR – $14.5B
$IREN – $12.5B
$CLSK – $6.6B
Now here's the structure that matters:
$GOOGL backs the rent and holds warrants in several of these names. $NVDA owns 11.5% of $CRWV CoreWeave — one of the largest tenants leasing this capacity.
So the money moves in a loop: Big Tech funds the infrastructure, takes equity upside in the operators, and locks in compute supply through the same names that used to chase $BTC blocks.
This isn't a pivot. It's a repurposing of energy infrastructure with contractual revenue replacing hash-rate volatility.
What it means for traders: These aren't pure mining plays anymore. They're hybrid infrastructure bets tied to AI demand, Big Tech capital commitments, and long-duration lease visibility.
Watch how these names trade relative to $BTC vs. $NVDA. The correlation is shifting — and the capital structure tells you why.
Here's the real flow behind the miner-to-AI pivot — and how the capital circle closes.
9 former mining plays now hold ~$208B in AI datacenter lease commitments. That's not speculation. That's contracted capacity:
$RIOT – $37.7B
$APLD – $36.2B
$WULF – $35.2B
$HUT – $26.6B
$CORZ – $24.0B
$GLXY – $15.0B
$CIFR – $14.5B
$IREN – $12.5B
$CLSK – $6.6B
Now here's the structure that matters:
$GOOGL backs the rent and holds warrants in several of these names. $NVDA owns 11.5% of $CRWV CoreWeave — one of the largest tenants leasing this capacity.
So the money moves in a loop: Big Tech funds the infrastructure, takes equity upside in the operators, and locks in compute supply through the same names that used to chase $BTC blocks.
This isn't a pivot. It's a repurposing of energy infrastructure with contractual revenue replacing hash-rate volatility.
What it means for traders: These aren't pure mining plays anymore. They're hybrid infrastructure bets tied to AI demand, Big Tech capital commitments, and long-duration lease visibility.
Watch how these names trade relative to $BTC vs. $NVDA. The correlation is shifting — and the capital structure tells you why.
9 former mining plays now hold ~$208B in AI datacenter lease commitments. That's not speculation. That's contracted capacity:
$RIOT – $37.7B
$APLD – $36.2B
$WULF – $35.2B
$HUT – $26.6B
$CORZ – $24.0B
$GLXY – $15.0B
$CIFR – $14.5B
$IREN – $12.5B
$CLSK – $6.6B
Now here's the structure that matters:
$GOOGL backs the rent and holds warrants in several of these names. $NVDA owns 11.5% of $CRWV CoreWeave — one of the largest tenants leasing this capacity.
So the money moves in a loop: Big Tech funds the infrastructure, takes equity upside in the operators, and locks in compute supply through the same names that used to chase $BTC blocks.
This isn't a pivot. It's a repurposing of energy infrastructure with contractual revenue replacing hash-rate volatility.
What it means for traders: These aren't pure mining plays anymore. They're hybrid infrastructure bets tied to AI demand, Big Tech capital commitments, and long-duration lease visibility.
Watch how these names trade relative to $BTC vs. $NVDA. The correlation is shifting — and the capital structure tells you why.
723
·
--
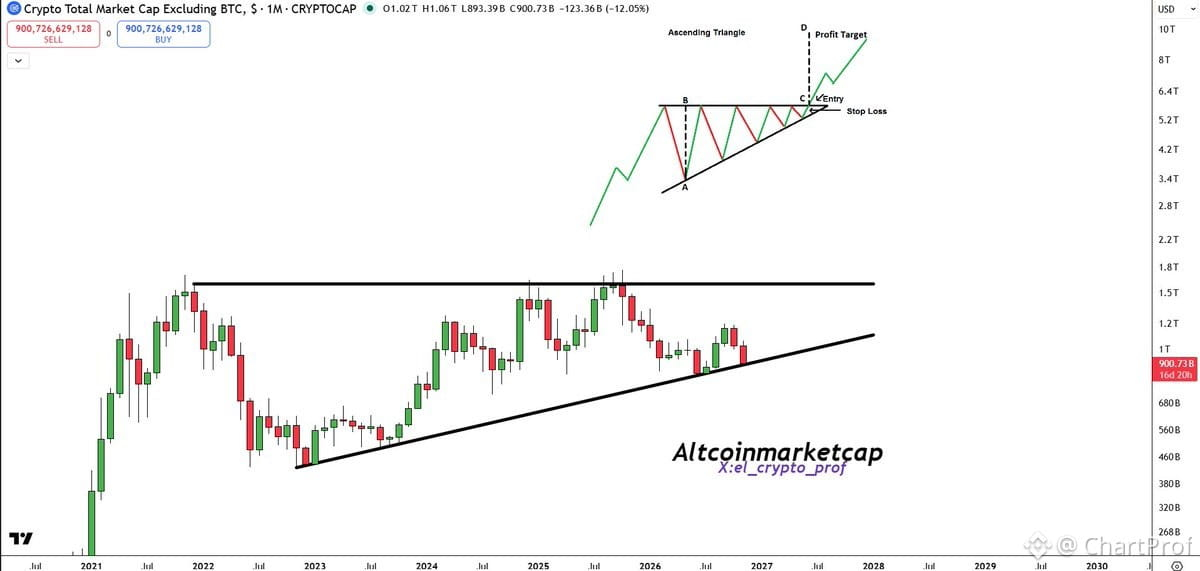
Alts are at a critical juncture. We're sitting at major support across the board — the kind of levels that either hold and launch the next leg, or break and send us into deeper correction territory.
Here's the structure: Most alts have retraced 40-60% from recent highs and are now testing key demand zones that coincide with previous breakout points. $BTC dominance is hovering near resistance, which historically gives alts room to run if it rejects here.
What confirms the setup: Clean reclaim of these support levels with volume, plus $BTC holding above its own structure around current range lows. If we see alts bounce with conviction while $BTC stays stable, that's your signal that capital is rotating back.
What invalidates it: Losing these support zones on volume. If we break lower here, expect another 20-30% drawdown before the next real bid comes in.
This is a textbook inflection point. Either we hold and reverse, or we don't and reset lower. No middle ground from here — the chart is giving you a clear answer soon.
Alts are at a critical juncture. We're sitting at major support across the board — the kind of levels that either hold and launch the next leg, or break and send us into deeper correction territory.
Here's the structure: Most alts have retraced 40-60% from recent highs and are now testing key demand zones that coincide with previous breakout points. $BTC dominance is hovering near resistance, which historically gives alts room to run if it rejects here.
What confirms the setup: Clean reclaim of these support levels with volume, plus $BTC holding above its own structure around current range lows. If we see alts bounce with conviction while $BTC stays stable, that's your signal that capital is rotating back.
What invalidates it: Losing these support zones on volume. If we break lower here, expect another 20-30% drawdown before the next real bid comes in.
This is a textbook inflection point. Either we hold and reverse, or we don't and reset lower. No middle ground from here — the chart is giving you a clear answer soon.
Here's the structure: Most alts have retraced 40-60% from recent highs and are now testing key demand zones that coincide with previous breakout points. $BTC dominance is hovering near resistance, which historically gives alts room to run if it rejects here.
What confirms the setup: Clean reclaim of these support levels with volume, plus $BTC holding above its own structure around current range lows. If we see alts bounce with conviction while $BTC stays stable, that's your signal that capital is rotating back.
What invalidates it: Losing these support zones on volume. If we break lower here, expect another 20-30% drawdown before the next real bid comes in.
This is a textbook inflection point. Either we hold and reverse, or we don't and reset lower. No middle ground from here — the chart is giving you a clear answer soon.
1
1
1.5k
·
--
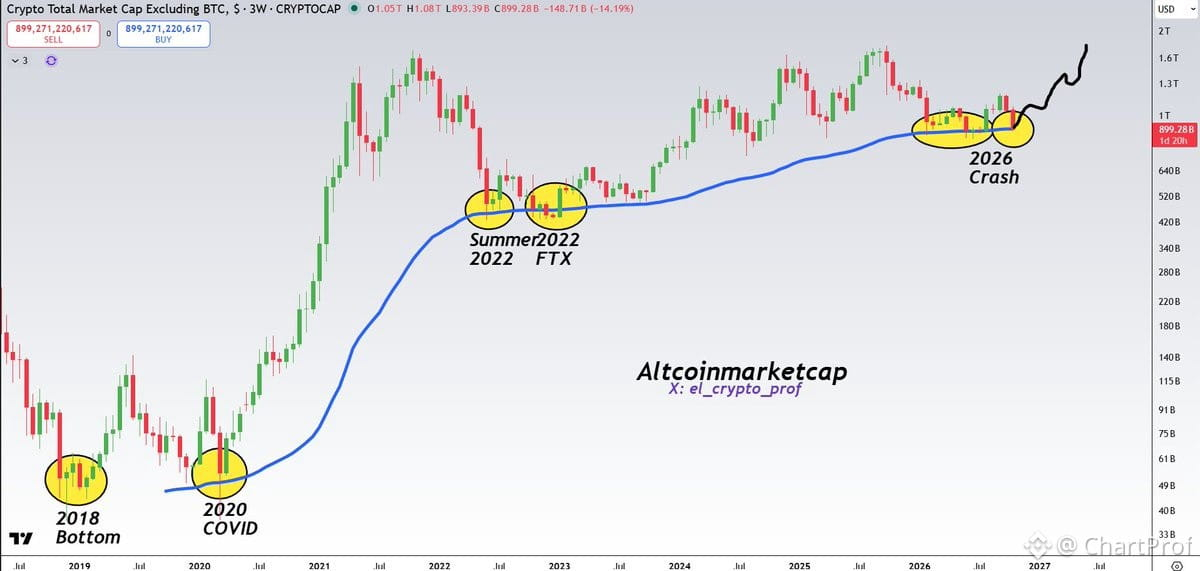
Altcoin market structure lesson:
This blue support zone has historically caught the bottom in nearly every major cycle. We're testing it again right now on total market cap.
What makes this significant? It's not just a line — it's a multi-cycle demand zone that's held through 2018, 2020, and previous corrections. When price revisits proven structure, you get high-probability setups.
Here's the read:
• Support: This blue zone is your reference point. Holds = continuation bias intact.
• Confirmation: Weekly close above keeps the macro uptrend valid.
• Invalidation: Clean break and close below flips structure bearish.
This isn't a guarantee — it's a setup. Structure repeats until it doesn't. Watch how price reacts here. If it holds and builds volume, you're looking at a potential cycle low retest. If it fails, reassess.
Clean charts teach you to wait for the structure to prove itself. This is one of those moments.
Altcoin market structure lesson:
This blue support zone has historically caught the bottom in nearly every major cycle. We're testing it again right now on total market cap.
What makes this significant? It's not just a line — it's a multi-cycle demand zone that's held through 2018, 2020, and previous corrections. When price revisits proven structure, you get high-probability setups.
Here's the read:
• Support: This blue zone is your reference point. Holds = continuation bias intact.
• Confirmation: Weekly close above keeps the macro uptrend valid.
• Invalidation: Clean break and close below flips structure bearish.
This isn't a guarantee — it's a setup. Structure repeats until it doesn't. Watch how price reacts here. If it holds and builds volume, you're looking at a potential cycle low retest. If it fails, reassess.
Clean charts teach you to wait for the structure to prove itself. This is one of those moments.
This blue support zone has historically caught the bottom in nearly every major cycle. We're testing it again right now on total market cap.
What makes this significant? It's not just a line — it's a multi-cycle demand zone that's held through 2018, 2020, and previous corrections. When price revisits proven structure, you get high-probability setups.
Here's the read:
• Support: This blue zone is your reference point. Holds = continuation bias intact.
• Confirmation: Weekly close above keeps the macro uptrend valid.
• Invalidation: Clean break and close below flips structure bearish.
This isn't a guarantee — it's a setup. Structure repeats until it doesn't. Watch how price reacts here. If it holds and builds volume, you're looking at a potential cycle low retest. If it fails, reassess.
Clean charts teach you to wait for the structure to prove itself. This is one of those moments.
1.3k
·
--
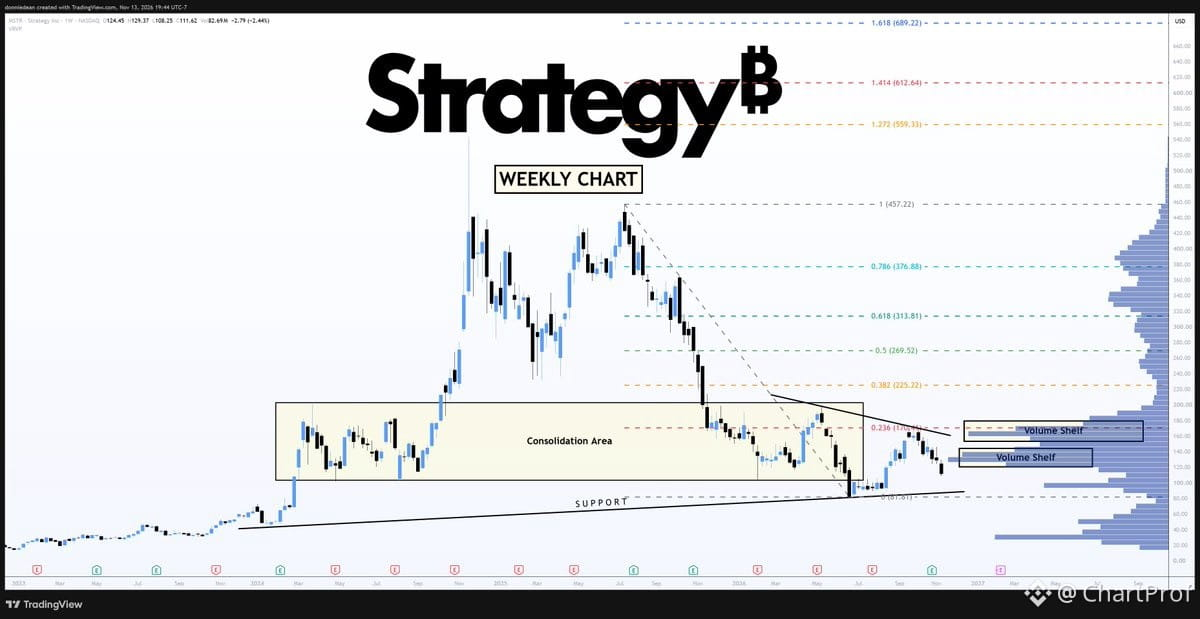
$MSTR — Zoom out and read the structure.
Higher lows stacking inside a wedge. Clean consolidation. $130 sits on a volume shelf — that's your launch pad if this breaks up. Next resistance? $170. That level lines up perfectly with the next volume shelf above.
What this means: Price is coiling. The wedge is tightening. Volume shelves are structural support zones where buyers have historically stepped in. When price breaks above consolidation and finds volume support, it tends to run to the next shelf.
Setup: Watch for a break above the wedge with volume confirmation. $130 holds = bullish structure intact. $170 is your next target if momentum follows through.
Invalidation: Break below $130 with volume = wedge fails, retest lower support.
This is textbook accumulation into a breakout setup. Let the structure do the work.
$MSTR — Zoom out and read the structure.
Higher lows stacking inside a wedge. Clean consolidation. $130 sits on a volume shelf — that's your launch pad if this breaks up. Next resistance? $170. That level lines up perfectly with the next volume shelf above.
What this means: Price is coiling. The wedge is tightening. Volume shelves are structural support zones where buyers have historically stepped in. When price breaks above consolidation and finds volume support, it tends to run to the next shelf.
Setup: Watch for a break above the wedge with volume confirmation. $130 holds = bullish structure intact. $170 is your next target if momentum follows through.
Invalidation: Break below $130 with volume = wedge fails, retest lower support.
This is textbook accumulation into a breakout setup. Let the structure do the work.
Higher lows stacking inside a wedge. Clean consolidation. $130 sits on a volume shelf — that's your launch pad if this breaks up. Next resistance? $170. That level lines up perfectly with the next volume shelf above.
What this means: Price is coiling. The wedge is tightening. Volume shelves are structural support zones where buyers have historically stepped in. When price breaks above consolidation and finds volume support, it tends to run to the next shelf.
Setup: Watch for a break above the wedge with volume confirmation. $130 holds = bullish structure intact. $170 is your next target if momentum follows through.
Invalidation: Break below $130 with volume = wedge fails, retest lower support.
This is textbook accumulation into a breakout setup. Let the structure do the work.
702
·
--
Cisco just posted a record quarter — revenue hit $18.52B (24% up, beat the $18.12B estimate) and adjusted EPS came in at $1.40 vs $1.33 expected. Strong print.
They raised full-year guidance too: FY27 revenue now projected at $74.8B–$75.8B. That's confidence.
But $CSCO is down 6% to $95.90 — classic "sell the news" move. Market already priced in the beat, or profit-taking after the run. Watch how it holds here. If it reclaims $98–$100, that's your re-entry zone. Below $94, it's a deeper pullback into support.
Lesson: earnings beats don't always = green candles. Price action > headlines. Read the chart, not the emotion.
Cisco just posted a record quarter — revenue hit $18.52B (24% up, beat the $18.12B estimate) and adjusted EPS came in at $1.40 vs $1.33 expected. Strong print.
They raised full-year guidance too: FY27 revenue now projected at $74.8B–$75.8B. That's confidence.
But $CSCO is down 6% to $95.90 — classic "sell the news" move. Market already priced in the beat, or profit-taking after the run. Watch how it holds here. If it reclaims $98–$100, that's your re-entry zone. Below $94, it's a deeper pullback into support.
Lesson: earnings beats don't always = green candles. Price action > headlines. Read the chart, not the emotion.
They raised full-year guidance too: FY27 revenue now projected at $74.8B–$75.8B. That's confidence.
But $CSCO is down 6% to $95.90 — classic "sell the news" move. Market already priced in the beat, or profit-taking after the run. Watch how it holds here. If it reclaims $98–$100, that's your re-entry zone. Below $94, it's a deeper pullback into support.
Lesson: earnings beats don't always = green candles. Price action > headlines. Read the chart, not the emotion.
1
363
·
--
Altcoins setting up for a move here.
What I'm seeing: Price structure tightening, volume drying up before expansion, $BTC holding range support — classic pre-pump conditions. When alts compress like this after extended consolidation, they tend to break with conviction.
The setup: Wait for confirmation. A clean break above recent range highs with volume tells you the move is real. If $BTC stays stable or pushes higher, alts get the green light.
Invalidation: If $BTC breaks down or alts fail to hold current structure, this setup dies. No chase without confirmation.
Teaching moment: Compression + stable $BTC = alt opportunity. But structure must confirm before you commit. Read the chart, wait for the signal, then act.
Altcoins setting up for a move here.
What I'm seeing: Price structure tightening, volume drying up before expansion, $BTC holding range support — classic pre-pump conditions. When alts compress like this after extended consolidation, they tend to break with conviction.
The setup: Wait for confirmation. A clean break above recent range highs with volume tells you the move is real. If $BTC stays stable or pushes higher, alts get the green light.
Invalidation: If $BTC breaks down or alts fail to hold current structure, this setup dies. No chase without confirmation.
Teaching moment: Compression + stable $BTC = alt opportunity. But structure must confirm before you commit. Read the chart, wait for the signal, then act.
What I'm seeing: Price structure tightening, volume drying up before expansion, $BTC holding range support — classic pre-pump conditions. When alts compress like this after extended consolidation, they tend to break with conviction.
The setup: Wait for confirmation. A clean break above recent range highs with volume tells you the move is real. If $BTC stays stable or pushes higher, alts get the green light.
Invalidation: If $BTC breaks down or alts fail to hold current structure, this setup dies. No chase without confirmation.
Teaching moment: Compression + stable $BTC = alt opportunity. But structure must confirm before you commit. Read the chart, wait for the signal, then act.
110
·
--
Verified
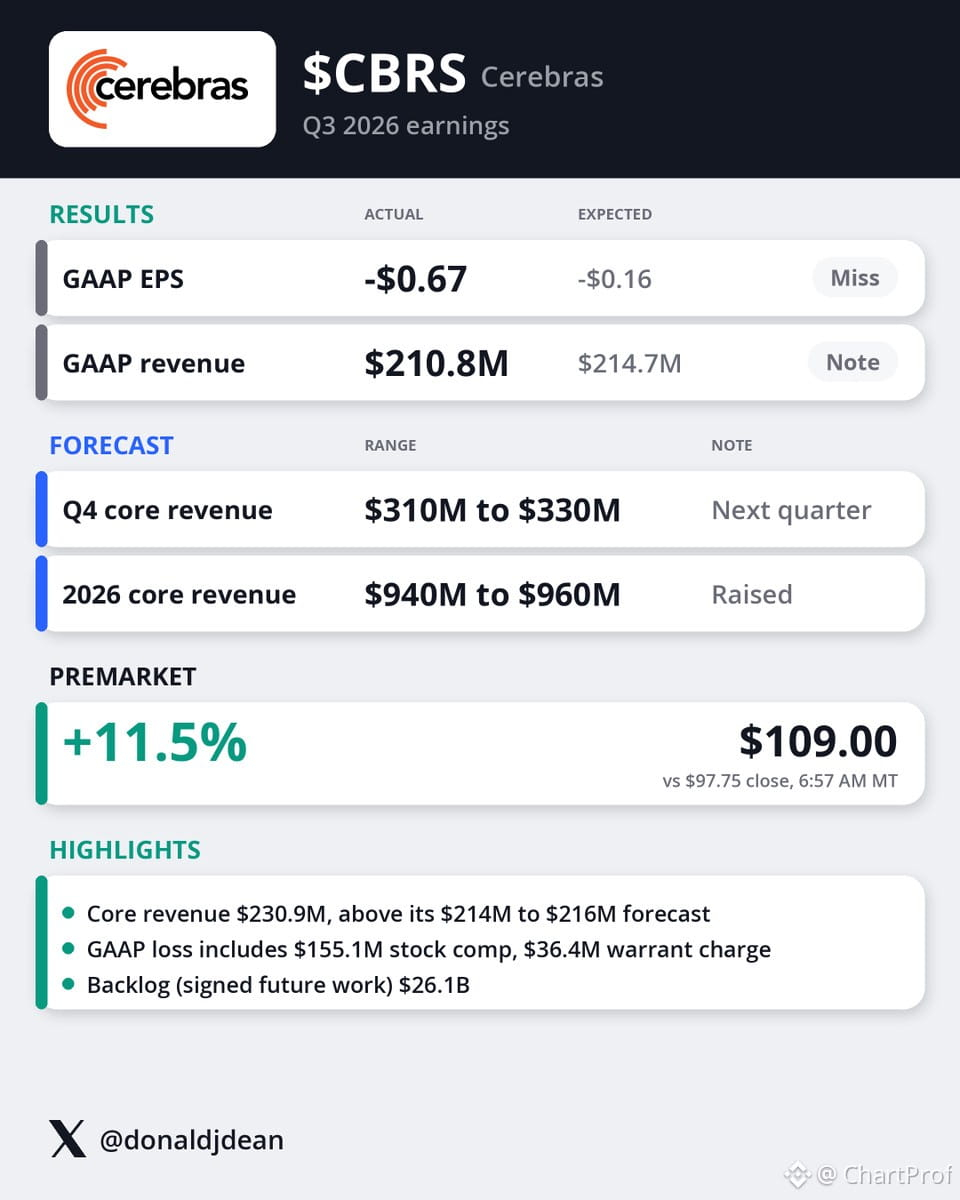
$CBRS earnings drop — wider loss but revenue structure tells a different story.
GAAP EPS came in at -$0.67 versus -$0.16 expected. That's a miss on the bottom line, no sugarcoating it. But here's where you separate noise from signal: GAAP revenue printed $210.8M against $214.7M consensus — a slight miss — while core revenue (the adjusted number that strips out non-recurring items) landed at $230.9M. That's a beat on the operational side.
Now the kicker: management raised 2026 core revenue guidance to $940M–$960M. That's not a token bump — that's a material lift in forward expectations. The market's reading this as a growth trajectory story, not an earnings quality story, which is why the stock ripped 11.5% premarket to $109.
Here's the setup: if $CBRS holds this gap and builds consolidation above $105–$107, you've got a higher low structure forming off a fundamental catalyst. Watch for volume confirmation and whether it can reclaim prior resistance zones. Invalidation is simple — if it fills the gap and breaks back under $100, the bid was premature and the loss narrative takes over.
This is a classic case of the market pricing in future revenue growth over present profitability. The chart will tell you if that bet holds or fades.
$CBRS earnings drop — wider loss but revenue structure tells a different story.
GAAP EPS came in at -$0.67 versus -$0.16 expected. That's a miss on the bottom line, no sugarcoating it. But here's where you separate noise from signal: GAAP revenue printed $210.8M against $214.7M consensus — a slight miss — while core revenue (the adjusted number that strips out non-recurring items) landed at $230.9M. That's a beat on the operational side.
Now the kicker: management raised 2026 core revenue guidance to $940M–$960M. That's not a token bump — that's a material lift in forward expectations. The market's reading this as a growth trajectory story, not an earnings quality story, which is why the stock ripped 11.5% premarket to $109.
Here's the setup: if $CBRS holds this gap and builds consolidation above $105–$107, you've got a higher low structure forming off a fundamental catalyst. Watch for volume confirmation and whether it can reclaim prior resistance zones. Invalidation is simple — if it fills the gap and breaks back under $100, the bid was premature and the loss narrative takes over.
This is a classic case of the market pricing in future revenue growth over present profitability. The chart will tell you if that bet holds or fades.
GAAP EPS came in at -$0.67 versus -$0.16 expected. That's a miss on the bottom line, no sugarcoating it. But here's where you separate noise from signal: GAAP revenue printed $210.8M against $214.7M consensus — a slight miss — while core revenue (the adjusted number that strips out non-recurring items) landed at $230.9M. That's a beat on the operational side.
Now the kicker: management raised 2026 core revenue guidance to $940M–$960M. That's not a token bump — that's a material lift in forward expectations. The market's reading this as a growth trajectory story, not an earnings quality story, which is why the stock ripped 11.5% premarket to $109.
Here's the setup: if $CBRS holds this gap and builds consolidation above $105–$107, you've got a higher low structure forming off a fundamental catalyst. Watch for volume confirmation and whether it can reclaim prior resistance zones. Invalidation is simple — if it fills the gap and breaks back under $100, the bid was premature and the loss narrative takes over.
This is a classic case of the market pricing in future revenue growth over present profitability. The chart will tell you if that bet holds or fades.
1
690
·
--
When you're second-guessing alts, pull back to the macro. The OTHERS chart (total altcoin market cap ex-$BTC and $ETH) tells the real story.
Right now we're testing a massive multi-year resistance zone. This isn't noise — it's structure. If OTHERS breaks and holds above this level, you're looking at confirmation that alt season has legs. If it fails here, expect consolidation or a pullback into support.
The roadmap is simple: watch for a clean breakout with volume, then look for a retest of the breakout level as new support. That's your entry zone for conviction alts. Until then, respect the range.
Zoom out when the daily noise gets loud. The macro structure always wins.
When you're second-guessing alts, pull back to the macro. The OTHERS chart (total altcoin market cap ex-$BTC and $ETH) tells the real story.
Right now we're testing a massive multi-year resistance zone. This isn't noise — it's structure. If OTHERS breaks and holds above this level, you're looking at confirmation that alt season has legs. If it fails here, expect consolidation or a pullback into support.
The roadmap is simple: watch for a clean breakout with volume, then look for a retest of the breakout level as new support. That's your entry zone for conviction alts. Until then, respect the range.
Zoom out when the daily noise gets loud. The macro structure always wins.
Right now we're testing a massive multi-year resistance zone. This isn't noise — it's structure. If OTHERS breaks and holds above this level, you're looking at confirmation that alt season has legs. If it fails here, expect consolidation or a pullback into support.
The roadmap is simple: watch for a clean breakout with volume, then look for a retest of the breakout level as new support. That's your entry zone for conviction alts. Until then, respect the range.
Zoom out when the daily noise gets loud. The macro structure always wins.
113
·
--
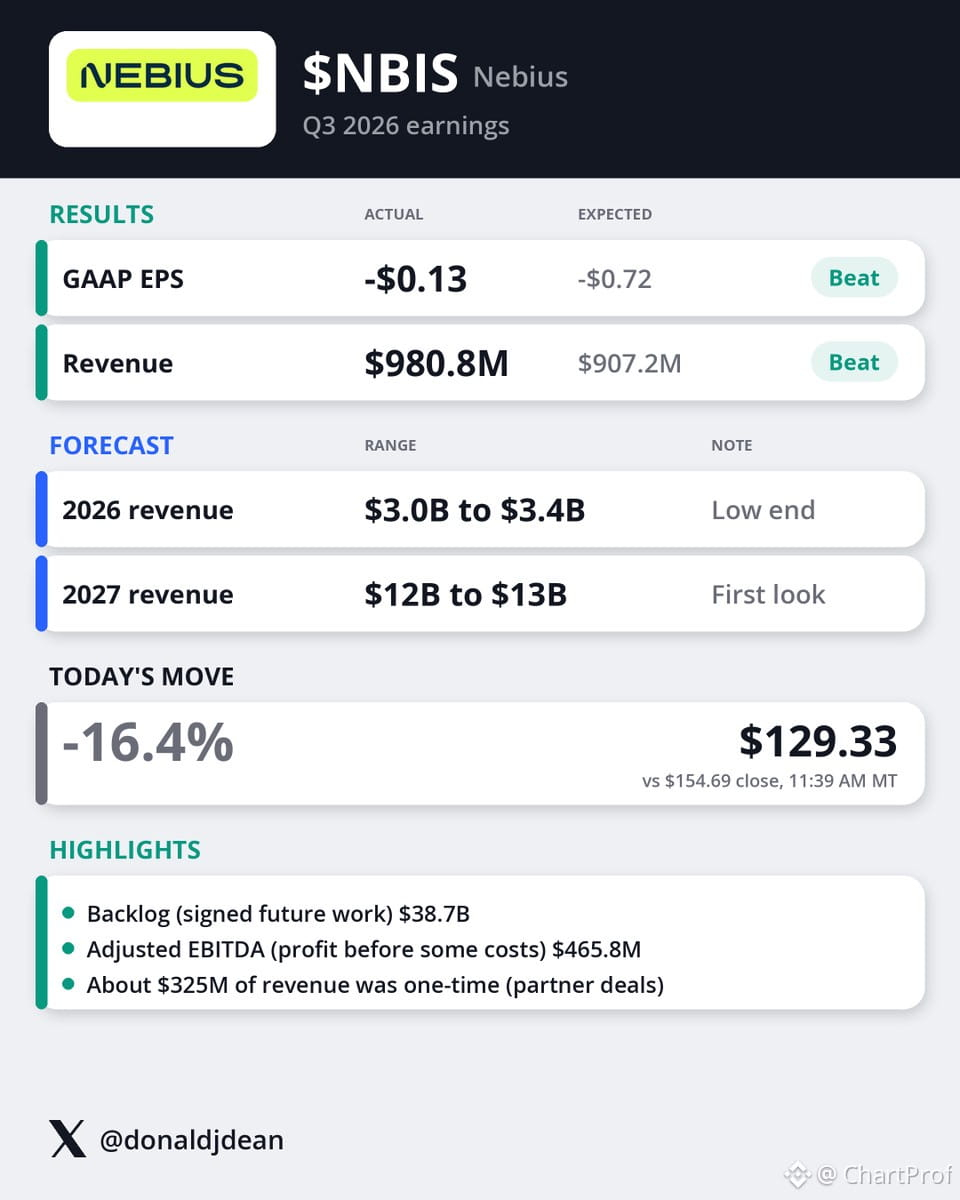
$NBIS Nebius just reported — and the headline beat hides a softer story.
Revenue came in at $980.8M vs $907.2M expected. Looks strong — until you see ~$325M was one-time. Strip that out and the core run rate is weaker than it appears.
GAAP EPS improved to -$0.13 vs -$0.72 expected, but still unprofitable.
The real concern: 2026 revenue guidance at the low end of $3.0B–$3.4B. That's cautious positioning, and the market's reacting accordingly.
Price action: down 16.4% today to $129.33.
What this tells us:
• Beat was padded by non-recurring revenue
• Forward guidance signals slower growth than bulls hoped
• Sellers are stepping in hard — this is a structure breakdown, not noise
Setup: If you're long, watch $125 as next support. Break below that and we're looking at $110–$115 zone. If you're short, this is a momentum fade setup — trail stops under each hourly lower high.
Invalidation: reclaim $140 with volume and the breakdown thesis is off.
This is a textbook example of why you read *through* the headline. The numbers matter, but the structure and guidance matter more.
$NBIS Nebius just reported — and the headline beat hides a softer story.
Revenue came in at $980.8M vs $907.2M expected. Looks strong — until you see ~$325M was one-time. Strip that out and the core run rate is weaker than it appears.
GAAP EPS improved to -$0.13 vs -$0.72 expected, but still unprofitable.
The real concern: 2026 revenue guidance at the low end of $3.0B–$3.4B. That's cautious positioning, and the market's reacting accordingly.
Price action: down 16.4% today to $129.33.
What this tells us:
• Beat was padded by non-recurring revenue
• Forward guidance signals slower growth than bulls hoped
• Sellers are stepping in hard — this is a structure breakdown, not noise
Setup: If you're long, watch $125 as next support. Break below that and we're looking at $110–$115 zone. If you're short, this is a momentum fade setup — trail stops under each hourly lower high.
Invalidation: reclaim $140 with volume and the breakdown thesis is off.
This is a textbook example of why you read *through* the headline. The numbers matter, but the structure and guidance matter more.
Revenue came in at $980.8M vs $907.2M expected. Looks strong — until you see ~$325M was one-time. Strip that out and the core run rate is weaker than it appears.
GAAP EPS improved to -$0.13 vs -$0.72 expected, but still unprofitable.
The real concern: 2026 revenue guidance at the low end of $3.0B–$3.4B. That's cautious positioning, and the market's reacting accordingly.
Price action: down 16.4% today to $129.33.
What this tells us:
• Beat was padded by non-recurring revenue
• Forward guidance signals slower growth than bulls hoped
• Sellers are stepping in hard — this is a structure breakdown, not noise
Setup: If you're long, watch $125 as next support. Break below that and we're looking at $110–$115 zone. If you're short, this is a momentum fade setup — trail stops under each hourly lower high.
Invalidation: reclaim $140 with volume and the breakdown thesis is off.
This is a textbook example of why you read *through* the headline. The numbers matter, but the structure and guidance matter more.
1
1
335
·
--
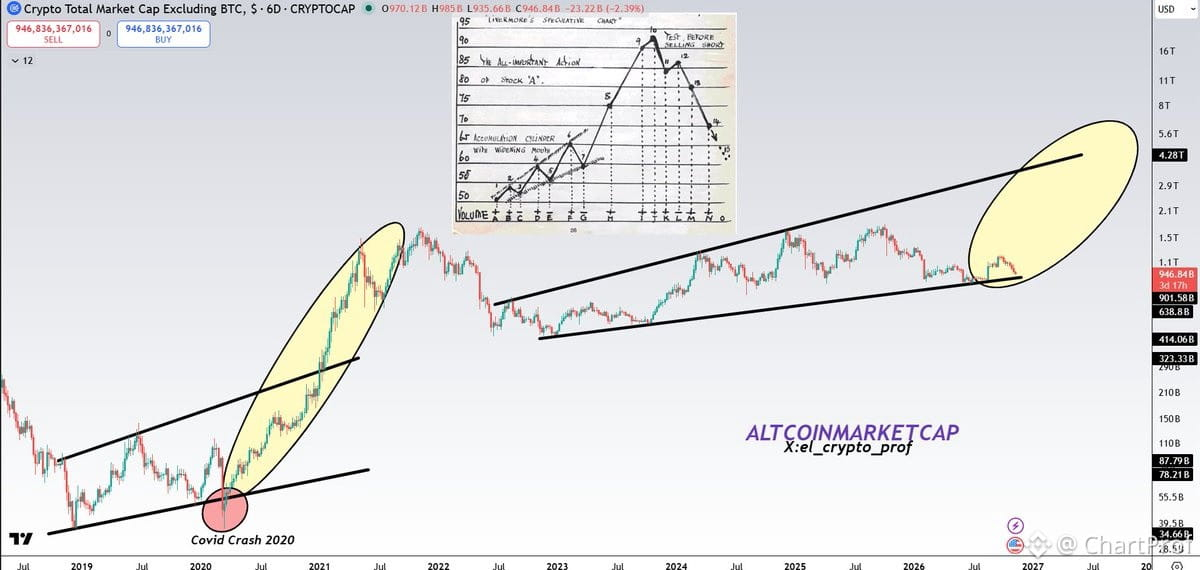
Let's walk through what this chart is actually showing — and why it matters for your positioning right now.
We're comparing the 2020/2021 altseason structure against the projected 2026/2027 cycle. Same fractal, same rhythm, different timeframe. The setup rhymes.
What you're seeing: a multi-year accumulation base, a breakout phase, then the explosive leg that defines altseason. The 2020/2021 run gave us 300–500% moves on quality alts after $BTC dominance peaked and rotated. We're now in the early-to-mid accumulation phase of the next cycle.
Why this matters: if the fractal holds, we're still 12–18 months away from the real fireworks. That means this isn't the time to chase. It's the time to build positions in solid alts while they're boring, while nobody's talking about them, while the structure is still forming.
Key levels to watch: $BTC dominance needs to top out and roll over. Altcoin market cap needs to reclaim previous cycle highs with conviction. Volume needs to confirm the breakout when it comes.
Invalidation: if $BTC dominance keeps climbing and alts can't hold their lows into 2025, the fractal breaks and we reassess.
Patience isn't passive — it's strategic. The best entries happen when the chart looks boring and the crowd isn't paying attention. This is that phase. Study the structure, build your watchlist, wait for confirmation.
Altseason will come. Just not today.
Let's walk through what this chart is actually showing — and why it matters for your positioning right now.
We're comparing the 2020/2021 altseason structure against the projected 2026/2027 cycle. Same fractal, same rhythm, different timeframe. The setup rhymes.
What you're seeing: a multi-year accumulation base, a breakout phase, then the explosive leg that defines altseason. The 2020/2021 run gave us 300–500% moves on quality alts after $BTC dominance peaked and rotated. We're now in the early-to-mid accumulation phase of the next cycle.
Why this matters: if the fractal holds, we're still 12–18 months away from the real fireworks. That means this isn't the time to chase. It's the time to build positions in solid alts while they're boring, while nobody's talking about them, while the structure is still forming.
Key levels to watch: $BTC dominance needs to top out and roll over. Altcoin market cap needs to reclaim previous cycle highs with conviction. Volume needs to confirm the breakout when it comes.
Invalidation: if $BTC dominance keeps climbing and alts can't hold their lows into 2025, the fractal breaks and we reassess.
Patience isn't passive — it's strategic. The best entries happen when the chart looks boring and the crowd isn't paying attention. This is that phase. Study the structure, build your watchlist, wait for confirmation.
Altseason will come. Just not today.
We're comparing the 2020/2021 altseason structure against the projected 2026/2027 cycle. Same fractal, same rhythm, different timeframe. The setup rhymes.
What you're seeing: a multi-year accumulation base, a breakout phase, then the explosive leg that defines altseason. The 2020/2021 run gave us 300–500% moves on quality alts after $BTC dominance peaked and rotated. We're now in the early-to-mid accumulation phase of the next cycle.
Why this matters: if the fractal holds, we're still 12–18 months away from the real fireworks. That means this isn't the time to chase. It's the time to build positions in solid alts while they're boring, while nobody's talking about them, while the structure is still forming.
Key levels to watch: $BTC dominance needs to top out and roll over. Altcoin market cap needs to reclaim previous cycle highs with conviction. Volume needs to confirm the breakout when it comes.
Invalidation: if $BTC dominance keeps climbing and alts can't hold their lows into 2025, the fractal breaks and we reassess.
Patience isn't passive — it's strategic. The best entries happen when the chart looks boring and the crowd isn't paying attention. This is that phase. Study the structure, build your watchlist, wait for confirmation.
Altseason will come. Just not today.
659
·
--
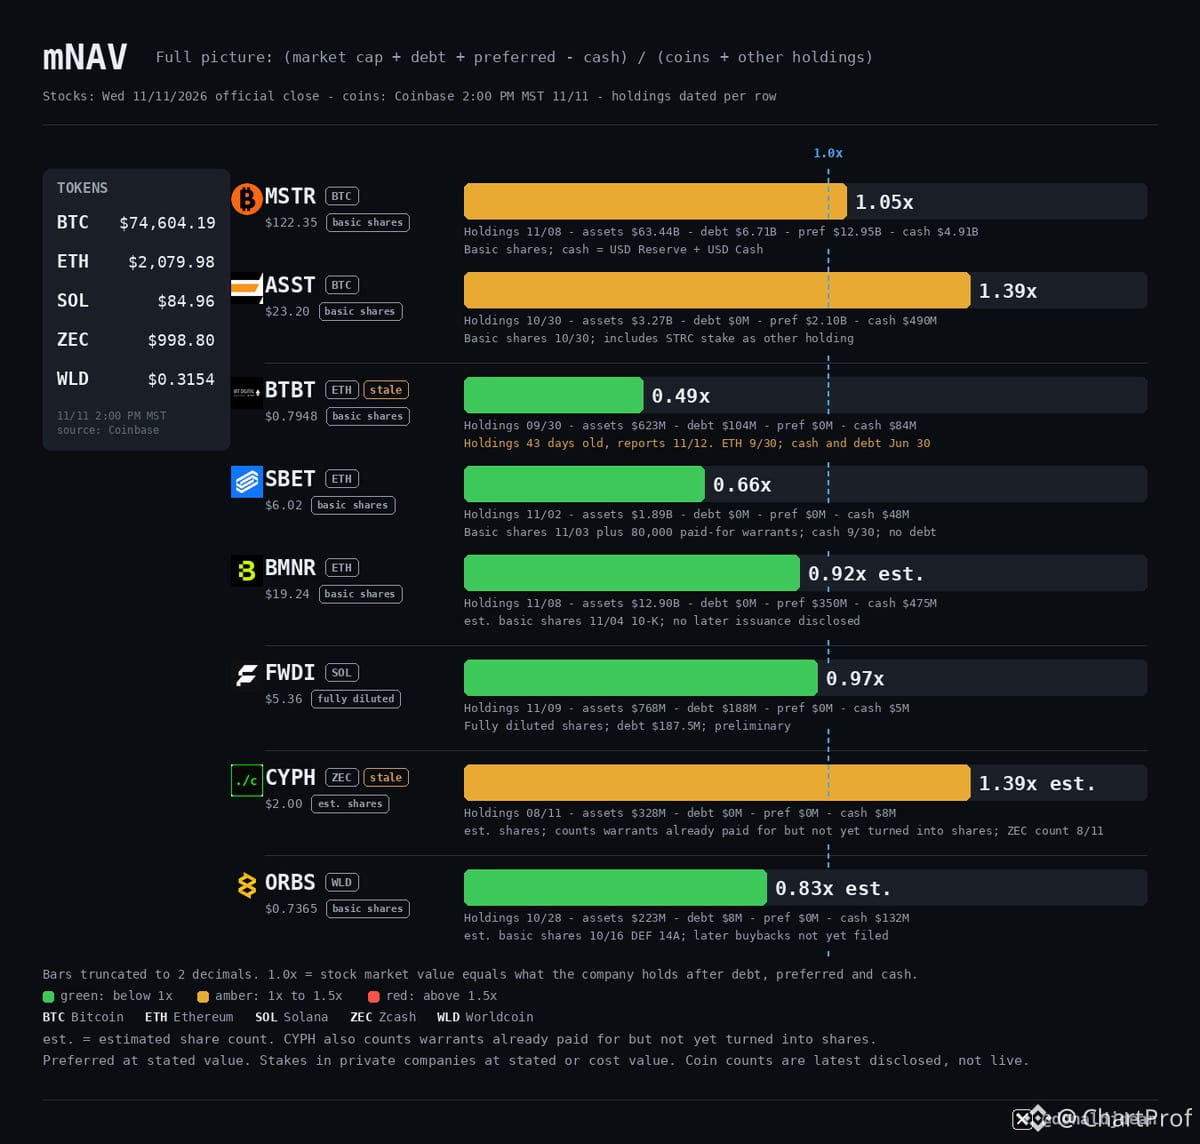
Crypto treasury stock valuations by coin holdings — clean mNAV breakdown.
$SBET Sharplink trades at the sharpest real discount: 0.66x on fresh holdings. $FWDI Forward Industries sits at 0.97x, $MSTR Strategy at 1.05x, $ASST Strive at 1.39x. $BTBT Bit Digital prints 0.49x, but those holdings are 43 days stale — updates after its 11/12 report.
Each bar shows market cap plus debt and preferred, minus cash, divided by coin and asset holdings. Under 1.0x means the stock trades below net asset value. $BMNR BitMine prints 0.92x est., $ORBS Eightco 0.83x est. — both using estimated share counts. $CYPH Cypherpunk prints 1.39x est., counting warrants already paid but not yet converted. $CYPH holdings are over 30 days old.
This is how you read corporate coin exposure — not hype, just structure. Know what you're buying and what discount you're getting. If mNAV is under 1.0x and holdings are fresh, you're buying coins at a discount through equity. If it's stale or over 1.0x, you're paying a premium or betting on execution. Always check the date on the holdings and the debt load. Clean structure, clear edge.
Crypto treasury stock valuations by coin holdings — clean mNAV breakdown.
$SBET Sharplink trades at the sharpest real discount: 0.66x on fresh holdings. $FWDI Forward Industries sits at 0.97x, $MSTR Strategy at 1.05x, $ASST Strive at 1.39x. $BTBT Bit Digital prints 0.49x, but those holdings are 43 days stale — updates after its 11/12 report.
Each bar shows market cap plus debt and preferred, minus cash, divided by coin and asset holdings. Under 1.0x means the stock trades below net asset value. $BMNR BitMine prints 0.92x est., $ORBS Eightco 0.83x est. — both using estimated share counts. $CYPH Cypherpunk prints 1.39x est., counting warrants already paid but not yet converted. $CYPH holdings are over 30 days old.
This is how you read corporate coin exposure — not hype, just structure. Know what you're buying and what discount you're getting. If mNAV is under 1.0x and holdings are fresh, you're buying coins at a discount through equity. If it's stale or over 1.0x, you're paying a premium or betting on execution. Always check the date on the holdings and the debt load. Clean structure, clear edge.
$SBET Sharplink trades at the sharpest real discount: 0.66x on fresh holdings. $FWDI Forward Industries sits at 0.97x, $MSTR Strategy at 1.05x, $ASST Strive at 1.39x. $BTBT Bit Digital prints 0.49x, but those holdings are 43 days stale — updates after its 11/12 report.
Each bar shows market cap plus debt and preferred, minus cash, divided by coin and asset holdings. Under 1.0x means the stock trades below net asset value. $BMNR BitMine prints 0.92x est., $ORBS Eightco 0.83x est. — both using estimated share counts. $CYPH Cypherpunk prints 1.39x est., counting warrants already paid but not yet converted. $CYPH holdings are over 30 days old.
This is how you read corporate coin exposure — not hype, just structure. Know what you're buying and what discount you're getting. If mNAV is under 1.0x and holdings are fresh, you're buying coins at a discount through equity. If it's stale or over 1.0x, you're paying a premium or betting on execution. Always check the date on the holdings and the debt load. Clean structure, clear edge.
534
·
--
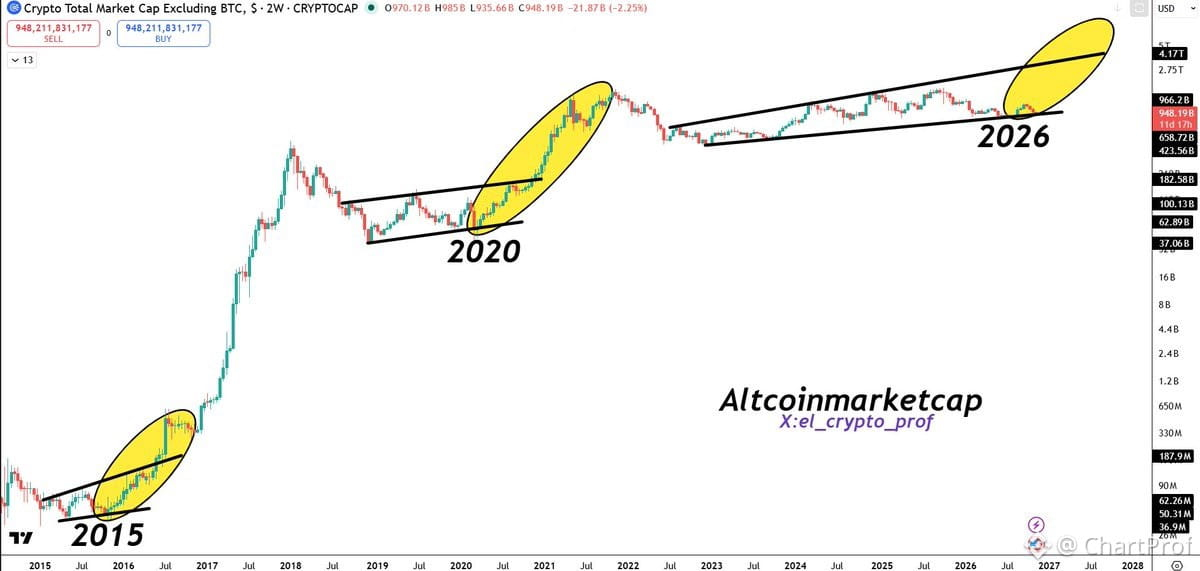
TOTAL2 breaking structure again — that's your altcoin market cap ex-$BTC.
When this chart starts climbing with conviction, it's not just one coin — it's the whole alt complex getting bid. We're seeing clean higher lows, volume confirmation, and the kind of structure that precedes rotation out of $BTC dominance.
What matters here: watch how alts respond on the next $BTC pullback. If TOTAL2 holds support while $BTC consolidates, that's your signal that capital is staying in alts, not fleeing back to safety.
Setup is simple — alts are setting up for a run. Trade the leaders in their sectors, respect your stops, and don't chase the laggards. Good times ahead when the structure is this clean.
TOTAL2 breaking structure again — that's your altcoin market cap ex-$BTC.
When this chart starts climbing with conviction, it's not just one coin — it's the whole alt complex getting bid. We're seeing clean higher lows, volume confirmation, and the kind of structure that precedes rotation out of $BTC dominance.
What matters here: watch how alts respond on the next $BTC pullback. If TOTAL2 holds support while $BTC consolidates, that's your signal that capital is staying in alts, not fleeing back to safety.
Setup is simple — alts are setting up for a run. Trade the leaders in their sectors, respect your stops, and don't chase the laggards. Good times ahead when the structure is this clean.
When this chart starts climbing with conviction, it's not just one coin — it's the whole alt complex getting bid. We're seeing clean higher lows, volume confirmation, and the kind of structure that precedes rotation out of $BTC dominance.
What matters here: watch how alts respond on the next $BTC pullback. If TOTAL2 holds support while $BTC consolidates, that's your signal that capital is staying in alts, not fleeing back to safety.
Setup is simple — alts are setting up for a run. Trade the leaders in their sectors, respect your stops, and don't chase the laggards. Good times ahead when the structure is this clean.
1.1k
Log in to explore more content
Join global crypto users on Binance Square
⚡️ Get latest and useful information about crypto.
💬 Trusted by the world’s largest crypto exchange.
👍 Discover real insights from verified creators.
Email / Phone number
Trending Topics
NvidiaBeatsEstimatesWith$130BQ4Outlook
365 views
14 Discussing
Nvidia Beats With $115.8 Billion in Revenue, Guides to $130 Billion and Adds $150 Billion Buyback
Binance News
·19 Likes
·20.1k views
AnthropicIPOPriceCouldExceed$80
595 views
26 Discussing
CanNvidia’sDataCenterGrowthContinue?
1,077 views
36 Discussing