
Joao Wedson
76 Posts

Joao Wedson
Report
Block User
💎Founder & CEO of @Alphractal
🏅Verified Author at CoinMarketCap & CryptoQuant
⚙ MSc in Data Science & AI
🦾Engineer in Robotics & Automation
₿itcoin OG
0 Following
4 Followers
11 Liked
Posts
·
--
Will we never see Bitcoin below $40K again?
This is not a prediction. It is simply an interesting observation based on the Balanced Price, a metric that has historically been extremely effective at identifying deep Bitcoin cycle bottoms.
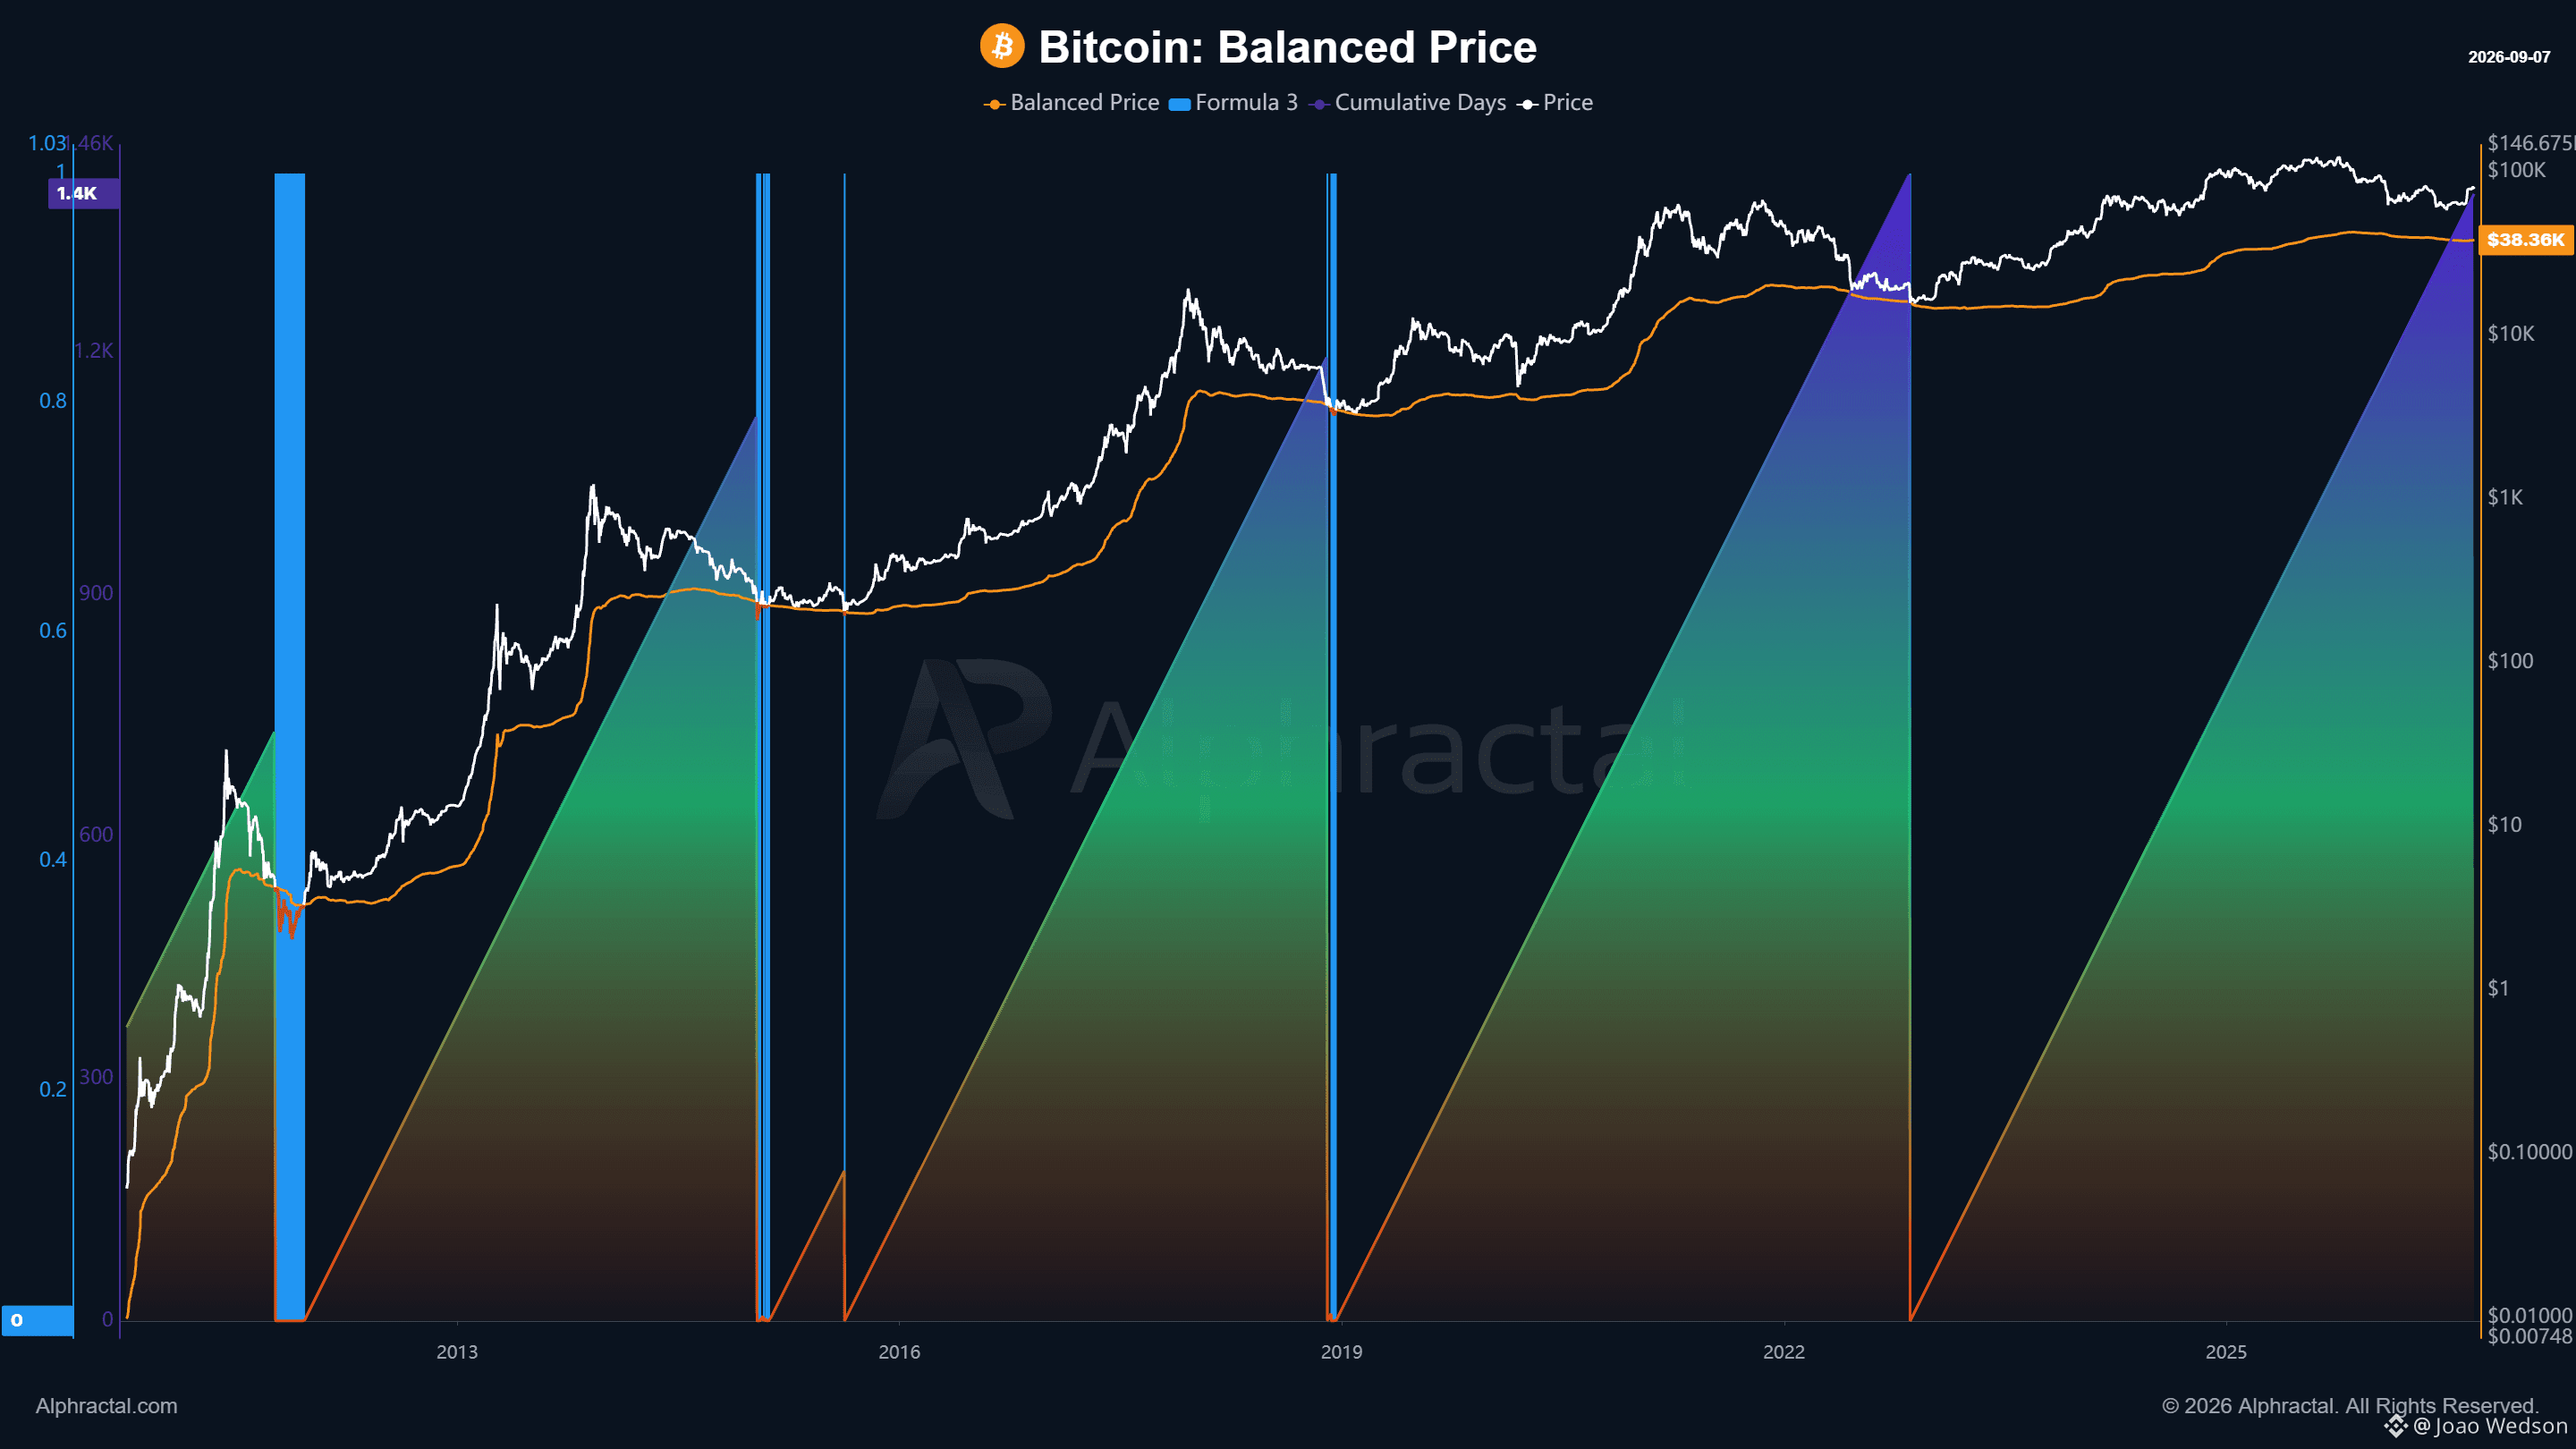
The cumulative time between the main price interactions with this zone has been increasing:
732 days → 1.12K → 1.20K → 1.42K days
The current cycle has already accumulated approximately 1.40K days since the last interaction with the Balanced Price.
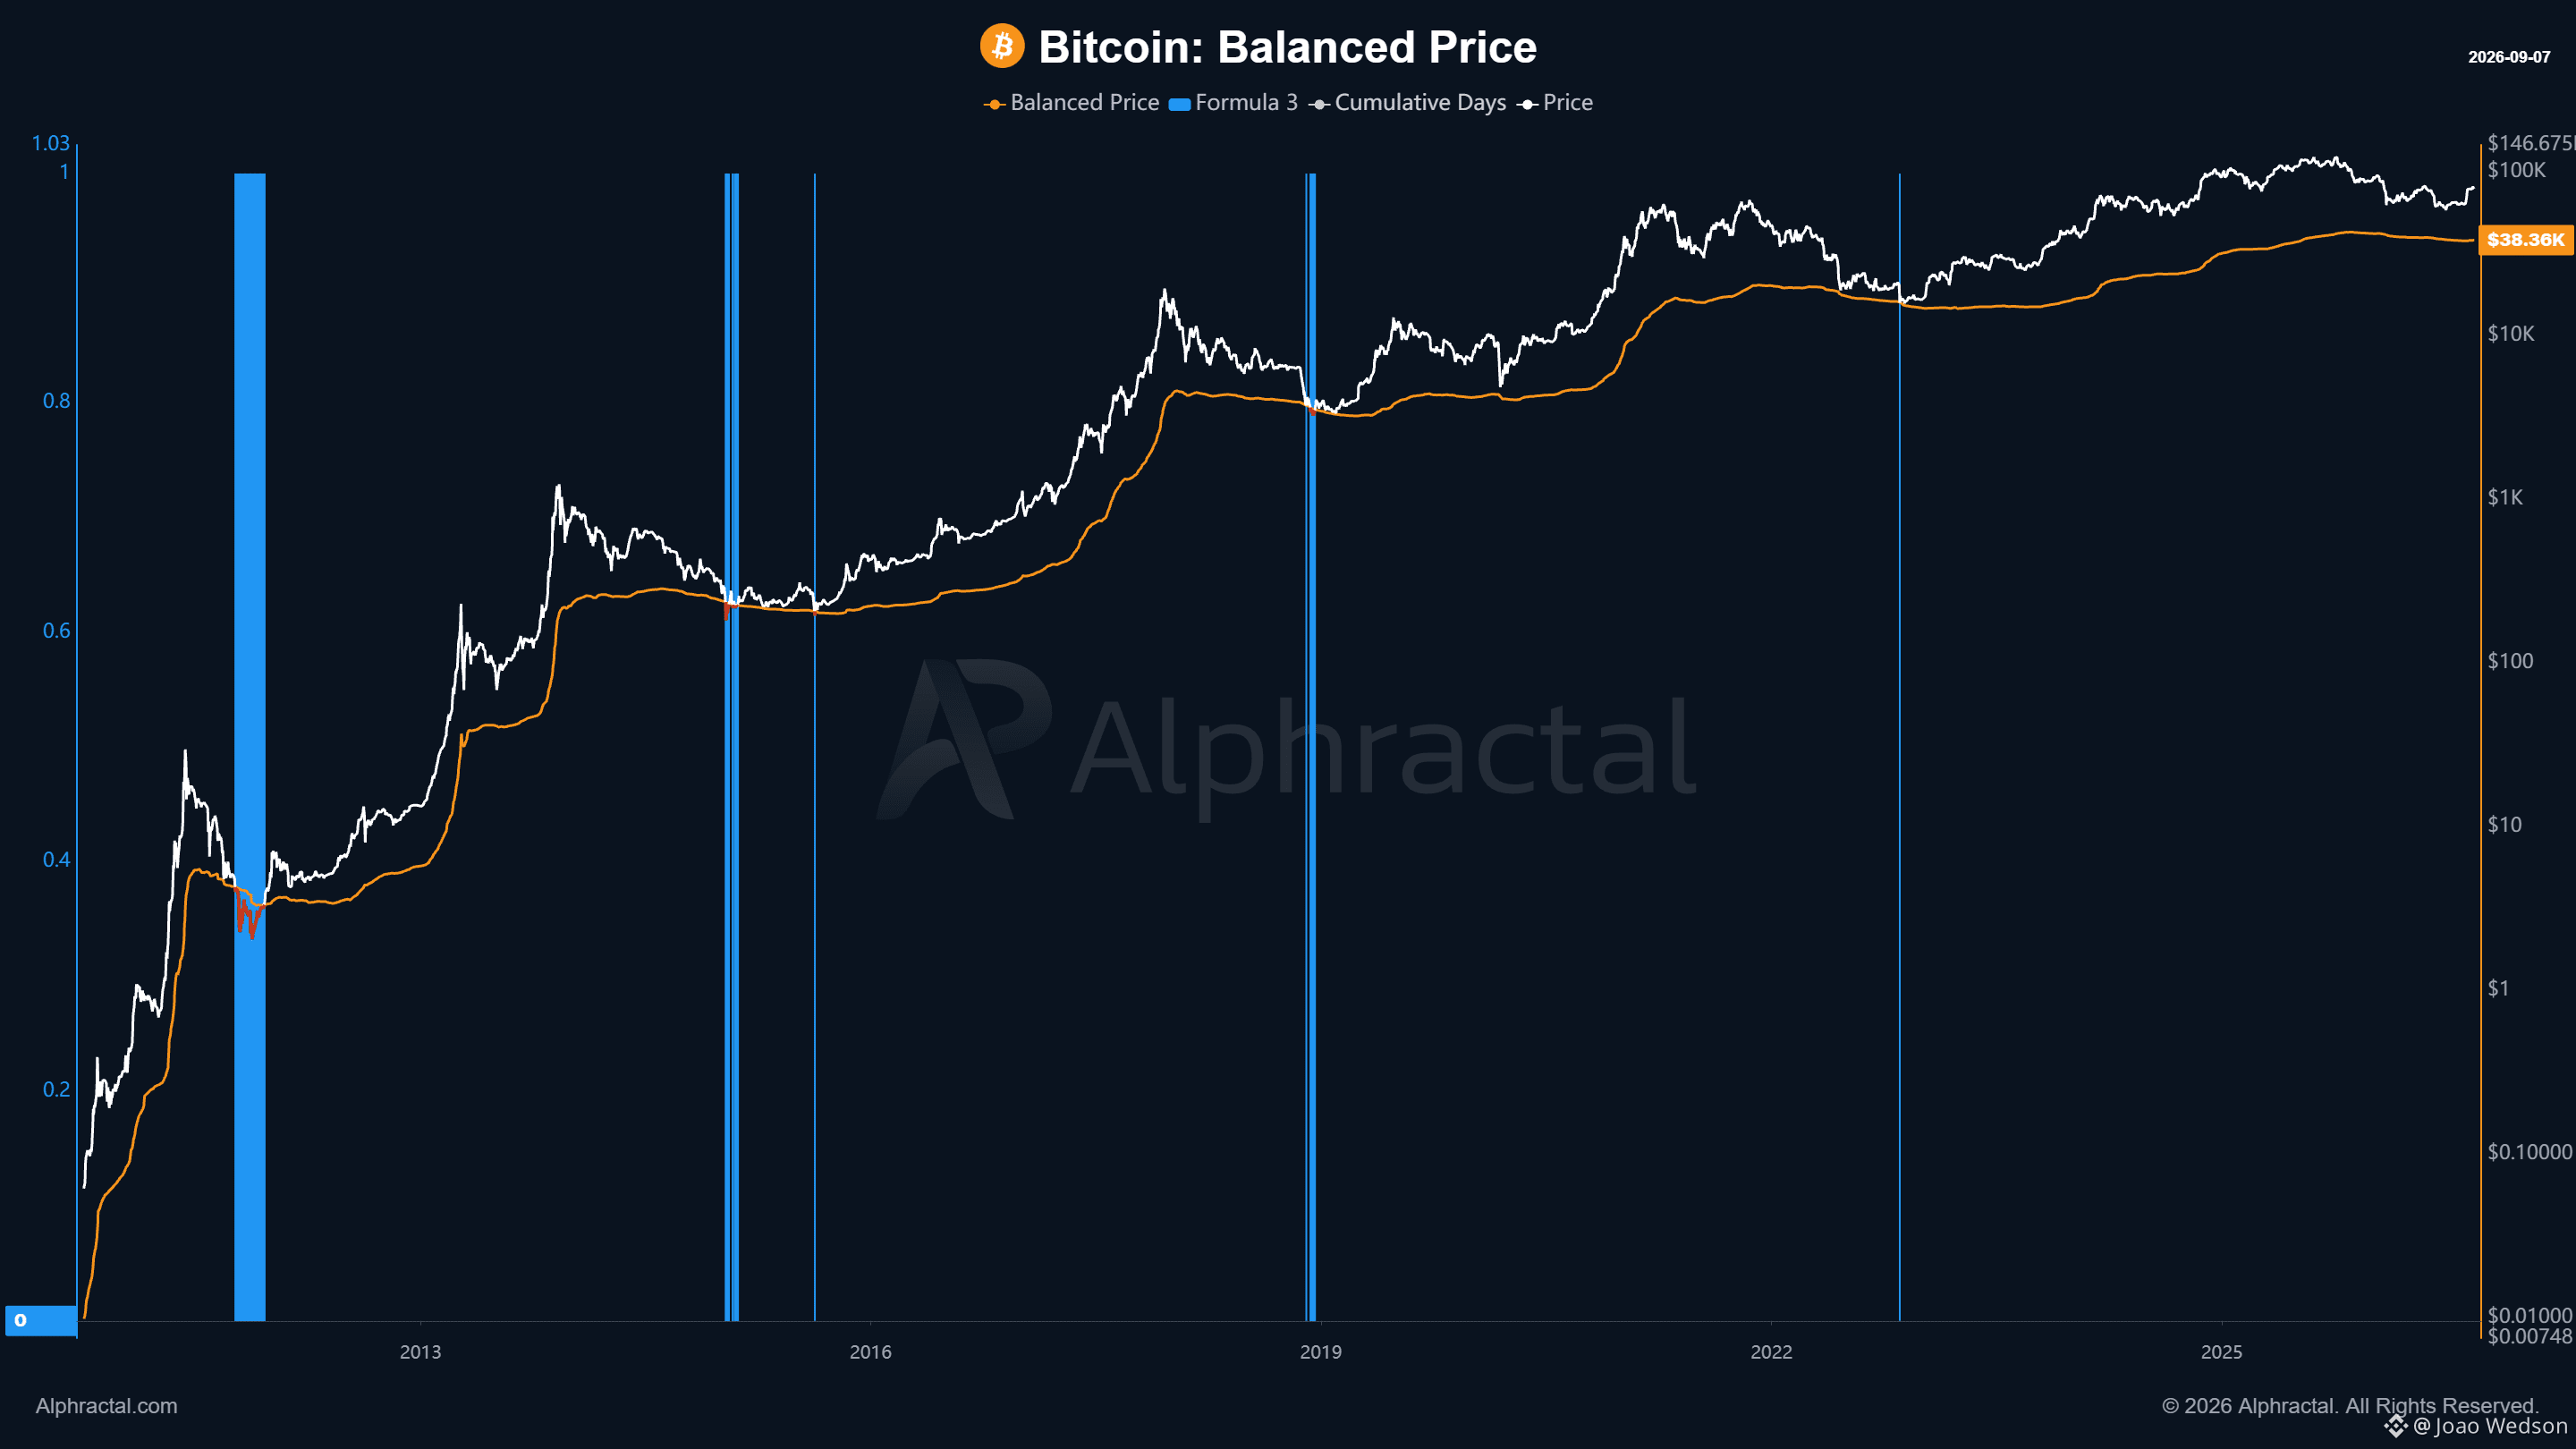
There is another interesting detail: the amount of time Bitcoin spends below this metric has also been decreasing. In the early cycles, it stayed below for several weeks, then around 20 days, later even less, and in 2022 the price remained below this zone for practically 1 day.
Today, the Balanced Price is near $38.4K.
Balanced Price adjusts the market’s aggregate cost basis by the long-term spending footprint of older coins, creating a valuation zone that has historically appeared during extreme capitulation periods.
This does not mean Bitcoin needs to return to $38K. The historical evolution itself raises a more interesting question:
What if, at some point, Bitcoin simply stops revisiting the Balanced Price?
On the other hand, if this historical behavior repeats once again, then yes, we would have an on-chain justification for considering the $40K region as a possible capitulation target. Access now! https://app.alphractal.com/plans?utm_source=coinmarketcap&utm_medium=update&utm_campaign=founding_access&utm_content=ceo_joao
Will we never see Bitcoin below $40K again?
This is not a prediction. It is simply an interesting observation based on the Balanced Price, a metric that has historically been extremely effective at identifying deep Bitcoin cycle bottoms.
The cumulative time between the main price interactions with this zone has been increasing:
732 days → 1.12K → 1.20K → 1.42K days
The current cycle has already accumulated approximately 1.40K days since the last interaction with the Balanced Price.
There is another interesting detail: the amount of time Bitcoin spends below this metric has also been decreasing. In the early cycles, it stayed below for several weeks, then around 20 days, later even less, and in 2022 the price remained below this zone for practically 1 day.
Today, the Balanced Price is near $38.4K.
Balanced Price adjusts the market’s aggregate cost basis by the long-term spending footprint of older coins, creating a valuation zone that has historically appeared during extreme capitulation periods.
This does not mean Bitcoin needs to return to $38K. The historical evolution itself raises a more interesting question:
What if, at some point, Bitcoin simply stops revisiting the Balanced Price?
On the other hand, if this historical behavior repeats once again, then yes, we would have an on-chain justification for considering the $40K region as a possible capitulation target. Access now! https://app.alphractal.com/plans?utm_source=coinmarketcap&utm_medium=update&utm_campaign=founding_access&utm_content=ceo_joao
This is not a prediction. It is simply an interesting observation based on the Balanced Price, a metric that has historically been extremely effective at identifying deep Bitcoin cycle bottoms.
The cumulative time between the main price interactions with this zone has been increasing:
732 days → 1.12K → 1.20K → 1.42K days
The current cycle has already accumulated approximately 1.40K days since the last interaction with the Balanced Price.
There is another interesting detail: the amount of time Bitcoin spends below this metric has also been decreasing. In the early cycles, it stayed below for several weeks, then around 20 days, later even less, and in 2022 the price remained below this zone for practically 1 day.
Today, the Balanced Price is near $38.4K.
Balanced Price adjusts the market’s aggregate cost basis by the long-term spending footprint of older coins, creating a valuation zone that has historically appeared during extreme capitulation periods.
This does not mean Bitcoin needs to return to $38K. The historical evolution itself raises a more interesting question:
What if, at some point, Bitcoin simply stops revisiting the Balanced Price?
On the other hand, if this historical behavior repeats once again, then yes, we would have an on-chain justification for considering the $40K region as a possible capitulation target. Access now! https://app.alphractal.com/plans?utm_source=coinmarketcap&utm_medium=update&utm_campaign=founding_access&utm_content=ceo_joao
46
·
--
New video is live.
Crypto narratives change faster than most people realize.
And very often, the reason is simple: price moves first, then the narrative follows.
In this video, I explore crypto sentiment from a different perspective using:
Google Trends
Crypto influencer activity
Number of posts
Fear & Greed Index
Wikipedia interest
Alphractal sentiment metrics
And more
The goal is to understand how attention, conviction and market narratives change depending on price action.
Sometimes the most interesting signal is not what people are saying.
It is when they start saying it.
Watch the full video here:
https://youtu.be/LhTu8OzN7WI
New video is live.
Crypto narratives change faster than most people realize.
And very often, the reason is simple: price moves first, then the narrative follows.
In this video, I explore crypto sentiment from a different perspective using:
Google Trends
Crypto influencer activity
Number of posts
Fear & Greed Index
Wikipedia interest
Alphractal sentiment metrics
And more
The goal is to understand how attention, conviction and market narratives change depending on price action.
Sometimes the most interesting signal is not what people are saying.
It is when they start saying it.
Watch the full video here:
https://youtu.be/LhTu8OzN7WI
Crypto narratives change faster than most people realize.
And very often, the reason is simple: price moves first, then the narrative follows.
In this video, I explore crypto sentiment from a different perspective using:
Google Trends
Crypto influencer activity
Number of posts
Fear & Greed Index
Wikipedia interest
Alphractal sentiment metrics
And more
The goal is to understand how attention, conviction and market narratives change depending on price action.
Sometimes the most interesting signal is not what people are saying.
It is when they start saying it.
Watch the full video here:
https://youtu.be/LhTu8OzN7WI
78
·
--
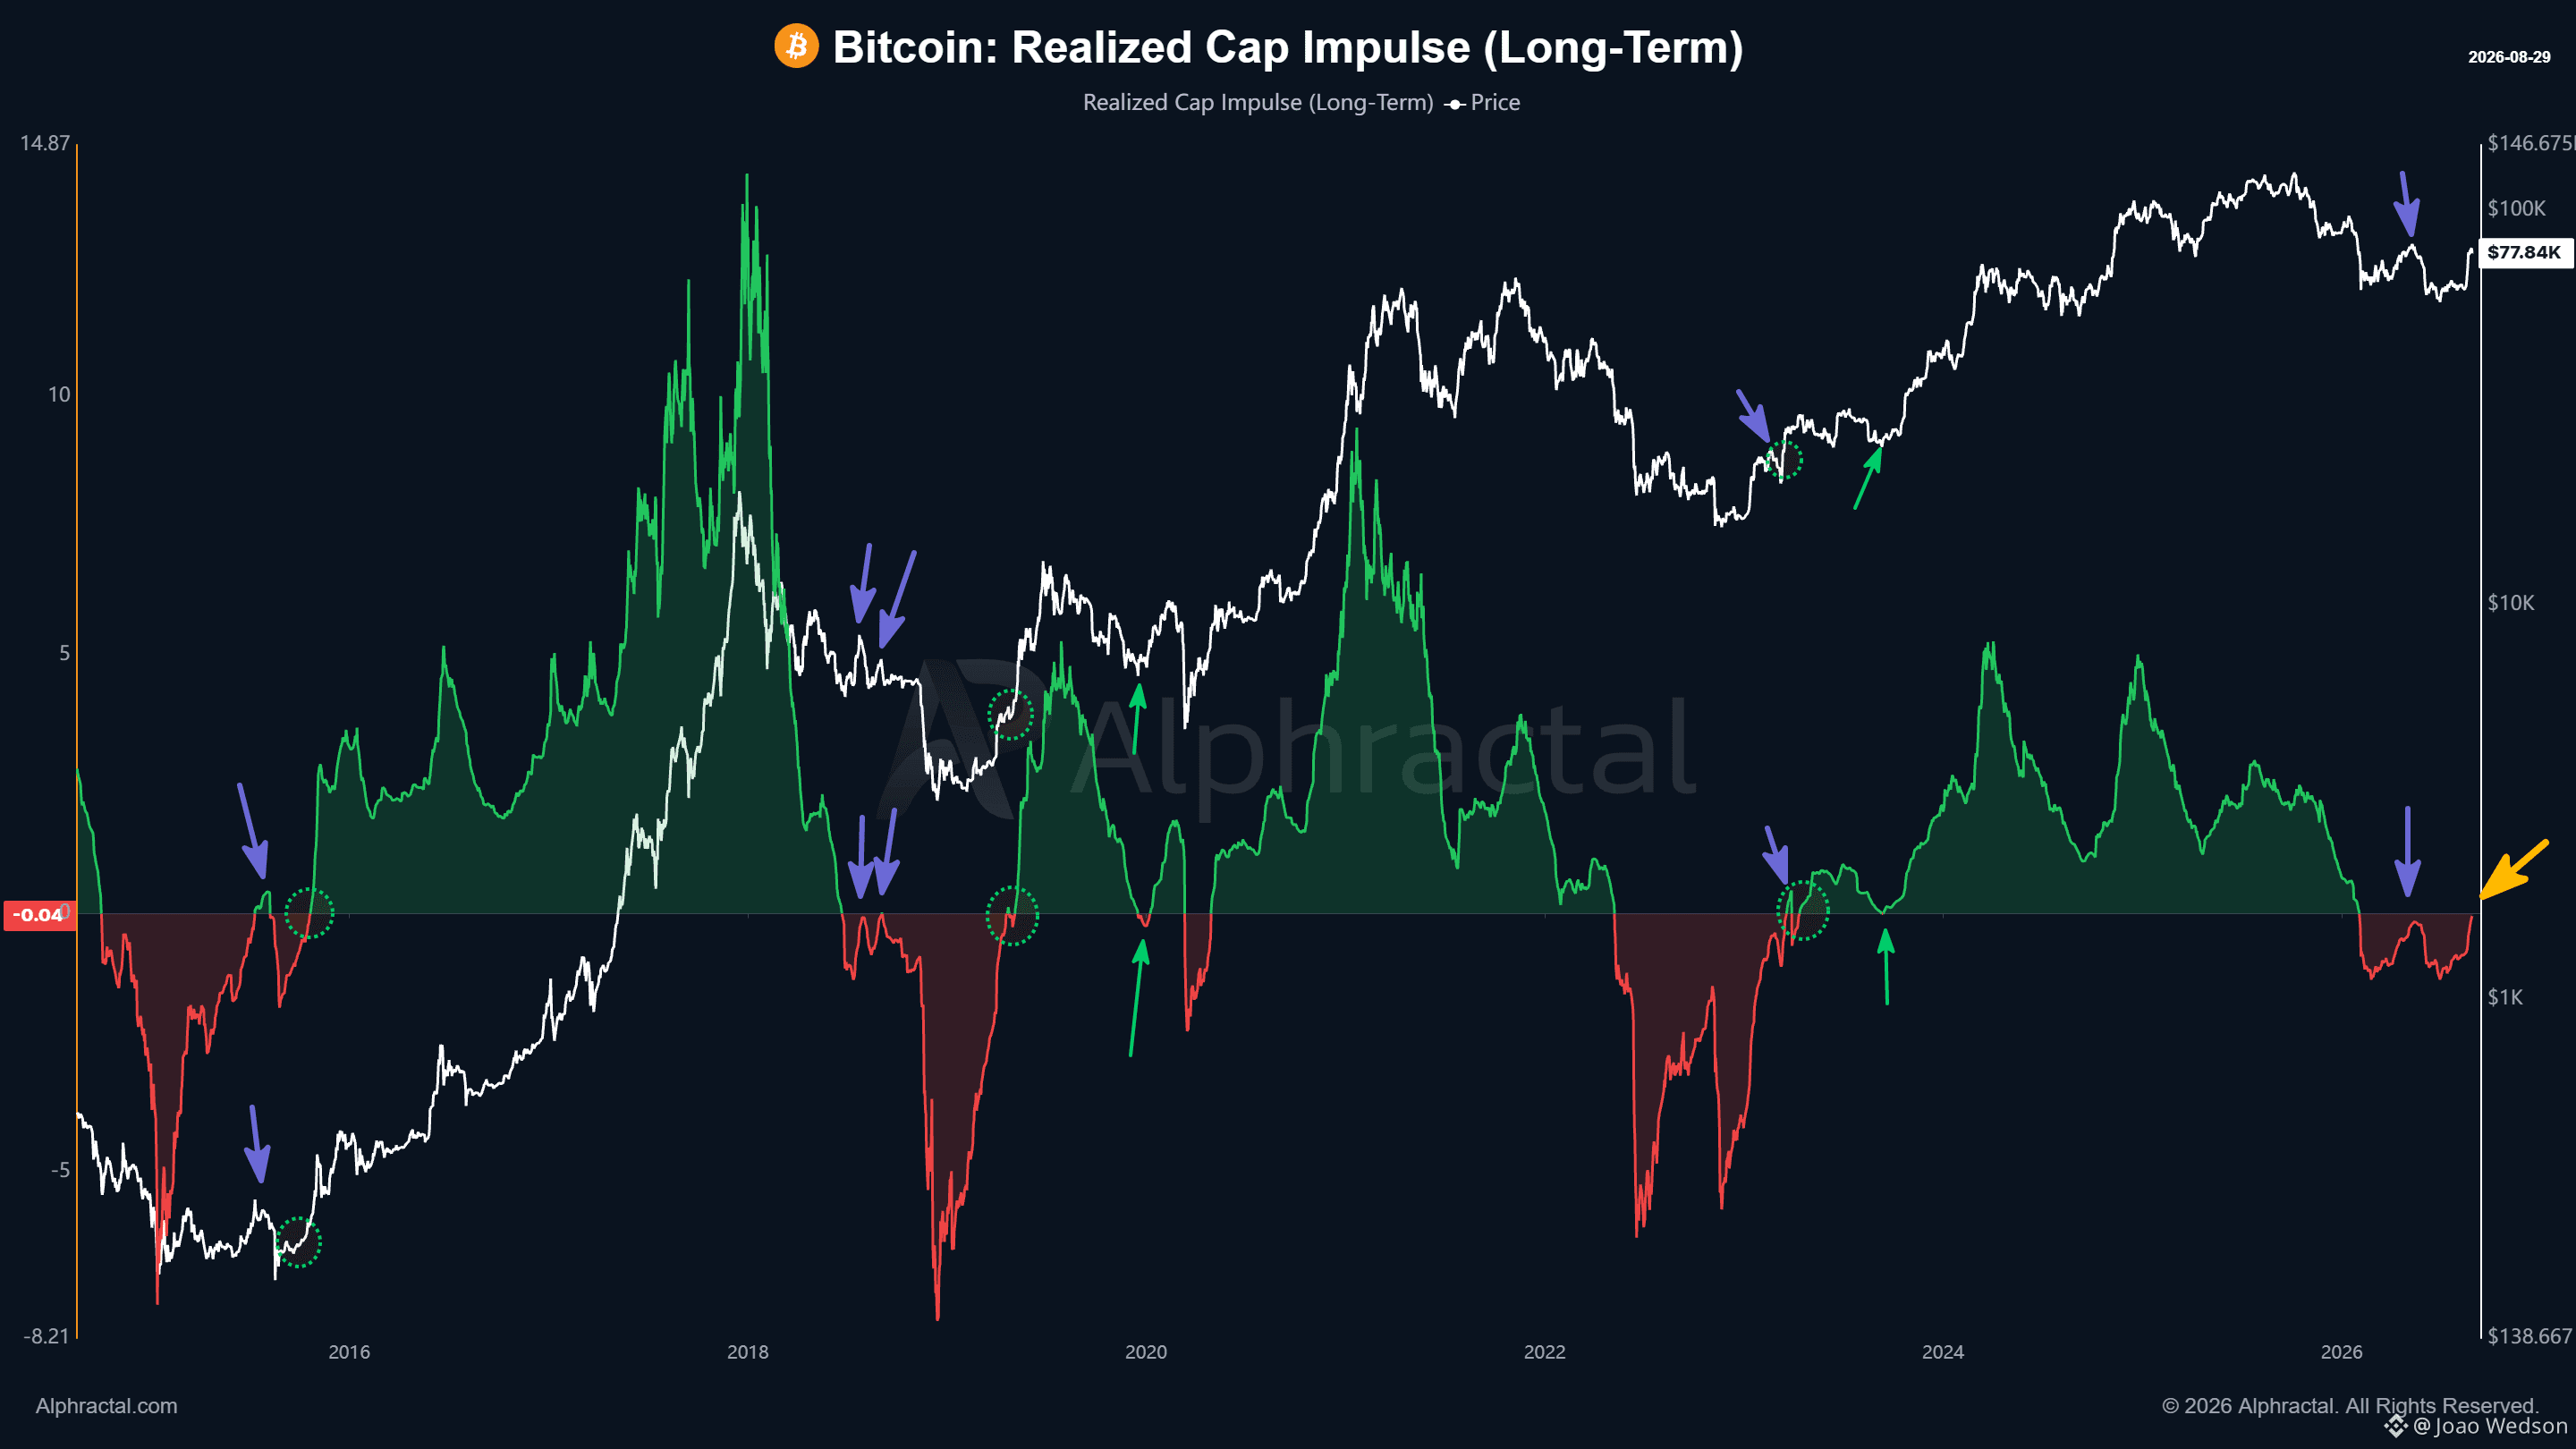
The Realized Cap Impulse is approaching positive territory again, which makes the current setup particularly important. This metric helps track longer-term changes in Bitcoin’s realized capitalization and gives us a view of when capital is starting to circulate more consistently onchain. Historically, one of the more constructive signals has appeared when the indicator stays **above zero for at least two weeks**. When that happens, it has often aligned with a **Bull Market environment**, suggesting that fresh demand is entering and capital is once again supporting the market structure. There is, however, an important risk to consider. In previous cycles, the first attempt to turn positive did not always lead directly to continuation. The **Realized Cap Impulse** has sometimes behaved like resistance. In those cases, Bitcoin either formed a **higher low** before recovering, or moved into another leg lower, as we saw in 2018. That makes the next few days especially relevant for onchain analysis. The key question now is whether the indicator can hold above zero with sustained capital flows, or whether new selling pressure appears and forces another rejection. If it manages to remain positive, that would be a very constructive signal for the broader Bitcoin cycle. Want access to this metric and 1,500+ indicators covering on-chain data, derivatives, liquidations, macro, and market structure? Get 50% OFF Alphractal for a limited time with code BEAR50. https://app.alphractal.com/plans?utm_source=coinmarketcap&utm_medium=update&utm_campaign=founding_access&utm_content=ceo_joao
The Realized Cap Impulse is approaching positive territory again, which makes the current setup particularly important. This metric helps track longer-term changes in Bitcoin’s realized capitalization and gives us a view of when capital is starting to circulate more consistently onchain. Historically, one of the more constructive signals has appeared when the indicator stays **above zero for at least two weeks**. When that happens, it has often aligned with a **Bull Market environment**, suggesting that fresh demand is entering and capital is once again supporting the market structure. There is, however, an important risk to consider. In previous cycles, the first attempt to turn positive did not always lead directly to continuation. The **Realized Cap Impulse** has sometimes behaved like resistance. In those cases, Bitcoin either formed a **higher low** before recovering, or moved into another leg lower, as we saw in 2018. That makes the next few days especially relevant for onchain analysis. The key question now is whether the indicator can hold above zero with sustained capital flows, or whether new selling pressure appears and forces another rejection. If it manages to remain positive, that would be a very constructive signal for the broader Bitcoin cycle. Want access to this metric and 1,500+ indicators covering on-chain data, derivatives, liquidations, macro, and market structure? Get 50% OFF Alphractal for a limited time with code BEAR50. https://app.alphractal.com/plans?utm_source=coinmarketcap&utm_medium=update&utm_campaign=founding_access&utm_content=ceo_joao
73
·
--
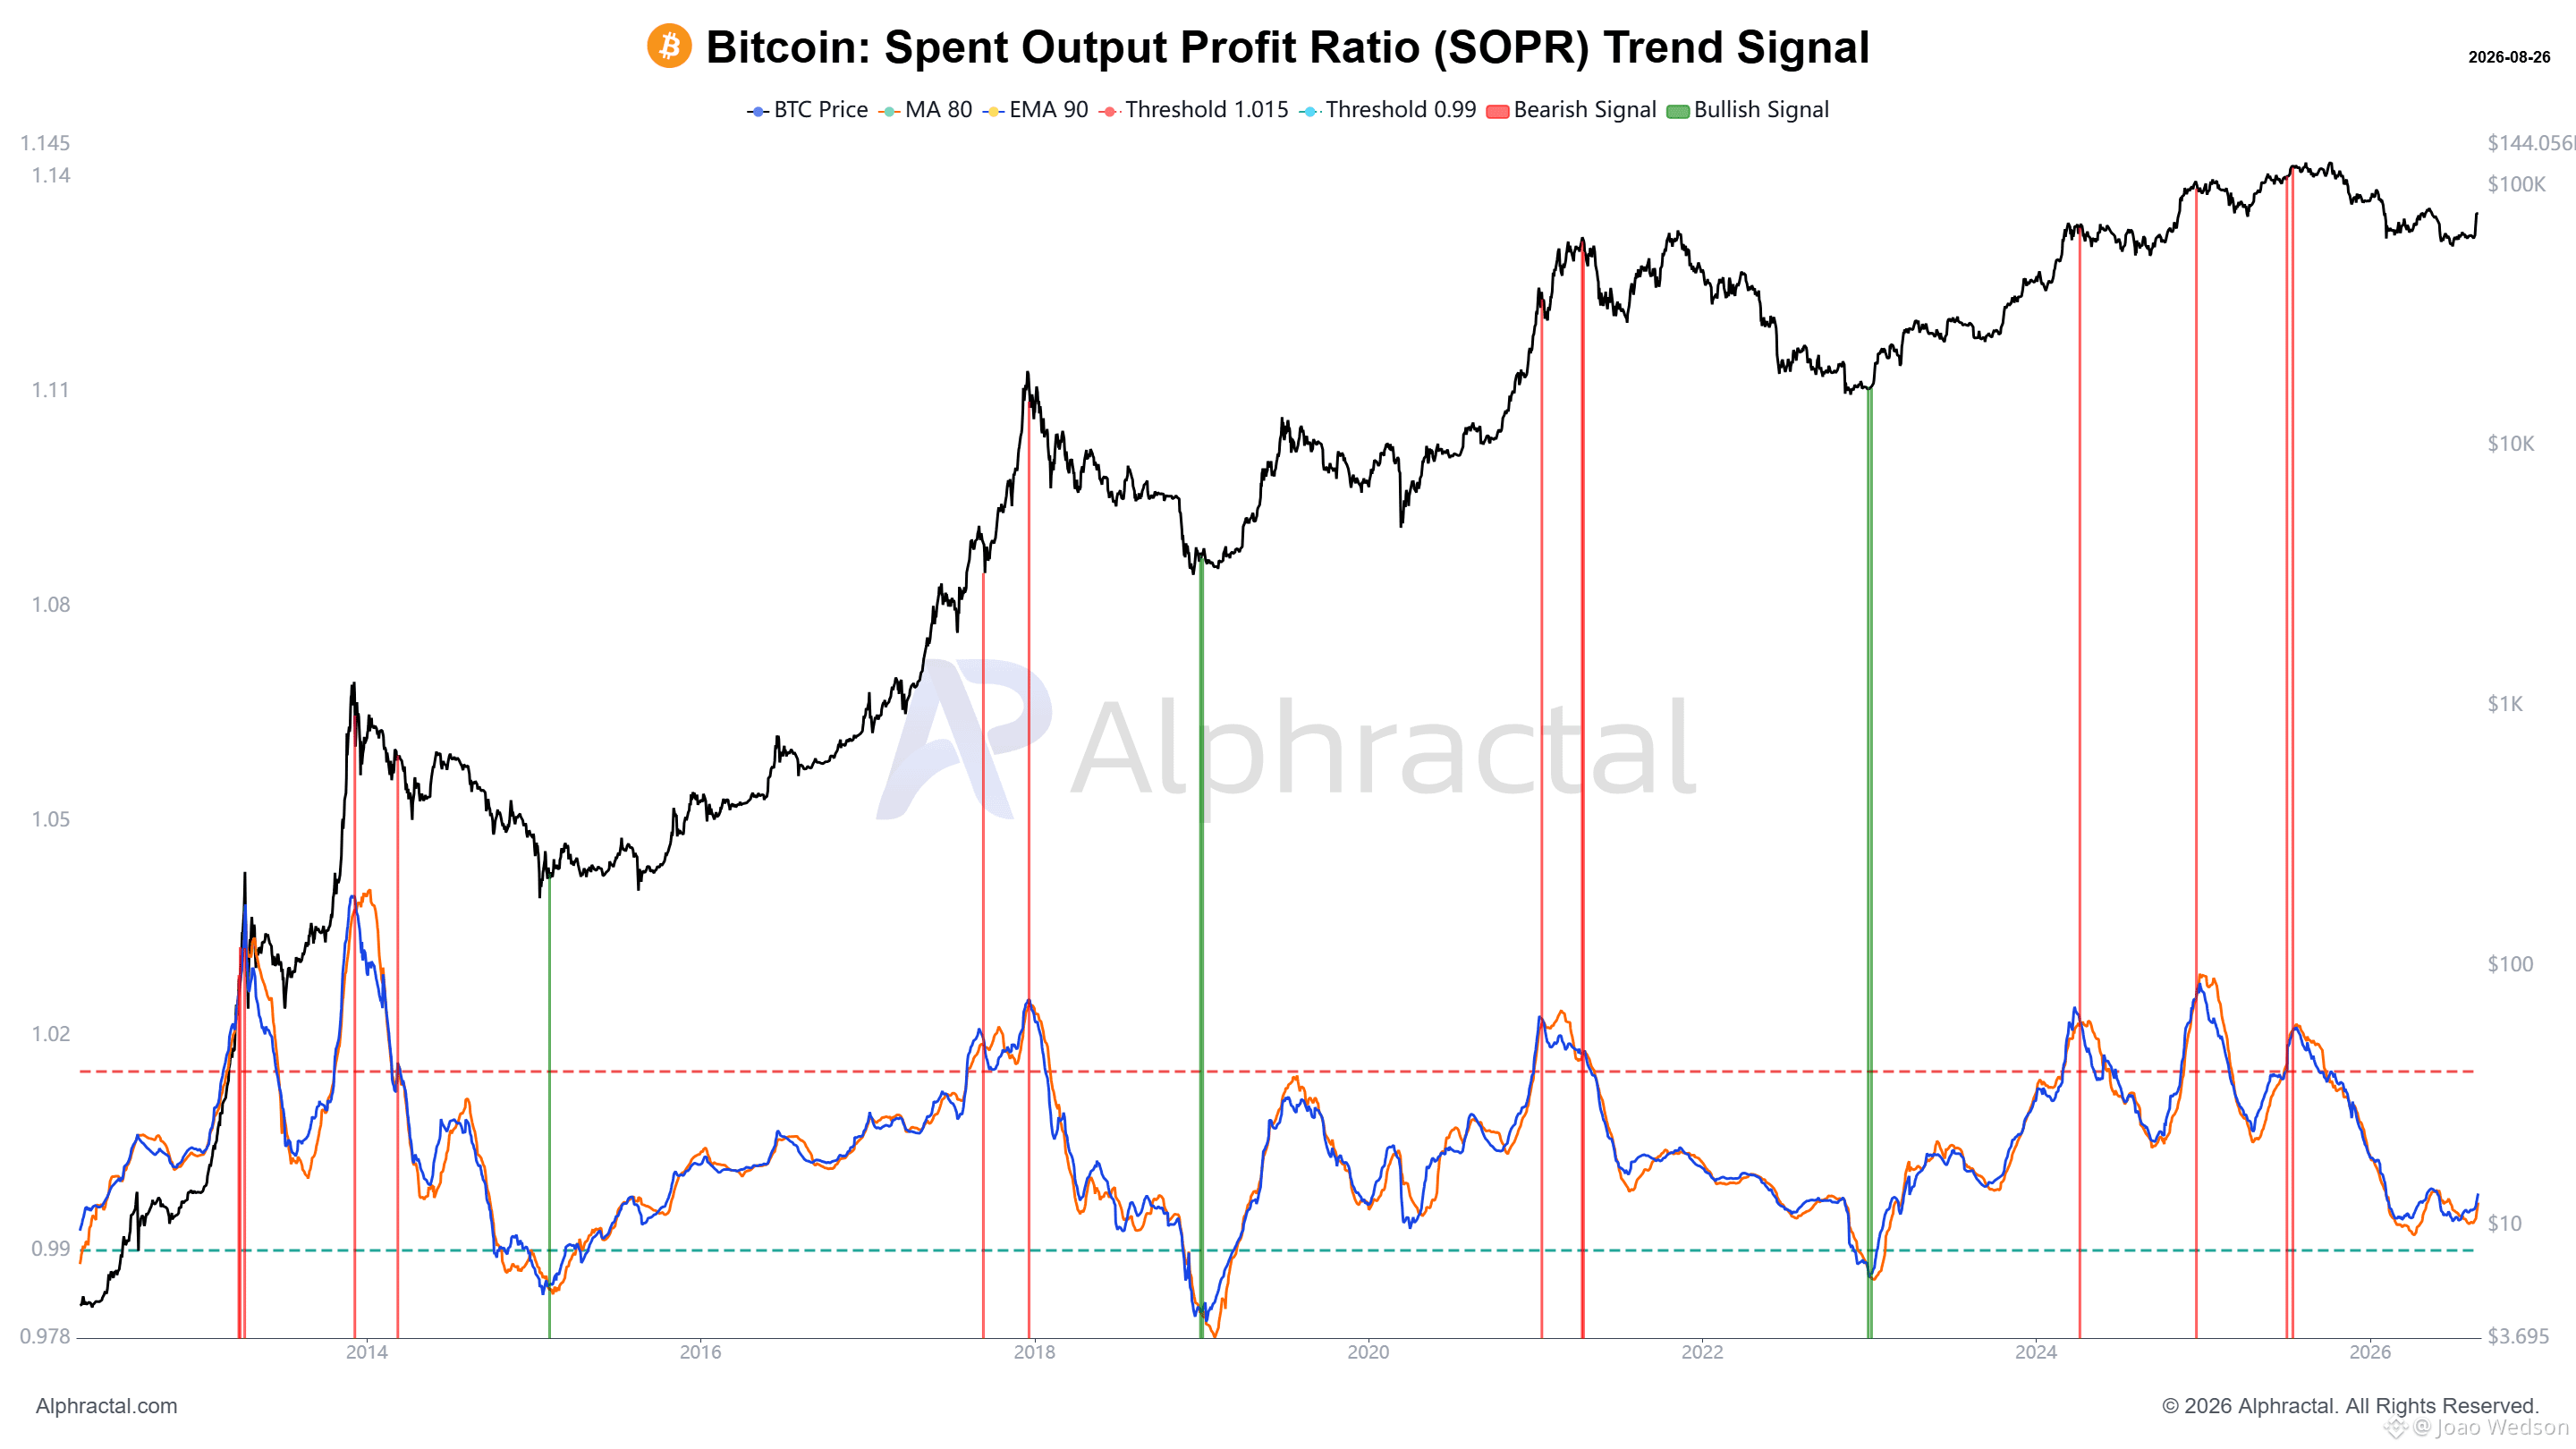
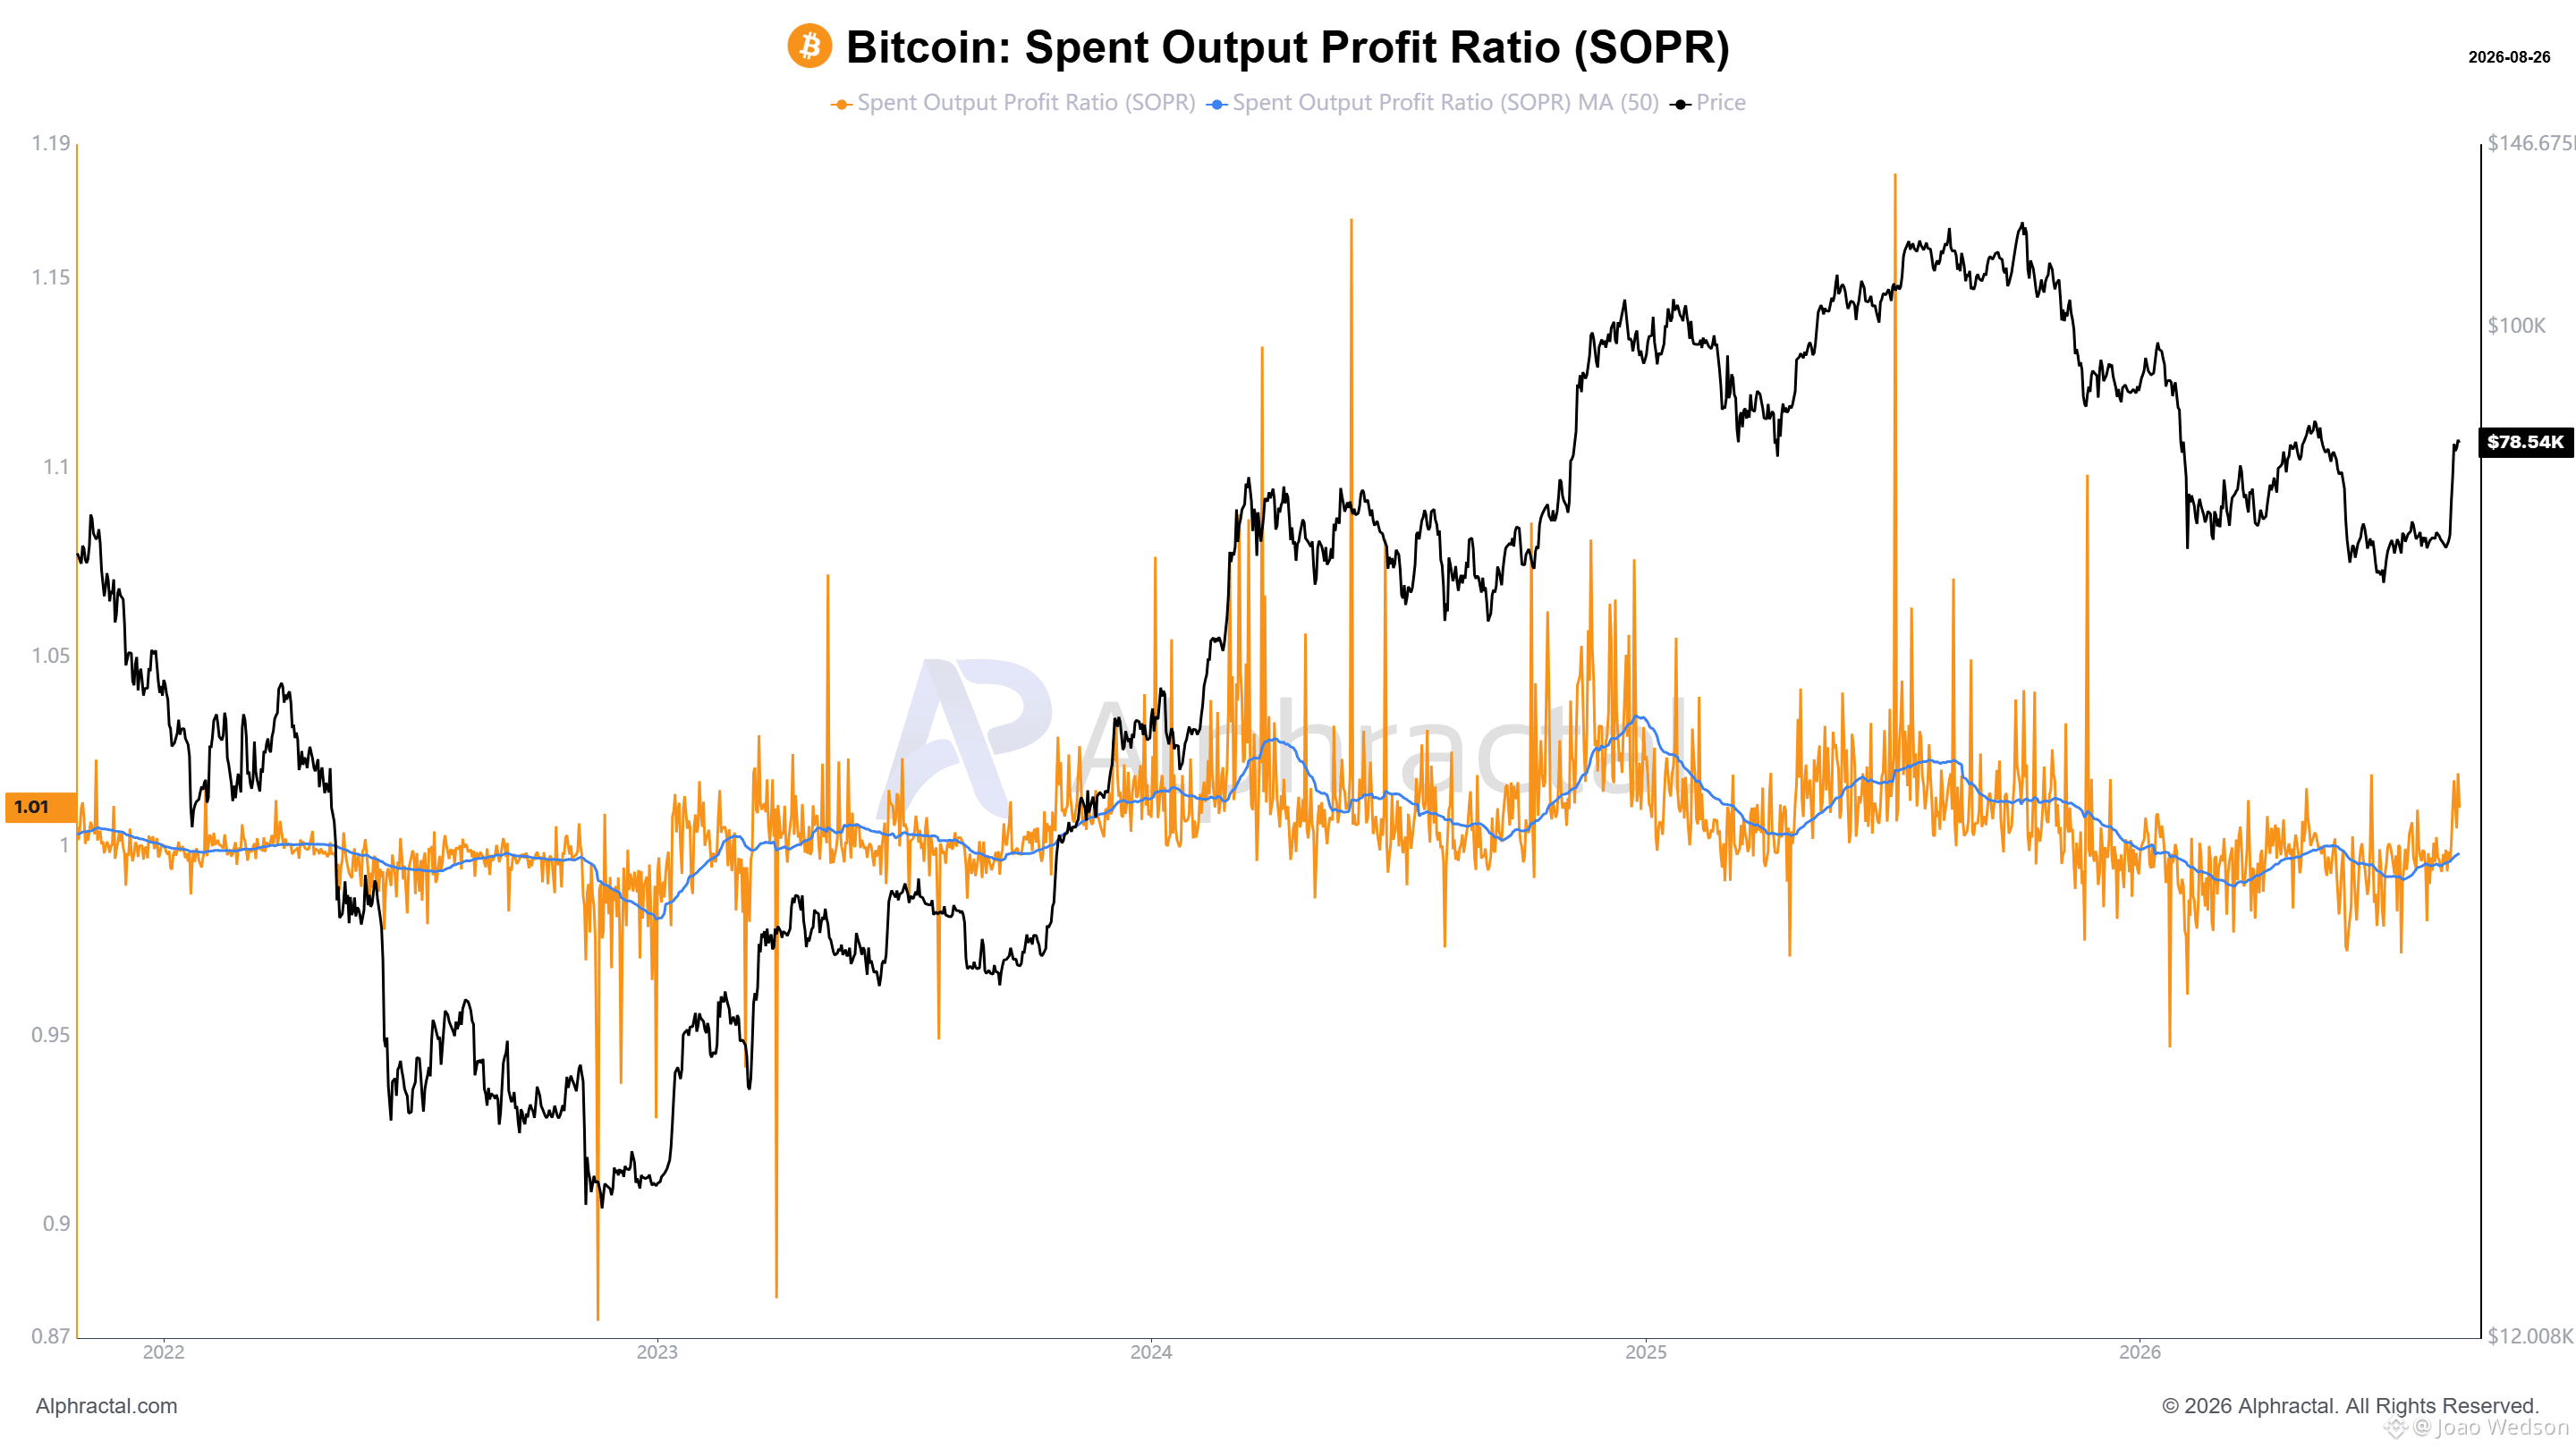
⚠️On-chain spending is still occurring in a profit-dominated regime. So far in this latest bearish cycle, we have not seen large-scale movements at significant losses like we did in 2022, for example. I’m not saying that this will necessarily happen. I’m simply sharing what is happening on the Bitcoin blockchain right now. And the SOPR Trend Signal, which has historically provided excellent medium and long-term buy and sell signals, has still not generated a Bullish Signal. Interestingly, that signal appeared around every major price bottom in the past. So the question we should be asking is: will Bitcoin fall again, or are these types of opportunity signals simply not going to return this time? Given my approach, I prefer to remain patient a little longer before declaring that the Bull Market has already begun, as many are doing. 🔥Take advantage of Alphractal’s free trial! There are probably countless signals waiting for you there. The market is not very forgiving to those who act too early. And yes, the 50% discount is still available this week on any plan. Every plan includes Signals, MCP, Telegram Bot with Alpha AI, Email/Telegram Alerts, Workbench, and a whole universe of tools and insights. https://app.alphractal.com/plans?utm_source=coinmarketcap&utm_medium=update&utm_campaign=founding_access&utm_content=ceo_joao
⚠️On-chain spending is still occurring in a profit-dominated regime. So far in this latest bearish cycle, we have not seen large-scale movements at significant losses like we did in 2022, for example. I’m not saying that this will necessarily happen. I’m simply sharing what is happening on the Bitcoin blockchain right now. And the SOPR Trend Signal, which has historically provided excellent medium and long-term buy and sell signals, has still not generated a Bullish Signal. Interestingly, that signal appeared around every major price bottom in the past. So the question we should be asking is: will Bitcoin fall again, or are these types of opportunity signals simply not going to return this time? Given my approach, I prefer to remain patient a little longer before declaring that the Bull Market has already begun, as many are doing. 🔥Take advantage of Alphractal’s free trial! There are probably countless signals waiting for you there. The market is not very forgiving to those who act too early. And yes, the 50% discount is still available this week on any plan. Every plan includes Signals, MCP, Telegram Bot with Alpha AI, Email/Telegram Alerts, Workbench, and a whole universe of tools and insights. https://app.alphractal.com/plans?utm_source=coinmarketcap&utm_medium=update&utm_campaign=founding_access&utm_content=ceo_joao
69
·
--
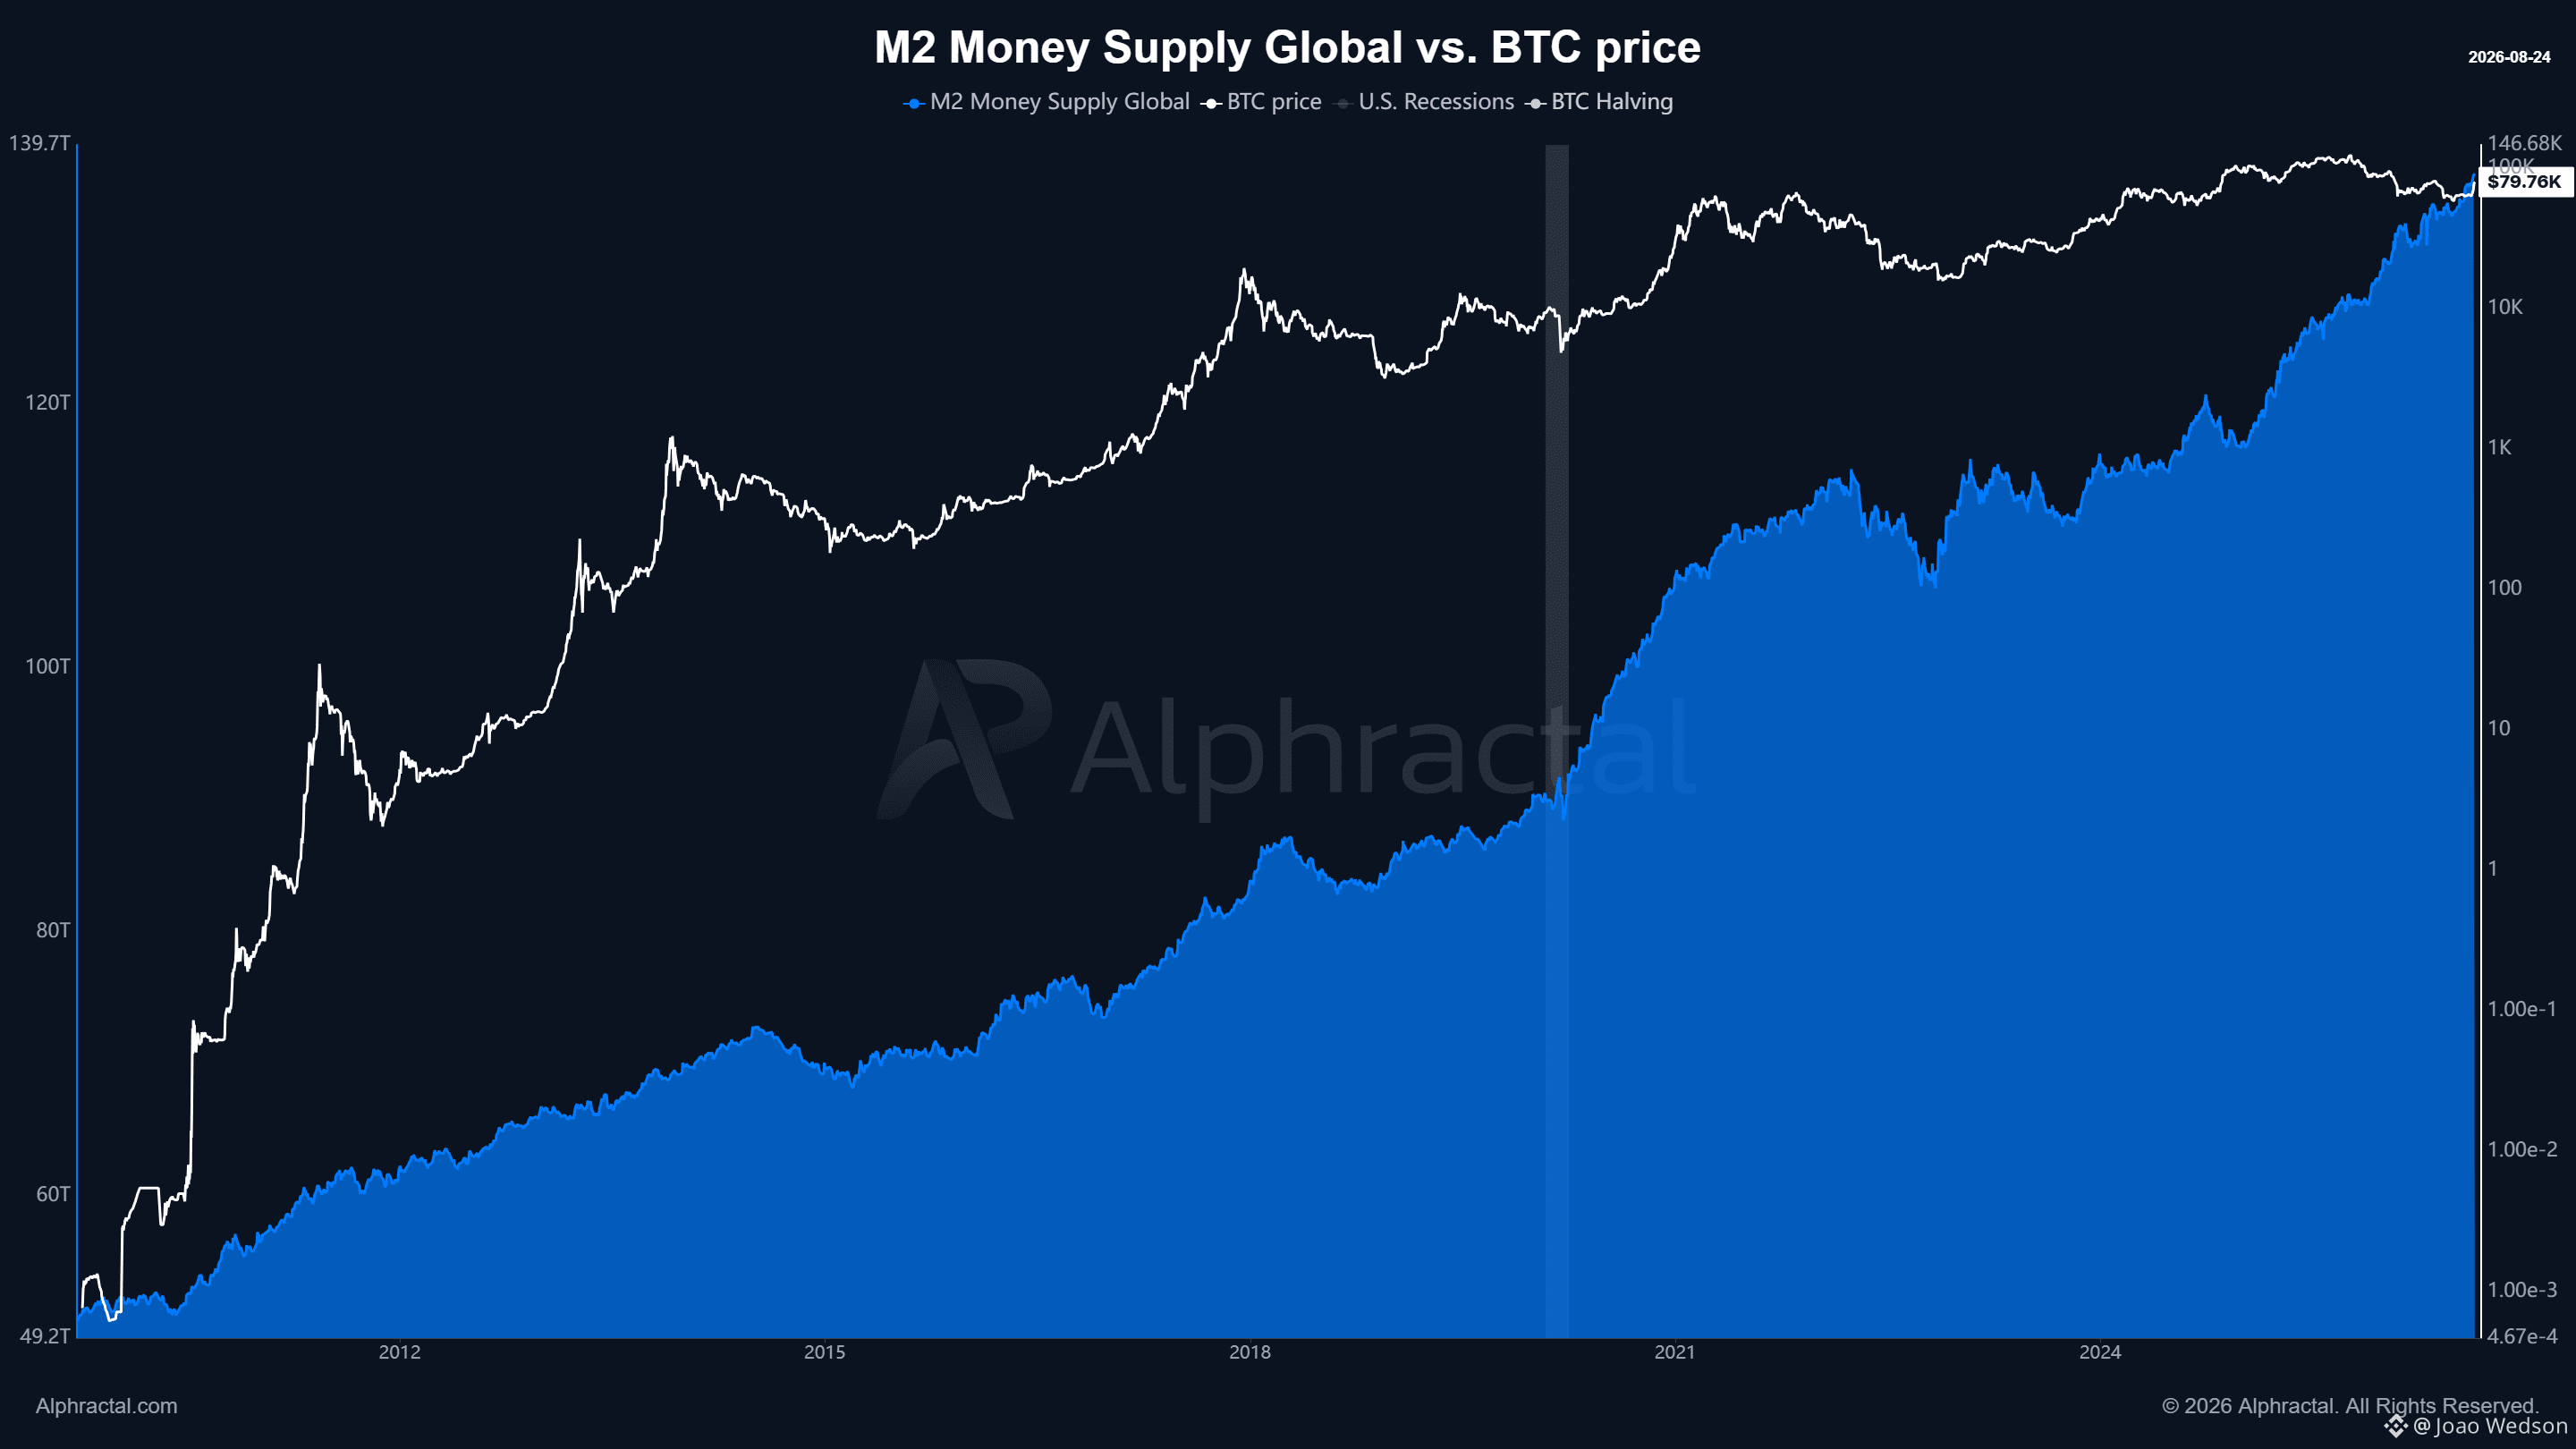
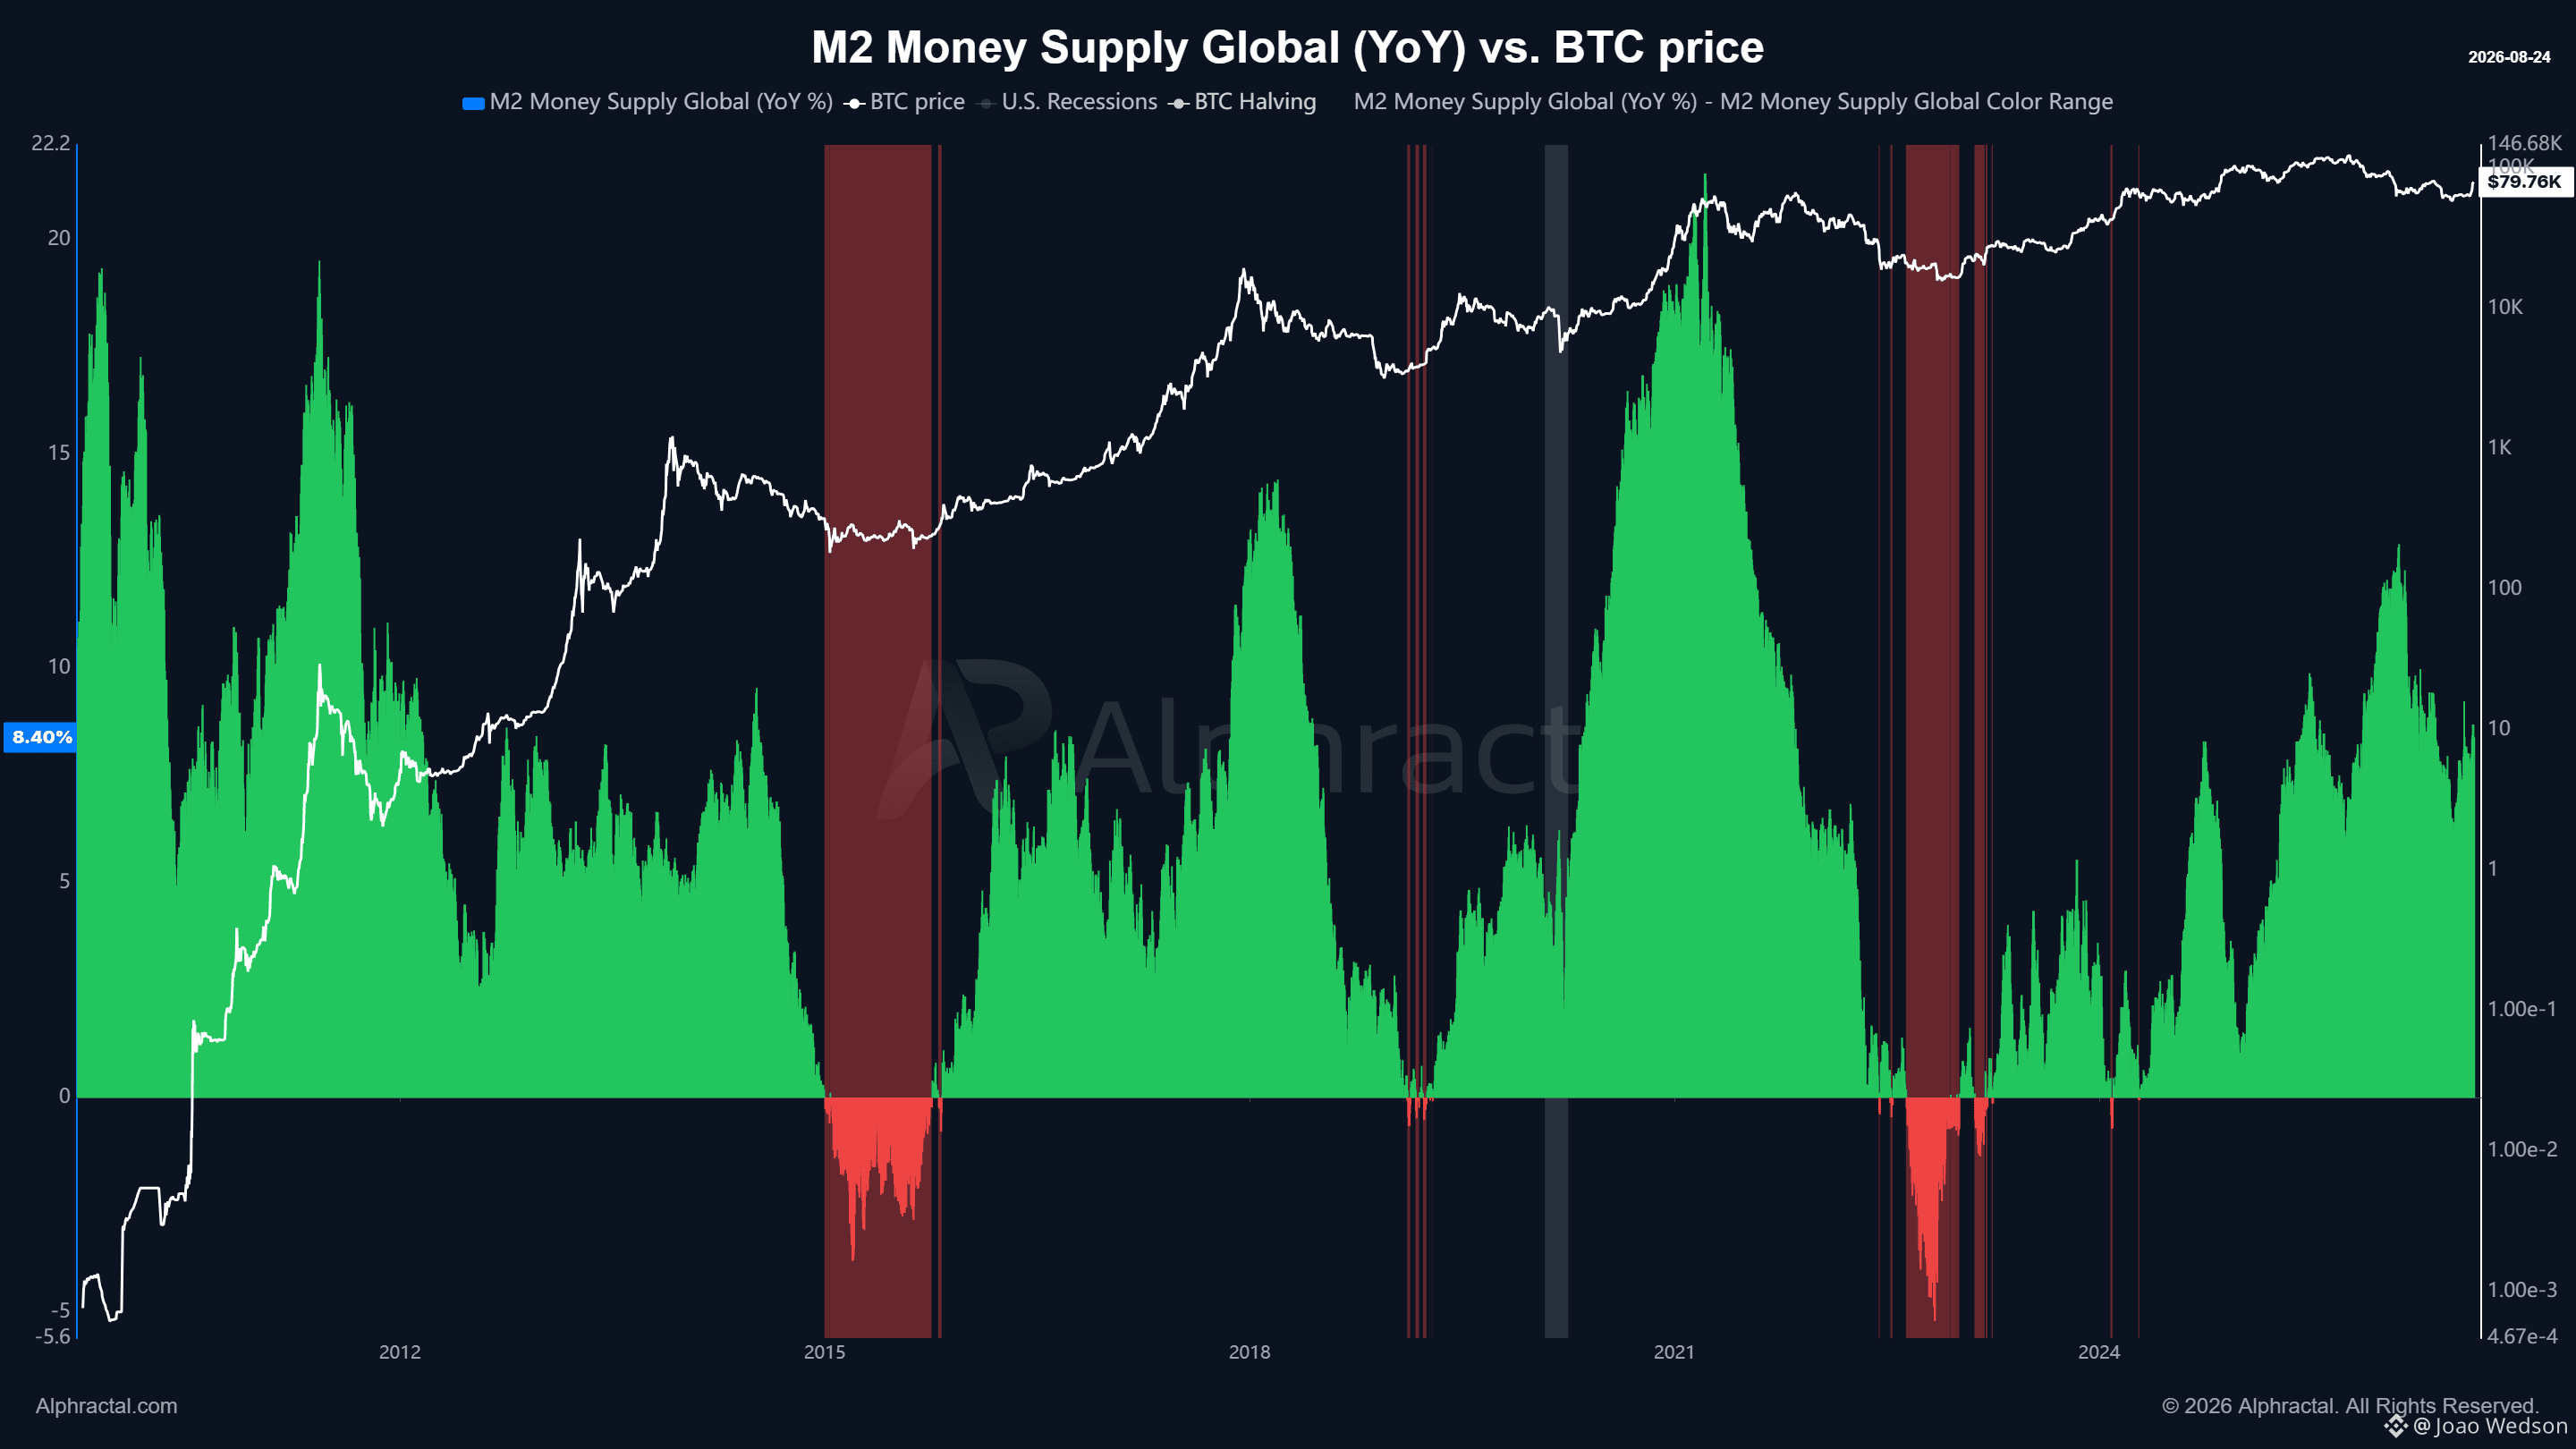
Global M2 is telling an interesting story.
In the last 3 major Bitcoin bear-market cycles, Global M2 YoY falling into negative territory aligned closely with BTC’s price bottom:
2015
2018–2019
2022
Each time, Bitcoin was already near its cycle low as global liquidity growth reached its weakest point.
But today the picture is very different.
Global M2 YoY is still strongly positive at around 8.4%, while Bitcoin is trading near $80K.
If history rhymes, this is a major macro divergence worth watching closely.
Take advantage of 50% off all plans for a limited time!
app.alphractal.com
Global M2 is telling an interesting story.
In the last 3 major Bitcoin bear-market cycles, Global M2 YoY falling into negative territory aligned closely with BTC’s price bottom:
2015
2018–2019
2022
Each time, Bitcoin was already near its cycle low as global liquidity growth reached its weakest point.
But today the picture is very different.
Global M2 YoY is still strongly positive at around 8.4%, while Bitcoin is trading near $80K.
If history rhymes, this is a major macro divergence worth watching closely.
Take advantage of 50% off all plans for a limited time!
app.alphractal.com
In the last 3 major Bitcoin bear-market cycles, Global M2 YoY falling into negative territory aligned closely with BTC’s price bottom:
2015
2018–2019
2022
Each time, Bitcoin was already near its cycle low as global liquidity growth reached its weakest point.
But today the picture is very different.
Global M2 YoY is still strongly positive at around 8.4%, while Bitcoin is trading near $80K.
If history rhymes, this is a major macro divergence worth watching closely.
Take advantage of 50% off all plans for a limited time!
app.alphractal.com
57
·
--
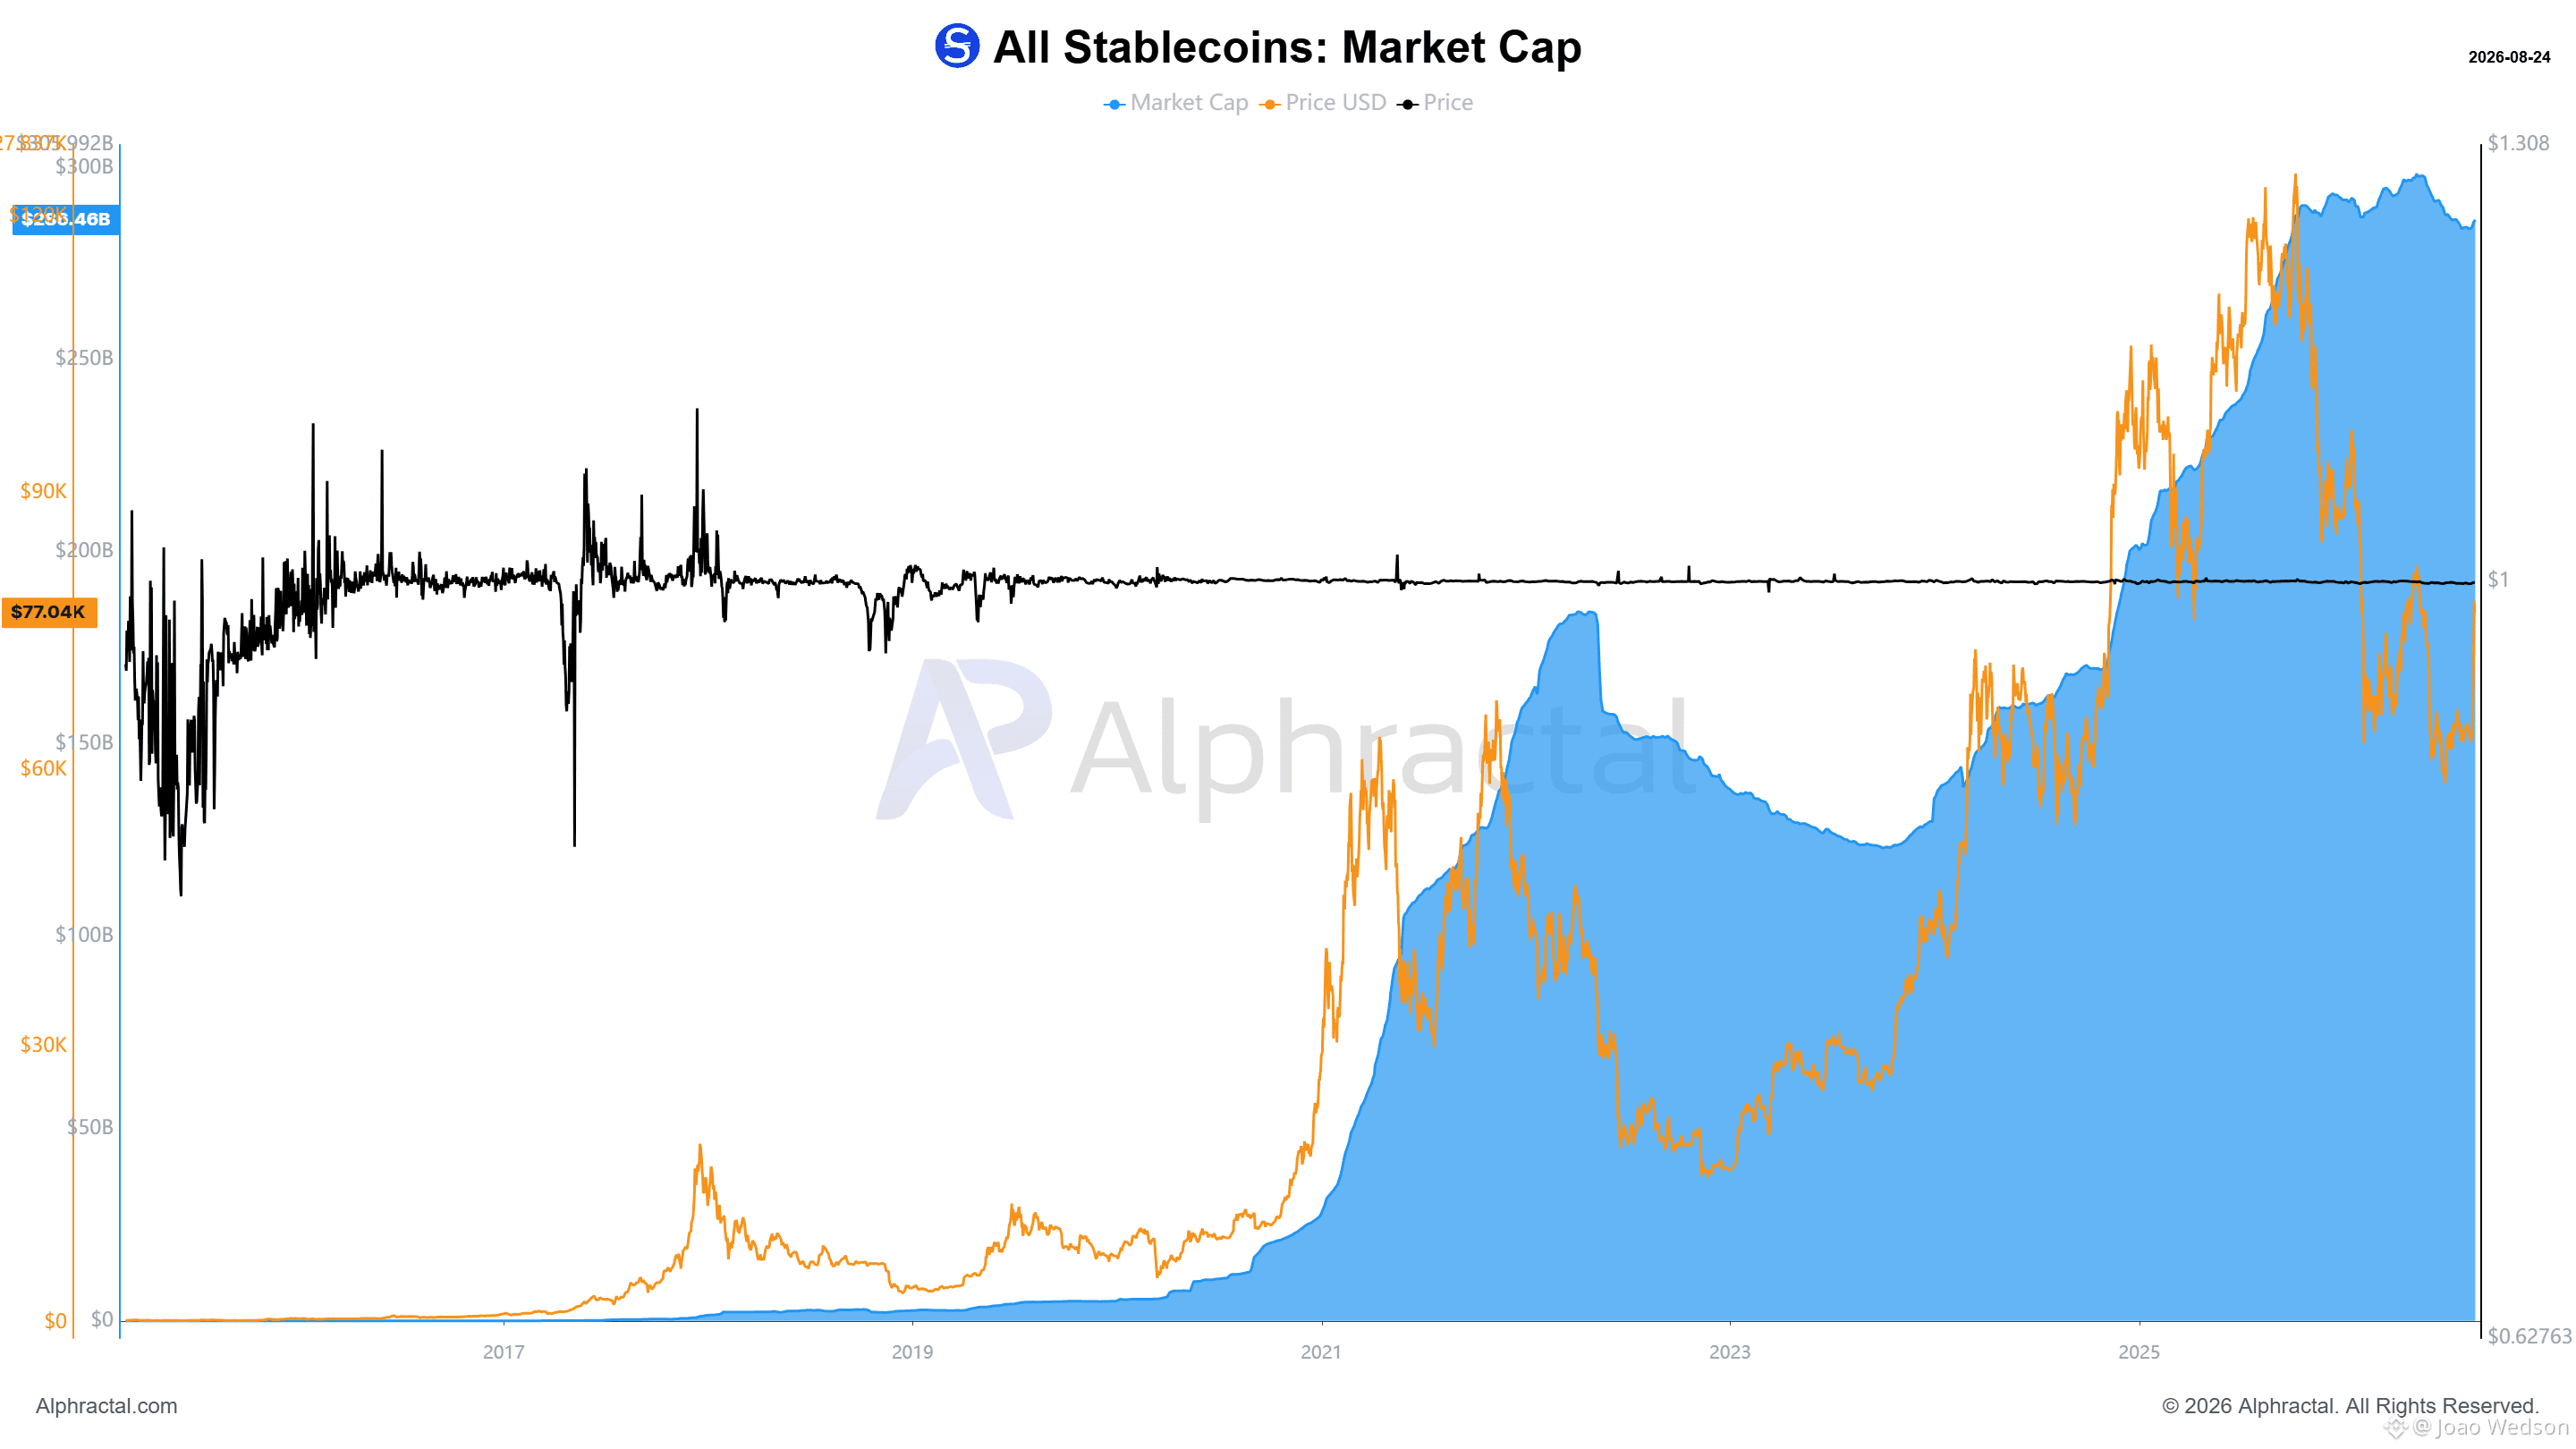
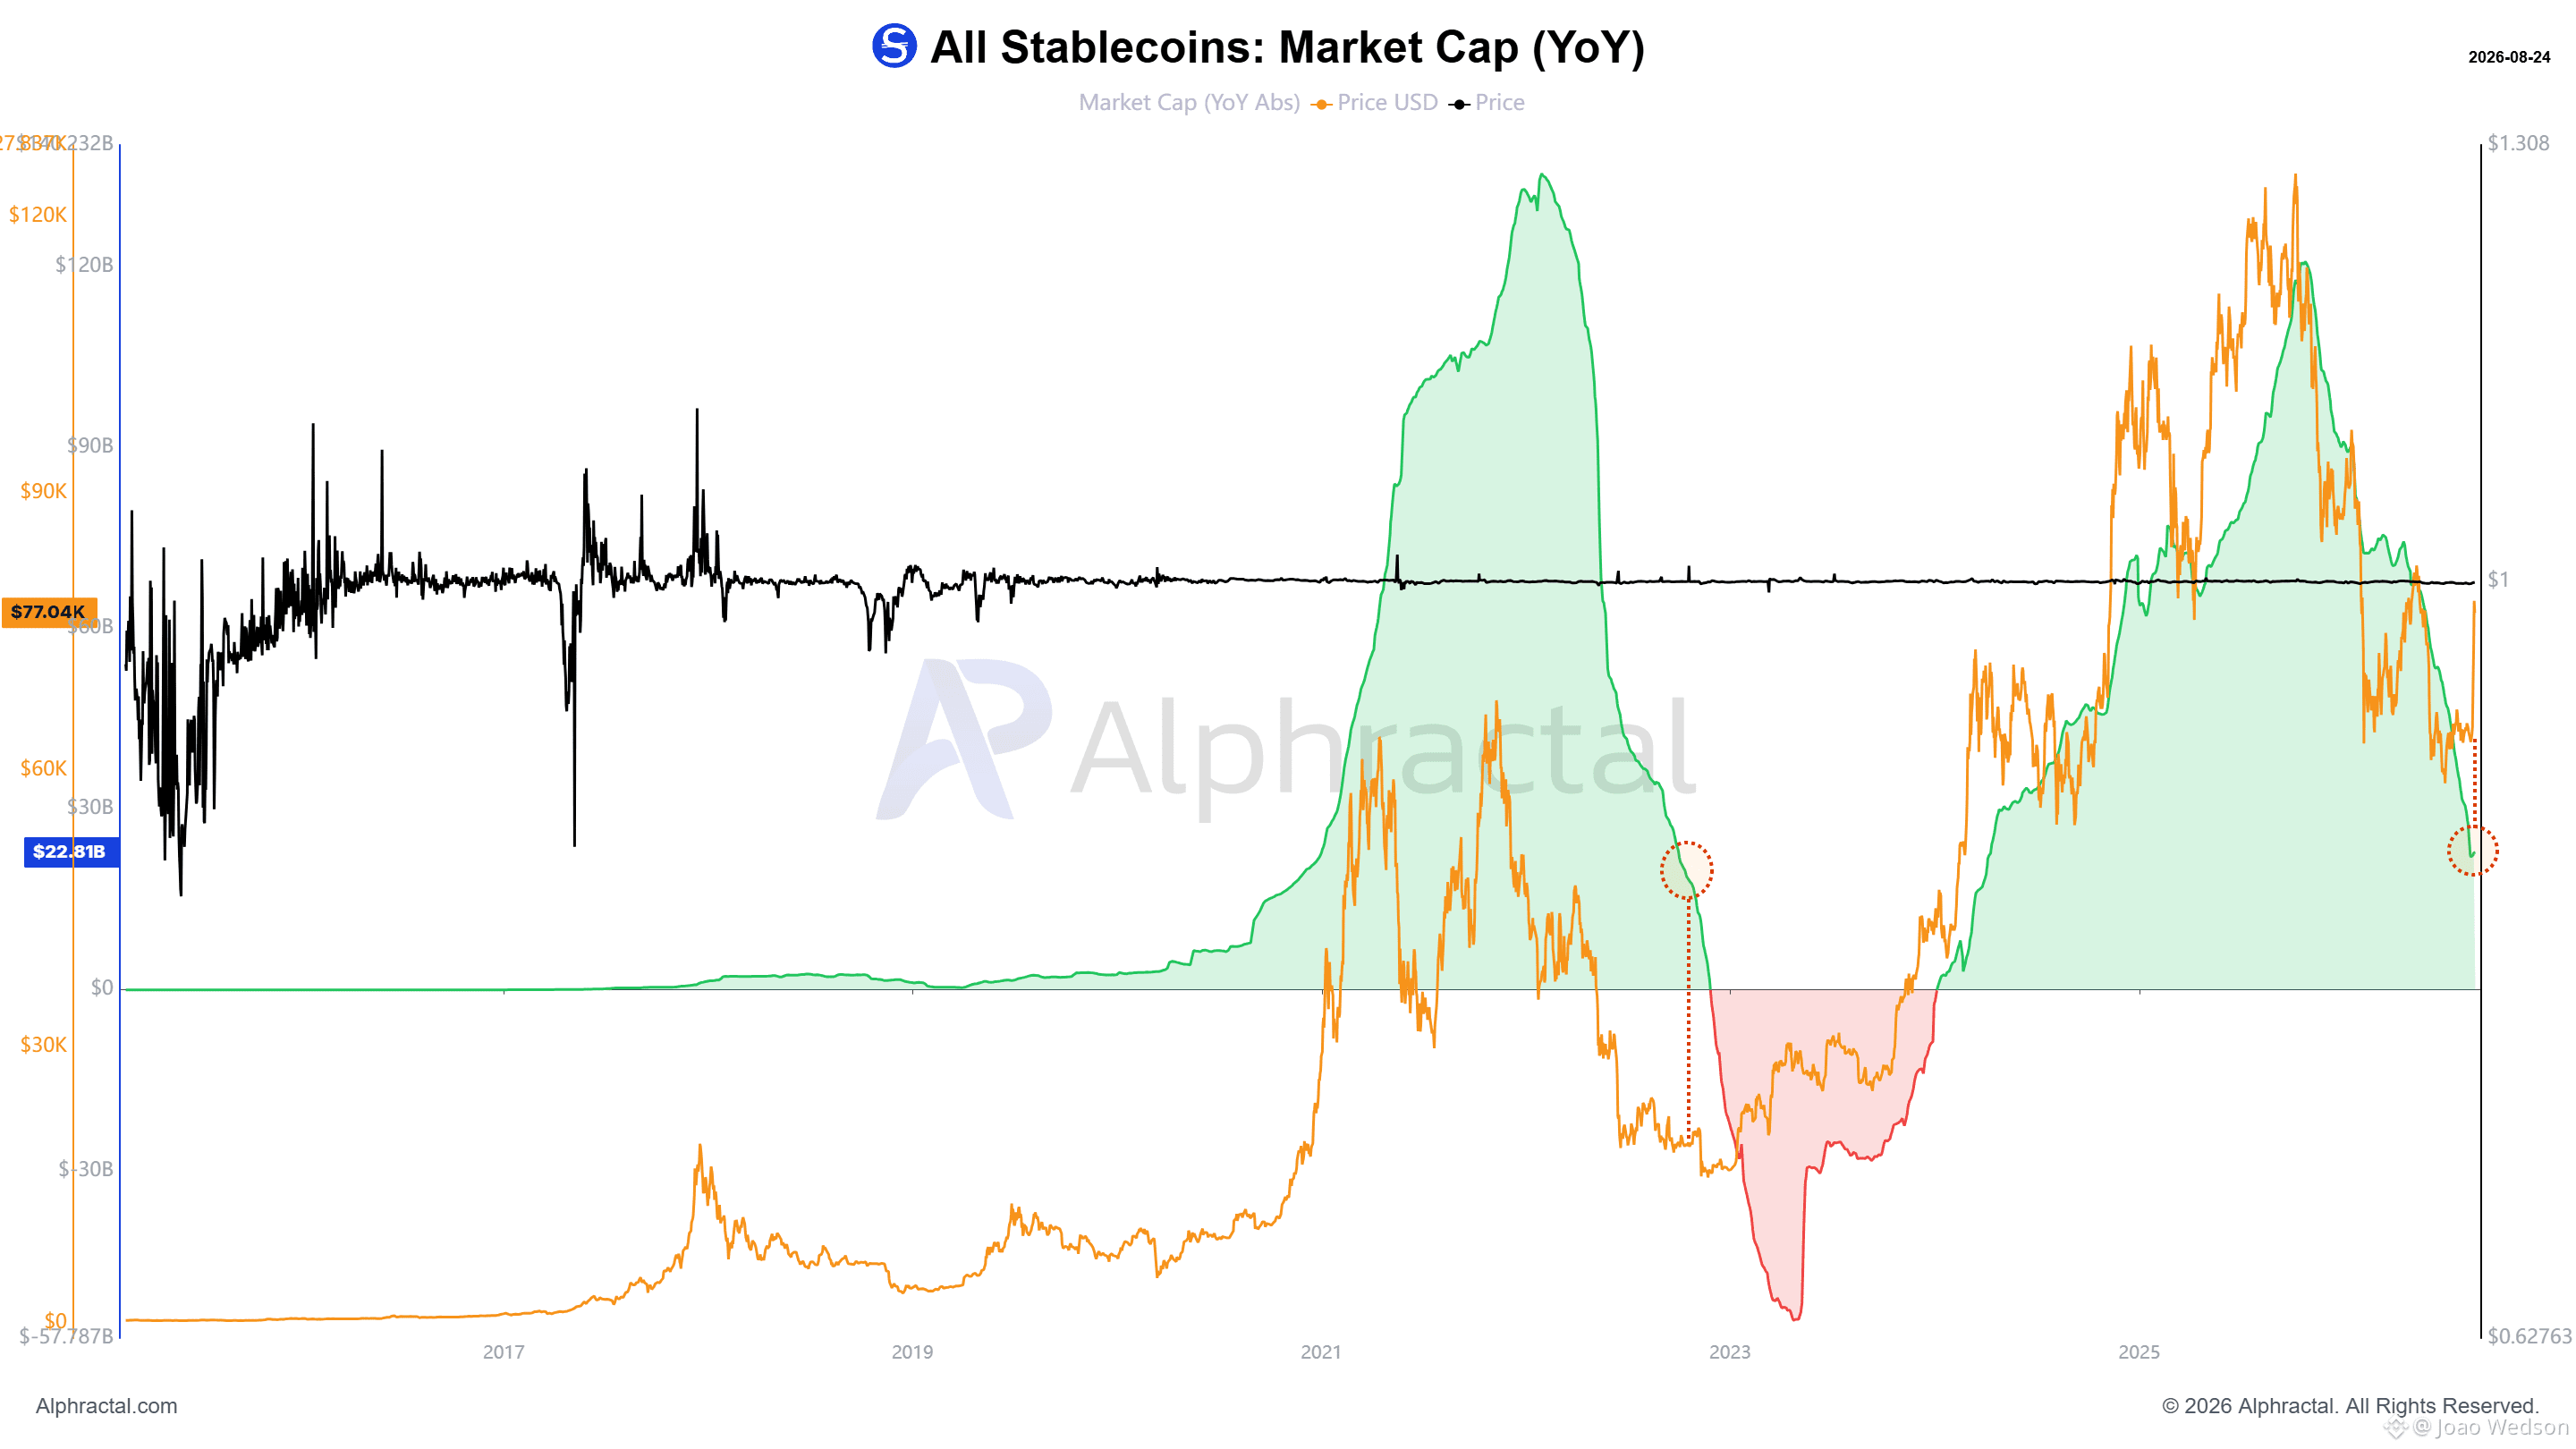
The total market cap of all stablecoins is no longer rising as it did before, similar to what happened toward the end of 2022. Its annual growth rate is also moving toward negative territory, again showing similarities to 2022. Stablecoins are one of the main liquidity engines of the crypto market. They need to be on everyone’s radar. Source: app.alphractal.com
The total market cap of all stablecoins is no longer rising as it did before, similar to what happened toward the end of 2022. Its annual growth rate is also moving toward negative territory, again showing similarities to 2022. Stablecoins are one of the main liquidity engines of the crypto market. They need to be on everyone’s radar. Source: app.alphractal.com
73
·
--
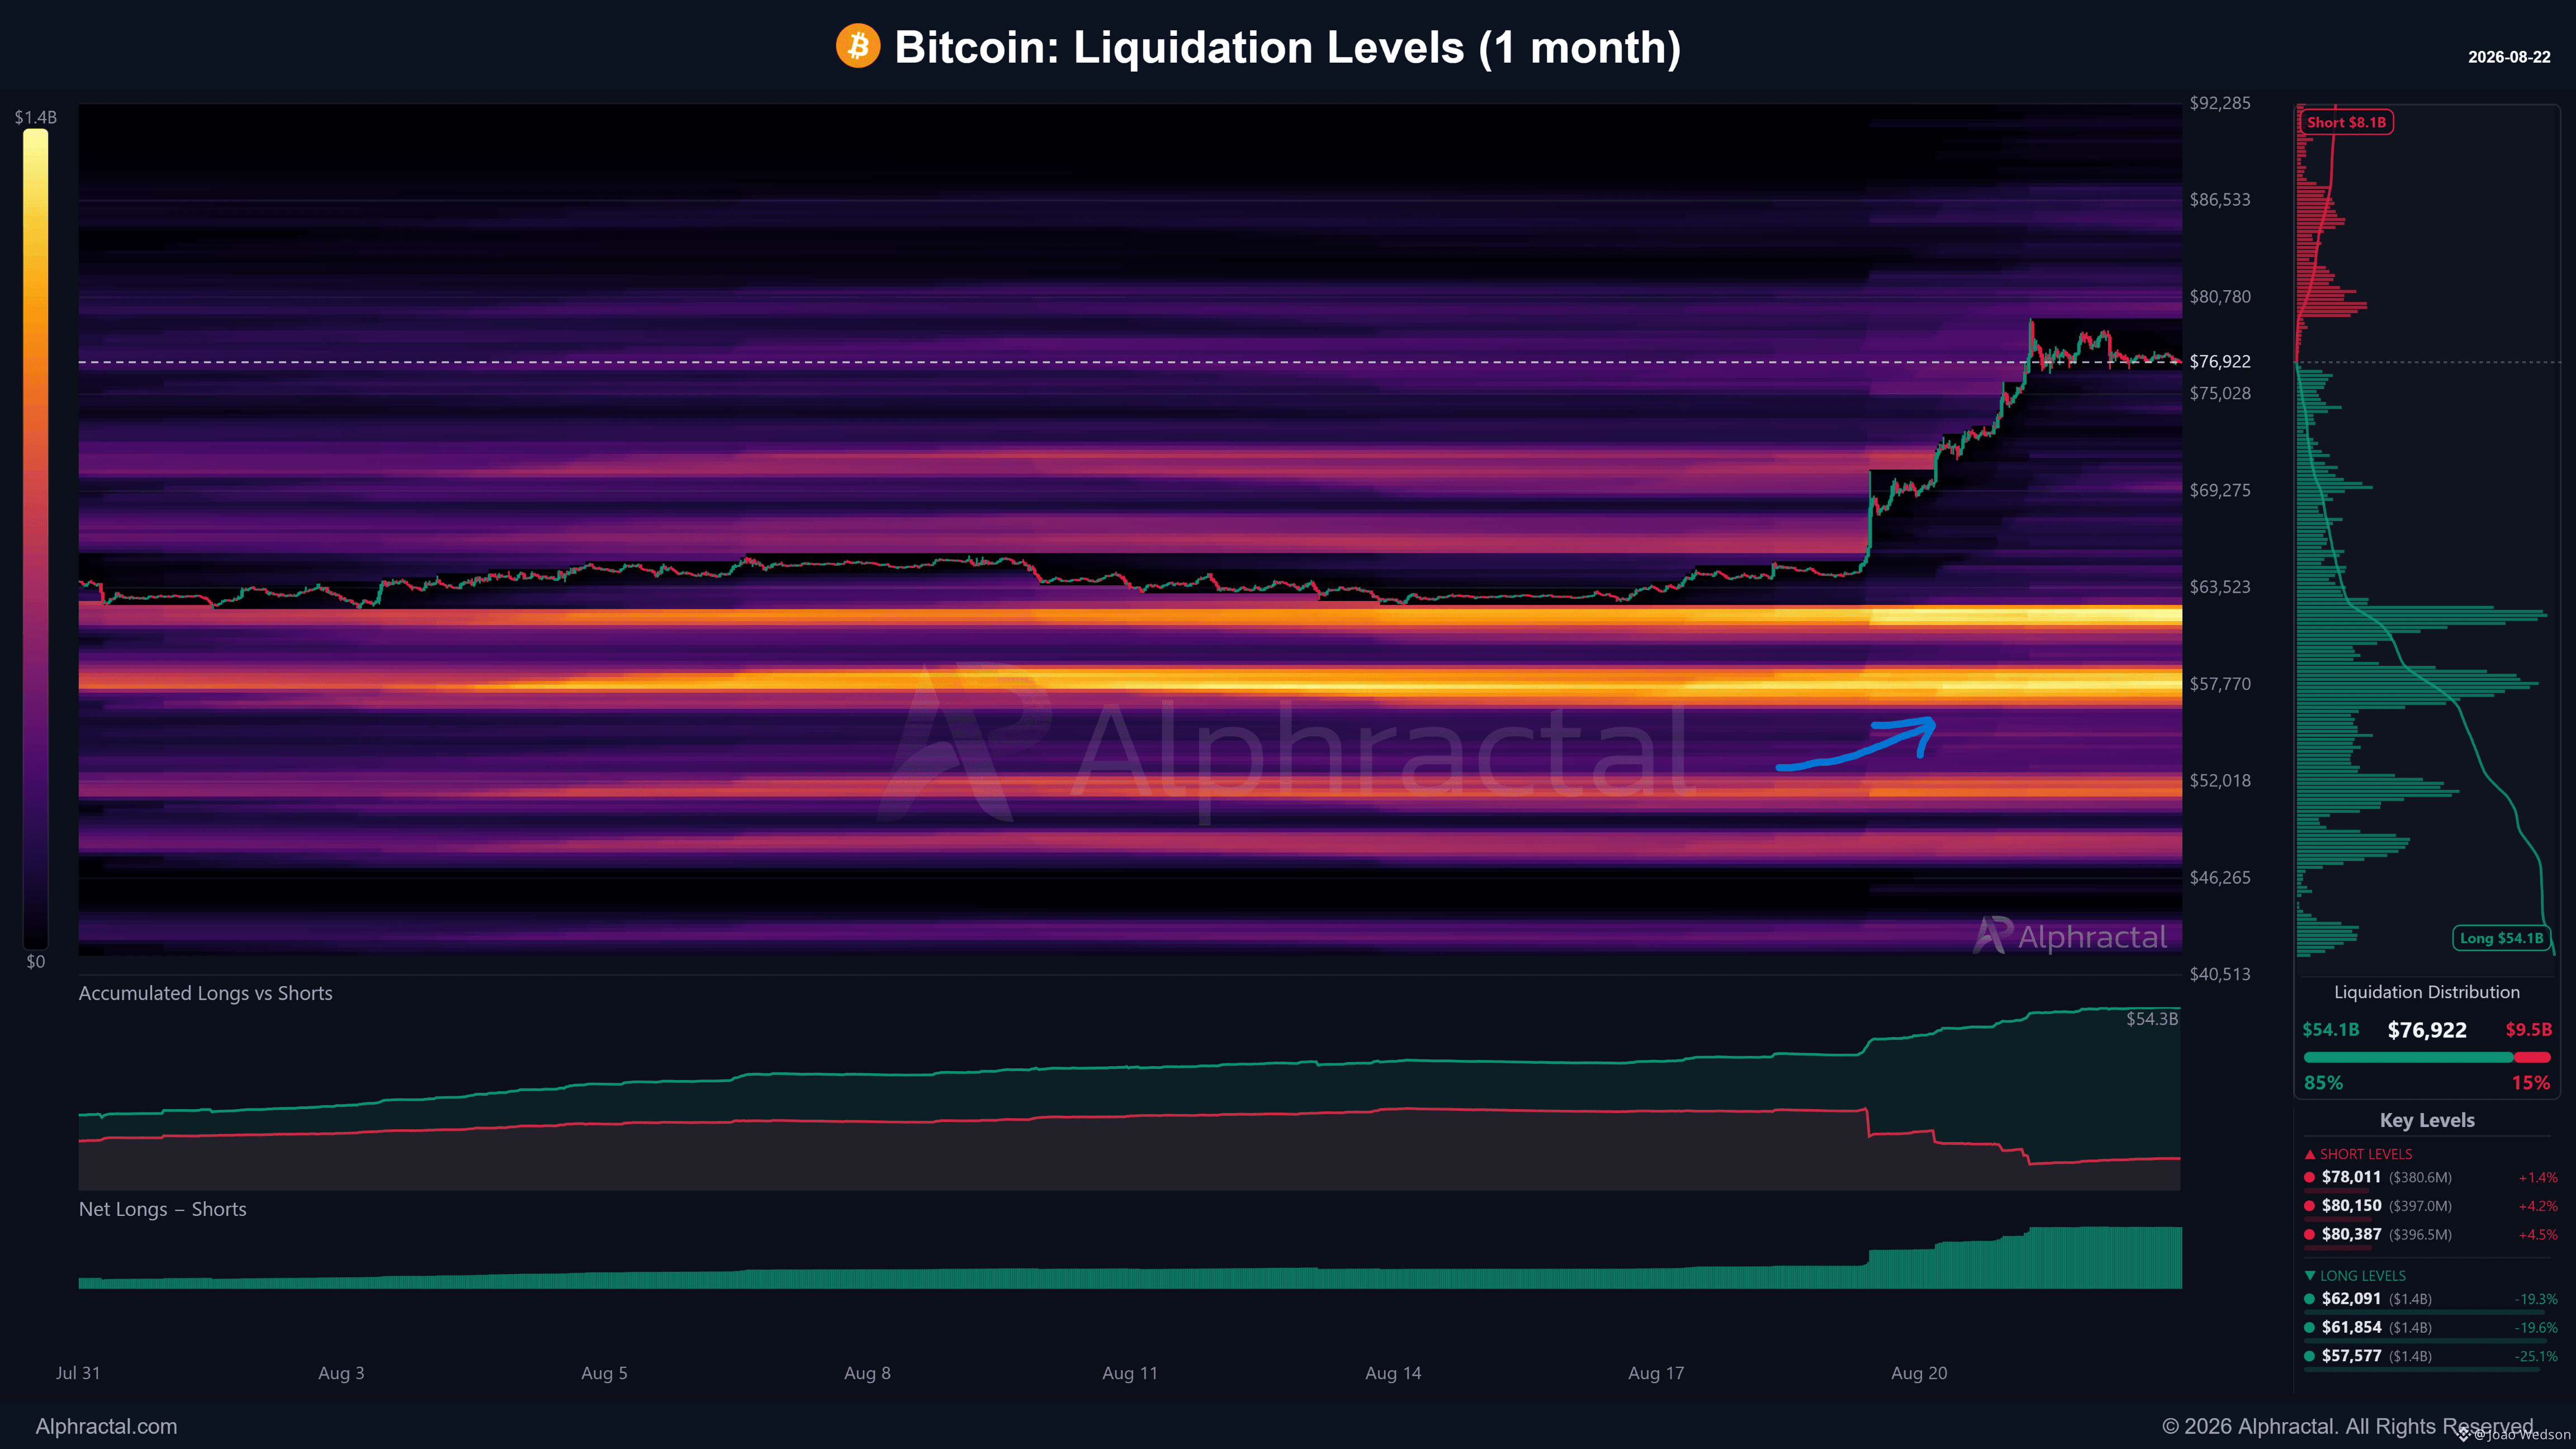
As Bitcoin’s price moves higher, it leaves behind a trail of liquidation levels.
But two levels stand out when looking at open positions from the last 30 days:
$61,000: A region where many traders opened positions while Bitcoin was trading around $65,000 to $68,000.
$57,000: A region where a significant number of traders could be liquidated. Many of these positions were opened around $63,000 to $66,000.
What’s interesting is that these levels also tend to be areas where traders place their stop losses, believing the price is unlikely to reach them.
There are also liquidation levels higher up, around $85,000 to $86,000, but these are mostly linked to positions older than one month. They could also become liquidation targets.
Stay alert.
Alphractal is 50% OFF for a limited time!
Take advantage of the offer while it lasts.
https://app.alphractal.com/plans?utm_source=coinmarketcap&utm_medium=update&utm_campaign=founding_access&utm_content=ceo_joao
As Bitcoin’s price moves higher, it leaves behind a trail of liquidation levels.
But two levels stand out when looking at open positions from the last 30 days:
$61,000: A region where many traders opened positions while Bitcoin was trading around $65,000 to $68,000.
$57,000: A region where a significant number of traders could be liquidated. Many of these positions were opened around $63,000 to $66,000.
What’s interesting is that these levels also tend to be areas where traders place their stop losses, believing the price is unlikely to reach them.
There are also liquidation levels higher up, around $85,000 to $86,000, but these are mostly linked to positions older than one month. They could also become liquidation targets.
Stay alert.
Alphractal is 50% OFF for a limited time!
Take advantage of the offer while it lasts.
https://app.alphractal.com/plans?utm_source=coinmarketcap&utm_medium=update&utm_campaign=founding_access&utm_content=ceo_joao
But two levels stand out when looking at open positions from the last 30 days:
$61,000: A region where many traders opened positions while Bitcoin was trading around $65,000 to $68,000.
$57,000: A region where a significant number of traders could be liquidated. Many of these positions were opened around $63,000 to $66,000.
What’s interesting is that these levels also tend to be areas where traders place their stop losses, believing the price is unlikely to reach them.
There are also liquidation levels higher up, around $85,000 to $86,000, but these are mostly linked to positions older than one month. They could also become liquidation targets.
Stay alert.
Alphractal is 50% OFF for a limited time!
Take advantage of the offer while it lasts.
https://app.alphractal.com/plans?utm_source=coinmarketcap&utm_medium=update&utm_campaign=founding_access&utm_content=ceo_joao
8
·
--
Excited to share that the Alphractal MCP is officially live.
You can now connect Alphractal directly to ChatGPT and Claude and access 47 crypto intelligence tools across on-chain data, derivatives, sentiment, macro, charts, screeners, liquidations, research, alerts, and more.
What I like most about this release is the simplicity.
Instead of connecting multiple data sources and trying to combine everything manually, you can ask one question and let the AI analyze multiple layers of the crypto market in the same conversation.
One connection. 47 tools. A much broader market view.
This is another important step in how we believe crypto research will evolve with AI.
https://app.alphractal.com/api-dashboard/mcp
Excited to share that the Alphractal MCP is officially live.
You can now connect Alphractal directly to ChatGPT and Claude and access 47 crypto intelligence tools across on-chain data, derivatives, sentiment, macro, charts, screeners, liquidations, research, alerts, and more.
What I like most about this release is the simplicity.
Instead of connecting multiple data sources and trying to combine everything manually, you can ask one question and let the AI analyze multiple layers of the crypto market in the same conversation.
One connection. 47 tools. A much broader market view.
This is another important step in how we believe crypto research will evolve with AI.
https://app.alphractal.com/api-dashboard/mcp
You can now connect Alphractal directly to ChatGPT and Claude and access 47 crypto intelligence tools across on-chain data, derivatives, sentiment, macro, charts, screeners, liquidations, research, alerts, and more.
What I like most about this release is the simplicity.
Instead of connecting multiple data sources and trying to combine everything manually, you can ask one question and let the AI analyze multiple layers of the crypto market in the same conversation.
One connection. 47 tools. A much broader market view.
This is another important step in how we believe crypto research will evolve with AI.
https://app.alphractal.com/api-dashboard/mcp
69
·
--
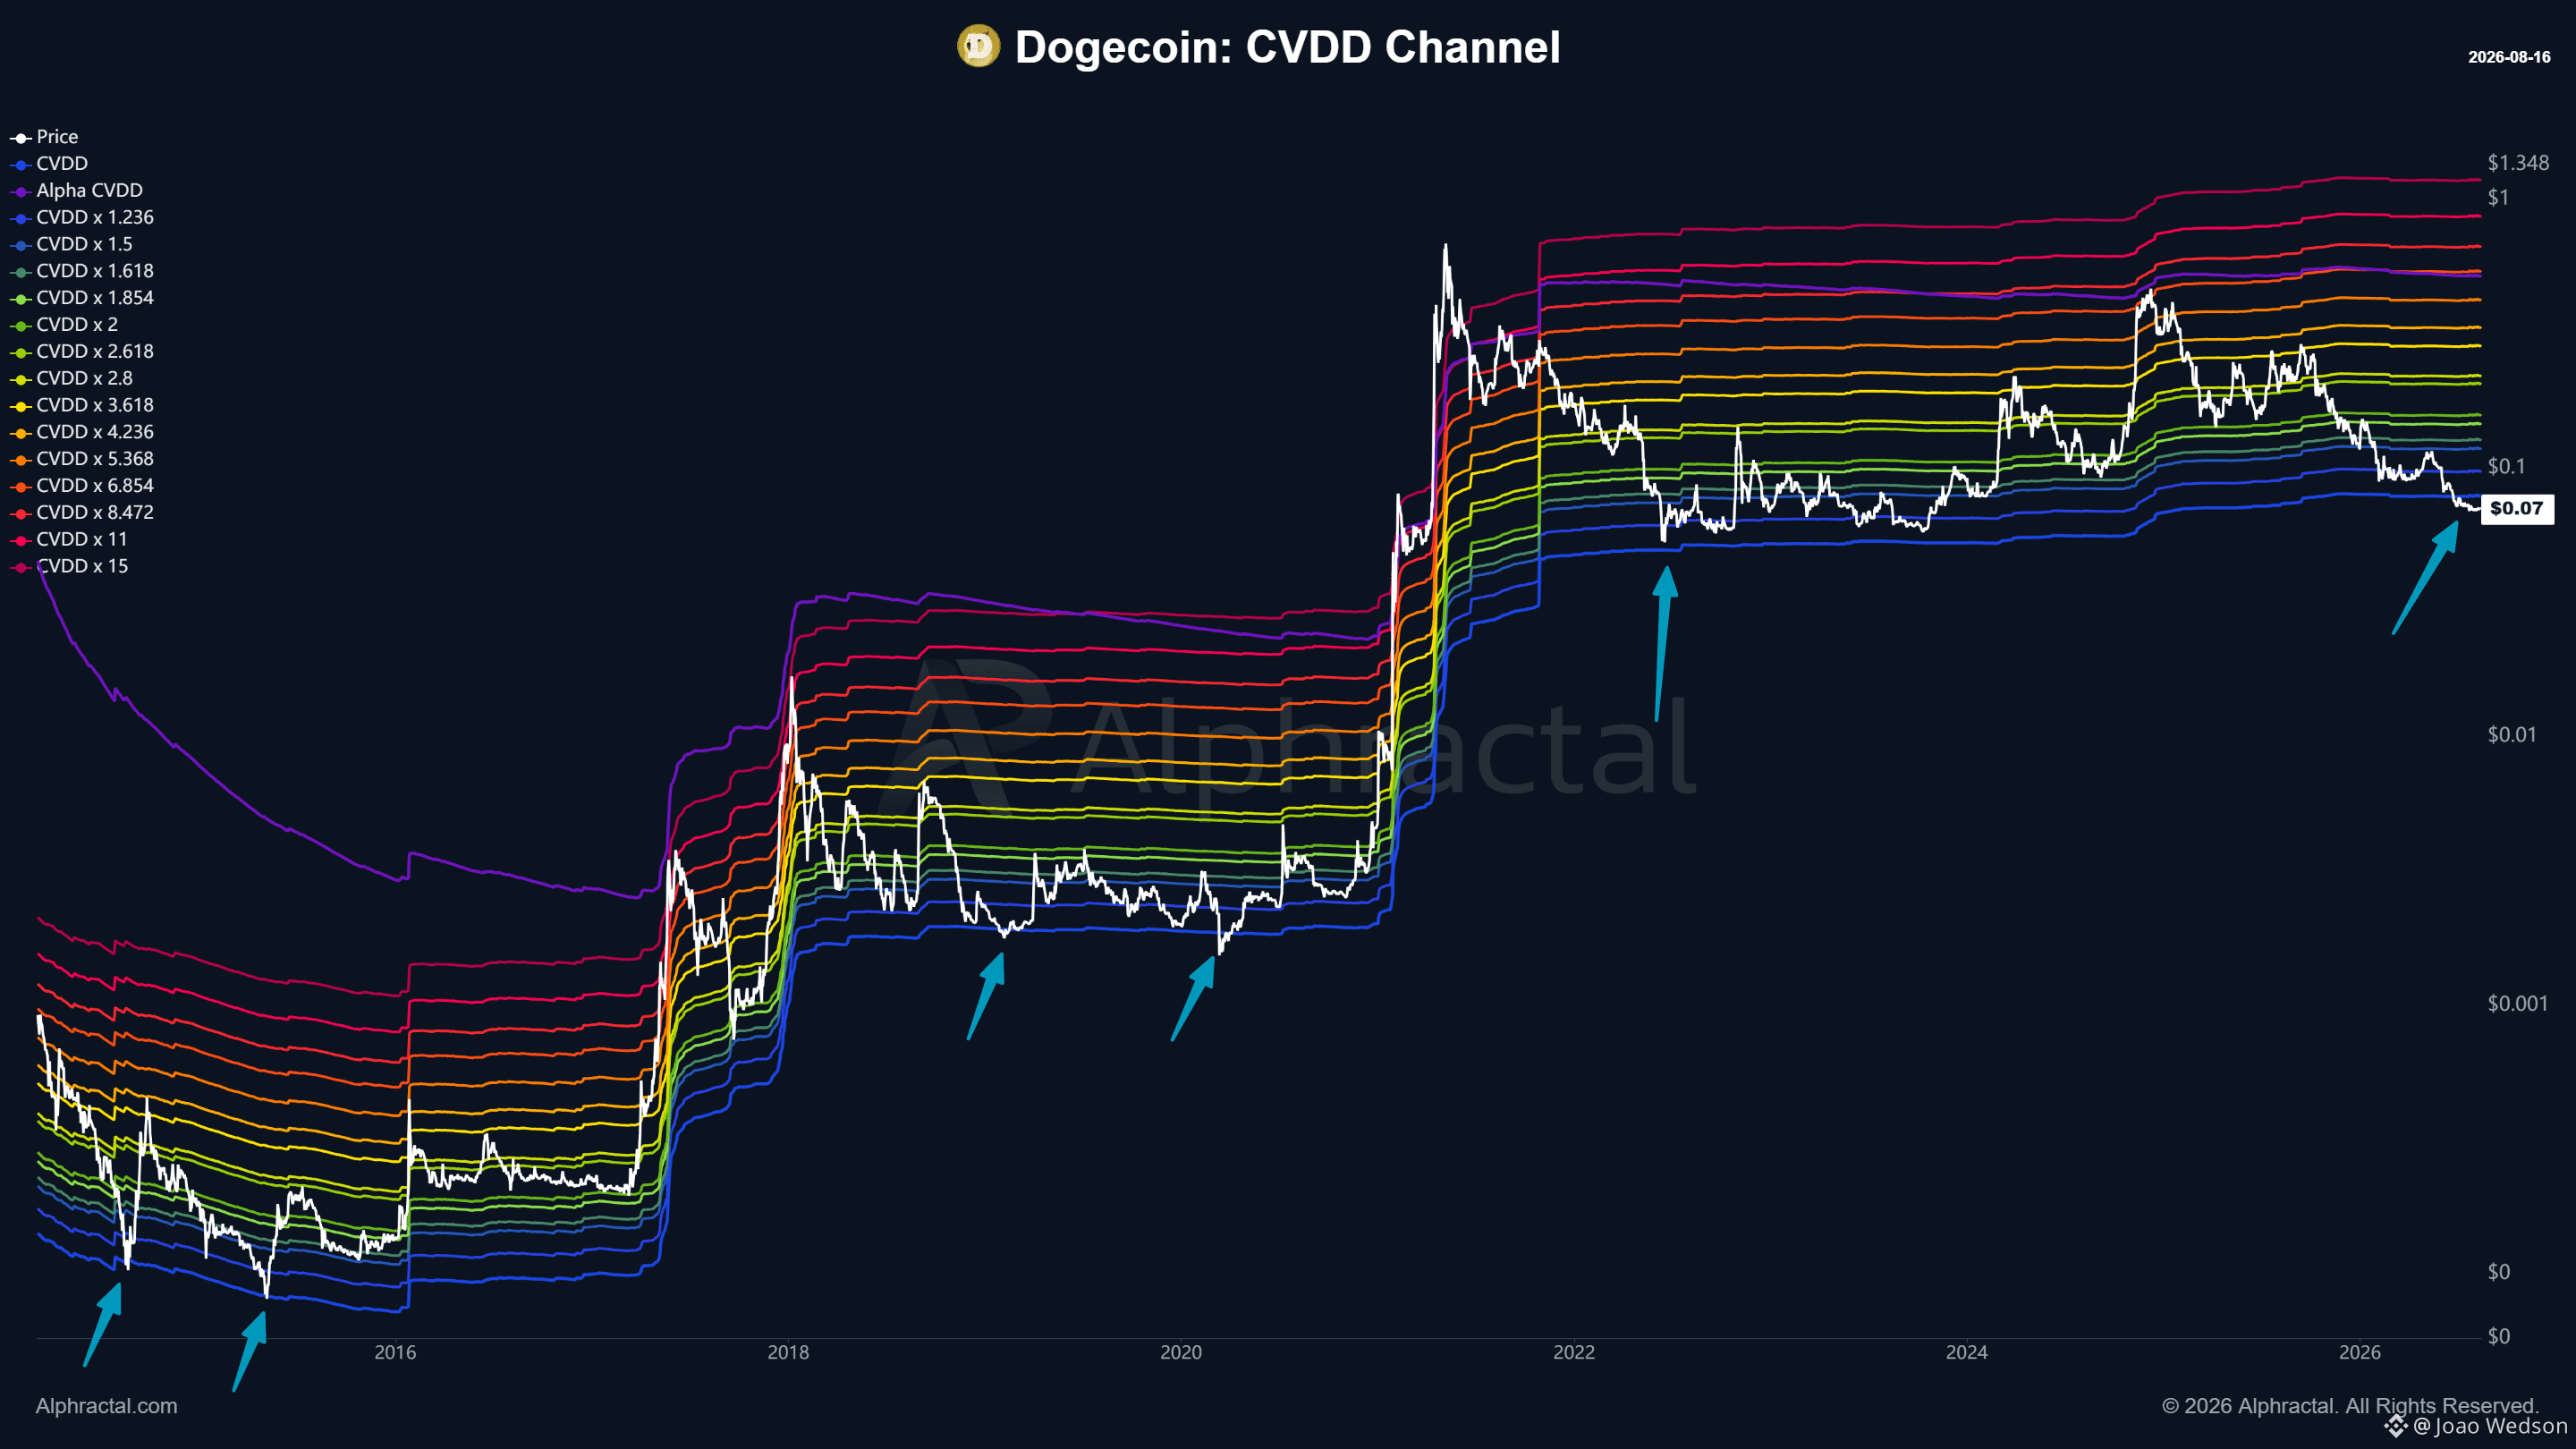
Dogecoin is currently at one of the most extreme levels ever observed in its history when looking at the CVDD Channel. DOGE has rarely traded below the lower band of the channel, a region that has historically marked periods of extreme onchain undervaluation. What makes this especially interesting is what happened next. In every highlighted instance on the chart where price reached or broke below this extreme region, Dogecoin experienced strong rallies in the following months. Today, $DOGE is back in that same zone. This does not mean the bottom is confirmed or that price cannot move lower. But based strictly on the historical behavior of the CVDD Channel, Dogecoin is once again in a region that deserves close attention. Historically, buying DOGE in these extreme zones has offered a very different risk to reward profile compared with buying during periods of market euphoria. The market may be focused on price. Onchain analysis is focused on where we are in the cycle. Chart Link: Alphractal.com
Dogecoin is currently at one of the most extreme levels ever observed in its history when looking at the CVDD Channel. DOGE has rarely traded below the lower band of the channel, a region that has historically marked periods of extreme onchain undervaluation. What makes this especially interesting is what happened next. In every highlighted instance on the chart where price reached or broke below this extreme region, Dogecoin experienced strong rallies in the following months. Today, $DOGE is back in that same zone. This does not mean the bottom is confirmed or that price cannot move lower. But based strictly on the historical behavior of the CVDD Channel, Dogecoin is once again in a region that deserves close attention. Historically, buying DOGE in these extreme zones has offered a very different risk to reward profile compared with buying during periods of market euphoria. The market may be focused on price. Onchain analysis is focused on where we are in the cycle. Chart Link: Alphractal.com
70
·
--
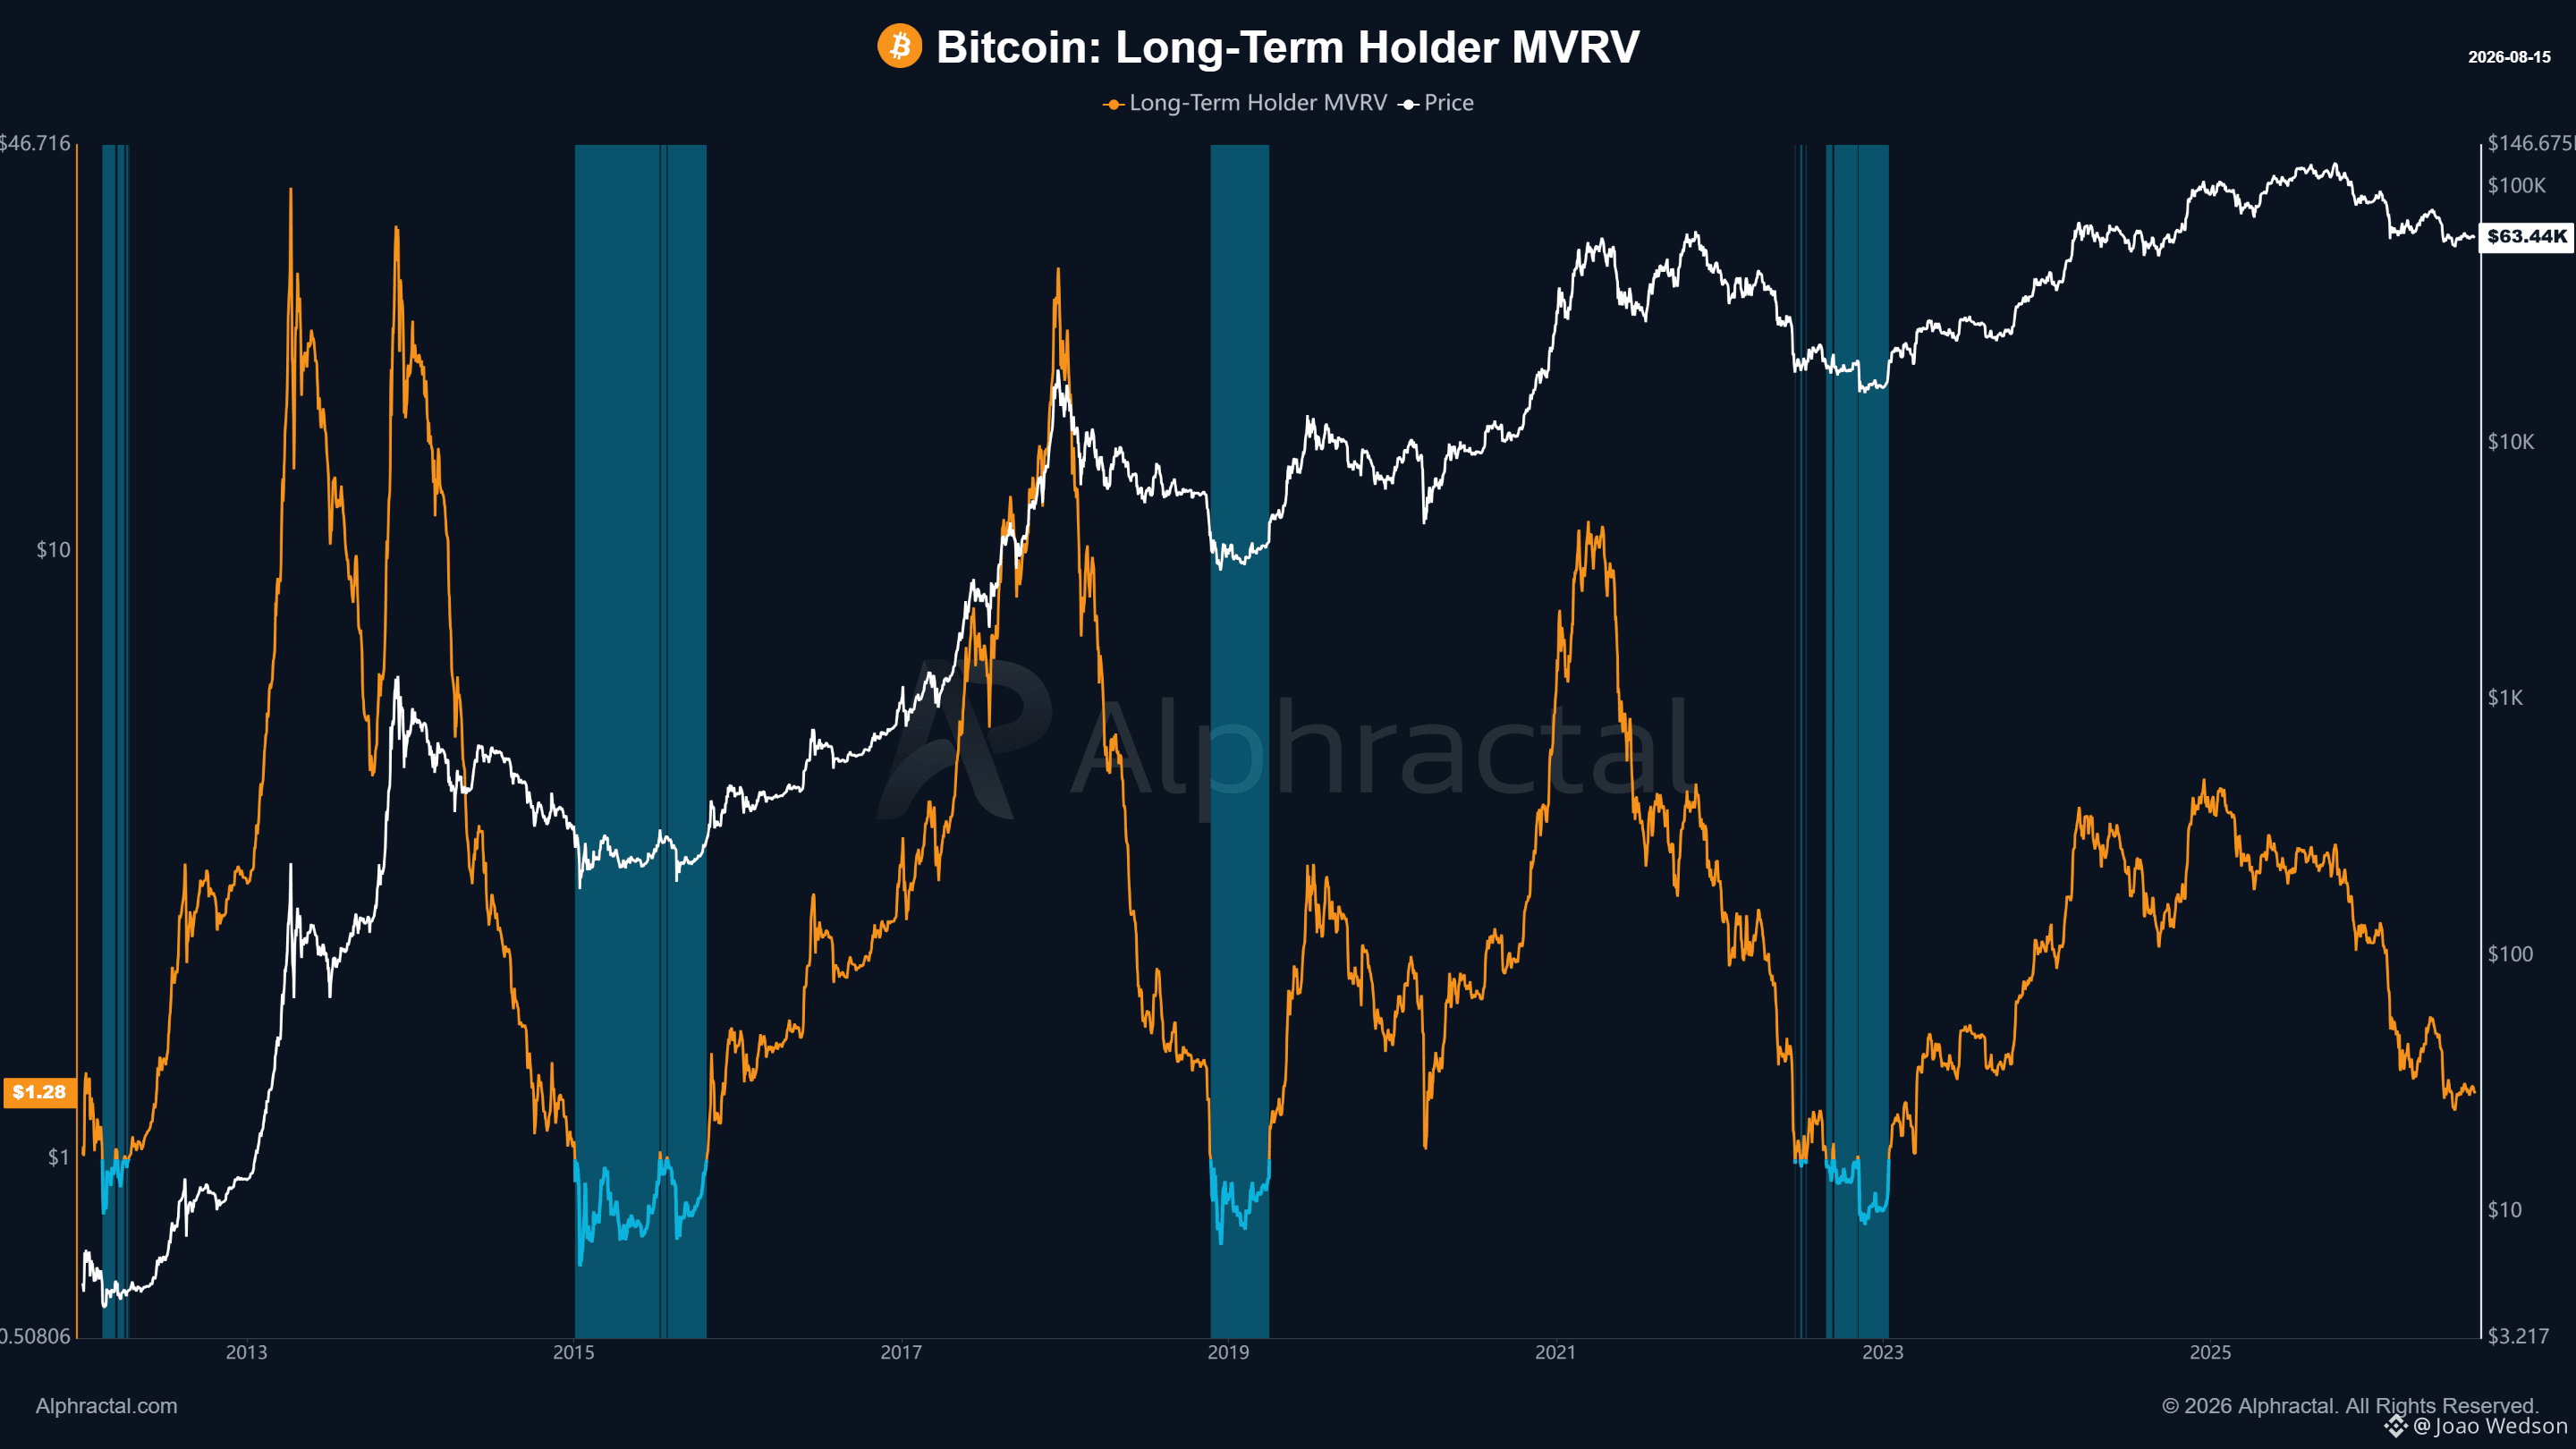
Bitcoin is approaching one of the most important Long Term Holder MVRV zones. The **Long Term Holder MVRV is currently around 1.28**, moving significantly closer to the historical stress zone for long term investors. This metric compares the market value of Bitcoin held by Long Term Holders with the average cost basis of those coins. When **LTH MVRV falls below 1**, Long Term Holders are, on average, holding Bitcoin at an unrealized loss. Historically, these conditions appeared around some of Bitcoin’s most important accumulation periods: 🔵 2012 🔵 2015 🔵 2018 and 2019 🔵 2022 Today, the metric stands at **1.28**. This does not yet represent the extreme capitulation observed near previous major cycle bottoms. However, Bitcoin is moving closer to a region where historical risk and reward dynamics became increasingly asymmetric. A deeper price correction could push LTH MVRV closer to, or even below, 1 again. If that happens, the market would enter a zone historically associated much more with **long term accumulation than distribution**. Short term volatility can remain high. But from an on chain perspective, the Long Term Holder MVRV is becoming one of the most important Bitcoin metrics to watch over the coming months. **LTH MVRV: 1.28** Chart Source - Alphractal
Bitcoin is approaching one of the most important Long Term Holder MVRV zones. The **Long Term Holder MVRV is currently around 1.28**, moving significantly closer to the historical stress zone for long term investors. This metric compares the market value of Bitcoin held by Long Term Holders with the average cost basis of those coins. When **LTH MVRV falls below 1**, Long Term Holders are, on average, holding Bitcoin at an unrealized loss. Historically, these conditions appeared around some of Bitcoin’s most important accumulation periods: 🔵 2012 🔵 2015 🔵 2018 and 2019 🔵 2022 Today, the metric stands at **1.28**. This does not yet represent the extreme capitulation observed near previous major cycle bottoms. However, Bitcoin is moving closer to a region where historical risk and reward dynamics became increasingly asymmetric. A deeper price correction could push LTH MVRV closer to, or even below, 1 again. If that happens, the market would enter a zone historically associated much more with **long term accumulation than distribution**. Short term volatility can remain high. But from an on chain perspective, the Long Term Holder MVRV is becoming one of the most important Bitcoin metrics to watch over the coming months. **LTH MVRV: 1.28** Chart Source - Alphractal
73
·
--
Ethereum is entering a historically interesting valuation zone. Two major long term metrics have now moved into negative territory: 🔴 MVRV Z Score: -0.14 ETH is trading at a deeply compressed valuation relative to its realized value. Historically, negative MVRV Z Score readings have appeared during periods of significant market stress and attractive long term valuation. 🔴 Delta Growth Rate: -0.07 This metric compares the growth of Market Cap with the growth of Realized Cap over a 365 day average. When it turns negative, Realized Cap is growing stronger relative to market valuation, suggesting that on chain value accumulation is outperforming speculative price appreciation. And this is where things get interesting. Both metrics are now negative at the same time. Historically, similar conditions have been much more associated with accumulation and undervaluation than with market euphoria. This does not mean $ETH has already reached its final bottom. But beneath the price weakness, Ethereum's valuation structure is becoming increasingly attractive. The market is still bearish. The fundamentals of valuation are starting to tell a different story. Charts: Alphractal
Ethereum is entering a historically interesting valuation zone. Two major long term metrics have now moved into negative territory: 🔴 MVRV Z Score: -0.14 ETH is trading at a deeply compressed valuation relative to its realized value. Historically, negative MVRV Z Score readings have appeared during periods of significant market stress and attractive long term valuation. 🔴 Delta Growth Rate: -0.07 This metric compares the growth of Market Cap with the growth of Realized Cap over a 365 day average. When it turns negative, Realized Cap is growing stronger relative to market valuation, suggesting that on chain value accumulation is outperforming speculative price appreciation. And this is where things get interesting. Both metrics are now negative at the same time. Historically, similar conditions have been much more associated with accumulation and undervaluation than with market euphoria. This does not mean $ETH has already reached its final bottom. But beneath the price weakness, Ethereum's valuation structure is becoming increasingly attractive. The market is still bearish. The fundamentals of valuation are starting to tell a different story. Charts: Alphractal
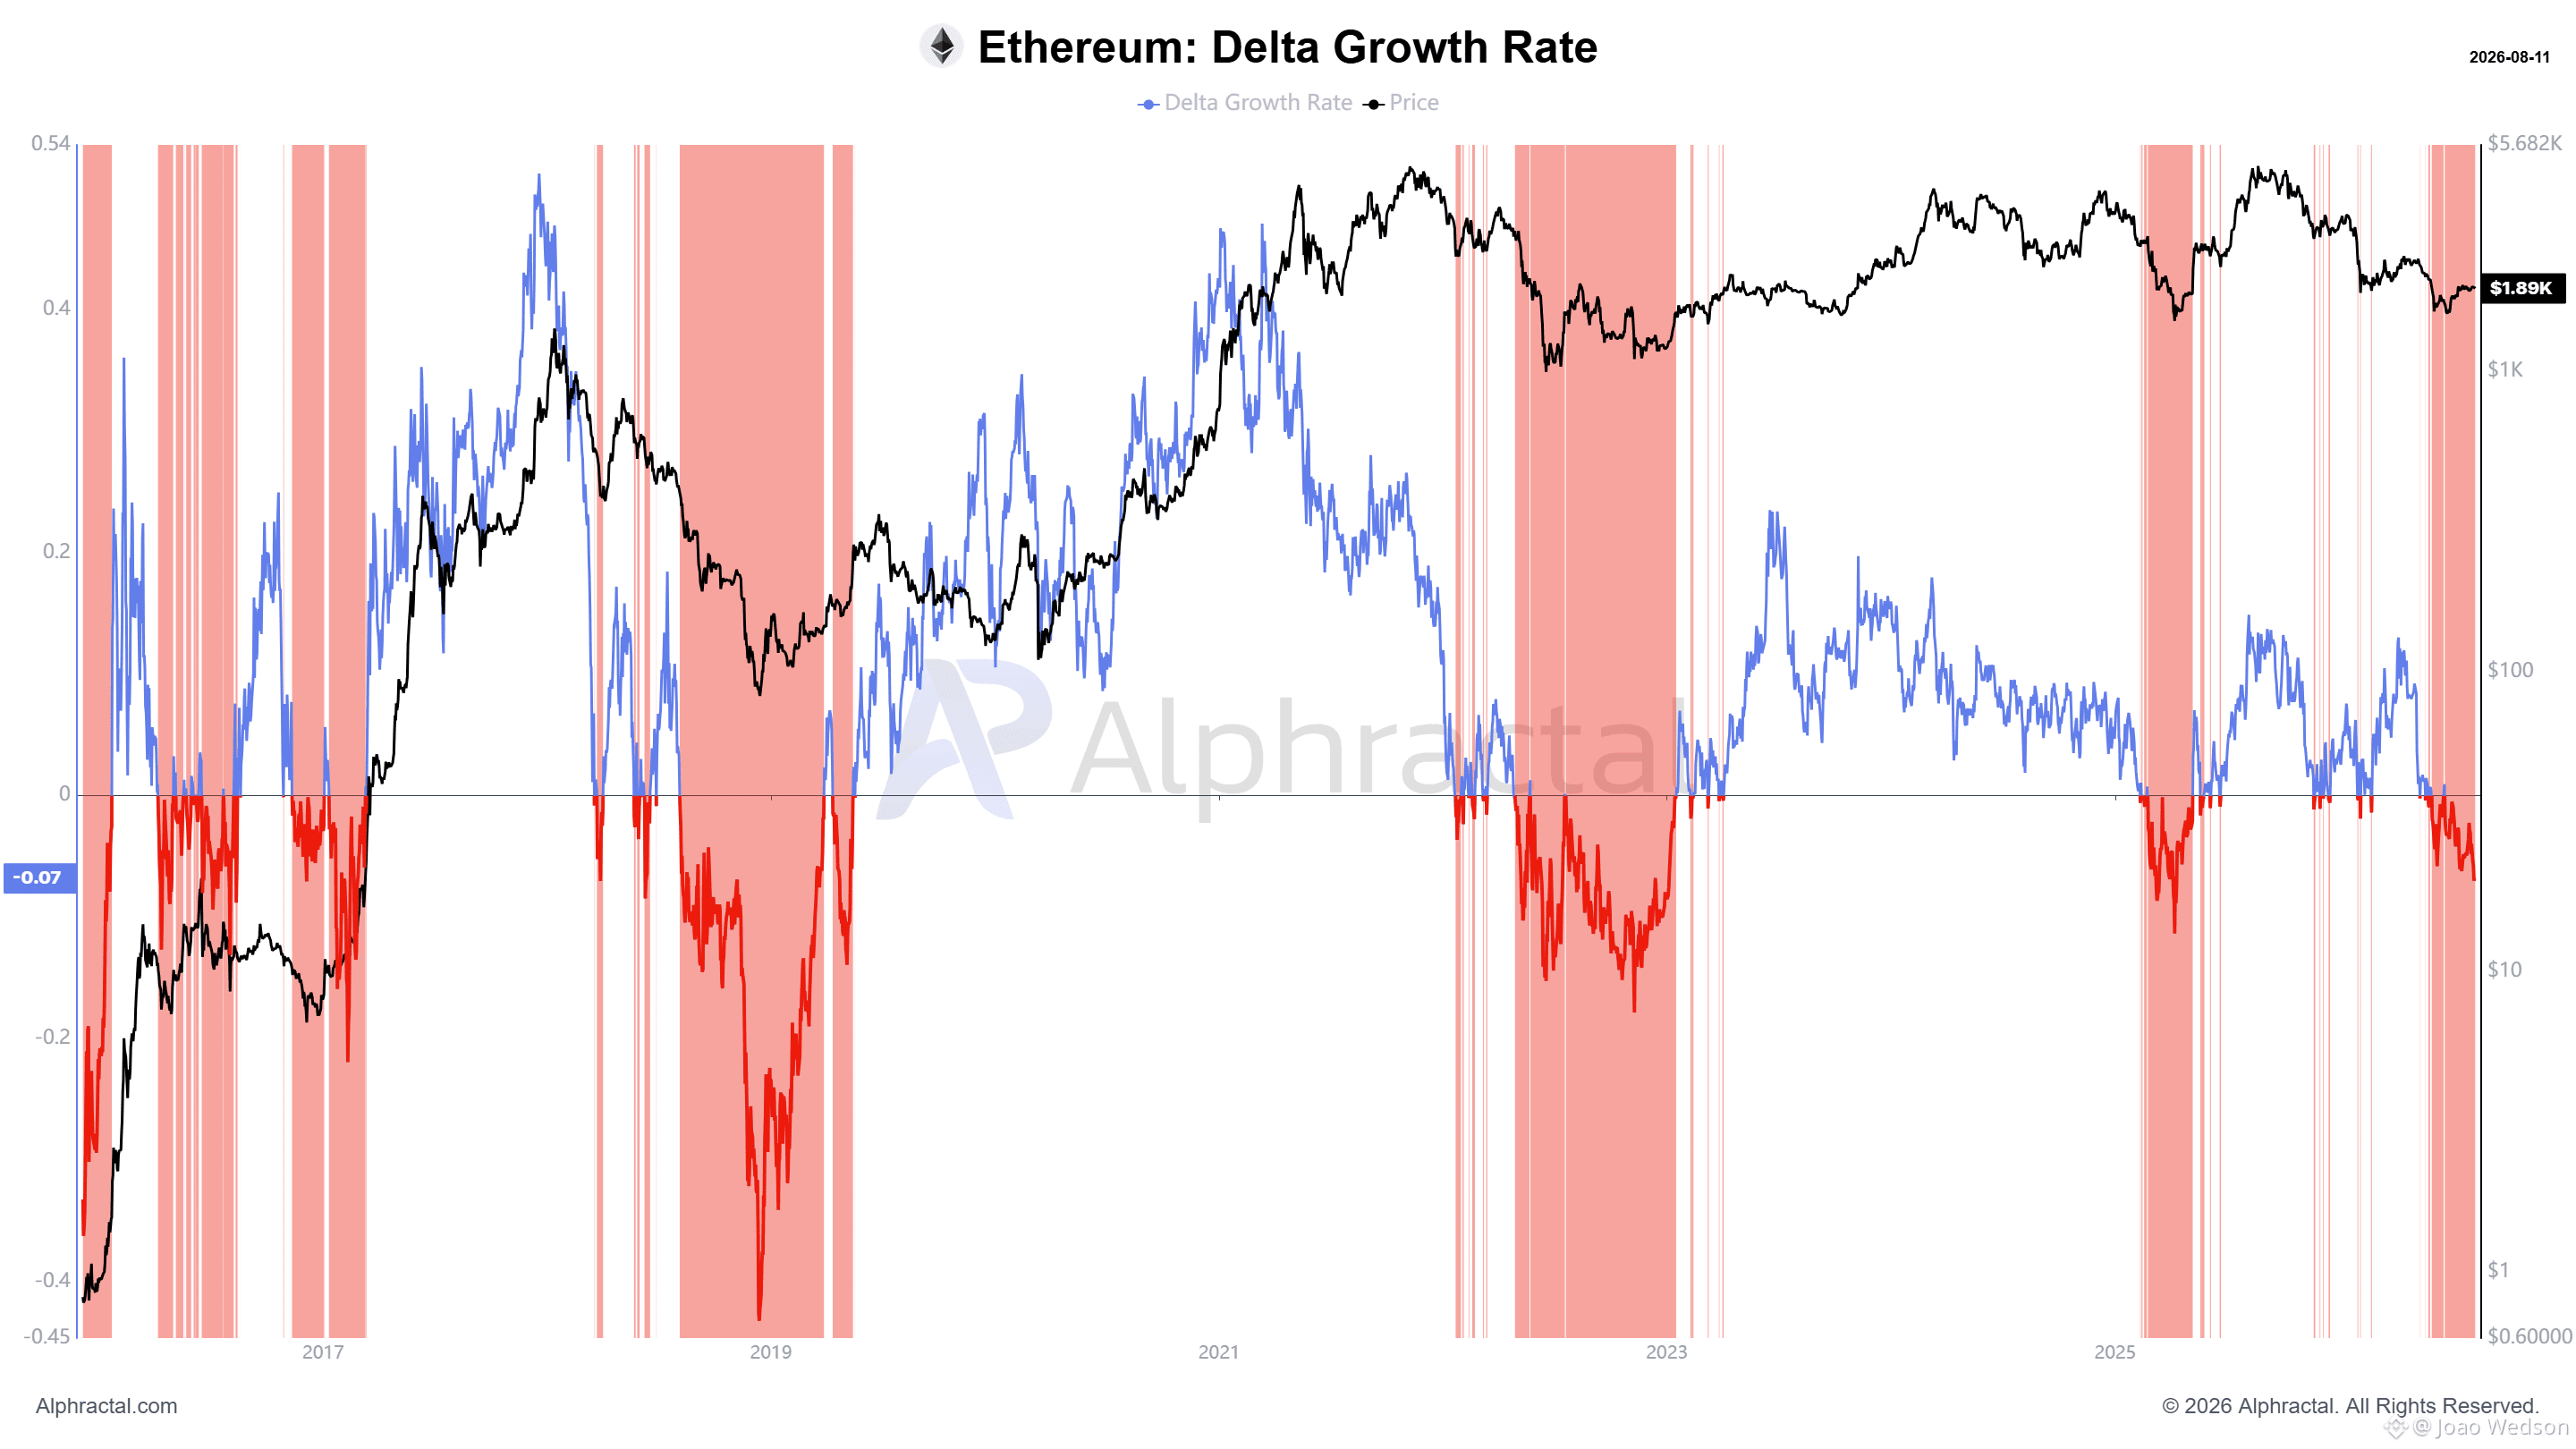
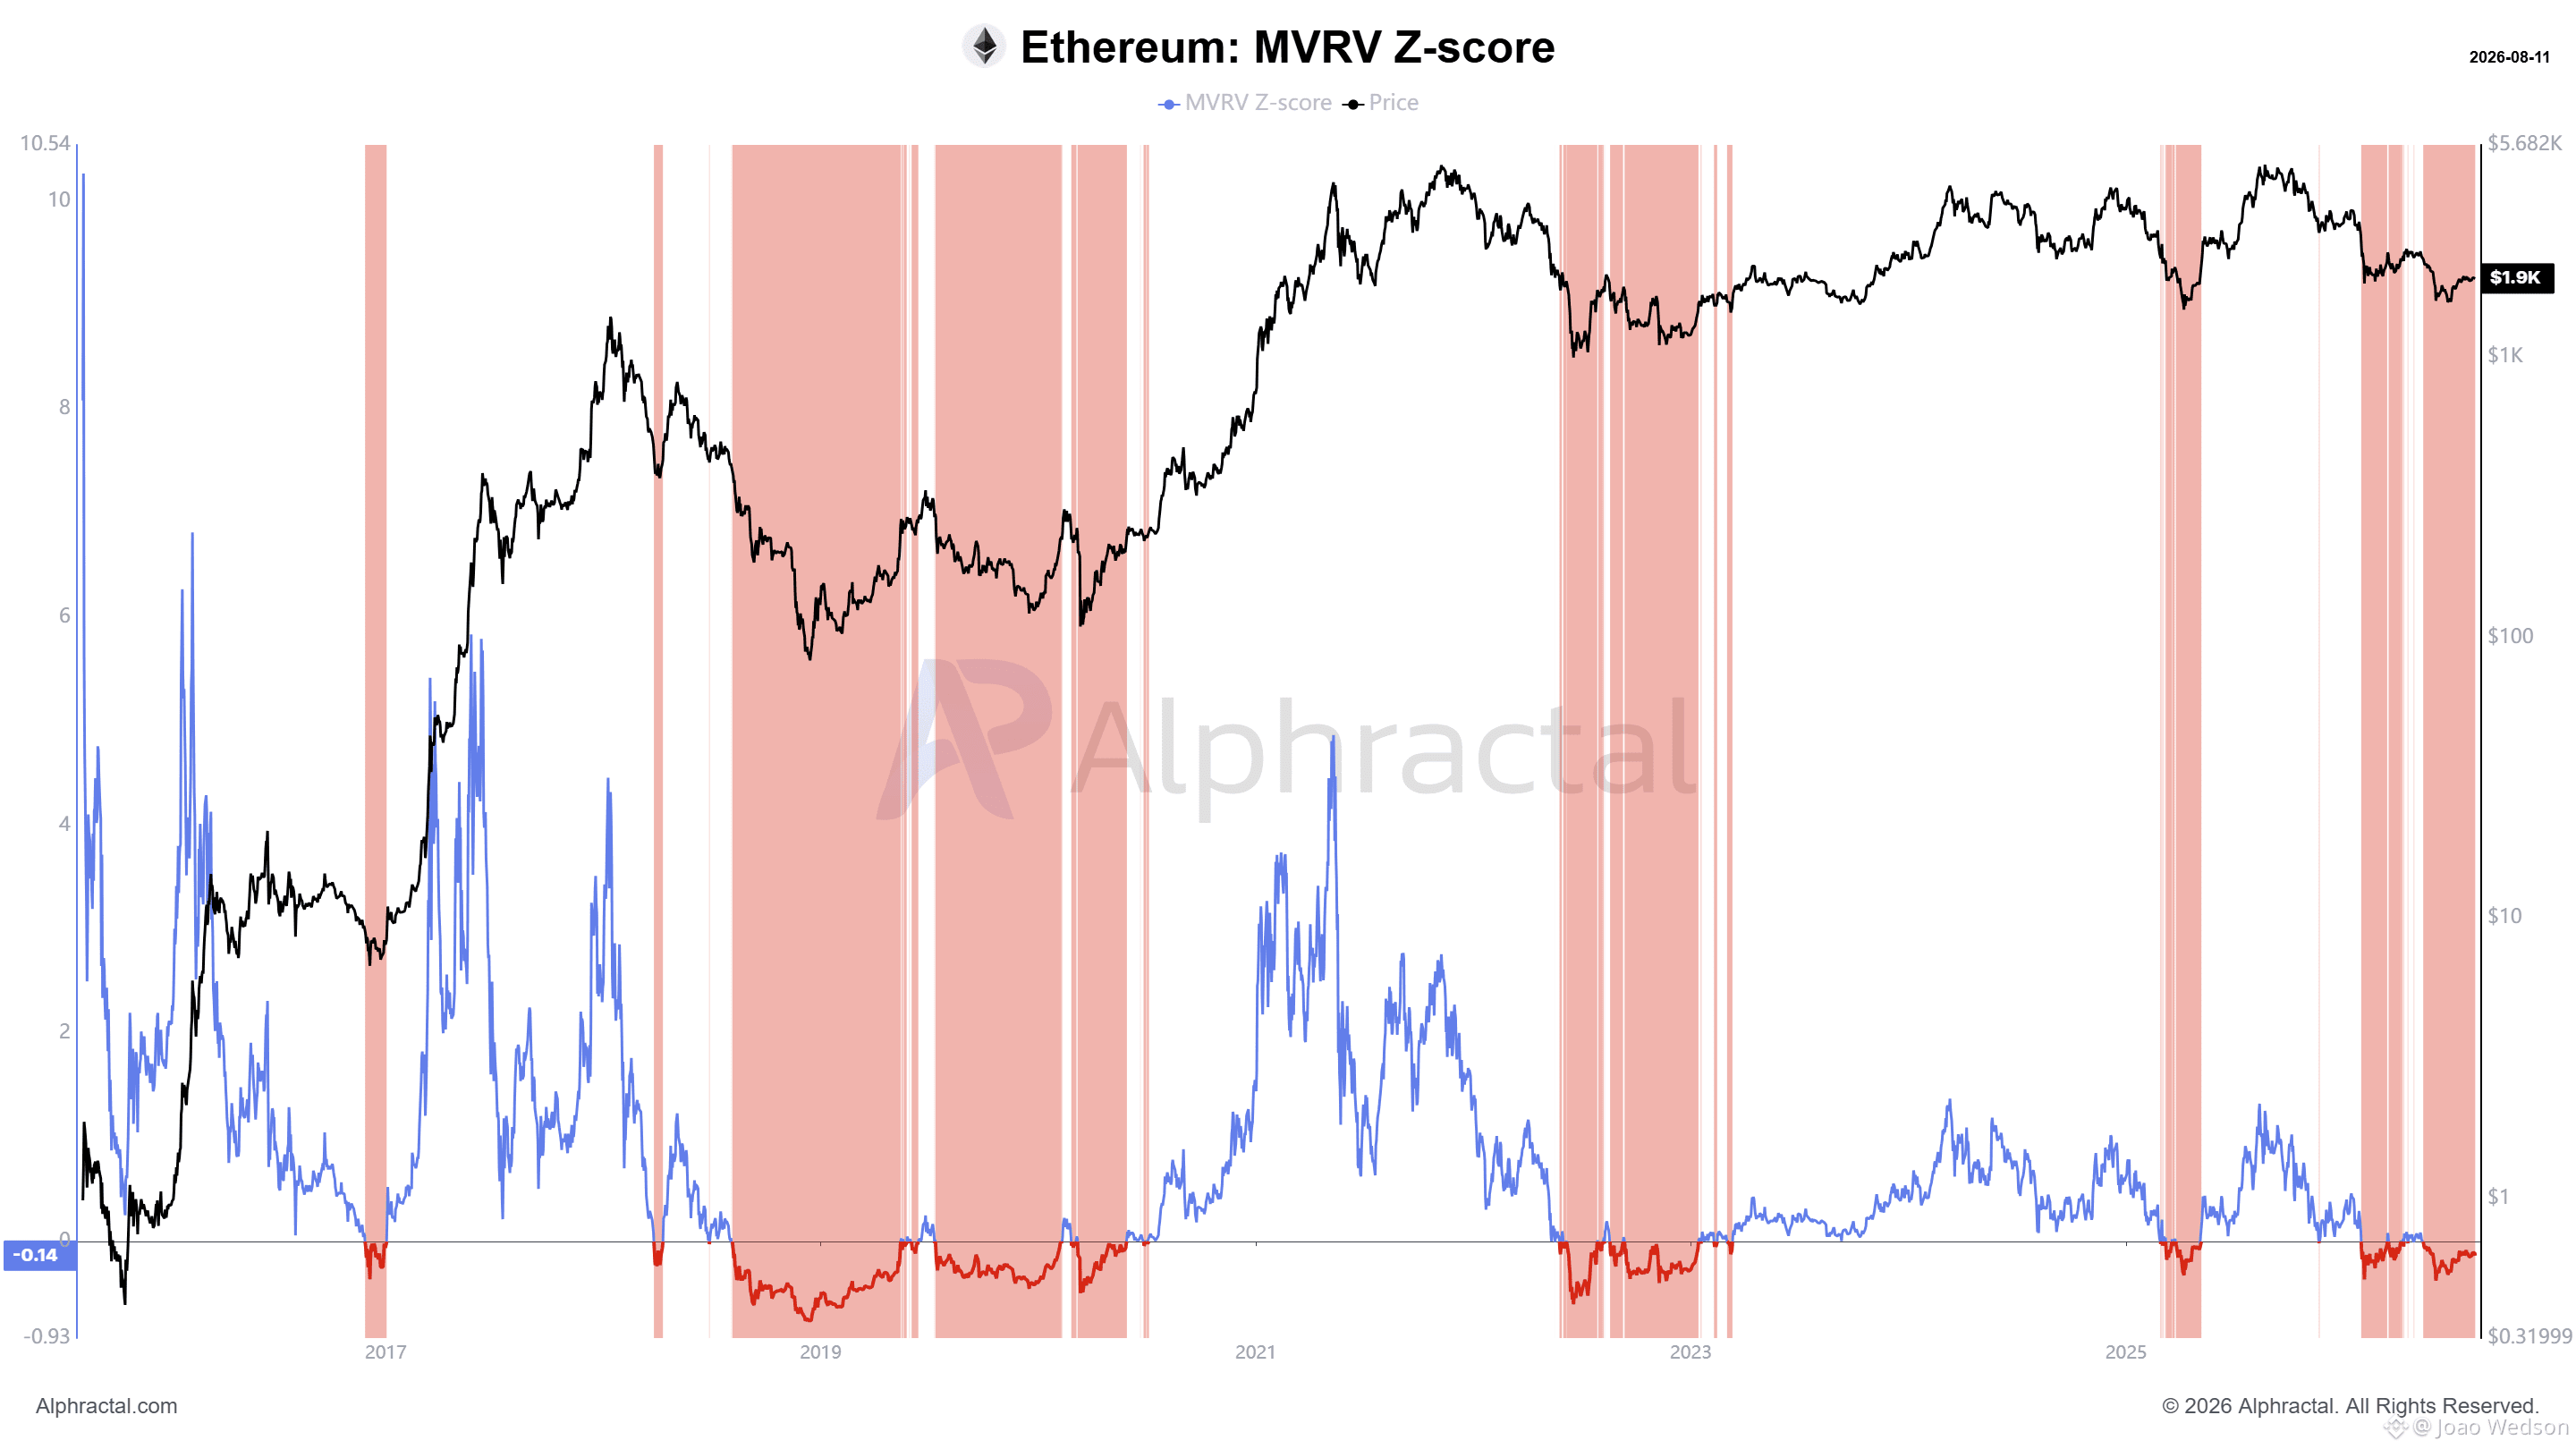
77
·
--
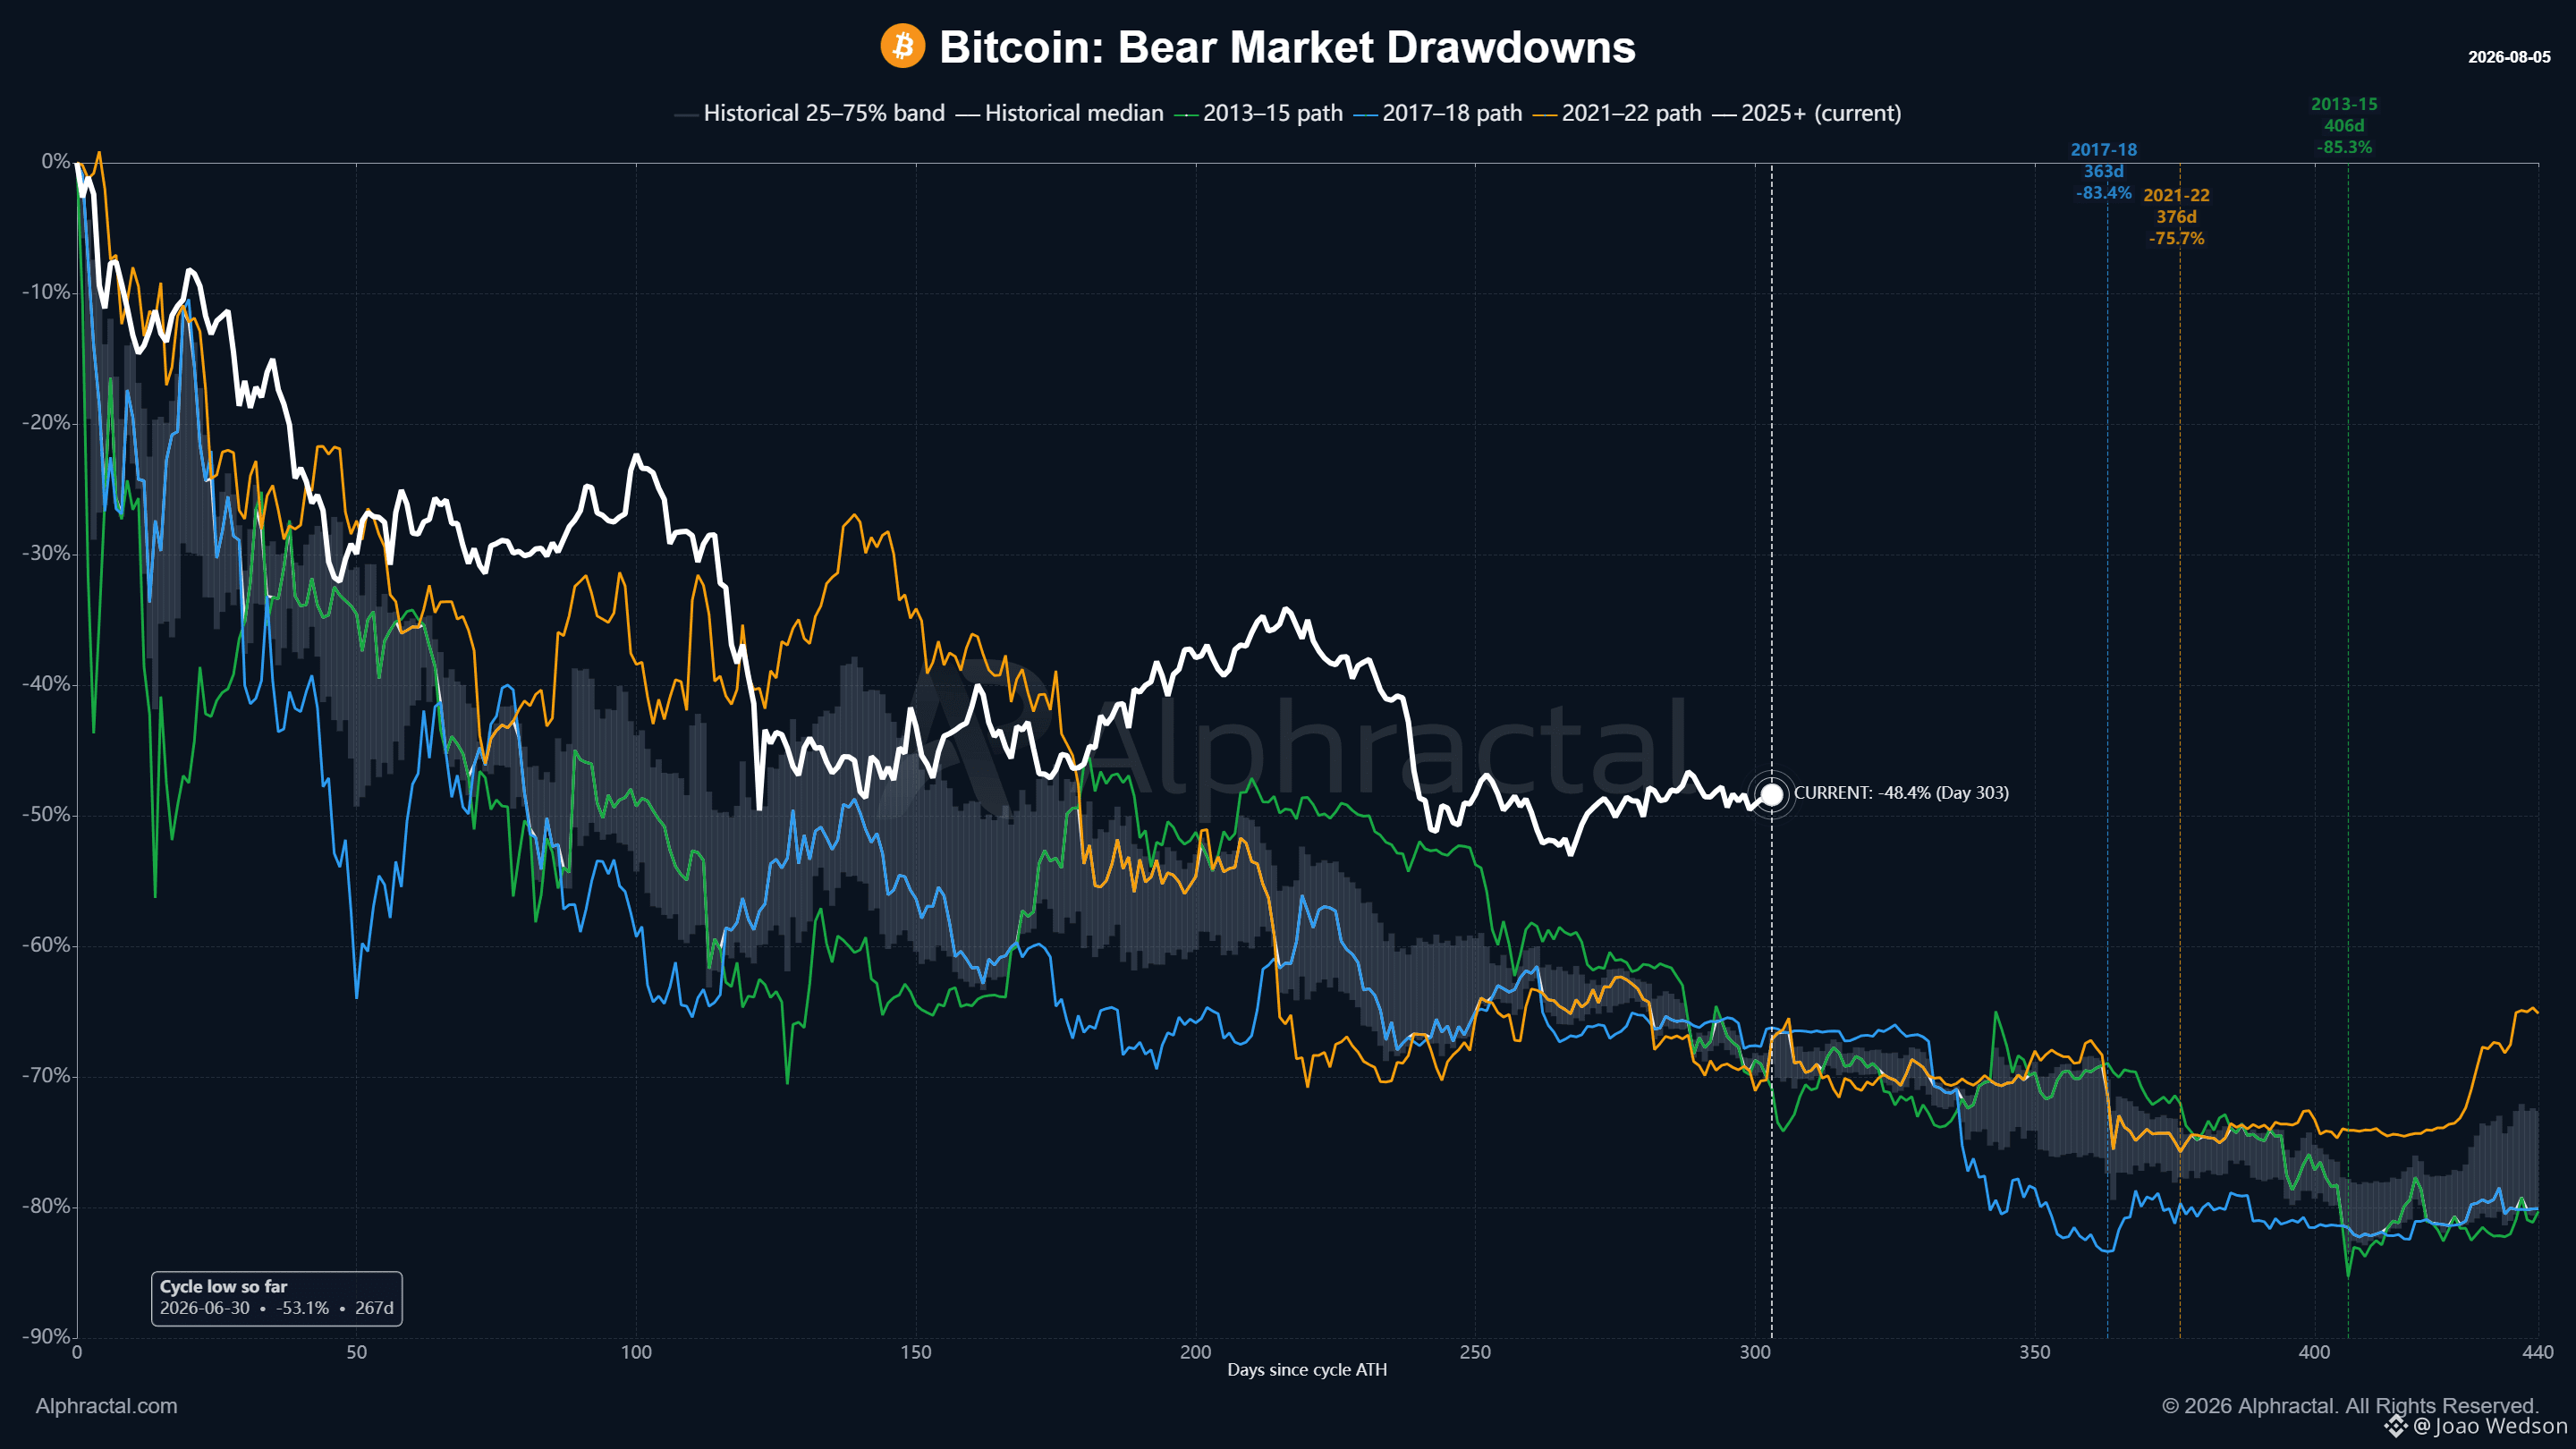
It has now been 303 days since Bitcoin’s all-time high, and BTC continues to move through one of the longest drawdown periods of this cycle.
Bitcoin is currently about 48.4% below its ATH, while the deepest drawdown of this cycle reached 53.1% on Day 267.
Compared with previous major bear markets:
2017/18: 363 days, 83.4% drawdown
2021/22: 376 days, 75.7% drawdown
2013/15: 406 days, 85.3% drawdown
In terms of time, the current market is already entering the same region where previous major bear cycles began to mature.
But there is one important difference: the magnitude of the current drawdown is still significantly smaller.
303 days into the Bear Market. The question now is not only how much further Bitcoin can fall, but how much longer it will take for this structure to finally change.
Alphractal.com
It has now been 303 days since Bitcoin’s all-time high, and BTC continues to move through one of the longest drawdown periods of this cycle.
Bitcoin is currently about 48.4% below its ATH, while the deepest drawdown of this cycle reached 53.1% on Day 267.
Compared with previous major bear markets:
2017/18: 363 days, 83.4% drawdown
2021/22: 376 days, 75.7% drawdown
2013/15: 406 days, 85.3% drawdown
In terms of time, the current market is already entering the same region where previous major bear cycles began to mature.
But there is one important difference: the magnitude of the current drawdown is still significantly smaller.
303 days into the Bear Market. The question now is not only how much further Bitcoin can fall, but how much longer it will take for this structure to finally change.
Alphractal.com
Bitcoin is currently about 48.4% below its ATH, while the deepest drawdown of this cycle reached 53.1% on Day 267.
Compared with previous major bear markets:
2017/18: 363 days, 83.4% drawdown
2021/22: 376 days, 75.7% drawdown
2013/15: 406 days, 85.3% drawdown
In terms of time, the current market is already entering the same region where previous major bear cycles began to mature.
But there is one important difference: the magnitude of the current drawdown is still significantly smaller.
303 days into the Bear Market. The question now is not only how much further Bitcoin can fall, but how much longer it will take for this structure to finally change.
Alphractal.com
86
·
--
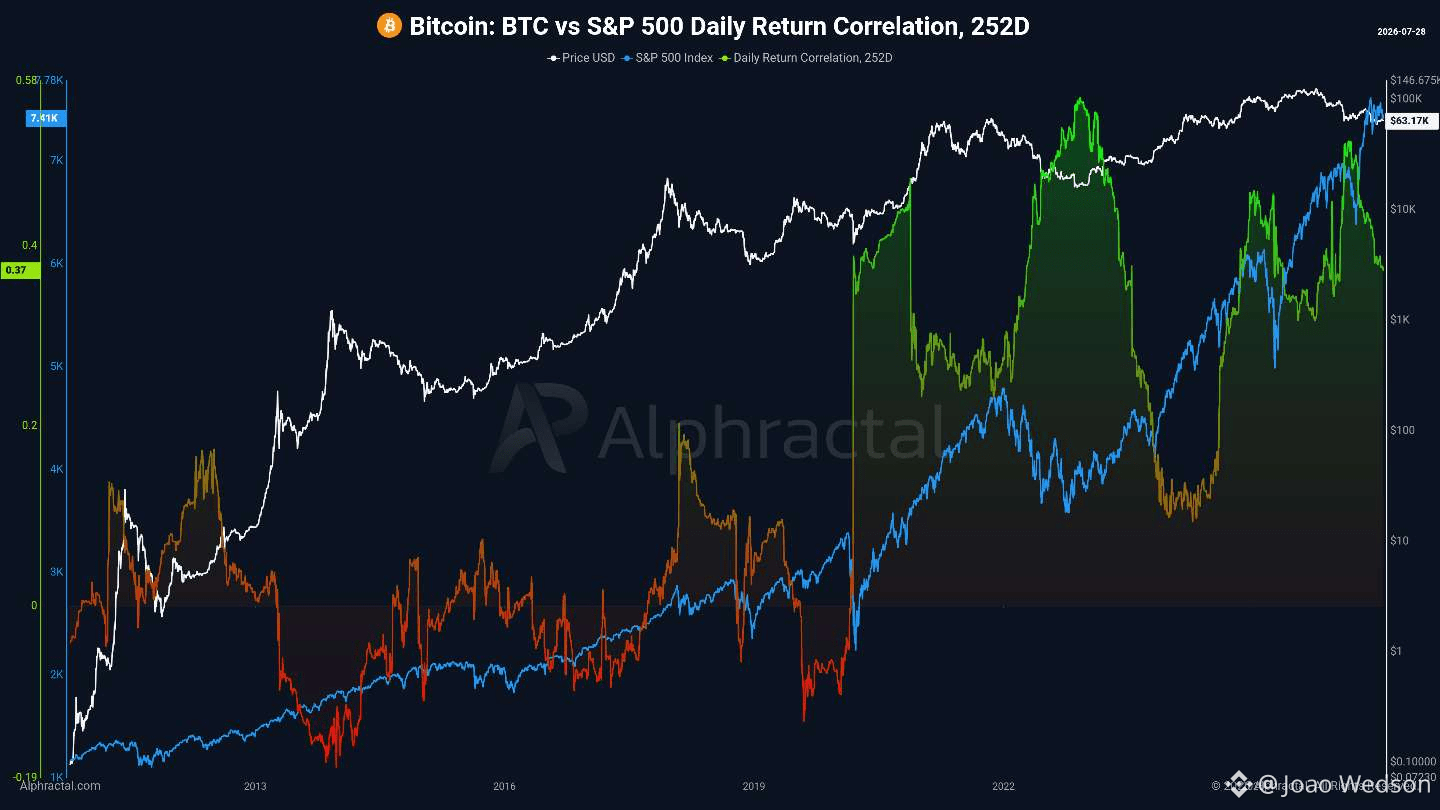
Bitcoin is increasingly trading on its own terms.
The traditional 252 day rolling correlation between Bitcoin and the S&P 500 price levels is now at its lowest point in 11 years.
However, price level correlations can be heavily influenced by long term trends. That is why we created a second and more robust view: the 252 day correlation between their daily logarithmic returns.
That correlation is currently around 0.37 and falling.
This means Bitcoin and the S&P 500 still share some daily risk behavior, but the relationship is only moderate and continues to weaken.
Why does this matter?
Because Bitcoin does not need the traditional market to lead every stage of its cycle. BTC can build a macro bottom and transition into a new bull market even while traditional markets follow a completely different path.
Correlations are not permanent. They change as market regimes change.
Bitcoin is showing that it has a life of its own. Data should define the narrative, not the other way around.
Source: Alphractal
Bitcoin is increasingly trading on its own terms.
The traditional 252 day rolling correlation between Bitcoin and the S&P 500 price levels is now at its lowest point in 11 years.
However, price level correlations can be heavily influenced by long term trends. That is why we created a second and more robust view: the 252 day correlation between their daily logarithmic returns.
That correlation is currently around 0.37 and falling.
This means Bitcoin and the S&P 500 still share some daily risk behavior, but the relationship is only moderate and continues to weaken.
Why does this matter?
Because Bitcoin does not need the traditional market to lead every stage of its cycle. BTC can build a macro bottom and transition into a new bull market even while traditional markets follow a completely different path.
Correlations are not permanent. They change as market regimes change.
Bitcoin is showing that it has a life of its own. Data should define the narrative, not the other way around.
Source: Alphractal
The traditional 252 day rolling correlation between Bitcoin and the S&P 500 price levels is now at its lowest point in 11 years.
However, price level correlations can be heavily influenced by long term trends. That is why we created a second and more robust view: the 252 day correlation between their daily logarithmic returns.
That correlation is currently around 0.37 and falling.
This means Bitcoin and the S&P 500 still share some daily risk behavior, but the relationship is only moderate and continues to weaken.
Why does this matter?
Because Bitcoin does not need the traditional market to lead every stage of its cycle. BTC can build a macro bottom and transition into a new bull market even while traditional markets follow a completely different path.
Correlations are not permanent. They change as market regimes change.
Bitcoin is showing that it has a life of its own. Data should define the narrative, not the other way around.
Source: Alphractal
84
·
--
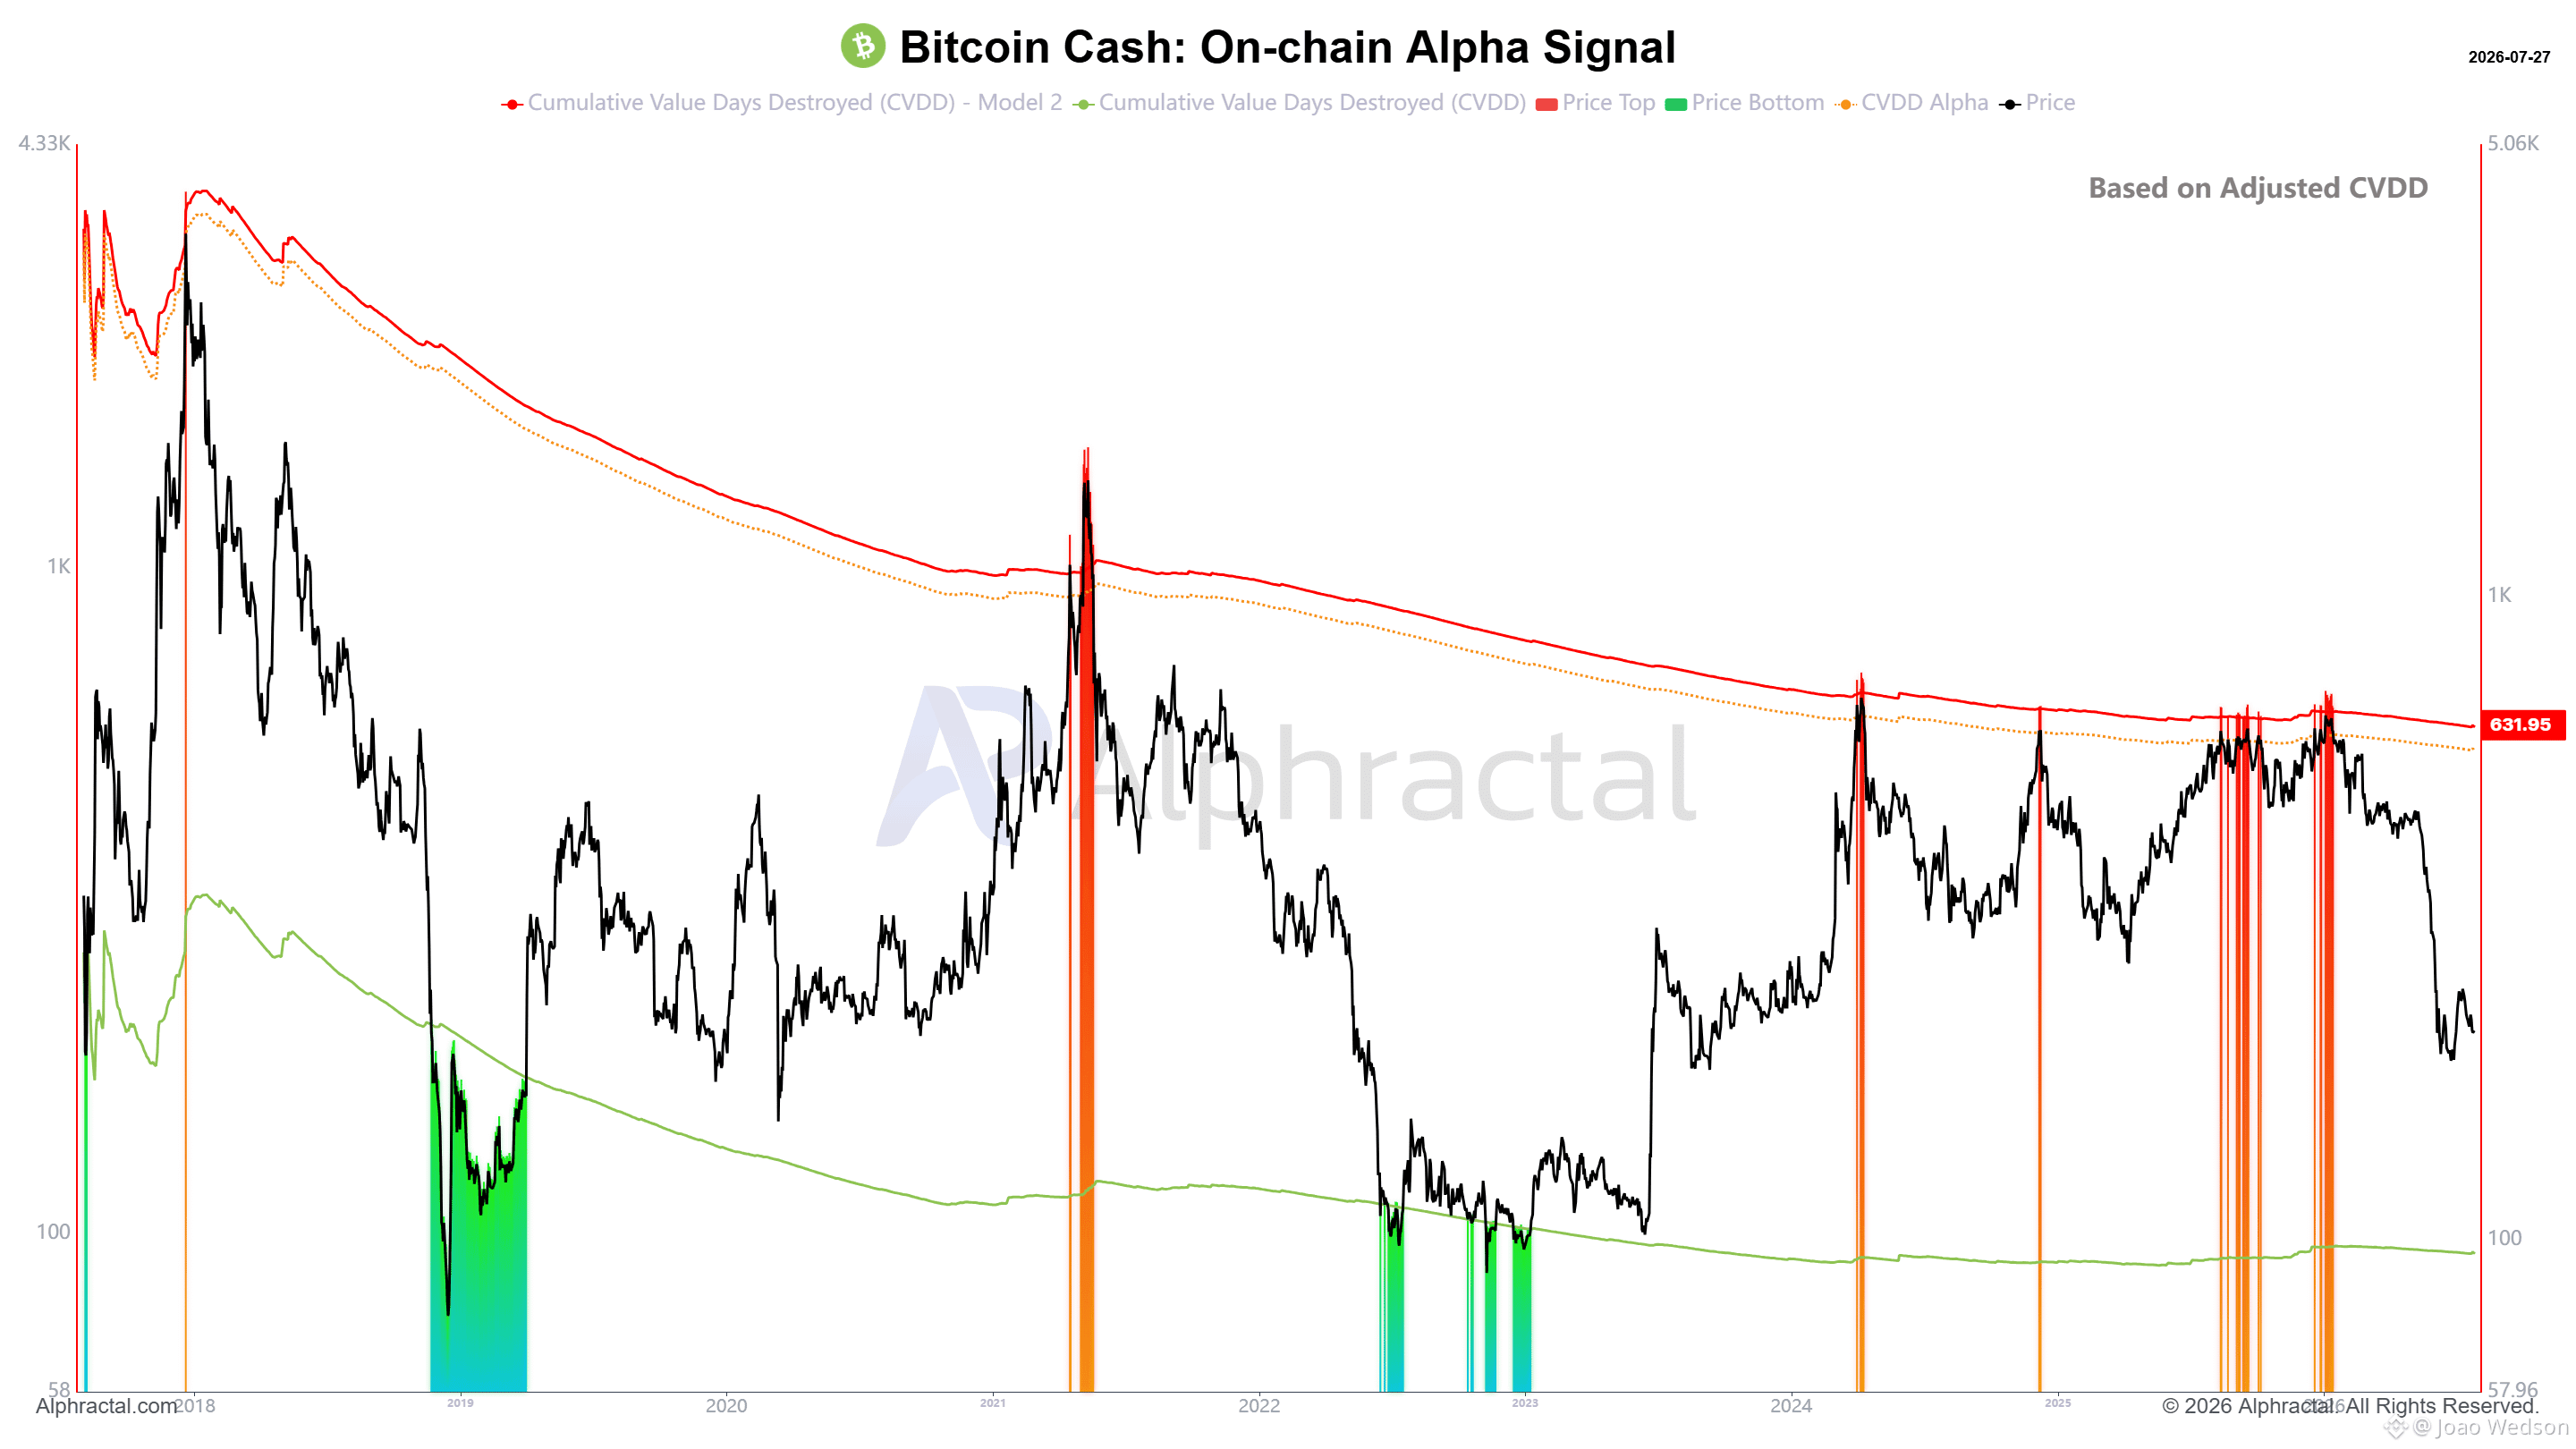
We have already shown how powerful our Alpha Onchain Metrics can be, and $BCH is no exception.
If the price eventually reaches the lower level, the potential market bottom could be below $100.
In that scenario, BCH would not be the only asset in a critical situation. The entire altcoin market would likely be under severe pressure.
If this happens, only the most courageous and resilient investors will remain.
Most people may become so disappointed with the market that they will claim cryptocurrencies are a terrible investment.
But the truth is that many of them were simply poorly positioned at the wrong time.
Would you buy BCH if it dropped below $100?
We have already shown how powerful our Alpha Onchain Metrics can be, and $BCH is no exception.
If the price eventually reaches the lower level, the potential market bottom could be below $100.
In that scenario, BCH would not be the only asset in a critical situation. The entire altcoin market would likely be under severe pressure.
If this happens, only the most courageous and resilient investors will remain.
Most people may become so disappointed with the market that they will claim cryptocurrencies are a terrible investment.
But the truth is that many of them were simply poorly positioned at the wrong time.
Would you buy BCH if it dropped below $100?
If the price eventually reaches the lower level, the potential market bottom could be below $100.
In that scenario, BCH would not be the only asset in a critical situation. The entire altcoin market would likely be under severe pressure.
If this happens, only the most courageous and resilient investors will remain.
Most people may become so disappointed with the market that they will claim cryptocurrencies are a terrible investment.
But the truth is that many of them were simply poorly positioned at the wrong time.
Would you buy BCH if it dropped below $100?
64
·
--
Concordo. Essa frase soa artificial. Melhor removê-la e seguir direto:
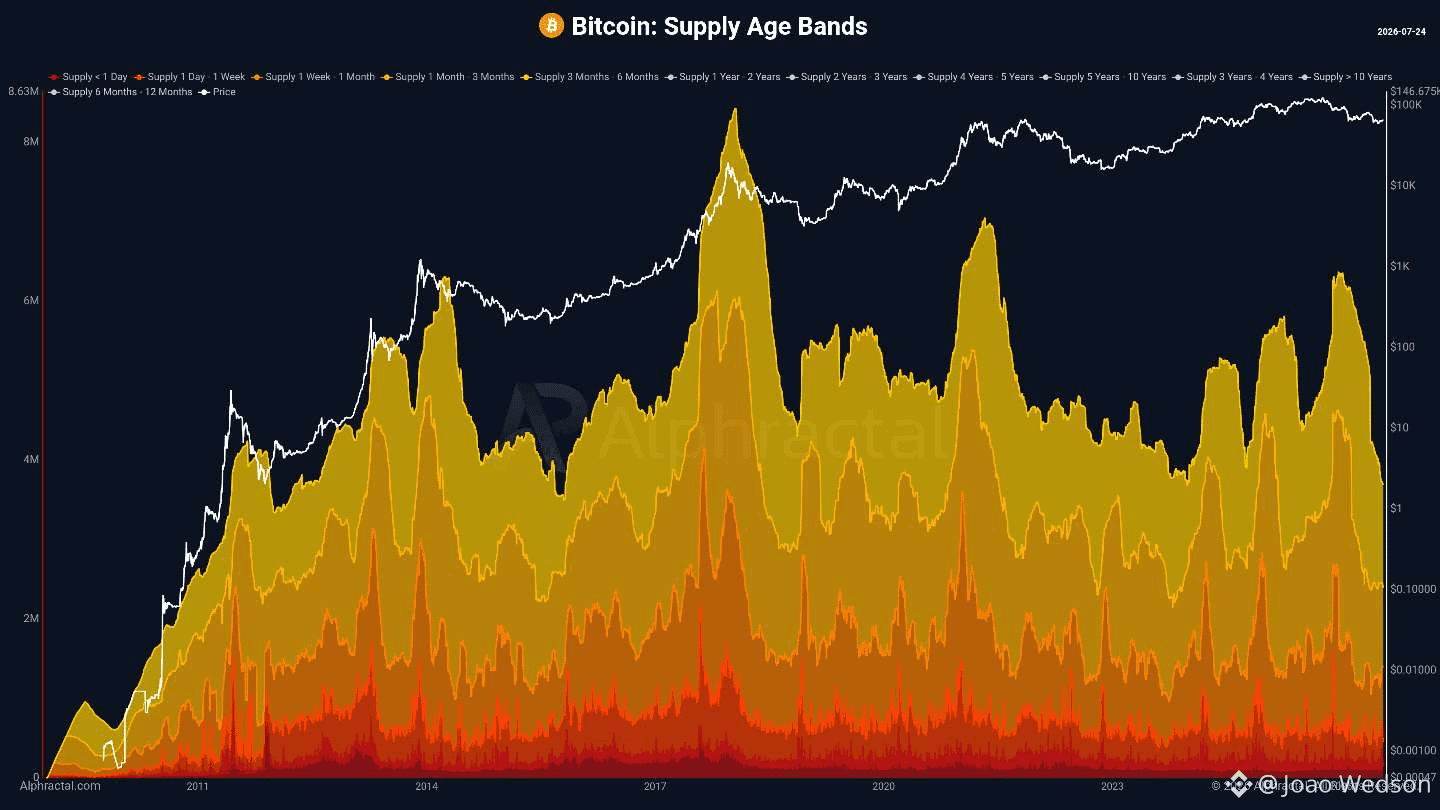
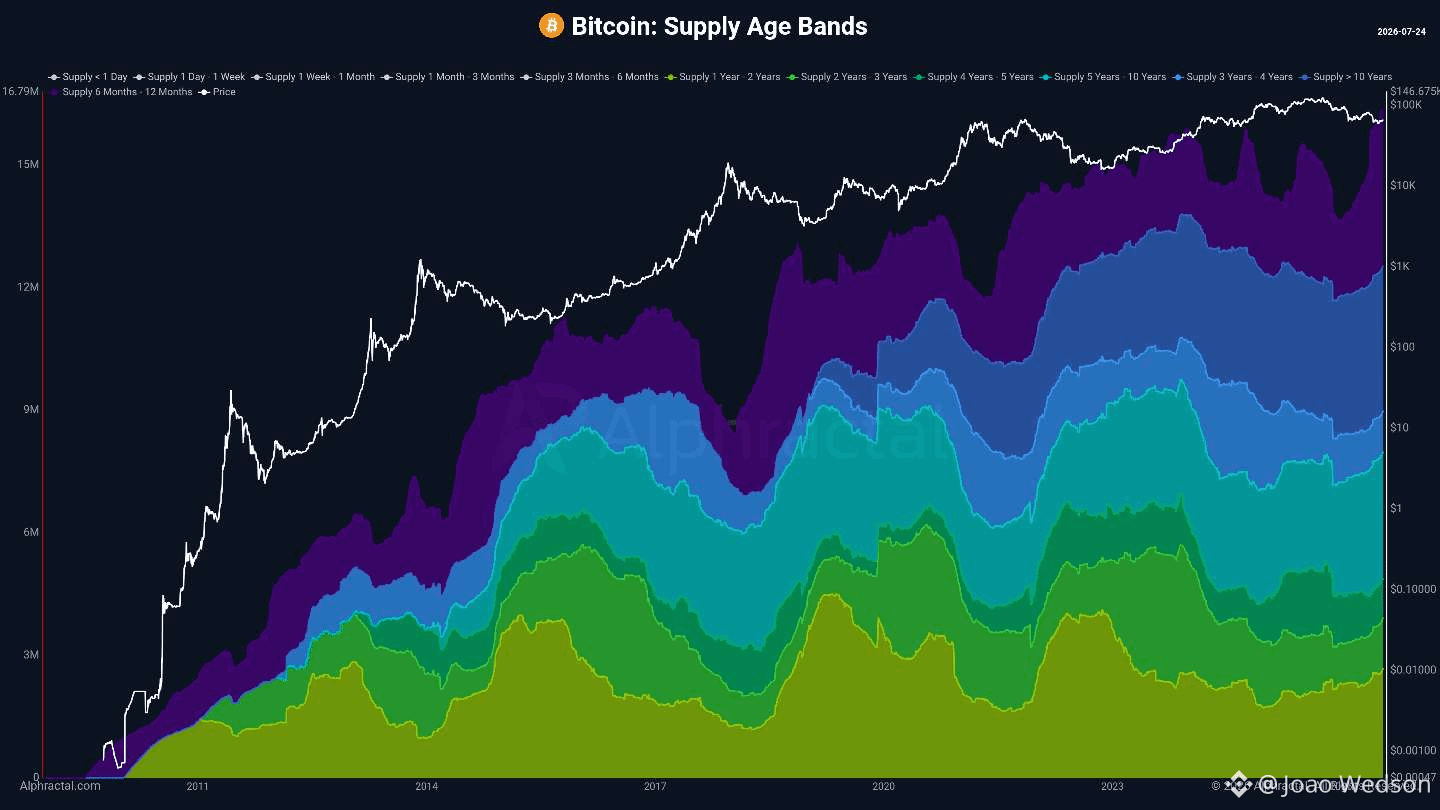
The Supply Age Bands chart makes it clear that those who hold Bitcoin for more than 6 months tend to keep it for years.
Meanwhile, those without patience often fail to keep their Bitcoin in their wallets for even 6 months.
BTC held for more than 6 months is usually sold only when the market enters a real bullish phase and reaches moments of euphoria.
Short-Term Holders, on the other hand, tend to accumulate later and sell their Bitcoin during Bear Market phases.
In other words, Short-Term Holders help drive the price higher, but Long-Term Holders are the ones who actually build fortunes by selling while the price is rising.
Are you a Short-Term Holder or a Long-Term Holder?
Charts: Alphractal
Concordo. Essa frase soa artificial. Melhor removê-la e seguir direto:
The Supply Age Bands chart makes it clear that those who hold Bitcoin for more than 6 months tend to keep it for years.
Meanwhile, those without patience often fail to keep their Bitcoin in their wallets for even 6 months.
BTC held for more than 6 months is usually sold only when the market enters a real bullish phase and reaches moments of euphoria.
Short-Term Holders, on the other hand, tend to accumulate later and sell their Bitcoin during Bear Market phases.
In other words, Short-Term Holders help drive the price higher, but Long-Term Holders are the ones who actually build fortunes by selling while the price is rising.
Are you a Short-Term Holder or a Long-Term Holder?
Charts: Alphractal
The Supply Age Bands chart makes it clear that those who hold Bitcoin for more than 6 months tend to keep it for years.
Meanwhile, those without patience often fail to keep their Bitcoin in their wallets for even 6 months.
BTC held for more than 6 months is usually sold only when the market enters a real bullish phase and reaches moments of euphoria.
Short-Term Holders, on the other hand, tend to accumulate later and sell their Bitcoin during Bear Market phases.
In other words, Short-Term Holders help drive the price higher, but Long-Term Holders are the ones who actually build fortunes by selling while the price is rising.
Are you a Short-Term Holder or a Long-Term Holder?
Charts: Alphractal
68
·
--
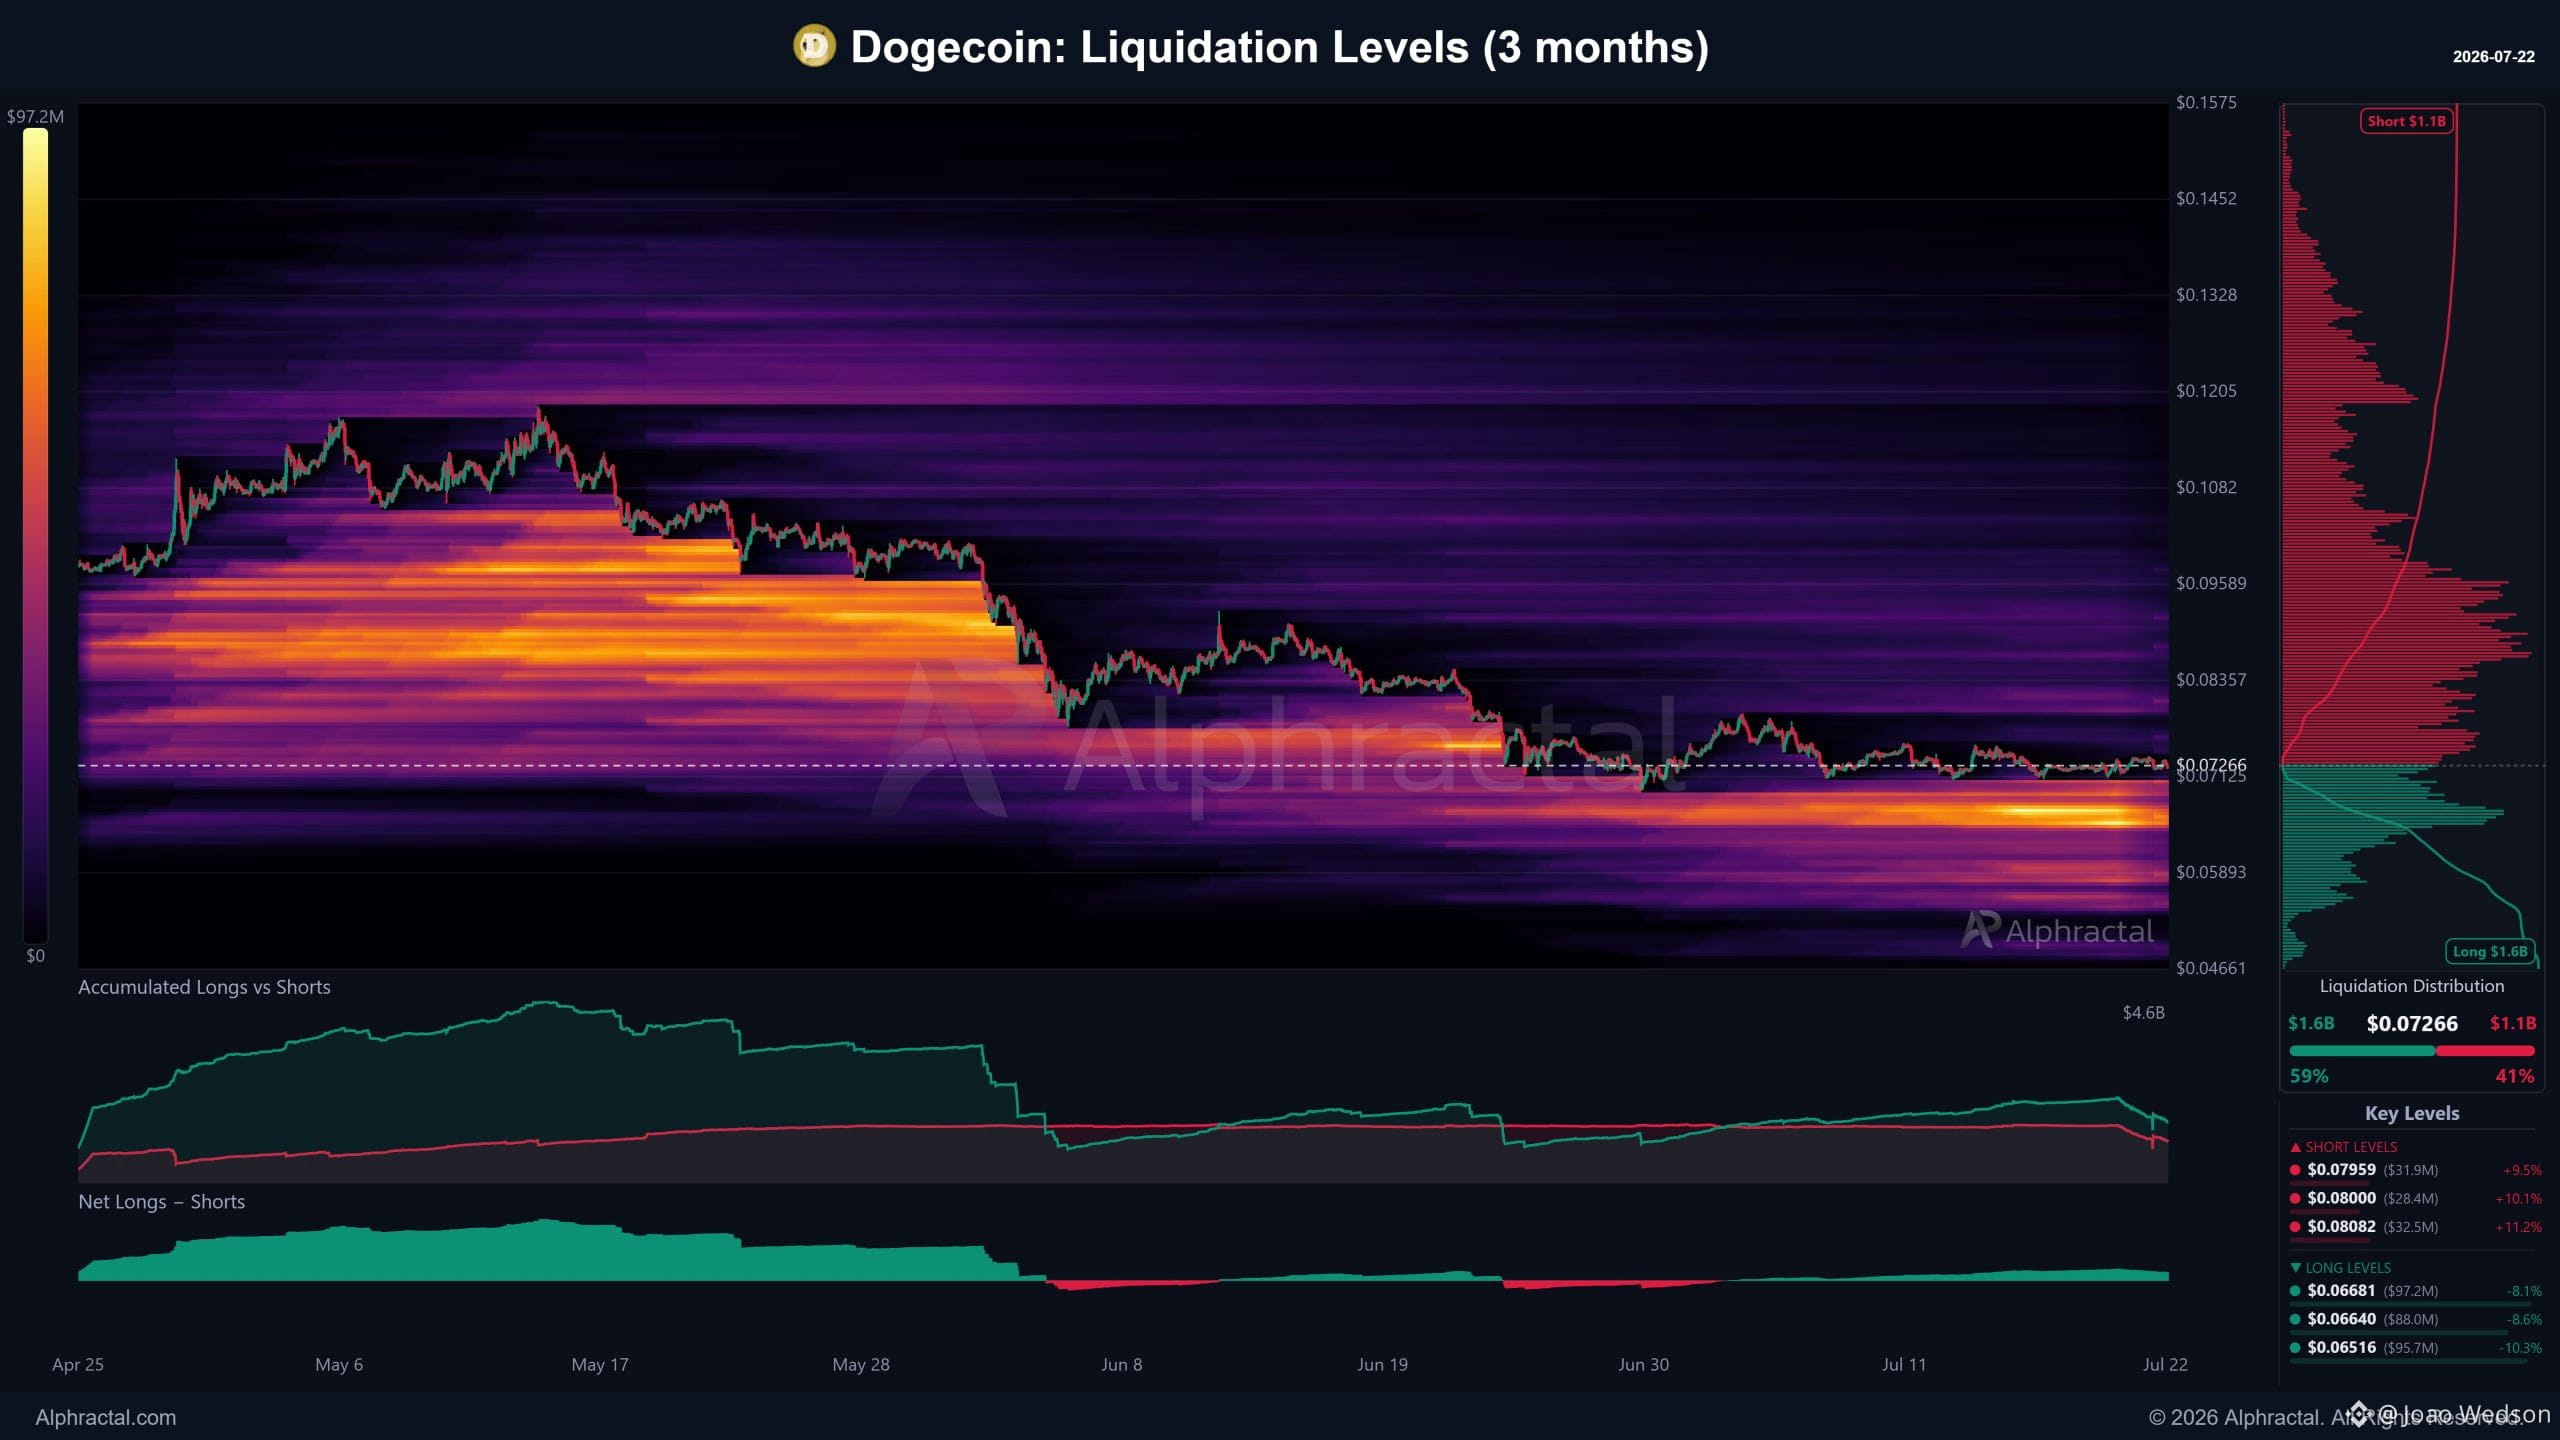
Your meme coin is not going up because everyone is only focused on opening Long positions! $DOGE and $PEPE are clear examples... 🔥Alphractal
Your meme coin is not going up because everyone is only focused on opening Long positions! $DOGE and $PEPE are clear examples... 🔥Alphractal
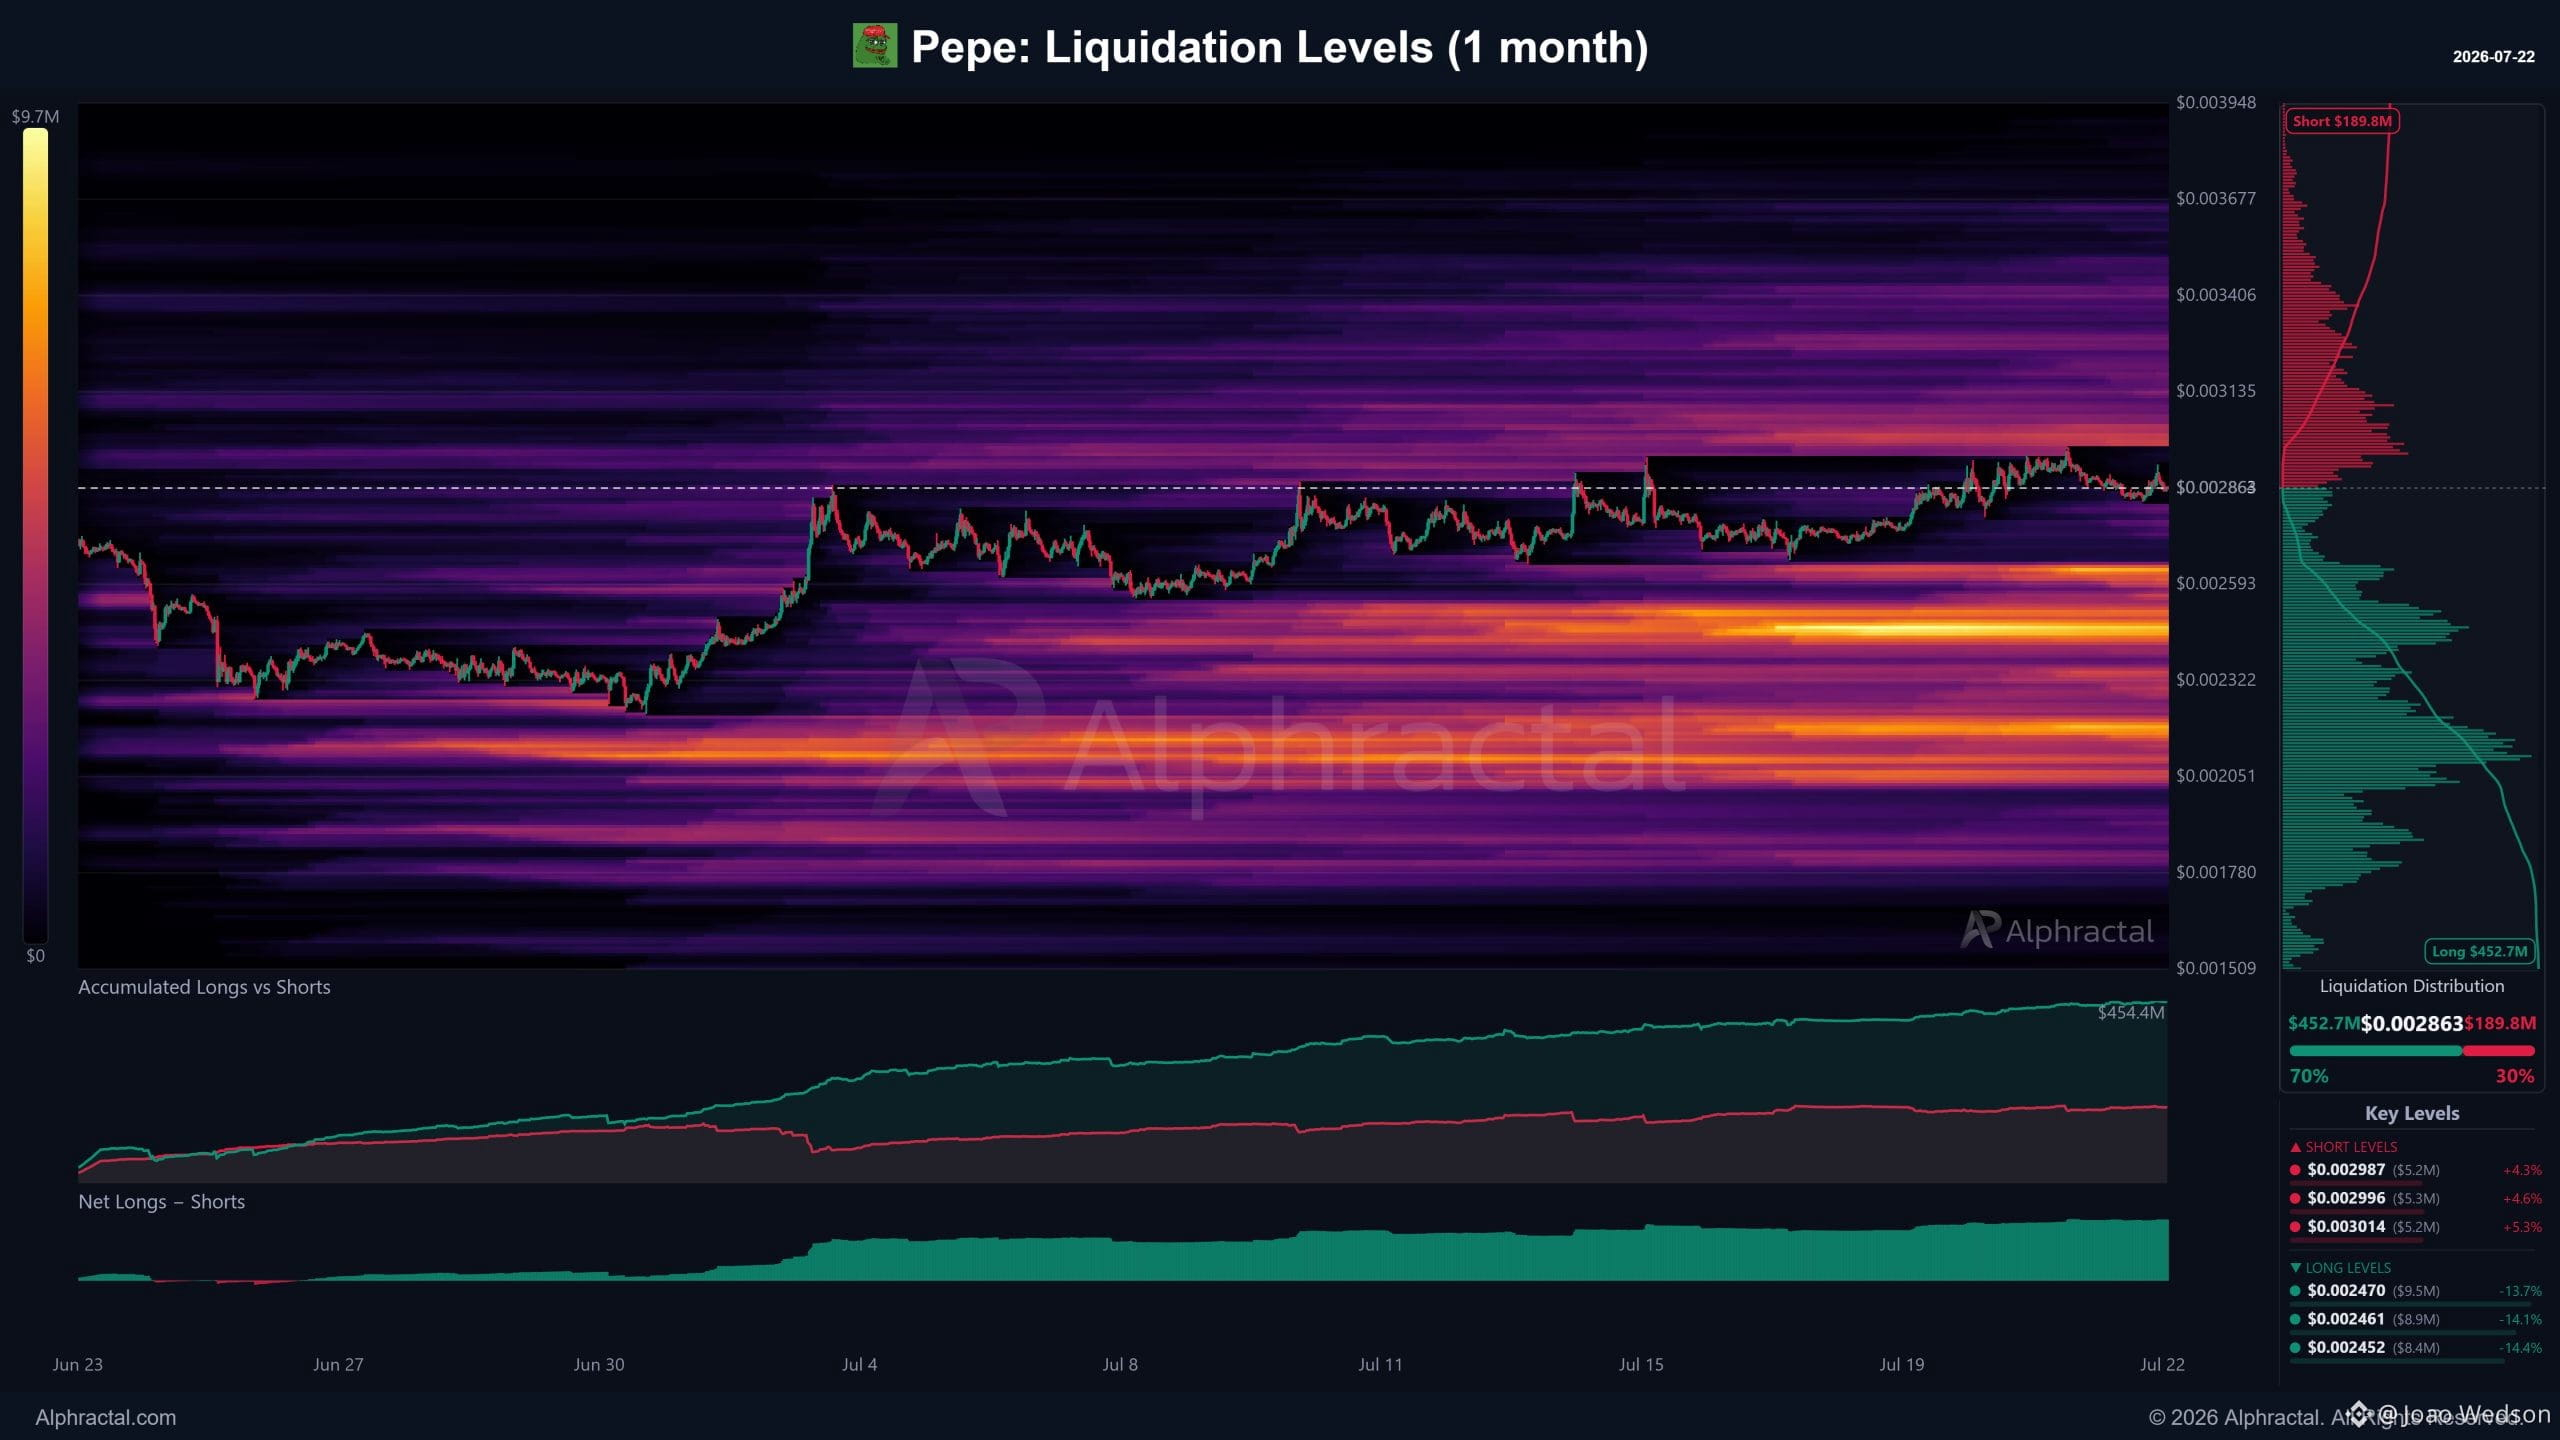
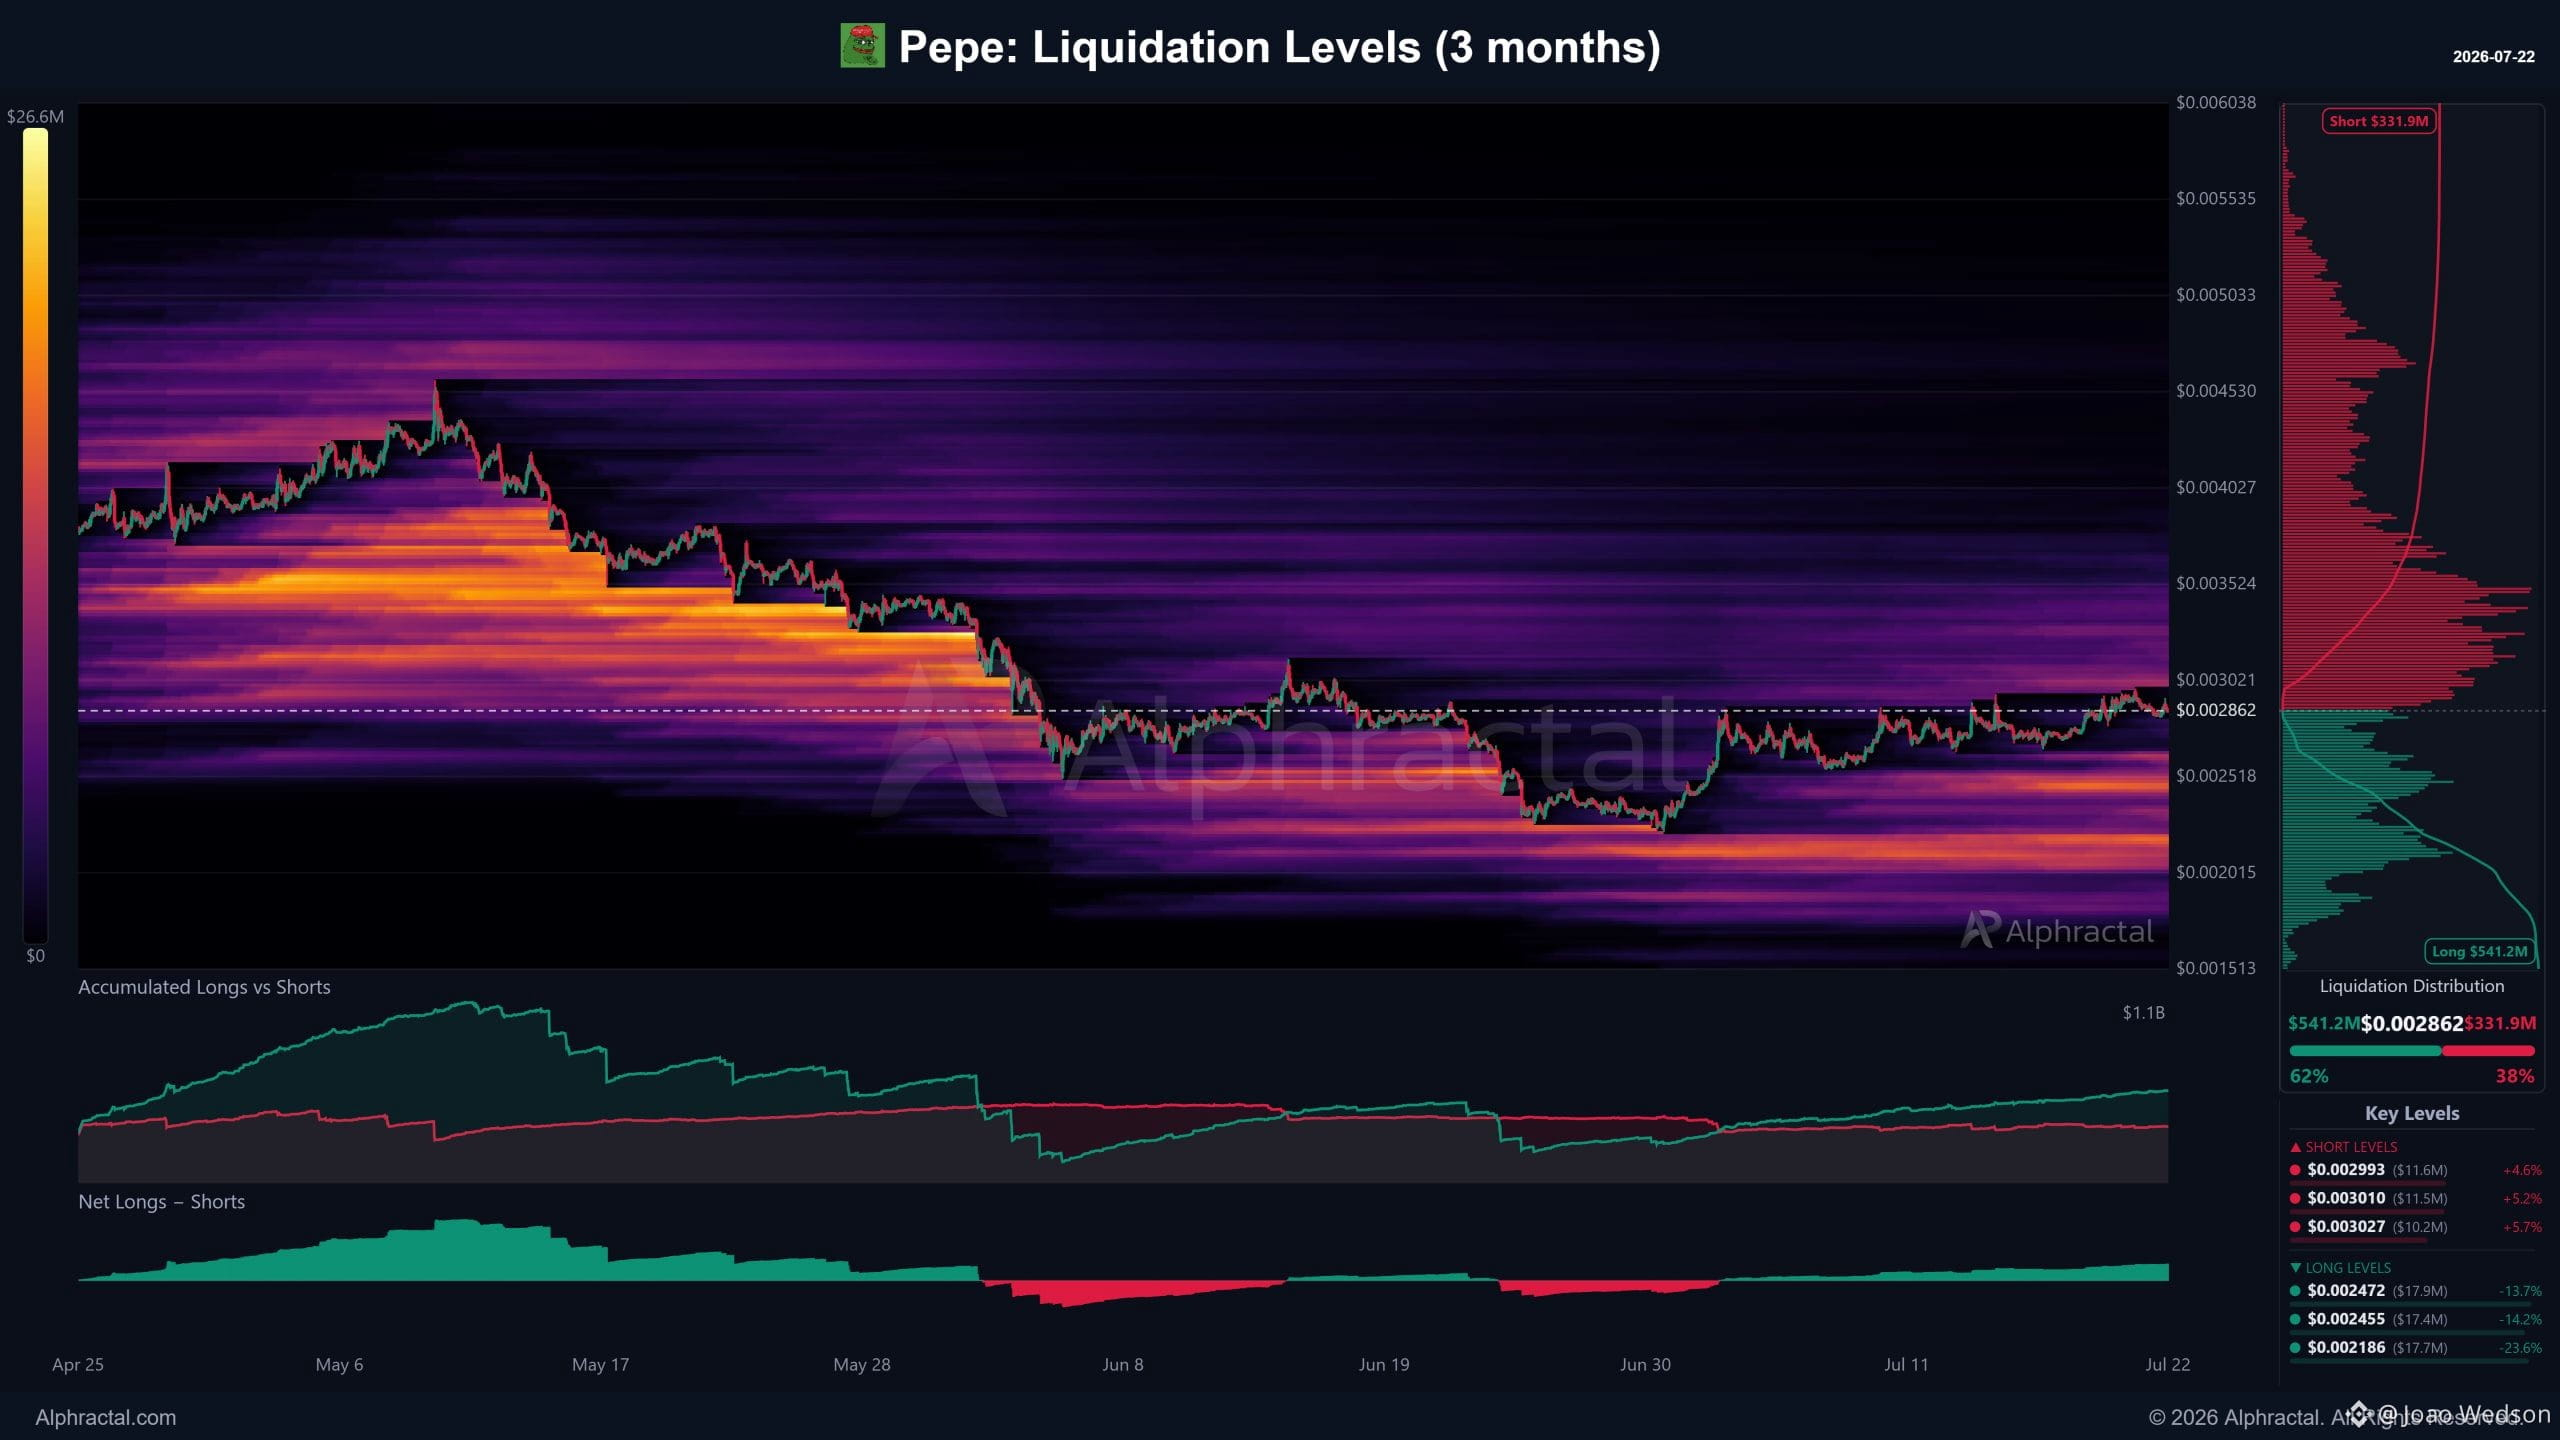
59
·
--
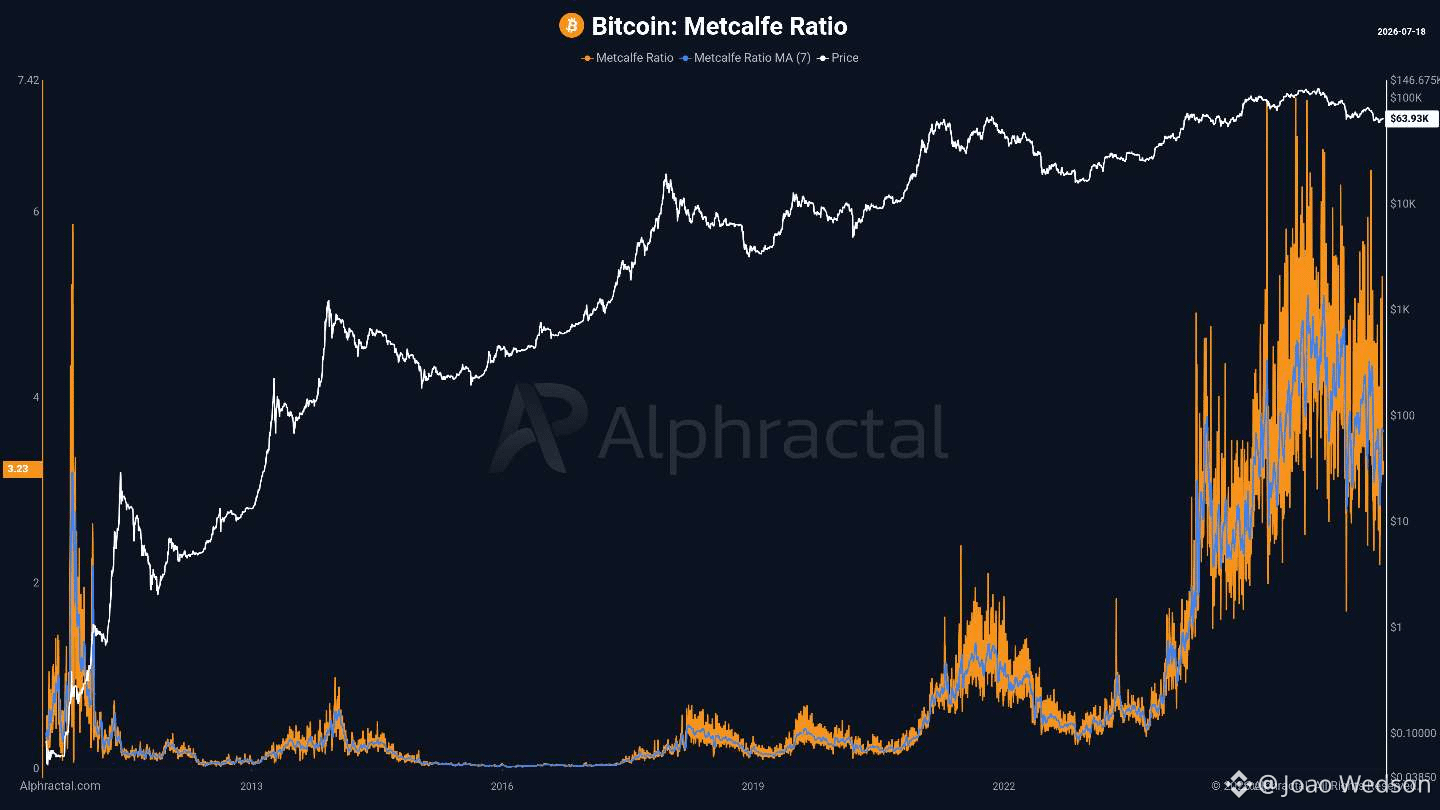
Bitcoin’s Valuation Is Rising Faster Than Its Adoption
Bitcoin’s Metcalfe Ratio is currently around 3.23, indicating that its market capitalization has grown faster than user activity across the network.
This metric compares Bitcoin’s market value with the square of its active addresses, following the principles of Metcalfe’s Law.
When the ratio rises, it means the price is moving further away from the growth in network participation. This does not necessarily mean there is no demand, but it suggests that the valuation is being supported by proportionally lower activity, increasing the speculative component of the market.
Higher values may indicate that Bitcoin is trading at a premium relative to its adoption fundamentals. Lower values, on the other hand, may suggest potential undervaluation relative to network usage.
In the short term, price can continue to be driven by liquidity and speculation. In the long term, however, adoption needs to keep pace with valuation.
Focus on the Alpha.
Alphractal.com
Bitcoin’s Valuation Is Rising Faster Than Its Adoption
Bitcoin’s Metcalfe Ratio is currently around 3.23, indicating that its market capitalization has grown faster than user activity across the network.
This metric compares Bitcoin’s market value with the square of its active addresses, following the principles of Metcalfe’s Law.
When the ratio rises, it means the price is moving further away from the growth in network participation. This does not necessarily mean there is no demand, but it suggests that the valuation is being supported by proportionally lower activity, increasing the speculative component of the market.
Higher values may indicate that Bitcoin is trading at a premium relative to its adoption fundamentals. Lower values, on the other hand, may suggest potential undervaluation relative to network usage.
In the short term, price can continue to be driven by liquidity and speculation. In the long term, however, adoption needs to keep pace with valuation.
Focus on the Alpha.
Alphractal.com
Bitcoin’s Metcalfe Ratio is currently around 3.23, indicating that its market capitalization has grown faster than user activity across the network.
This metric compares Bitcoin’s market value with the square of its active addresses, following the principles of Metcalfe’s Law.
When the ratio rises, it means the price is moving further away from the growth in network participation. This does not necessarily mean there is no demand, but it suggests that the valuation is being supported by proportionally lower activity, increasing the speculative component of the market.
Higher values may indicate that Bitcoin is trading at a premium relative to its adoption fundamentals. Lower values, on the other hand, may suggest potential undervaluation relative to network usage.
In the short term, price can continue to be driven by liquidity and speculation. In the long term, however, adoption needs to keep pace with valuation.
Focus on the Alpha.
Alphractal.com
71
·
--
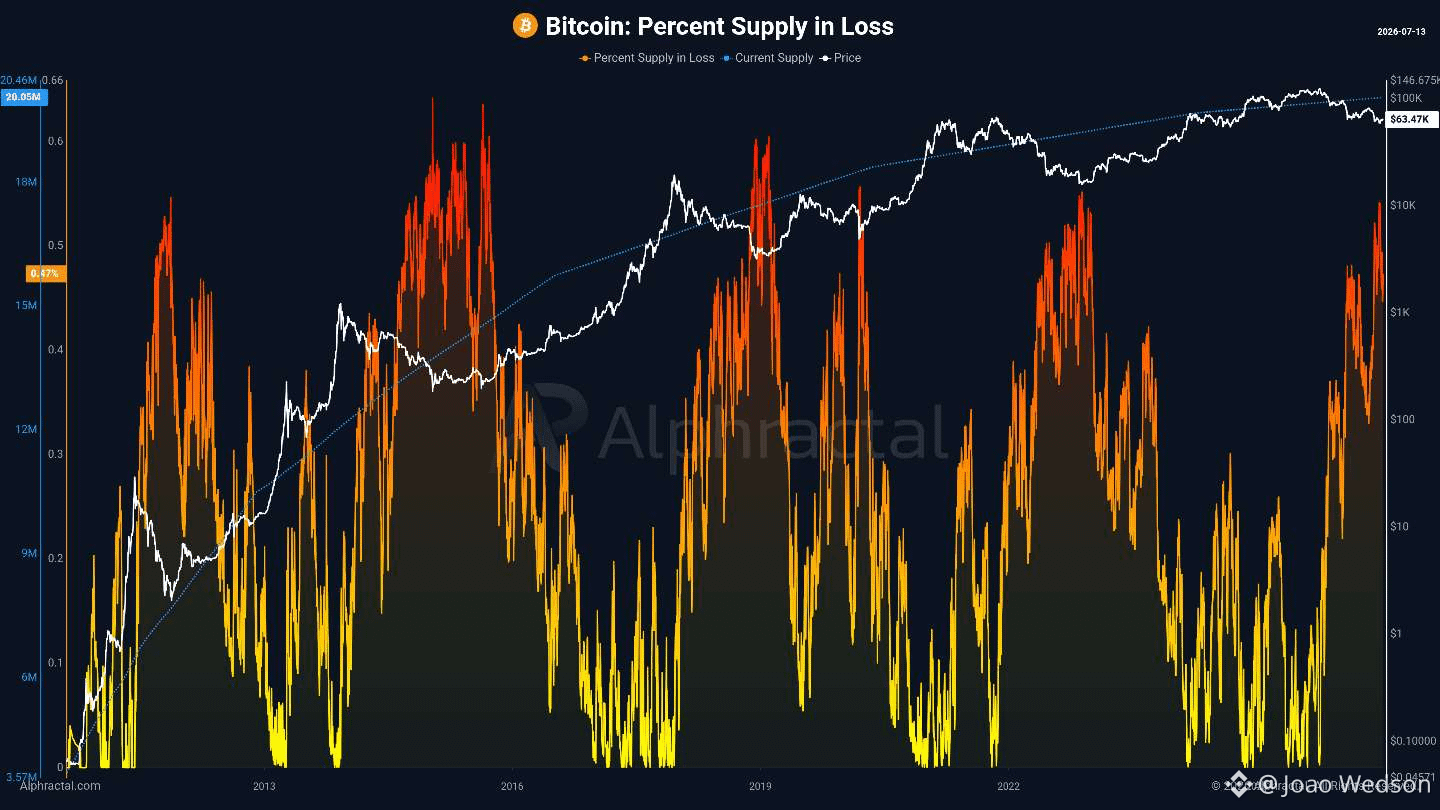
The current Bitcoin Bear Market can already be considered one of the most severe in its history.
Percent Supply in Loss has returned to levels similar to those observed in November 2022, showing that an extremely large share of the circulating supply is currently underwater.
But there is one important difference.
In November 2022, Bitcoin had approximately 19.2 million BTC in circulation. Today, the circulating supply is close to 20.05 million BTC.
This means that even with a similar percentage of the supply in loss, the absolute amount of Bitcoin trading below its acquisition price is significantly higher today.
In other words, more coins are currently carrying unrealized losses than during the 2022 cycle bottom.
This scenario also exposes an uncomfortable reality about the previous Bull Market. Despite new all time highs, institutional adoption, and the expansion of Bitcoin ETFs, a massive portion of the market ended up buying at elevated prices and now remains underwater.
From the perspective of how losses are distributed across investors, the previous Bull Market may be considered one of the weakest and least inclusive in Bitcoin’s history.
Percent Supply in Loss measures the share of the circulating supply that is currently underwater.
The higher the indicator, the larger the fraction of the market holding positions at a loss, which is commonly associated with market stress, capitulation, and the later stages of major drawdowns.
The market may have reached new all time highs.
But a large portion of investors never truly participated in that appreciation.
Data: Alphractal
The current Bitcoin Bear Market can already be considered one of the most severe in its history.
Percent Supply in Loss has returned to levels similar to those observed in November 2022, showing that an extremely large share of the circulating supply is currently underwater.
But there is one important difference.
In November 2022, Bitcoin had approximately 19.2 million BTC in circulation. Today, the circulating supply is close to 20.05 million BTC.
This means that even with a similar percentage of the supply in loss, the absolute amount of Bitcoin trading below its acquisition price is significantly higher today.
In other words, more coins are currently carrying unrealized losses than during the 2022 cycle bottom.
This scenario also exposes an uncomfortable reality about the previous Bull Market. Despite new all time highs, institutional adoption, and the expansion of Bitcoin ETFs, a massive portion of the market ended up buying at elevated prices and now remains underwater.
From the perspective of how losses are distributed across investors, the previous Bull Market may be considered one of the weakest and least inclusive in Bitcoin’s history.
Percent Supply in Loss measures the share of the circulating supply that is currently underwater.
The higher the indicator, the larger the fraction of the market holding positions at a loss, which is commonly associated with market stress, capitulation, and the later stages of major drawdowns.
The market may have reached new all time highs.
But a large portion of investors never truly participated in that appreciation.
Data: Alphractal
Percent Supply in Loss has returned to levels similar to those observed in November 2022, showing that an extremely large share of the circulating supply is currently underwater.
But there is one important difference.
In November 2022, Bitcoin had approximately 19.2 million BTC in circulation. Today, the circulating supply is close to 20.05 million BTC.
This means that even with a similar percentage of the supply in loss, the absolute amount of Bitcoin trading below its acquisition price is significantly higher today.
In other words, more coins are currently carrying unrealized losses than during the 2022 cycle bottom.
This scenario also exposes an uncomfortable reality about the previous Bull Market. Despite new all time highs, institutional adoption, and the expansion of Bitcoin ETFs, a massive portion of the market ended up buying at elevated prices and now remains underwater.
From the perspective of how losses are distributed across investors, the previous Bull Market may be considered one of the weakest and least inclusive in Bitcoin’s history.
Percent Supply in Loss measures the share of the circulating supply that is currently underwater.
The higher the indicator, the larger the fraction of the market holding positions at a loss, which is commonly associated with market stress, capitulation, and the later stages of major drawdowns.
The market may have reached new all time highs.
But a large portion of investors never truly participated in that appreciation.
Data: Alphractal
57
·
--
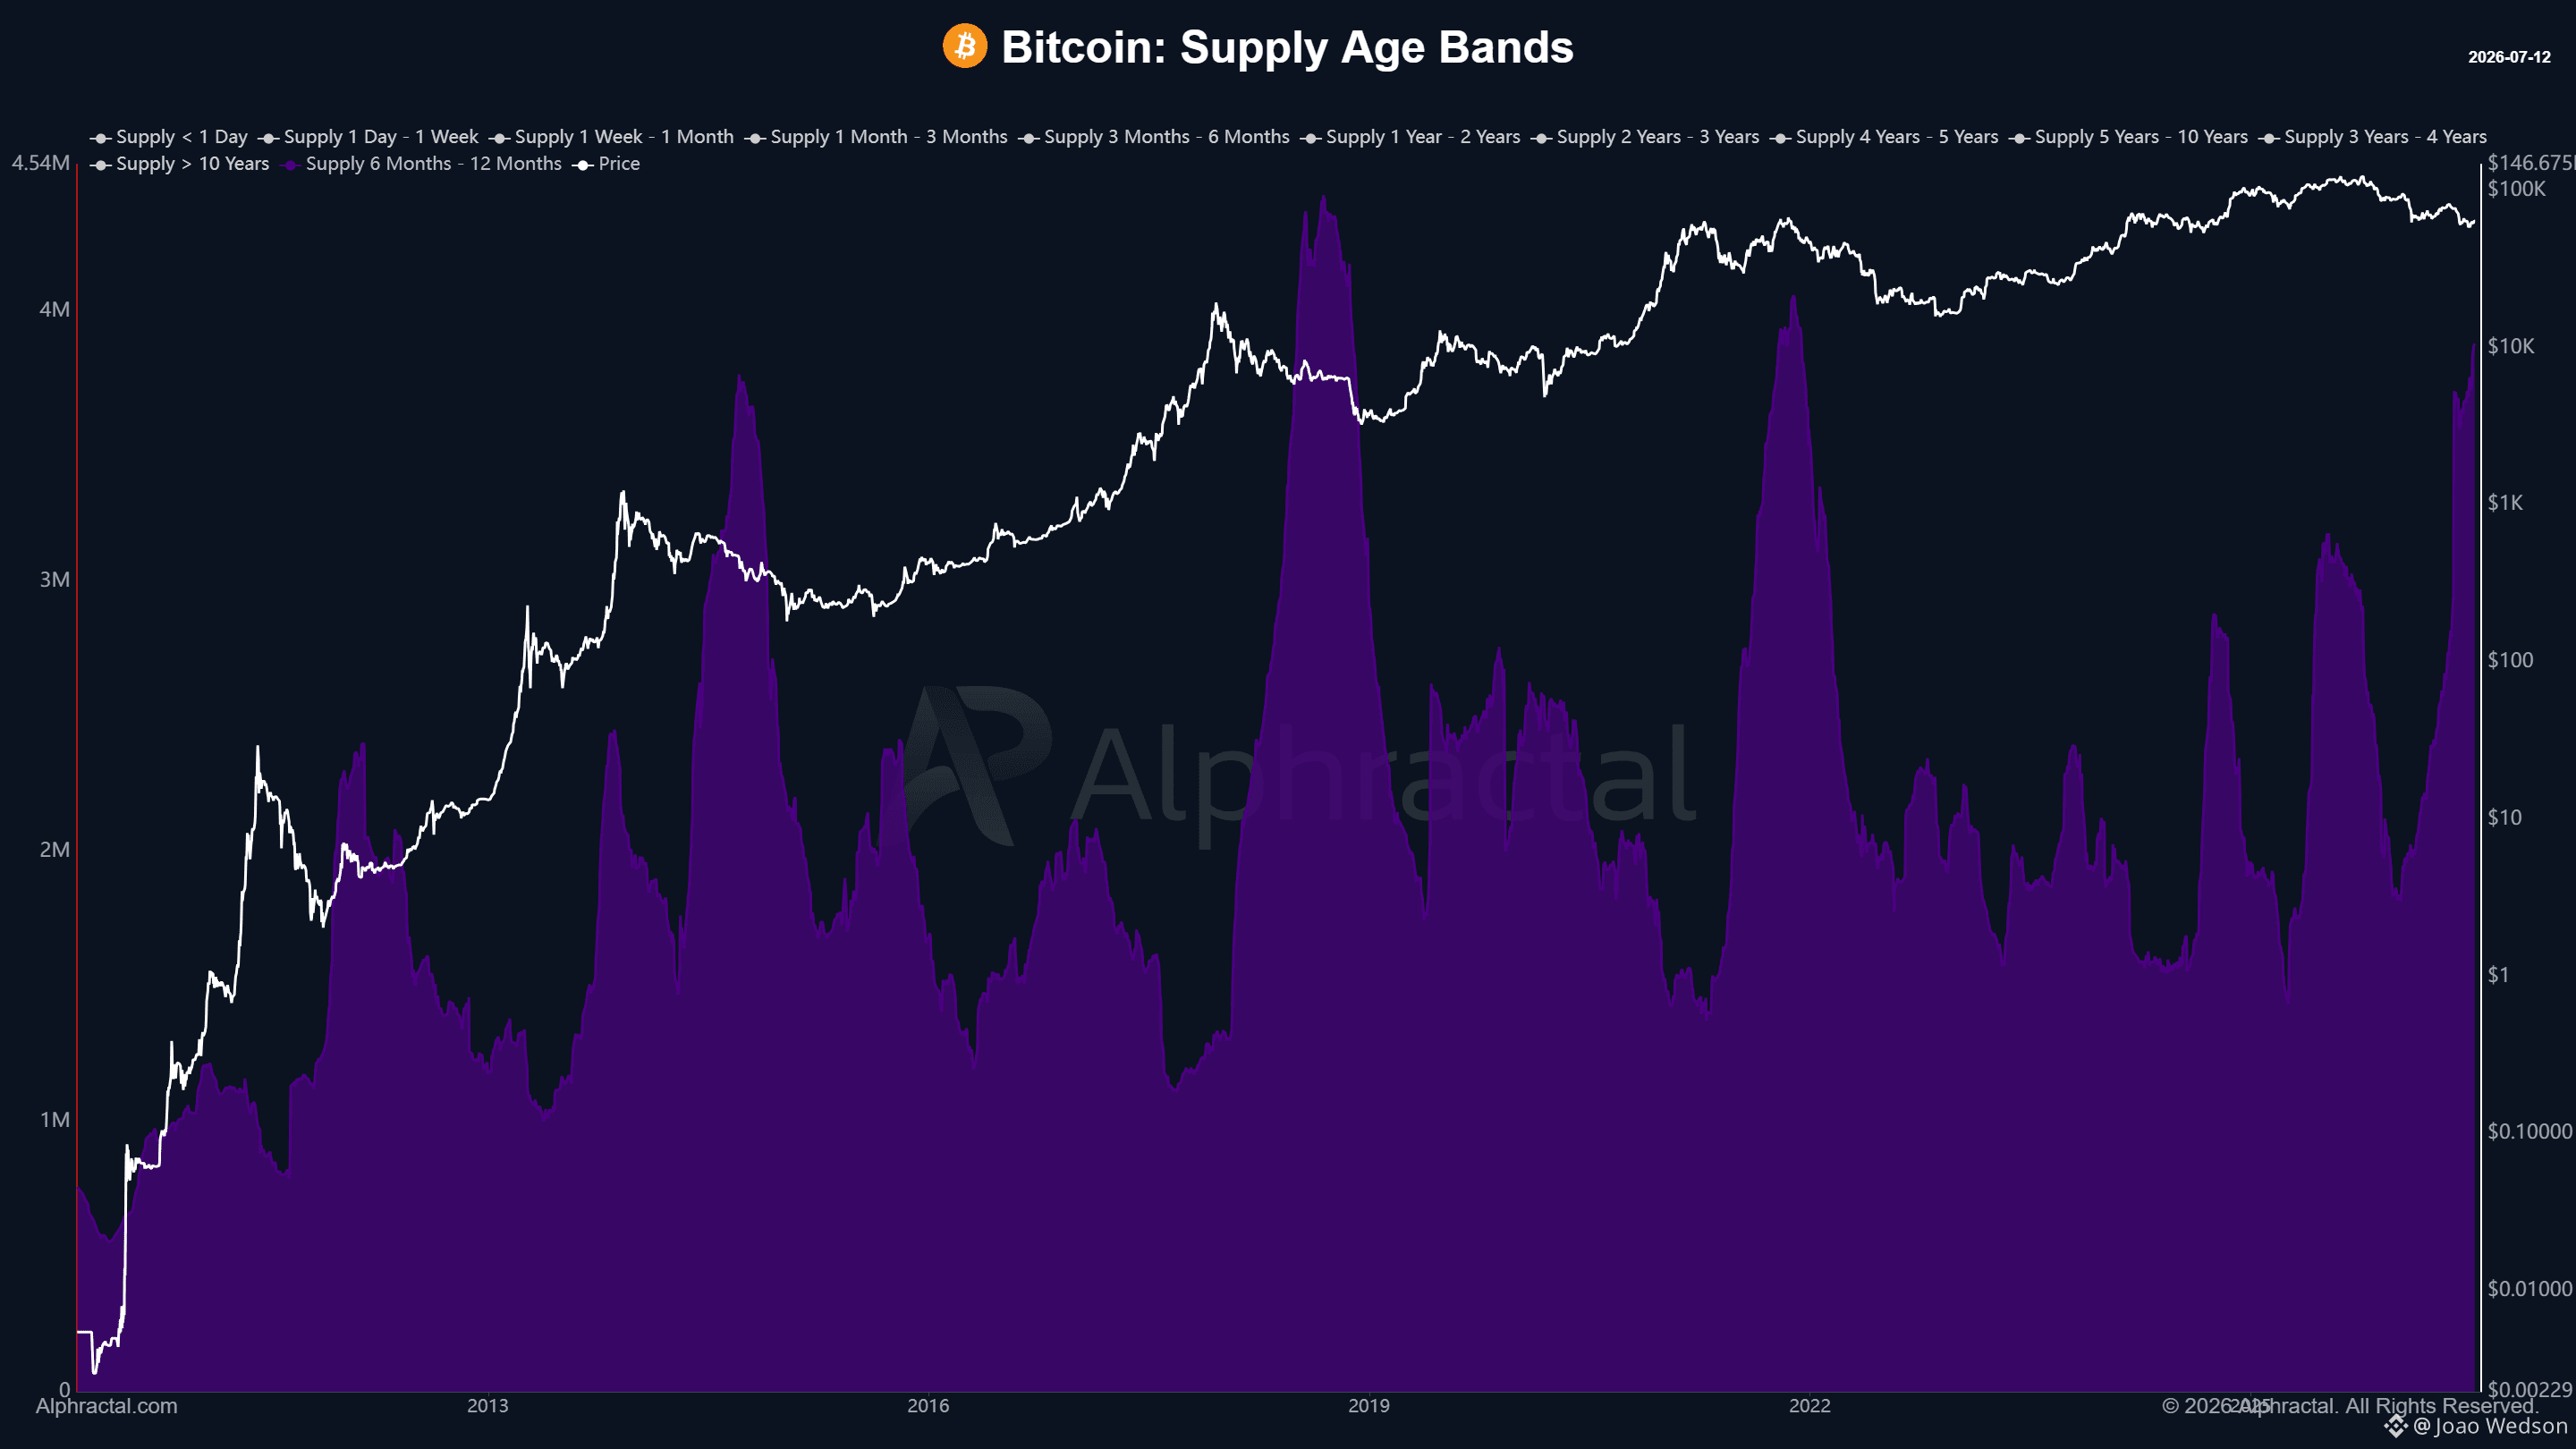
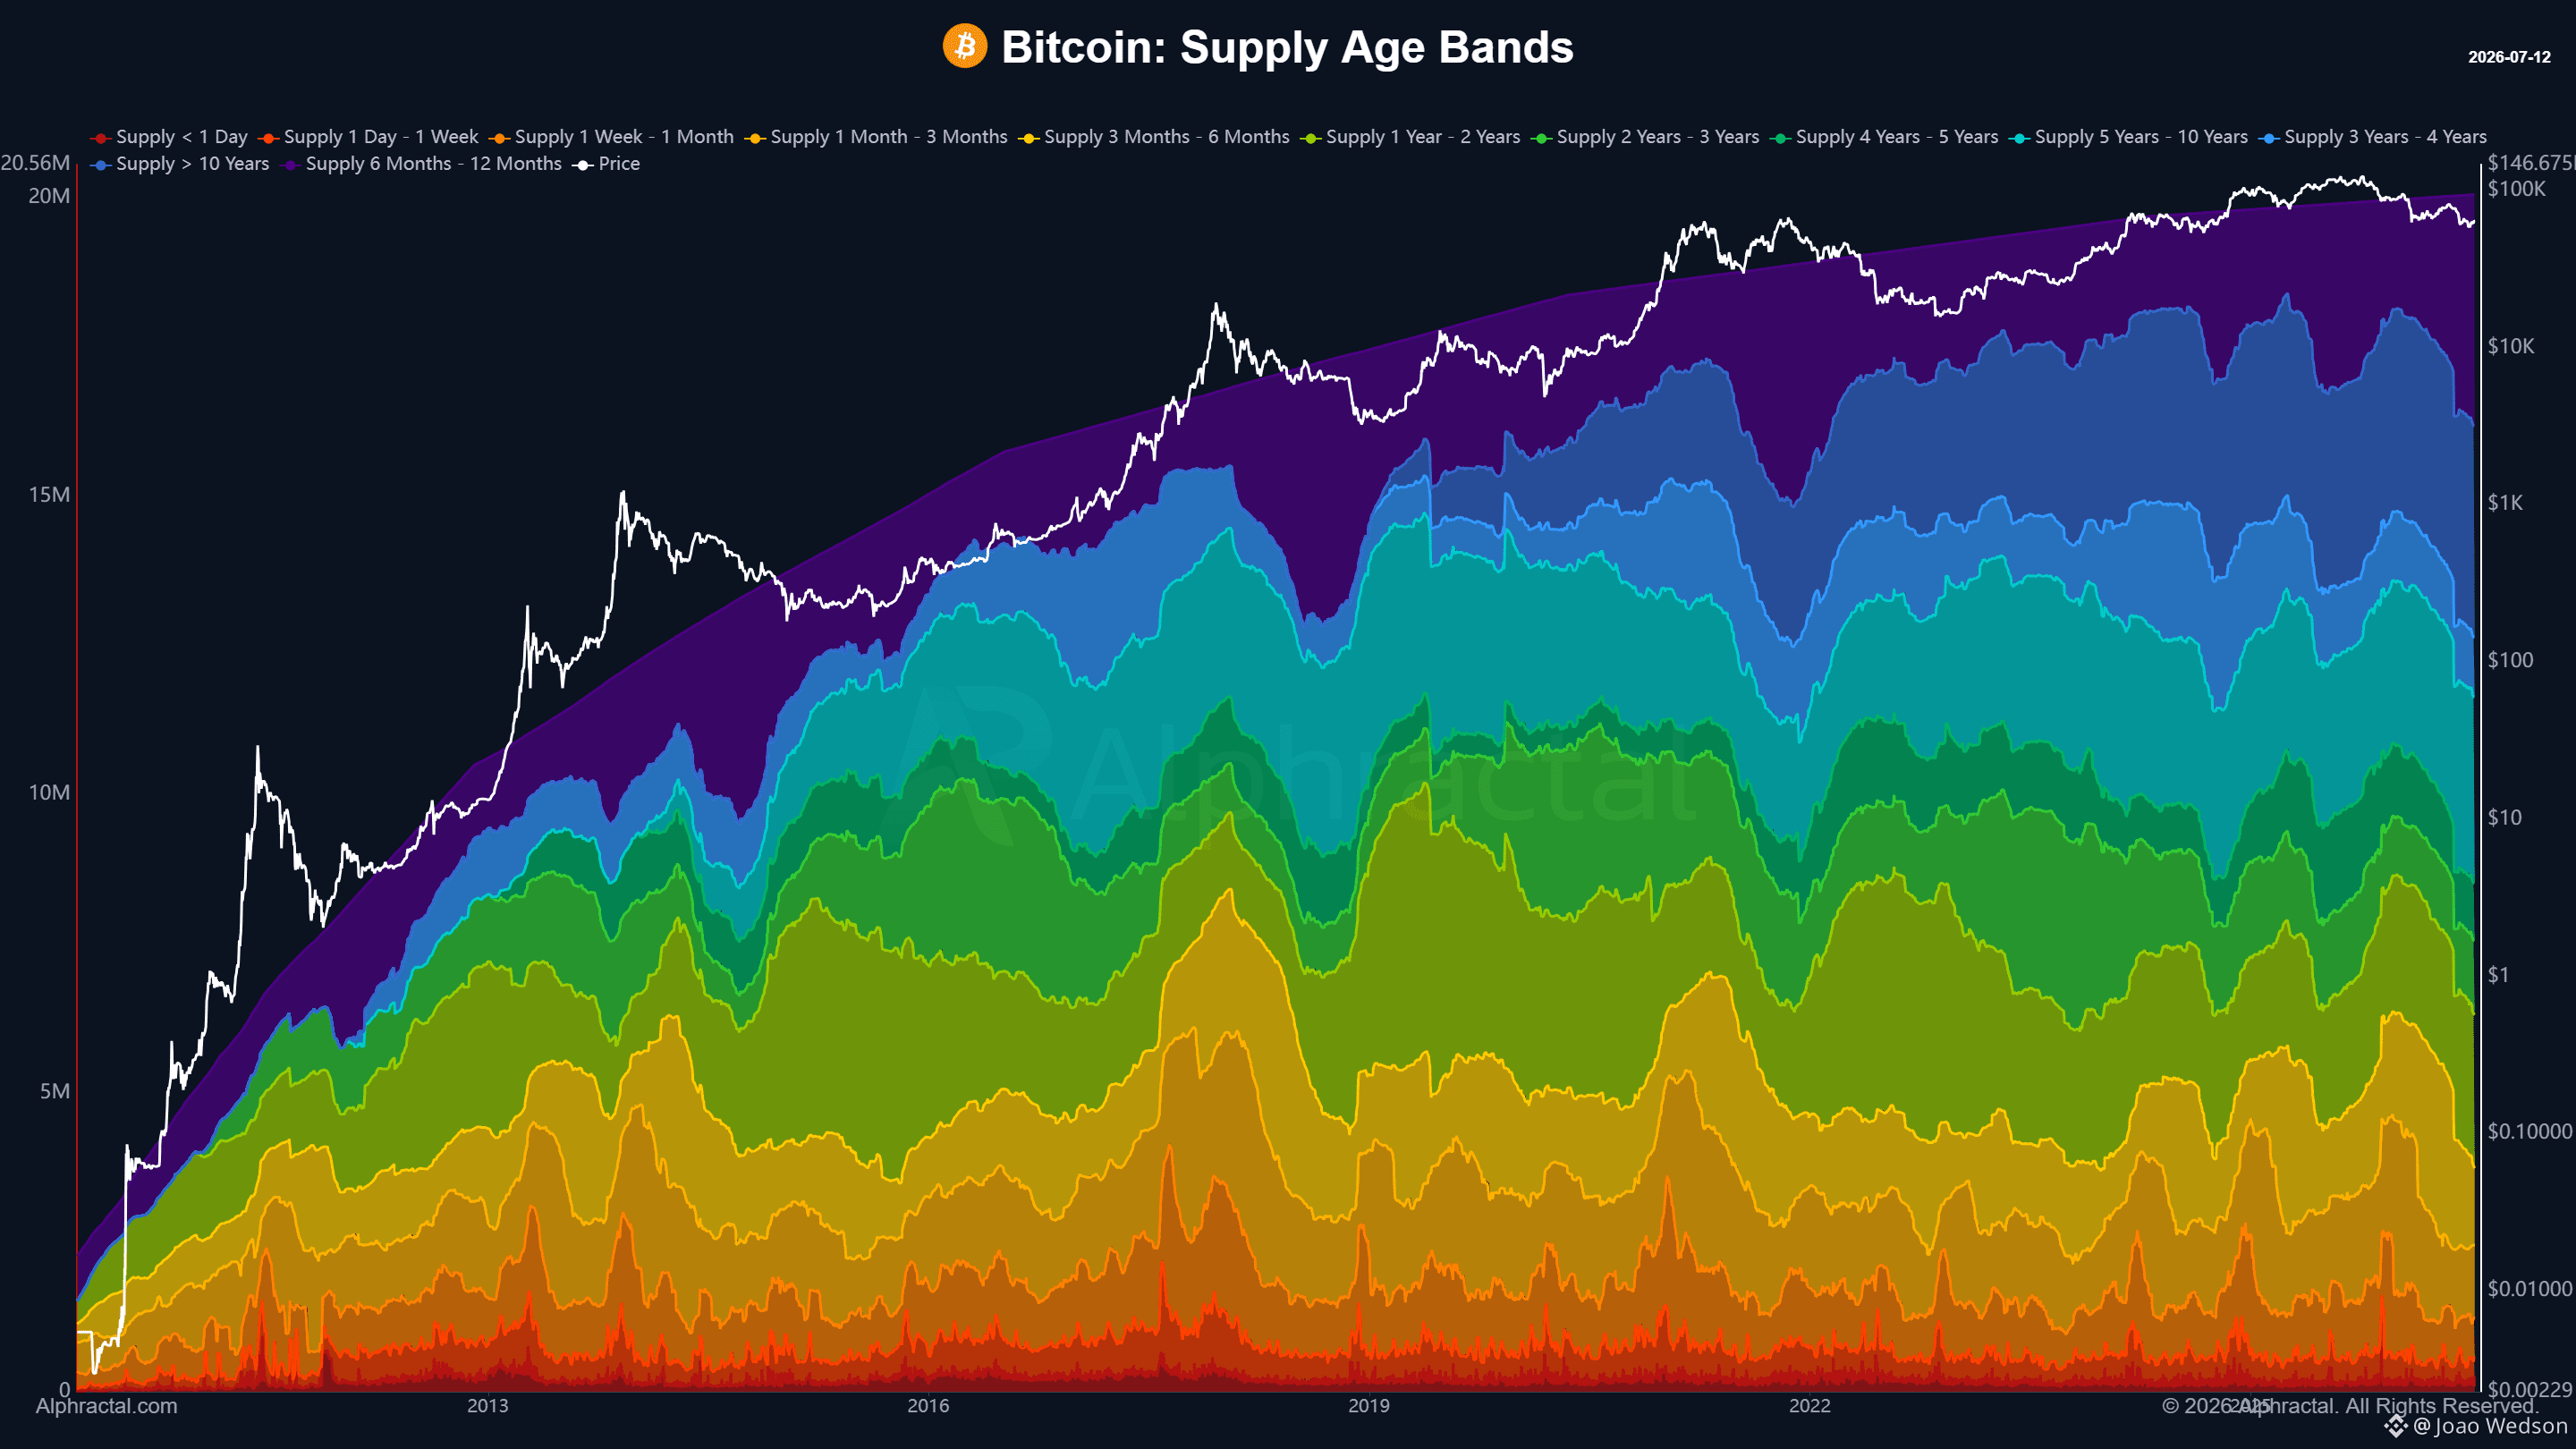
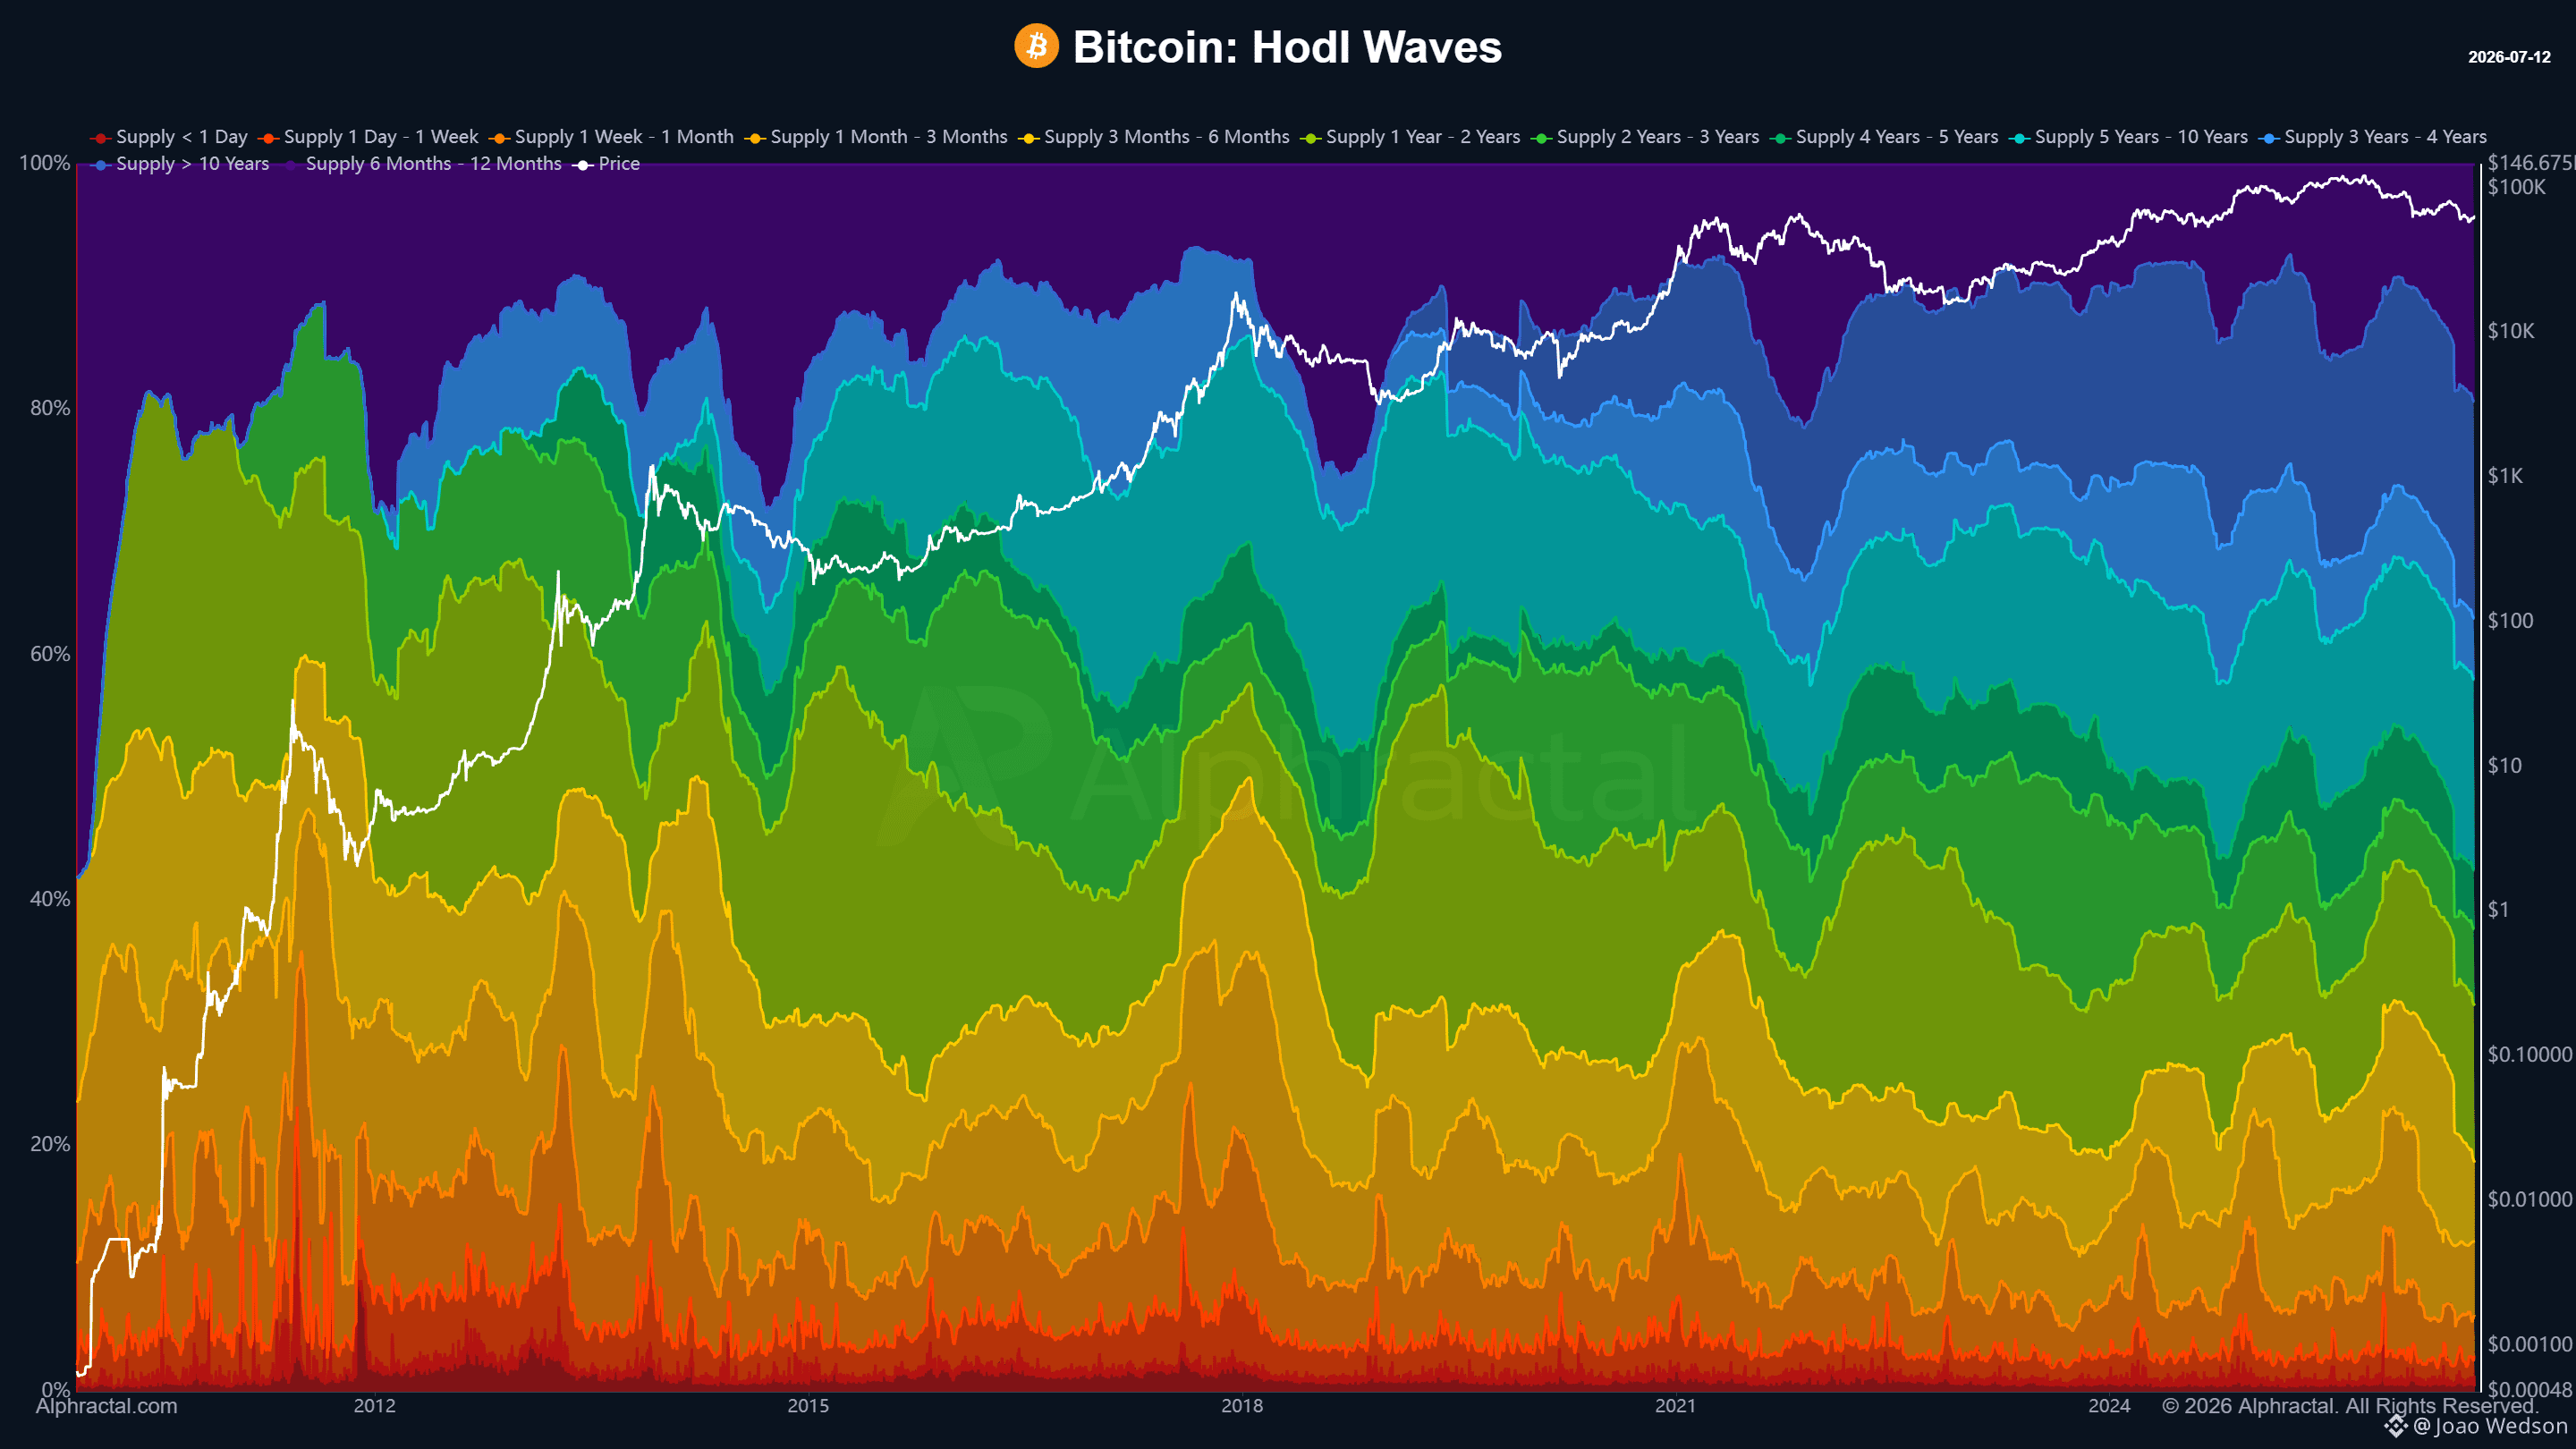
⚠️An important shift is taking place in Bitcoin’s supply structure. Nearly every Supply Age Band is declining, with one major exception: coins that have remained unmoved for 6 to 12 months. The HODL Waves chart makes this change even clearer. The share of this cohort in the total supply is rising rapidly, showing that a growing portion of the Bitcoin acquired over the past several months remains untouched. This suggests that many investors have endured volatility, corrections, and shifts in market sentiment without selling their positions. This is not just supply aging. It may be a sign of conviction. If these coins remain unmoved, they will gradually migrate into older age bands, strengthening Long-Term Holder Supply and reducing the amount of Bitcoin immediately available for trading. The market is seeing fewer young coins and a growing concentration in the 6 to 12-month band. The key question is: will these investors continue to hold, or will this cohort eventually become a future distribution zone? Get access to the market’s best metrics and signals, powered by a powerful Alpha AI. Start now at Alphractal. com. $BTC
⚠️An important shift is taking place in Bitcoin’s supply structure. Nearly every Supply Age Band is declining, with one major exception: coins that have remained unmoved for 6 to 12 months. The HODL Waves chart makes this change even clearer. The share of this cohort in the total supply is rising rapidly, showing that a growing portion of the Bitcoin acquired over the past several months remains untouched. This suggests that many investors have endured volatility, corrections, and shifts in market sentiment without selling their positions. This is not just supply aging. It may be a sign of conviction. If these coins remain unmoved, they will gradually migrate into older age bands, strengthening Long-Term Holder Supply and reducing the amount of Bitcoin immediately available for trading. The market is seeing fewer young coins and a growing concentration in the 6 to 12-month band. The key question is: will these investors continue to hold, or will this cohort eventually become a future distribution zone? Get access to the market’s best metrics and signals, powered by a powerful Alpha AI. Start now at Alphractal. com. $BTC
68
·
--
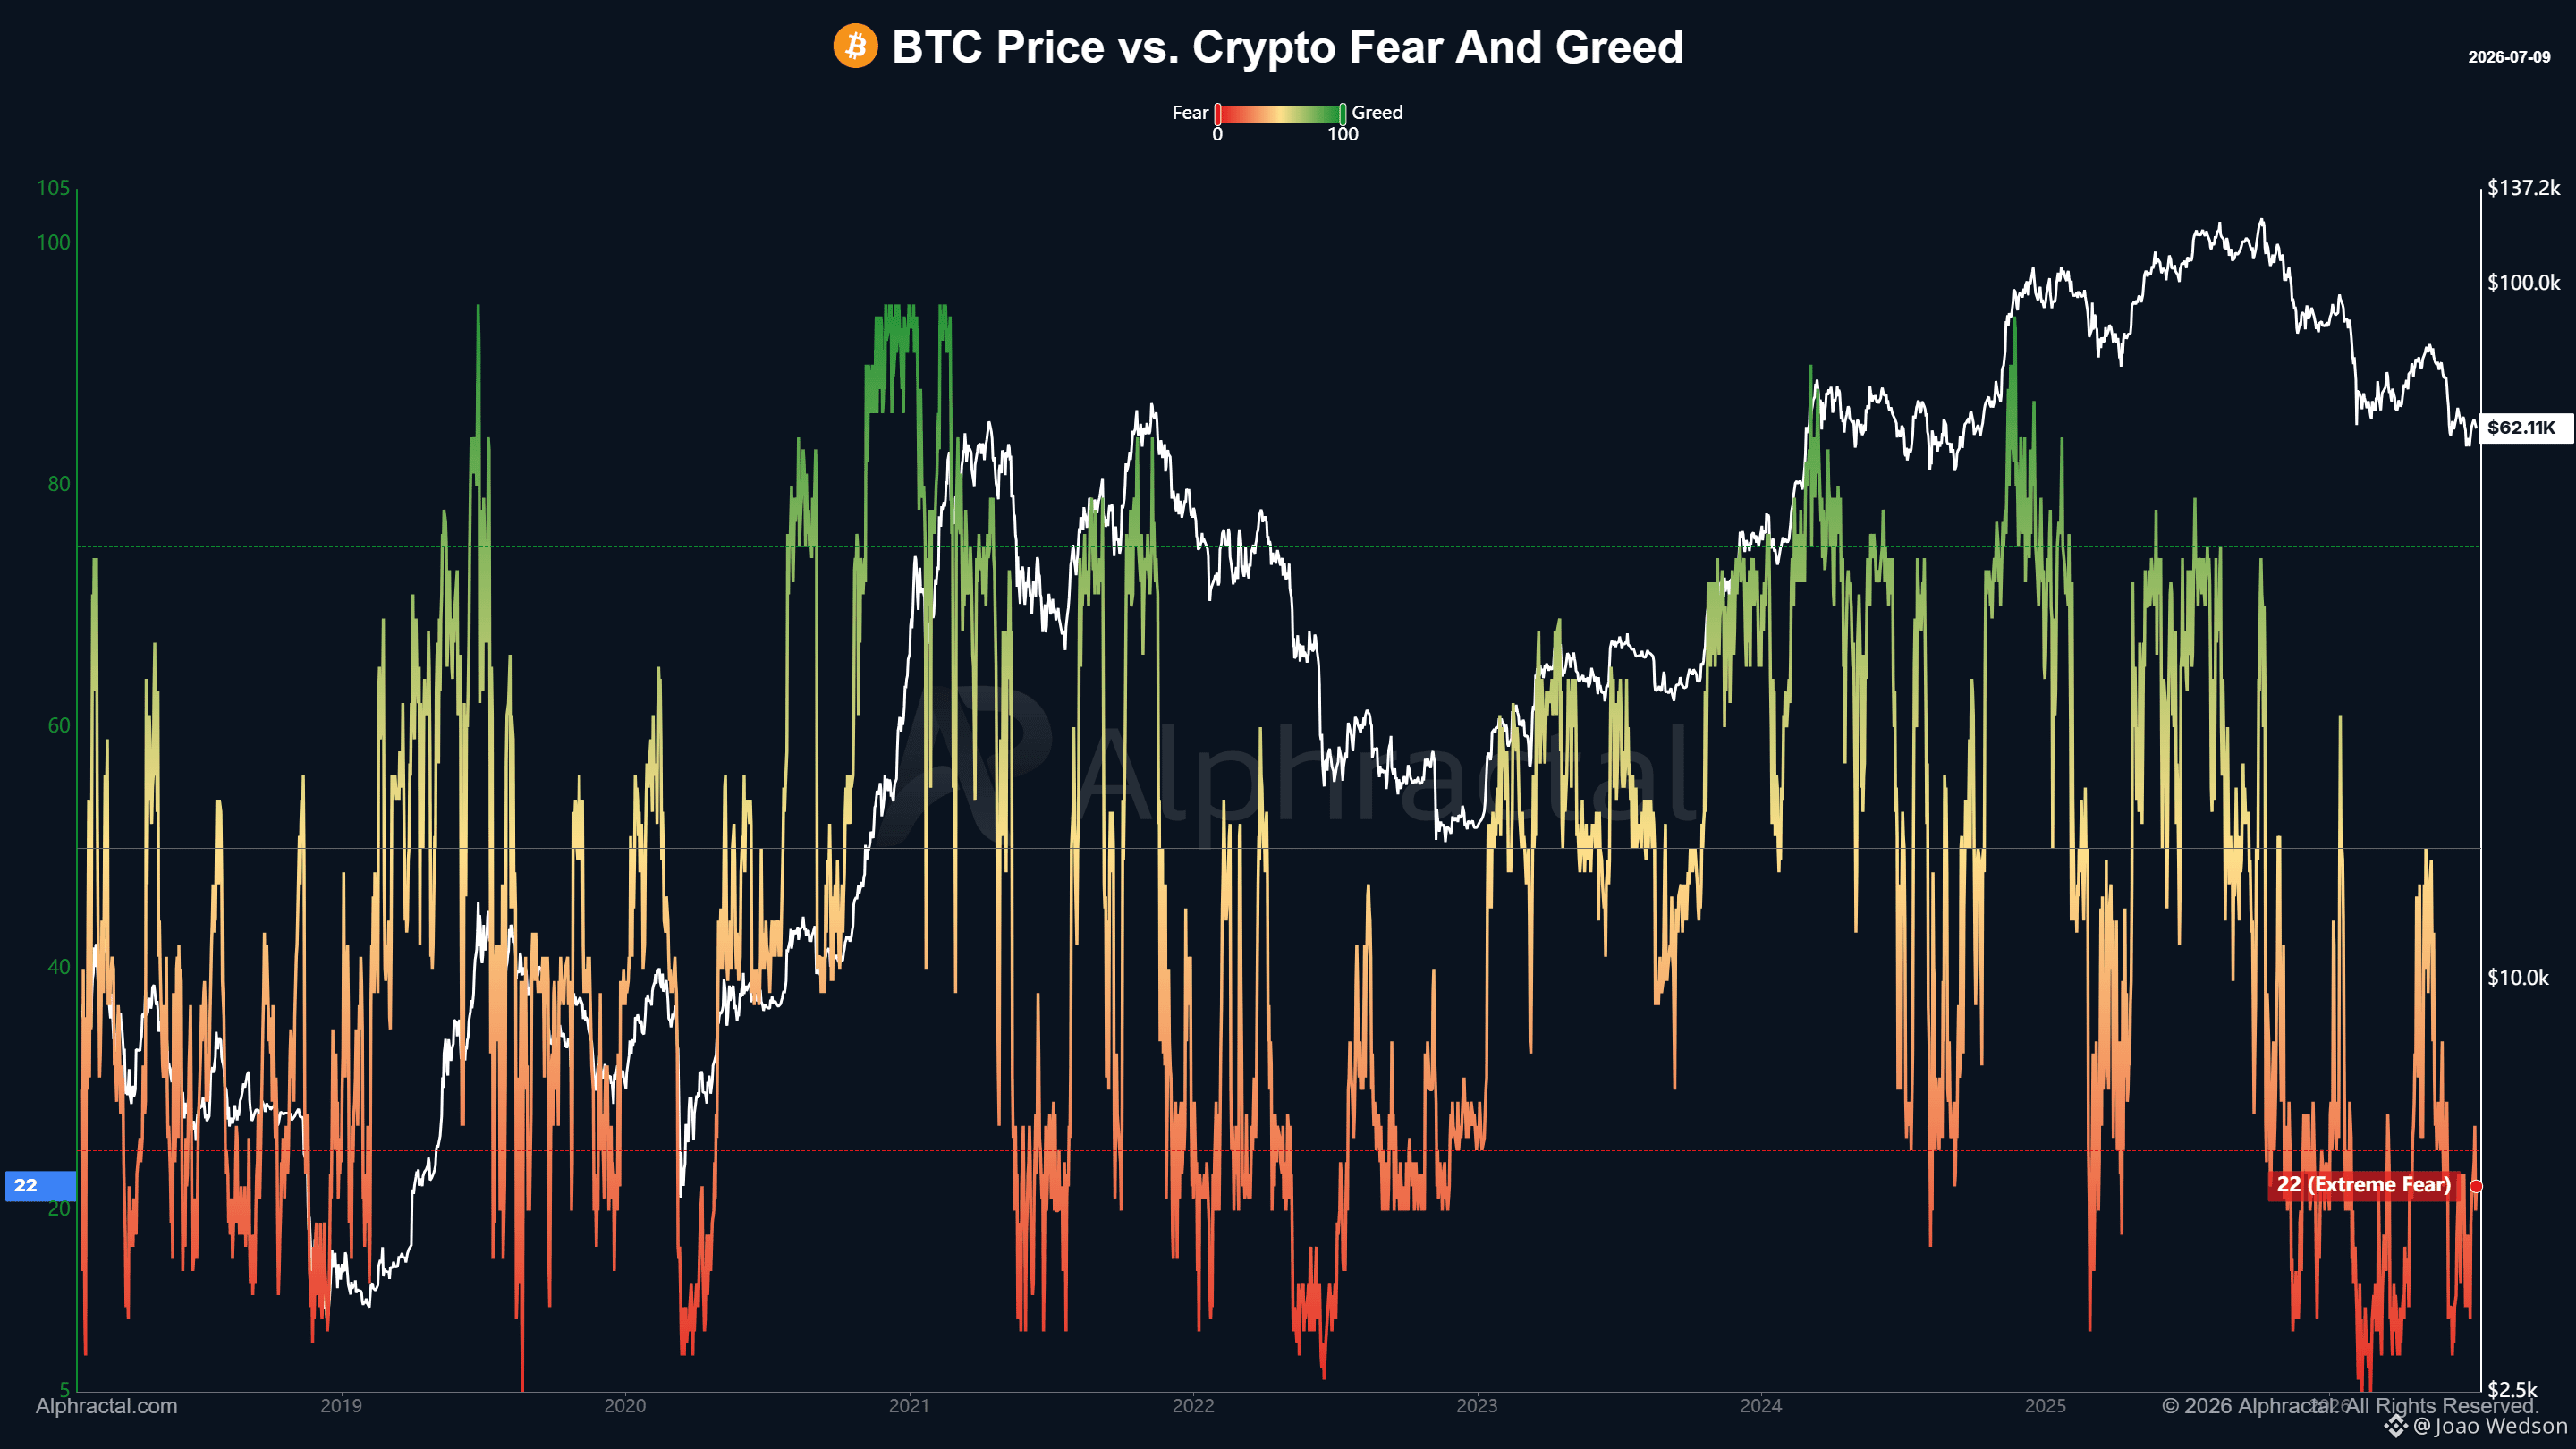
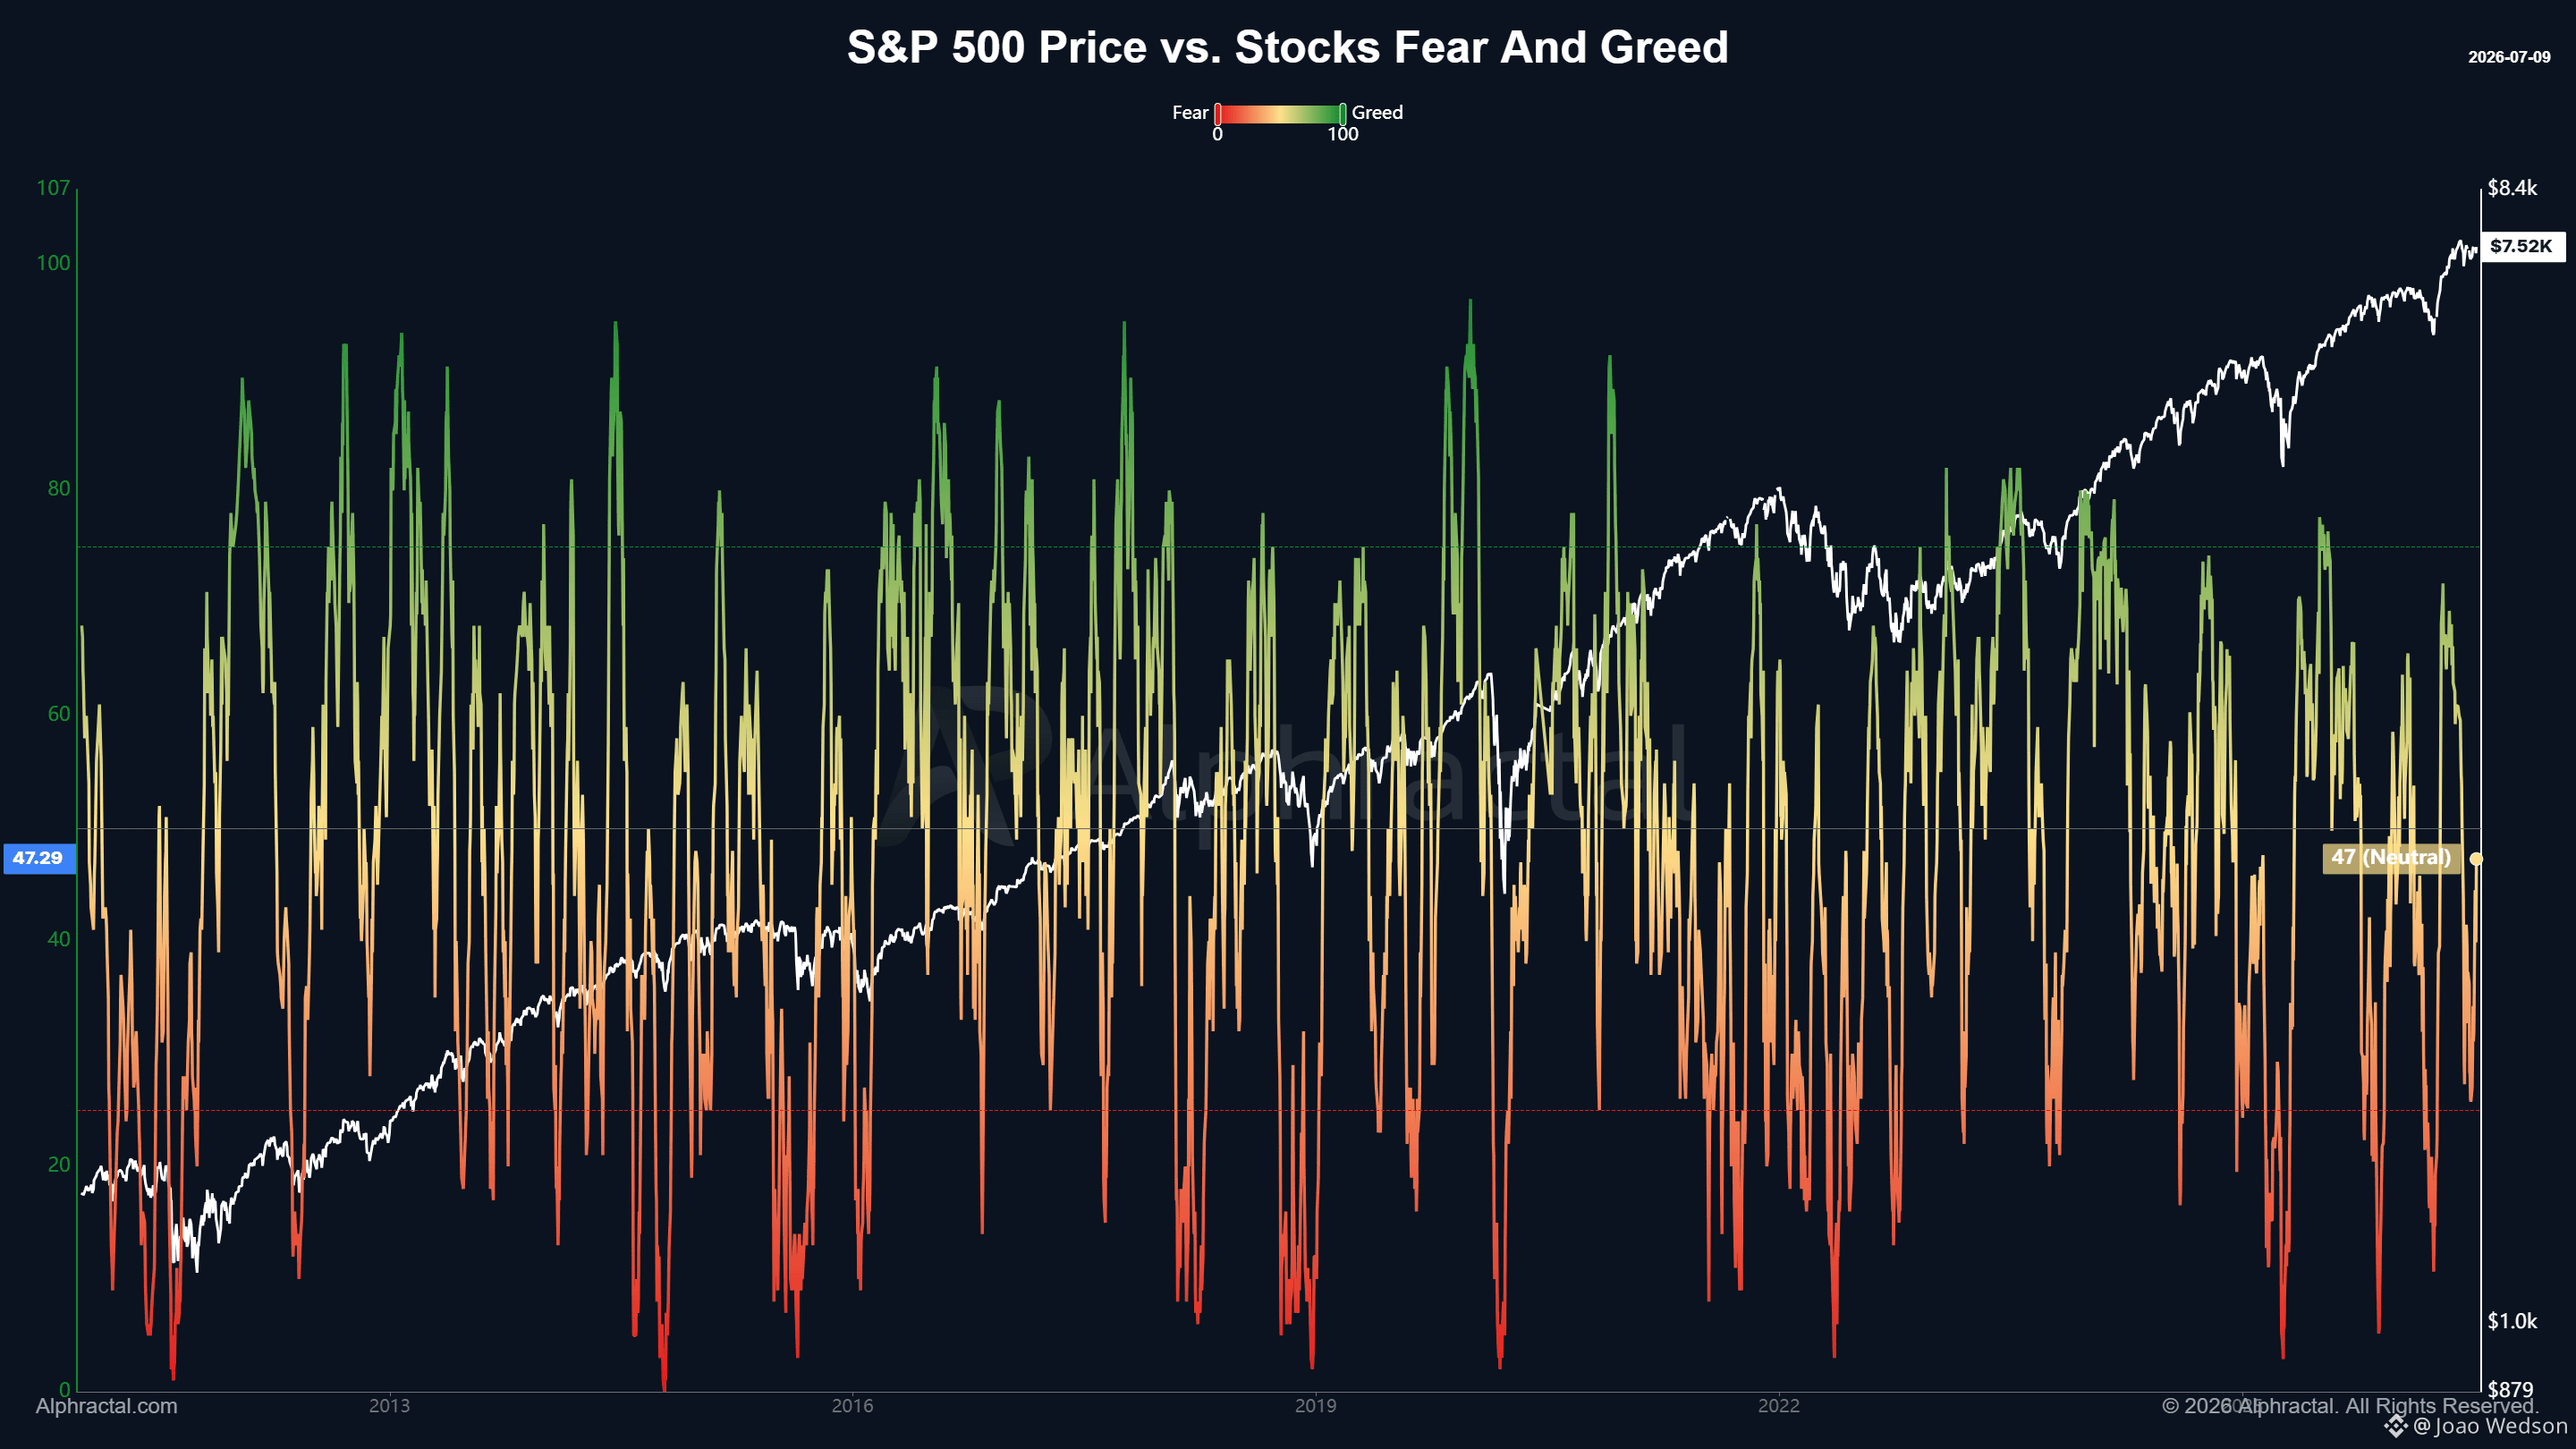
The Crypto Fear and Greed Index remains in the Extreme Fear zone, while the Stocks Fear and Greed Index is in the Neutral zone and slightly bullish.
The differences are clear, but it is noticeable that sentiment in the stock market is less extreme than in the crypto market.
Several factors explain this, such as market maturity, investor behavior, excessive narratives in crypto, and price volatility itself.
See more sentiment analysis at Alphractal
The Crypto Fear and Greed Index remains in the Extreme Fear zone, while the Stocks Fear and Greed Index is in the Neutral zone and slightly bullish.
The differences are clear, but it is noticeable that sentiment in the stock market is less extreme than in the crypto market.
Several factors explain this, such as market maturity, investor behavior, excessive narratives in crypto, and price volatility itself.
See more sentiment analysis at Alphractal
The differences are clear, but it is noticeable that sentiment in the stock market is less extreme than in the crypto market.
Several factors explain this, such as market maturity, investor behavior, excessive narratives in crypto, and price volatility itself.
See more sentiment analysis at Alphractal
61
Log in to explore more content
Join global crypto users on Binance Square
⚡️ Get latest and useful information about crypto.
💬 Trusted by the world’s largest crypto exchange.
👍 Discover real insights from verified creators.
Email / Phone number
Trending Topics
AppleDebutsFoldablePhone
35,165 views
746 Discussing
Apple just dropped the foldable iPhone — and the market is paying attention. This isn't just another product cycle; it's a new product category, a new CEO on stage, and a $1,999 price tag that pushes $AAPL further into ultra-premium territory. Foldables are the narrative, and Apple is now the headline.
#appledebutsfoldablephone #EUExtendsCentralContactPointToCASPs #US10YTreasuryYieldHitsHighestSinceNov2023 #BrentCrudeTops$100 #USTreasuryToBuyBackUpTo$6BLongDatedDebt
KimHotbae
·2 Likes
·2.8k views
TSMCAugustRevenueUp53.3%YoY
5,743 views
204 Discussing
IranSaysReadyToEscalateWarWithUS
9,189 views
223 Discussing