
Gas哥
97 Posts

Gas哥
 Square Verified
Frequent Trader
7.8 Years
47 Following
17 Followers
11 Liked
Posts
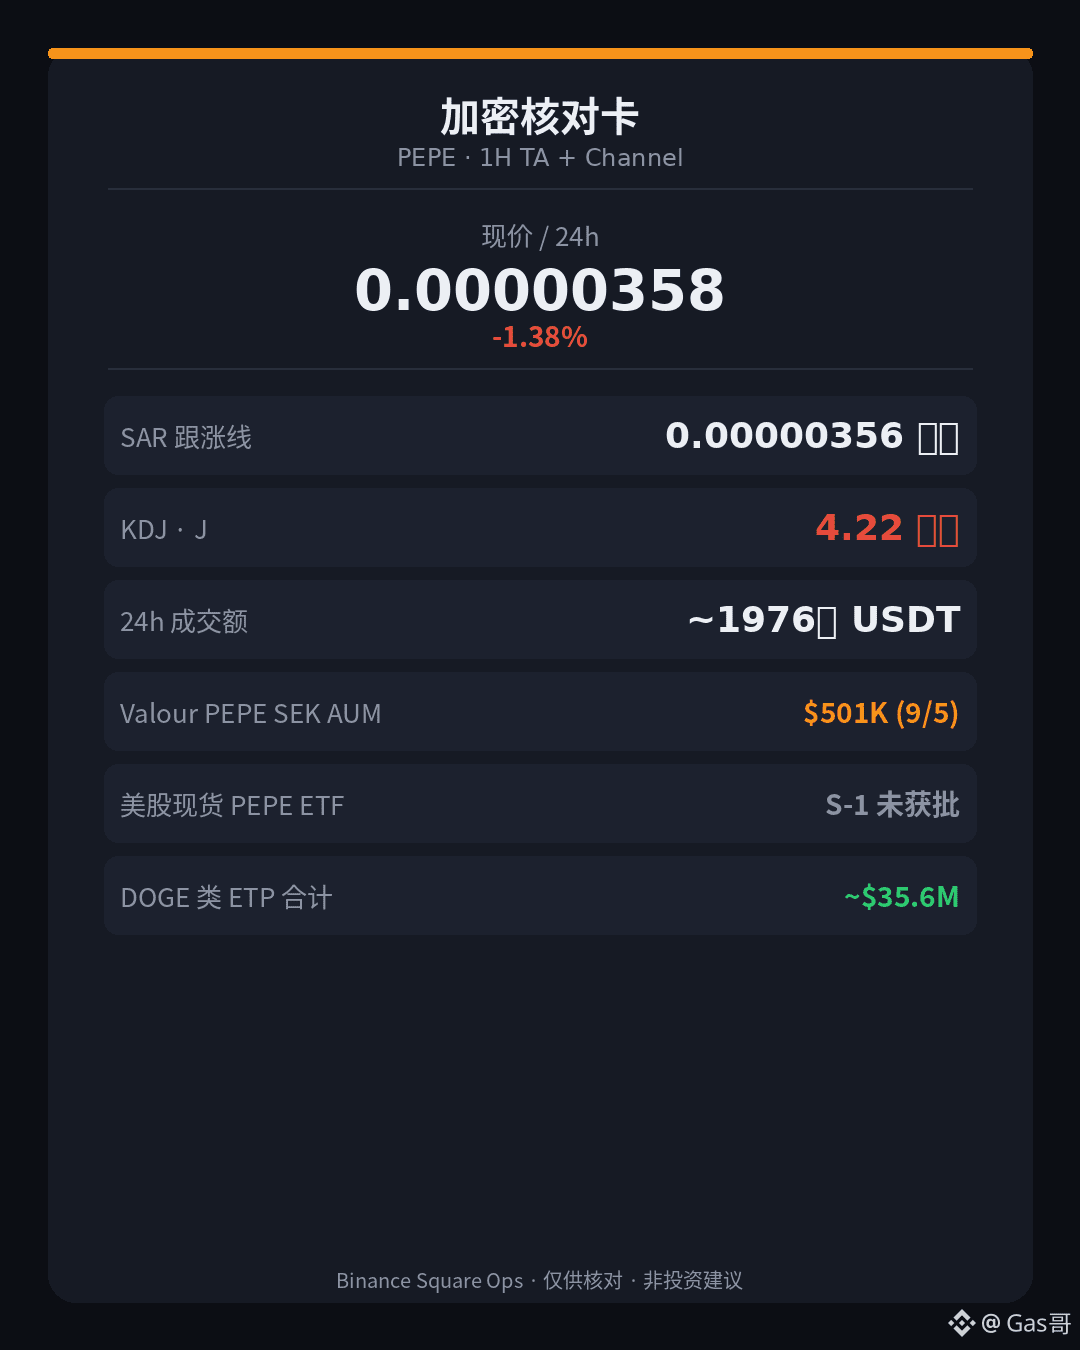
The U.S. spot PEPE ETF is still waiting in the SEC queue, while the European channel’s AUM is only about $500,000 — the narrative is much bigger than the positioning.
First, look at the headline. $PEPE is currently at 0.00000358, down about 1.38% in the past 24 hours, with trading volume of about 19.76 million USDT. The follow-trend line (SAR) is around 0.00000356, and the price is still just barely holding above it — short-term strength/weakness reference has not completely turned bearish, but it is almost grinding right on the line. The momentum J value is 4.22 (K 33.18 / D 47.66), already extremely cold, like the accelerator has been let off completely. 24-hour high 0.00000367, low 0.00000353; the high over the past two days is around 0.00000371, so it has pulled back quite a bit from above.
Comparing two other tokens in the same sector: $DOGE is currently at 0.08955, down about 1.22% over 24 hours, with even stronger trading volume (about 86.63 million USDT), and it is still above the follow-trend line (SAR around 0.08843), but its J value has dropped to -1.94, showing a stronger oversold feel. $WIF is currently at 0.2153, up about 0.61% over 24 hours, standing above the line (SAR around 0.2116), and its J value of 3.29 is also quite cold. The structure of these three meme tokens is similar: the line has not broken yet, but the momentum has already cooled.
On the fund-flow side, according to public data from etfllama: as of around September 5, the AUM of PEPE-related ETPs such as Europe’s Valour Pepe SEK was about $501,000, with net inflows of about $888,000 over the past 7 days and about $1.24 million over the past 30 days — still a "micro-channel" in scale. In the U.S., Canary Capital’s spot PEPE ETF S-1 is still under SEC review (submitted on April 8, 2026), and has not been approved, nor does it have official product AUM. By comparison, DOGE-like ETFs/ETPs in the same scope total about $35.56 million — DOGE at least already has channel depth, while PEPE is still more of an "application narrative" than "institutional positioning already in place."
Final blank space: the numbers are here; make your own judgment.
First, look at the headline. $PEPE is currently at 0.00000358, down about 1.38% in the past 24 hours, with trading volume of about 19.76 million USDT. The follow-trend line (SAR) is around 0.00000356, and the price is still just barely holding above it — short-term strength/weakness reference has not completely turned bearish, but it is almost grinding right on the line. The momentum J value is 4.22 (K 33.18 / D 47.66), already extremely cold, like the accelerator has been let off completely. 24-hour high 0.00000367, low 0.00000353; the high over the past two days is around 0.00000371, so it has pulled back quite a bit from above.
Comparing two other tokens in the same sector: $DOGE is currently at 0.08955, down about 1.22% over 24 hours, with even stronger trading volume (about 86.63 million USDT), and it is still above the follow-trend line (SAR around 0.08843), but its J value has dropped to -1.94, showing a stronger oversold feel. $WIF is currently at 0.2153, up about 0.61% over 24 hours, standing above the line (SAR around 0.2116), and its J value of 3.29 is also quite cold. The structure of these three meme tokens is similar: the line has not broken yet, but the momentum has already cooled.
On the fund-flow side, according to public data from etfllama: as of around September 5, the AUM of PEPE-related ETPs such as Europe’s Valour Pepe SEK was about $501,000, with net inflows of about $888,000 over the past 7 days and about $1.24 million over the past 30 days — still a "micro-channel" in scale. In the U.S., Canary Capital’s spot PEPE ETF S-1 is still under SEC review (submitted on April 8, 2026), and has not been approved, nor does it have official product AUM. By comparison, DOGE-like ETFs/ETPs in the same scope total about $35.56 million — DOGE at least already has channel depth, while PEPE is still more of an "application narrative" than "institutional positioning already in place."
Final blank space: the numbers are here; make your own judgment.
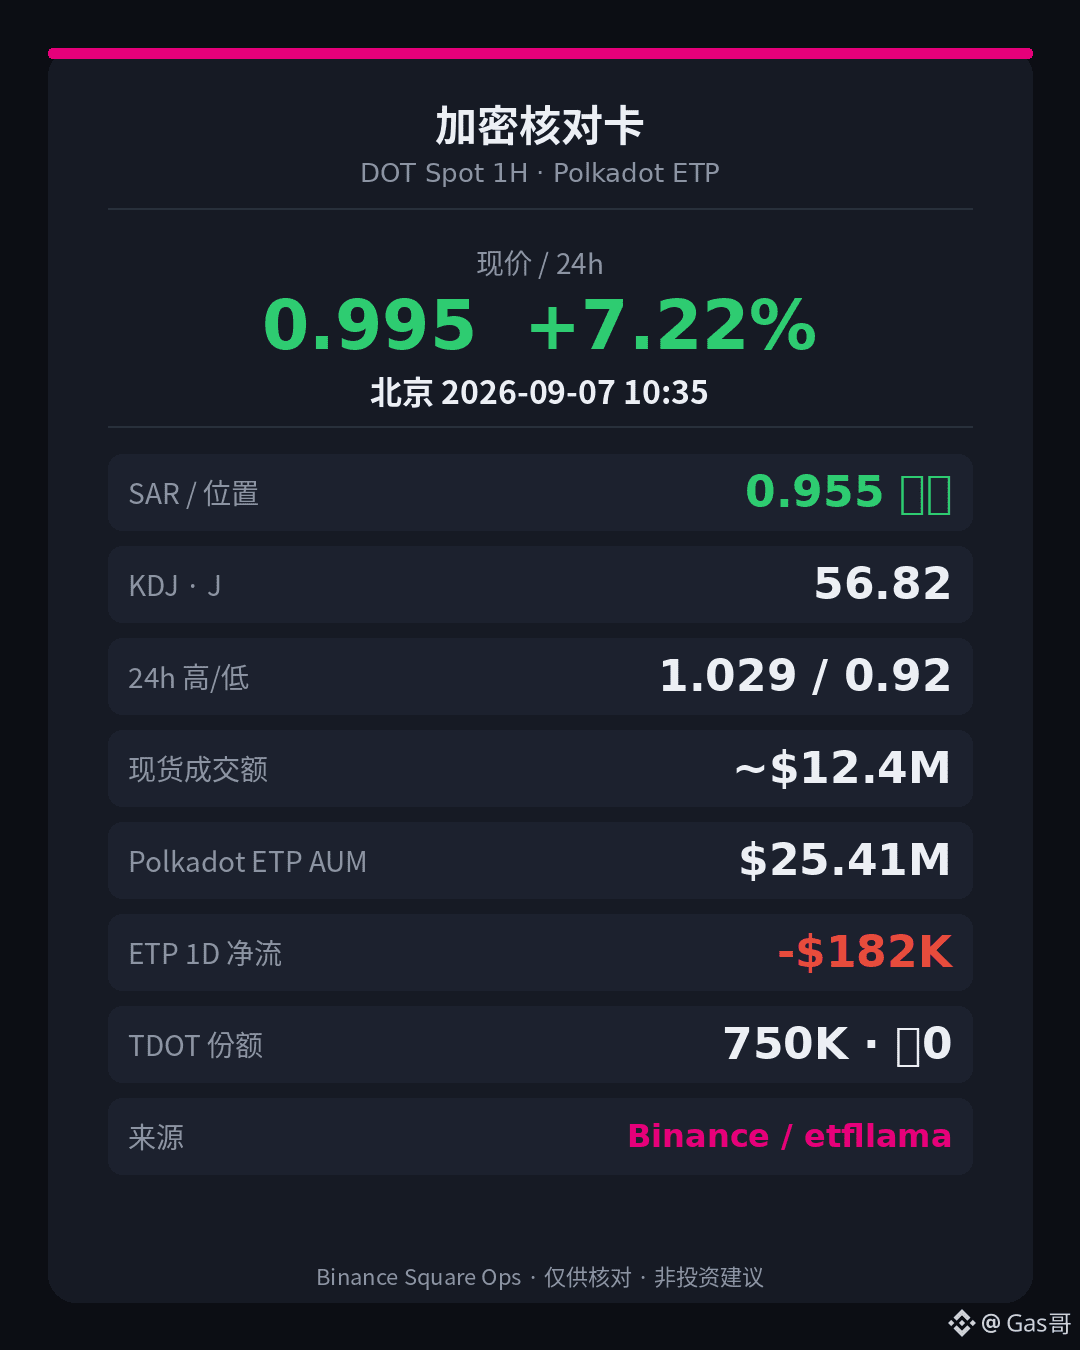
DOT spot rose more than 7% in a day, but the momentum J value dropped from the 70s this morning to the 50s — the gains are still being refreshed, but the accelerator has already eased off.
$DOT is currently priced at 0.995, up about 7.22% over 24 hours, with trading volume around 12.4 million USDT. The trend-following line (SAR) is near 0.955, and the price is still about 0.04 above it — short-term strength still leans bullish. The momentum J value is 56.82 (K 62.92 / D 65.97), clearly cooler than the overheated state from an hour ago; it looks more like a pullback after stepping on the gas than a continued surge. The 24-hour high reached 1.029, and the low was 0.92; it just touched the area around 1.029 overhead, but has not held above it.
On the capital side, according to etfllama (as of around 9/5): global Polkadot-related ETFs/ETPs have total AUM of about $25.41 million; net outflows over the past day were about $182,000, while the past 7 days still show a cumulative net inflow of about $174,000. In the U.S. channel, TDOT (21Shares) has AUM of about $8.08 million, with shares locked at 750,000; net inflows over 1 day / 7 days / 30 days are all zero — AUM is moving with the coin price, not because new money is coming in. Looking back to the March seed-scale level of about $11 million, the size still has not returned to the starting point.
Both rises and falls are normal; the key is not to read one move as a trend reversal.
$DOT is currently priced at 0.995, up about 7.22% over 24 hours, with trading volume around 12.4 million USDT. The trend-following line (SAR) is near 0.955, and the price is still about 0.04 above it — short-term strength still leans bullish. The momentum J value is 56.82 (K 62.92 / D 65.97), clearly cooler than the overheated state from an hour ago; it looks more like a pullback after stepping on the gas than a continued surge. The 24-hour high reached 1.029, and the low was 0.92; it just touched the area around 1.029 overhead, but has not held above it.
On the capital side, according to etfllama (as of around 9/5): global Polkadot-related ETFs/ETPs have total AUM of about $25.41 million; net outflows over the past day were about $182,000, while the past 7 days still show a cumulative net inflow of about $174,000. In the U.S. channel, TDOT (21Shares) has AUM of about $8.08 million, with shares locked at 750,000; net inflows over 1 day / 7 days / 30 days are all zero — AUM is moving with the coin price, not because new money is coming in. Looking back to the March seed-scale level of about $11 million, the size still has not returned to the starting point.
Both rises and falls are normal; the key is not to read one move as a trend reversal.
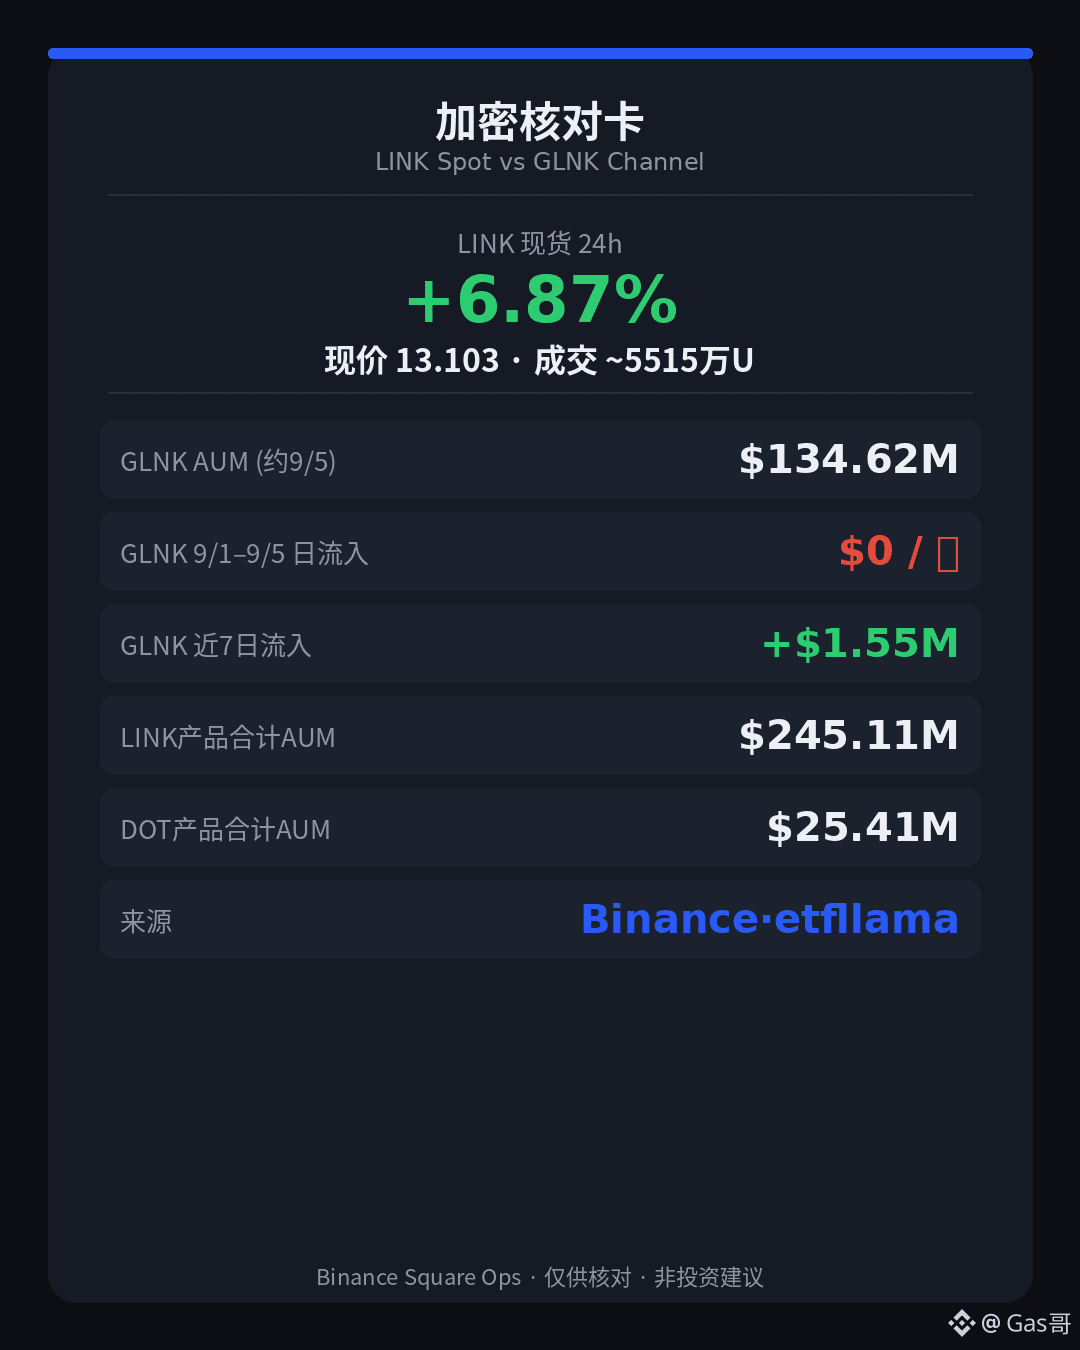
The spot rally is making a lot of noise, but the U.S. market channel has seen almost no new money this week — for this LINK move, don’t read a green candle as institutions aggressively loading up.
First, the main chart. $LINK is currently at 13.103, up about 6.87% over 24 hours, with turnover of roughly 55.15 million USDT. The trend-following line (SAR) is around 12.28, and price is about 0.82 above it — short-term strength still leans bullish. The momentum J value is 81.74 (K 80.03 / D 79.17), overheated, but slightly cooler than the previous round when it was pressing into the 90s. The 24-hour high is 13.356 and the low is 12.073; the recent two-day high is about 13.356, so the ceiling is right in front of us.
Two nearby comparisons: $DOT is currently 0.994, also up about 7.34% over 24 hours, sitting above the SAR line (around 0.952), with J at 74.44, still hot, and volume around 12.14 million — same direction of gains, but with a thinner market. $BTC is around 79942, nearly flat over 24 hours (-0.05%); although it is still above SAR (around 79517), its J value has fallen to about 42, so momentum has cooled first. Altcoins are surging while the broader market is resting — not the same story.
On the资金 side, according to publicly available ETF tracking data (etfllama, as of around Sept. 5): the Grayscale Chainlink Trust ETF (GLNK) has AUM of about $134.6 million, with zero daily net inflows from Sept. 1 to Sept. 5; net inflows over the past 7 days were about $1.55 million (mainly from the Aug. 29 entry), and over the past 30 days about +$12.19 million. Total AUM across global Chainlink-related ETFs/ETPs is roughly $245 million; using the same measure, Polkadot-related products total about $25.41 million — nearly an order of magnitude smaller. There is channel depth, but that does not mean this week’s spot rally is being carried by the channel.
Let time confirm the next candle; that is more useful than guessing the top.
First, the main chart. $LINK is currently at 13.103, up about 6.87% over 24 hours, with turnover of roughly 55.15 million USDT. The trend-following line (SAR) is around 12.28, and price is about 0.82 above it — short-term strength still leans bullish. The momentum J value is 81.74 (K 80.03 / D 79.17), overheated, but slightly cooler than the previous round when it was pressing into the 90s. The 24-hour high is 13.356 and the low is 12.073; the recent two-day high is about 13.356, so the ceiling is right in front of us.
Two nearby comparisons: $DOT is currently 0.994, also up about 7.34% over 24 hours, sitting above the SAR line (around 0.952), with J at 74.44, still hot, and volume around 12.14 million — same direction of gains, but with a thinner market. $BTC is around 79942, nearly flat over 24 hours (-0.05%); although it is still above SAR (around 79517), its J value has fallen to about 42, so momentum has cooled first. Altcoins are surging while the broader market is resting — not the same story.
On the资金 side, according to publicly available ETF tracking data (etfllama, as of around Sept. 5): the Grayscale Chainlink Trust ETF (GLNK) has AUM of about $134.6 million, with zero daily net inflows from Sept. 1 to Sept. 5; net inflows over the past 7 days were about $1.55 million (mainly from the Aug. 29 entry), and over the past 30 days about +$12.19 million. Total AUM across global Chainlink-related ETFs/ETPs is roughly $245 million; using the same measure, Polkadot-related products total about $25.41 million — nearly an order of magnitude smaller. There is channel depth, but that does not mean this week’s spot rally is being carried by the channel.
Let time confirm the next candle; that is more useful than guessing the top.
The rise looks lively, but the momentum has already cooled — SOL +1.8%, while J has dropped to 22.
$SOL is now priced at 105.55, up 1.8% in 24h. The follow-the-trend line (SAR) is at 106.96, and the price is still about 1.41 below it — the short-term strength reference has not turned bullish, so the setup remains relatively weak. The momentum indicator J is 22.65 (K41.83/D51.42), which is subdued, as if the accelerator has been released quite a bit. The 24h high is 107.36 and the low is 102.94; the recent two-day high is also around 107.36, so the overhead resistance is right there.
First figure out whether this is a rebound or a repair, then decide whether there’s any reason to get excited.
$SOL is now priced at 105.55, up 1.8% in 24h. The follow-the-trend line (SAR) is at 106.96, and the price is still about 1.41 below it — the short-term strength reference has not turned bullish, so the setup remains relatively weak. The momentum indicator J is 22.65 (K41.83/D51.42), which is subdued, as if the accelerator has been released quite a bit. The 24h high is 107.36 and the low is 102.94; the recent two-day high is also around 107.36, so the overhead resistance is right there.
First figure out whether this is a rebound or a repair, then decide whether there’s any reason to get excited.
It’s not that it hasn’t risen, it’s that it hasn’t reclaimed the level — ETH +0.87%, with the follow-up rise line still overhead.
$ETH is currently at 2497.99, up 0.87% over 24h. The follow-up rise line (SAR) is at 2509.84, and the price has already fallen to about 11.85 below it — short-term support has been broken through, and this bit of green hasn’t recovered the position yet. The momentum indicator J is 85.08 (K62.79/D51.65), showing extreme heat, like pressing the accelerator too hard. 24h high 2523.97, low 2460.92; the high over the past two days is about 2523.97, and the pressure overhead is right in front of you.
The gain you see and the sustainability the market is willing to offer are often not the same thing.
$ETH is currently at 2497.99, up 0.87% over 24h. The follow-up rise line (SAR) is at 2509.84, and the price has already fallen to about 11.85 below it — short-term support has been broken through, and this bit of green hasn’t recovered the position yet. The momentum indicator J is 85.08 (K62.79/D51.65), showing extreme heat, like pressing the accelerator too hard. 24h high 2523.97, low 2460.92; the high over the past two days is about 2523.97, and the pressure overhead is right in front of you.
The gain you see and the sustainability the market is willing to offer are often not the same thing.
The gap from the trailing line is more than 200, yet it has only fallen 0.3% in 24h—BTC is weak in position, not in the size of the drop.
$BTC current price 79747.60, down 0.3% in 24h. The trailing line (SAR) is at 80015.85, and the price has already dropped about 268 below it—the short-term support has been broken. The momentum indicator J is 63.21 (K 58.89/D 56.73), which is a bit hot, like the accelerator is still pressed while the price hasn't kept up. 24h high 80107.99, low 79233; the high over the past two days is around 80200, with some overhead resistance still pressing above.
A hot indicator doesn't mean it's time to chase; a cool one doesn't mean it's time to buy.
$BTC current price 79747.60, down 0.3% in 24h. The trailing line (SAR) is at 80015.85, and the price has already dropped about 268 below it—the short-term support has been broken. The momentum indicator J is 63.21 (K 58.89/D 56.73), which is a bit hot, like the accelerator is still pressed while the price hasn't kept up. 24h high 80107.99, low 79233; the high over the past two days is around 80200, with some overhead resistance still pressing above.
A hot indicator doesn't mean it's time to chase; a cool one doesn't mean it's time to buy.
The 0.15% green can’t cover a gap of more than 6 bucks — DELL is still far from its follow-up line.
$DELL current price 523.92, up 0.15% in 24h. The follow-up line (SAR) is at 530.10, and the price has already fallen about 6.18 below it — short-term support has been broken through, and not by a hair, but clearly by a wide margin. The momentum indicator J is 52.03 (K 56.39 / D 58.57), lukewarm, like the gas pedal pressed halfway. 24h high 524.81, low 520.67; the high from the past two days is about 527.75, so overhead pressure is still there.
The follow-up line has already spoken; whether this bit of green can be recovered is another matter.
$DELL current price 523.92, up 0.15% in 24h. The follow-up line (SAR) is at 530.10, and the price has already fallen about 6.18 below it — short-term support has been broken through, and not by a hair, but clearly by a wide margin. The momentum indicator J is 52.03 (K 56.39 / D 58.57), lukewarm, like the gas pedal pressed halfway. 24h high 524.81, low 520.67; the high from the past two days is about 527.75, so overhead pressure is still there.
The follow-up line has already spoken; whether this bit of green can be recovered is another matter.
The difference is only two dollars, but AMZN has already lost the follow-up trend line.
$AMZN is currently at 259.03, down 0.28% over 24h. The follow-up line (SAR) is at 259.84, and the price has dropped to about 0.81 below it — short-term support has been broken. The momentum indicator J is 33.07 (K 32.91 / D 32.83), which is somewhat cool, like the throttle has been eased off. The 24h high is 260.52 and the low is 258.53; the high over the past two days is also 260.52. Volatility is narrow, but the position has softened first.
Today's piece only records the numbers, no hero narrative.
$AMZN is currently at 259.03, down 0.28% over 24h. The follow-up line (SAR) is at 259.84, and the price has dropped to about 0.81 below it — short-term support has been broken. The momentum indicator J is 33.07 (K 32.91 / D 32.83), which is somewhat cool, like the throttle has been eased off. The 24h high is 260.52 and the low is 258.53; the high over the past two days is also 260.52. Volatility is narrow, but the position has softened first.
Today's piece only records the numbers, no hero narrative.
It’s not the drop that’s scary, it’s that the trailing line is gone — what stands out more on this 1H GOOGL chart is the position.
$GOOGL current price 338.92, down 0.25% in 24h. The trailing line (SAR) is at 340.07, and price has fallen about 1.15 below it — short-term support has been broken through. Momentum indicator J is 31.29 (K 43.39 / D 49.43), on the cool side, like easing off the gas. The 24h high of 340.20 is right near the trailing line, low at 338.61; the high over the past two days is also 340.20, and after touching it, price moved down.
Wait until it reclaims the trailing line before saying more; if it doesn’t, leave it alone for now.
$GOOGL current price 338.92, down 0.25% in 24h. The trailing line (SAR) is at 340.07, and price has fallen about 1.15 below it — short-term support has been broken through. Momentum indicator J is 31.29 (K 43.39 / D 49.43), on the cool side, like easing off the gas. The 24h high of 340.20 is right near the trailing line, low at 338.61; the high over the past two days is also 340.20, and after touching it, price moved down.
Wait until it reclaims the trailing line before saying more; if it doesn’t, leave it alone for now.
Less than 1 dollar below the high, J has dropped to 35—this MSFT setup looks a bit shaky.
$MSFT is currently at 502.66, up 0.35% in 24h. The trend-following line (SAR) is at 502.22, so the current price is still about 0.44 above it—the short-term support hasn’t been broken, but the cushion is very thin. The momentum indicator J is 35.75 (K 42.17 / D 45.38), which is on the cool side, like easing off the accelerator. 24h high 503.38, low 500.70; the high over the past two days is around 505.08, so there’s still some room overhead.
Let time hand it over to the next confirming K candle; that’s more useful than guessing the finish line.
$MSFT is currently at 502.66, up 0.35% in 24h. The trend-following line (SAR) is at 502.22, so the current price is still about 0.44 above it—the short-term support hasn’t been broken, but the cushion is very thin. The momentum indicator J is 35.75 (K 42.17 / D 45.38), which is on the cool side, like easing off the accelerator. 24h high 503.38, low 500.70; the high over the past two days is around 505.08, so there’s still some room overhead.
Let time hand it over to the next confirming K candle; that’s more useful than guessing the finish line.
The daily line is still green, but the short-term line has already fallen below the follow-up line—these two levels on SPCX don’t match.
$SPCX is currently at 150.51, up 0.78% over 24h. The follow-up line (SAR) is at 151.29, and the price has already dropped below it—short-term support has been broken. The momentum indicator J is at 25.24 (K 53.69 / D 67.91), which is relatively weak, with the accelerator barely pressed. The 24h high of 151.29 is right at the follow-up line, while the low is 149.11; the high over the past two days is also 151.29, after which it pulled back.
Until it climbs back above the follow-up line, this trade stays on the watchlist.
$SPCX is currently at 150.51, up 0.78% over 24h. The follow-up line (SAR) is at 151.29, and the price has already dropped below it—short-term support has been broken. The momentum indicator J is at 25.24 (K 53.69 / D 67.91), which is relatively weak, with the accelerator barely pressed. The 24h high of 151.29 is right at the follow-up line, while the low is 149.11; the high over the past two days is also 151.29, after which it pulled back.
Until it climbs back above the follow-up line, this trade stays on the watchlist.
Up by a few tenths of a percent, but the momentum is rather cool — META just doesn’t feel quite right.
$META is currently at 615.78, up 0.29% over 24h. The follow-the-trend line (SAR) is at 615.30, so the current price is still about 0.48 above it — short-term support hasn’t been broken, but the margin is paper-thin. The momentum indicator J is 39.56 (K54.64/D62.18), which is on the cool side; the accelerator hasn’t kicked in. 24h high is 616.50 and low is 613.50; the recent two-day high is around 617.63, so there isn’t much overhead either.
The numbers are here; make your own call.
$META is currently at 615.78, up 0.29% over 24h. The follow-the-trend line (SAR) is at 615.30, so the current price is still about 0.48 above it — short-term support hasn’t been broken, but the margin is paper-thin. The momentum indicator J is 39.56 (K54.64/D62.18), which is on the cool side; the accelerator hasn’t kicked in. 24h high is 616.50 and low is 613.50; the recent two-day high is around 617.63, so there isn’t much overhead either.
The numbers are here; make your own call.
Current price, intraday high, and recent two-day high — INTC has the three lines stacked into one.
$INTC current price is 96.93, up 1.05% in 24 hours. The trailing line (SAR) is at 96.22, and the current price is still about 0.71 above it — short-term support has not been broken. The momentum indicator J is 101.7 (K 78.69 / D 67.19), already scorching past 100, like the accelerator pressed through the redline. The 24h high is 96.93 (the current price is touching the peak), and the low is 95.85.
In one sentence: reaching a new high is confirmed; being able to keep flooring the accelerator is not.
$INTC current price is 96.93, up 1.05% in 24 hours. The trailing line (SAR) is at 96.22, and the current price is still about 0.71 above it — short-term support has not been broken. The momentum indicator J is 101.7 (K 78.69 / D 67.19), already scorching past 100, like the accelerator pressed through the redline. The 24h high is 96.93 (the current price is touching the peak), and the low is 95.85.
In one sentence: reaching a new high is confirmed; being able to keep flooring the accelerator is not.
The momentum is overheated, but the price position is relatively weak — this set of AMD numbers is fighting itself.
$AMD current price 477.77, up 0.46% in 24h. The follow-line (SAR) is at 478.78, and the price has already fallen below it — short-term support has been broken. The momentum indicator J value is 87.43 (K 74.24 / D 67.64), overheated, like pressing the gas too hard. The 24h high of 477.94 is almost right next to the current price, with a low of 474.43; the recent two-day high is about 478.88, just around the follow-line.
A hot indicator doesn't mean it's a chase; a cool one doesn't mean it's a buy.
$AMD current price 477.77, up 0.46% in 24h. The follow-line (SAR) is at 478.78, and the price has already fallen below it — short-term support has been broken. The momentum indicator J value is 87.43 (K 74.24 / D 67.64), overheated, like pressing the gas too hard. The 24h high of 477.94 is almost right next to the current price, with a low of 474.43; the recent two-day high is about 478.88, just around the follow-line.
A hot indicator doesn't mean it's a chase; a cool one doesn't mean it's a buy.
It’s up more than a point, yet still hugging the intraday high — AVGO’s remaining upside really doesn’t look like much.
$AVGO is now 361.34, up 1.08% over 24h. The follow-line (SAR) is at 358.08, so the current price is still about 3 bucks above it — short-term support hasn’t been broken. The momentum indicator J is 78.22 (K 80.94 / D 82.31), which is pretty overheated, like the accelerator is being pressed pretty hard. The 24h high of 361.84 is almost flush with the current price, while the low is 356.95; the high from the past two days is around 363.00, so there isn’t much room overhead.
The gains you see and the staying power the market is willing to grant are often not the same thing.
$AVGO is now 361.34, up 1.08% over 24h. The follow-line (SAR) is at 358.08, so the current price is still about 3 bucks above it — short-term support hasn’t been broken. The momentum indicator J is 78.22 (K 80.94 / D 82.31), which is pretty overheated, like the accelerator is being pressed pretty hard. The 24h high of 361.84 is almost flush with the current price, while the low is 356.95; the high from the past two days is around 363.00, so there isn’t much room overhead.
The gains you see and the staying power the market is willing to grant are often not the same thing.
322.07 is both the intraday high and the trend-following line — AAPL’s current price is not holding on either side.
$AAPL current price is 321.79, up 0.26% in 24h. The trend-following line (SAR) is at 322.07, and price has already fallen below it — the short-term support has been broken. The momentum indicator J value is 33.39 (K51.62/D60.74), which is relatively cool, not overheated. The 24h low is 320.84; the high over the past two days is about 328.96, still some distance away from the current price.
Let the next confirmation K candle decide the time, rather than guessing the ending.
$AAPL current price is 321.79, up 0.26% in 24h. The trend-following line (SAR) is at 322.07, and price has already fallen below it — the short-term support has been broken. The momentum indicator J value is 33.39 (K51.62/D60.74), which is relatively cool, not overheated. The 24h low is 320.84; the high over the past two days is about 328.96, still some distance away from the current price.
Let the next confirmation K candle decide the time, rather than guessing the ending.
Up half a point, but the short-term support broke first — TSLA looks a bit twisted.
$TSLA current price 356.85, up 0.48% in 24h. The trend-following line (SAR) is at 357.12, and the current price has already fallen below it — short-term support has been broken. The momentum indicator J value is 30.15 (K44.08/D51.05), not hot, rather cool. The 24h high of 357.3 is right above, with a low of 354.85; the high over the past two days is about 371.83, still quite a bit away.
This segment only confirms structure, not sentiment.
$TSLA current price 356.85, up 0.48% in 24h. The trend-following line (SAR) is at 357.12, and the current price has already fallen below it — short-term support has been broken. The momentum indicator J value is 30.15 (K44.08/D51.05), not hot, rather cool. The 24h high of 357.3 is right above, with a low of 354.85; the high over the past two days is about 371.83, still quite a bit away.
This segment only confirms structure, not sentiment.
A support that hasn’t broken doesn’t mean it isn’t hot — SNDK is hugging the intraday high, and the J value has already gone above 100.
$SNDK is currently priced at 1776.73, up only 0.27% over 24h. The follow trend line (SAR) is at 1760.45, and the current price is about 16 points above it — short-term support is still there, and the buffer is not thin. The momentum indicator J value is 102.67 (K78.57/D66.52), which is overheated, like stepping on the gas too hard. The 24h high of 1777.49 is right in front of us, with a low of 1750.5; the high over the past two days is about 1781.37. Hitting new highs is easy, holding above them is another matter.
Wait and see whether it pulls back to the follow trend line first; if not, leave it for now.
$SNDK is currently priced at 1776.73, up only 0.27% over 24h. The follow trend line (SAR) is at 1760.45, and the current price is about 16 points above it — short-term support is still there, and the buffer is not thin. The momentum indicator J value is 102.67 (K78.57/D66.52), which is overheated, like stepping on the gas too hard. The 24h high of 1777.49 is right in front of us, with a low of 1750.5; the high over the past two days is about 1781.37. Hitting new highs is easy, holding above them is another matter.
Wait and see whether it pulls back to the follow trend line first; if not, leave it for now.
It’s neither crashing nor surging—NVDA is more like grinding along the follow-up trend line right now.
$NVDA is currently at 231.32, up 0.40% over 24h. The follow-up line (SAR) is at 231.01, with price just a hair above it—short-term support hasn’t been broken, but the margin is thin. The momentum indicator J is 67.90 (K65.22/D63.87), mildly warm but not overheated. The 24h high of 231.56 is almost right on top of the current price, with a low of 230.35; the high over the past two days is about 234.87, still some distance away.
Until it truly breaks below the follow-up line, keep this trade on the watchlist.
$NVDA is currently at 231.32, up 0.40% over 24h. The follow-up line (SAR) is at 231.01, with price just a hair above it—short-term support hasn’t been broken, but the margin is thin. The momentum indicator J is 67.90 (K65.22/D63.87), mildly warm but not overheated. The 24h high of 231.56 is almost right on top of the current price, with a low of 230.35; the high over the past two days is about 234.87, still some distance away.
Until it truly breaks below the follow-up line, keep this trade on the watchlist.
Don't be fooled by this less-than-1% gain — MU's momentum indicator is already scorching at 99.
$MU is currently priced at 1021.27, up 0.93% over 24h. The trend-following line (SAR) is at 1013.85, and the price is still above it — short-term support hasn't broken, so the bias remains strong. But the momentum indicator J value has jumped to 99.45 (K78.11/D67.45), like pressing the accelerator too hard, which looks overheated. The 24h high of 1022.92 just brushed the edge, while the low was 1011.2; the high over the past two days is also only 1022.92.
J has already spoken; whether the price will follow is another matter.
$MU is currently priced at 1021.27, up 0.93% over 24h. The trend-following line (SAR) is at 1013.85, and the price is still above it — short-term support hasn't broken, so the bias remains strong. But the momentum indicator J value has jumped to 99.45 (K78.11/D67.45), like pressing the accelerator too hard, which looks overheated. The 24h high of 1022.92 just brushed the edge, while the low was 1011.2; the high over the past two days is also only 1022.92.
J has already spoken; whether the price will follow is another matter.
Log in to explore more content