
云享掌门观澜
322 Posts

云享掌门观澜
Report
Block User
100K Following
10.8K+ Followers
1.1K+ Liked
Posts
All
Quotes
Live
·
--
Bullish
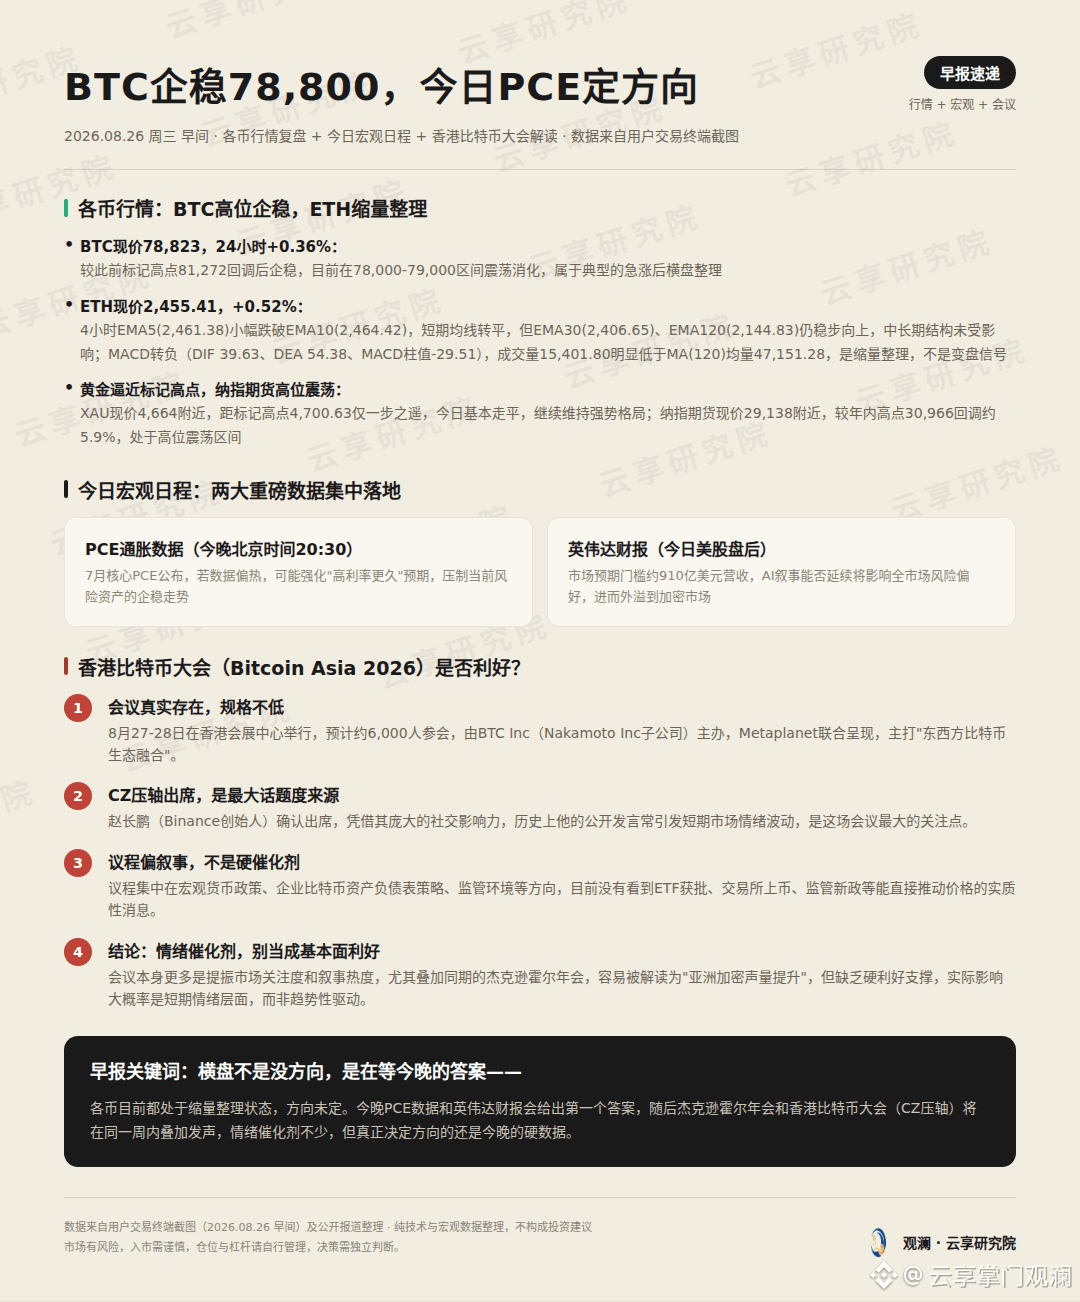
BTC stabilizes at 78,823; ETH consolidates on lower volume; gold is nearing its previous high—everyone is waiting for answers.
Tonight, the first variable will be the PCE data plus the Nvidia earnings report. At the Hong Kong Bitcoin Conference, CZ will make the closing appearance, but the agenda is more narrative in nature, without any hard news like ETF approvals—more like a sentiment catalyst rather than a fundamental positive.
Do you think tonight’s data will break the consolidation, or will it continue grinding?
BTC stabilizes at 78,823; ETH consolidates on lower volume; gold is nearing its previous high—everyone is waiting for answers.
Tonight, the first variable will be the PCE data plus the Nvidia earnings report. At the Hong Kong Bitcoin Conference, CZ will make the closing appearance, but the agenda is more narrative in nature, without any hard news like ETF approvals—more like a sentiment catalyst rather than a fundamental positive.
Do you think tonight’s data will break the consolidation, or will it continue grinding?
Tonight, the first variable will be the PCE data plus the Nvidia earnings report. At the Hong Kong Bitcoin Conference, CZ will make the closing appearance, but the agenda is more narrative in nature, without any hard news like ETF approvals—more like a sentiment catalyst rather than a fundamental positive.
Do you think tonight’s data will break the consolidation, or will it continue grinding?
3
1
1.6k
·
--
☀️ Good morning, Friday, August 21.
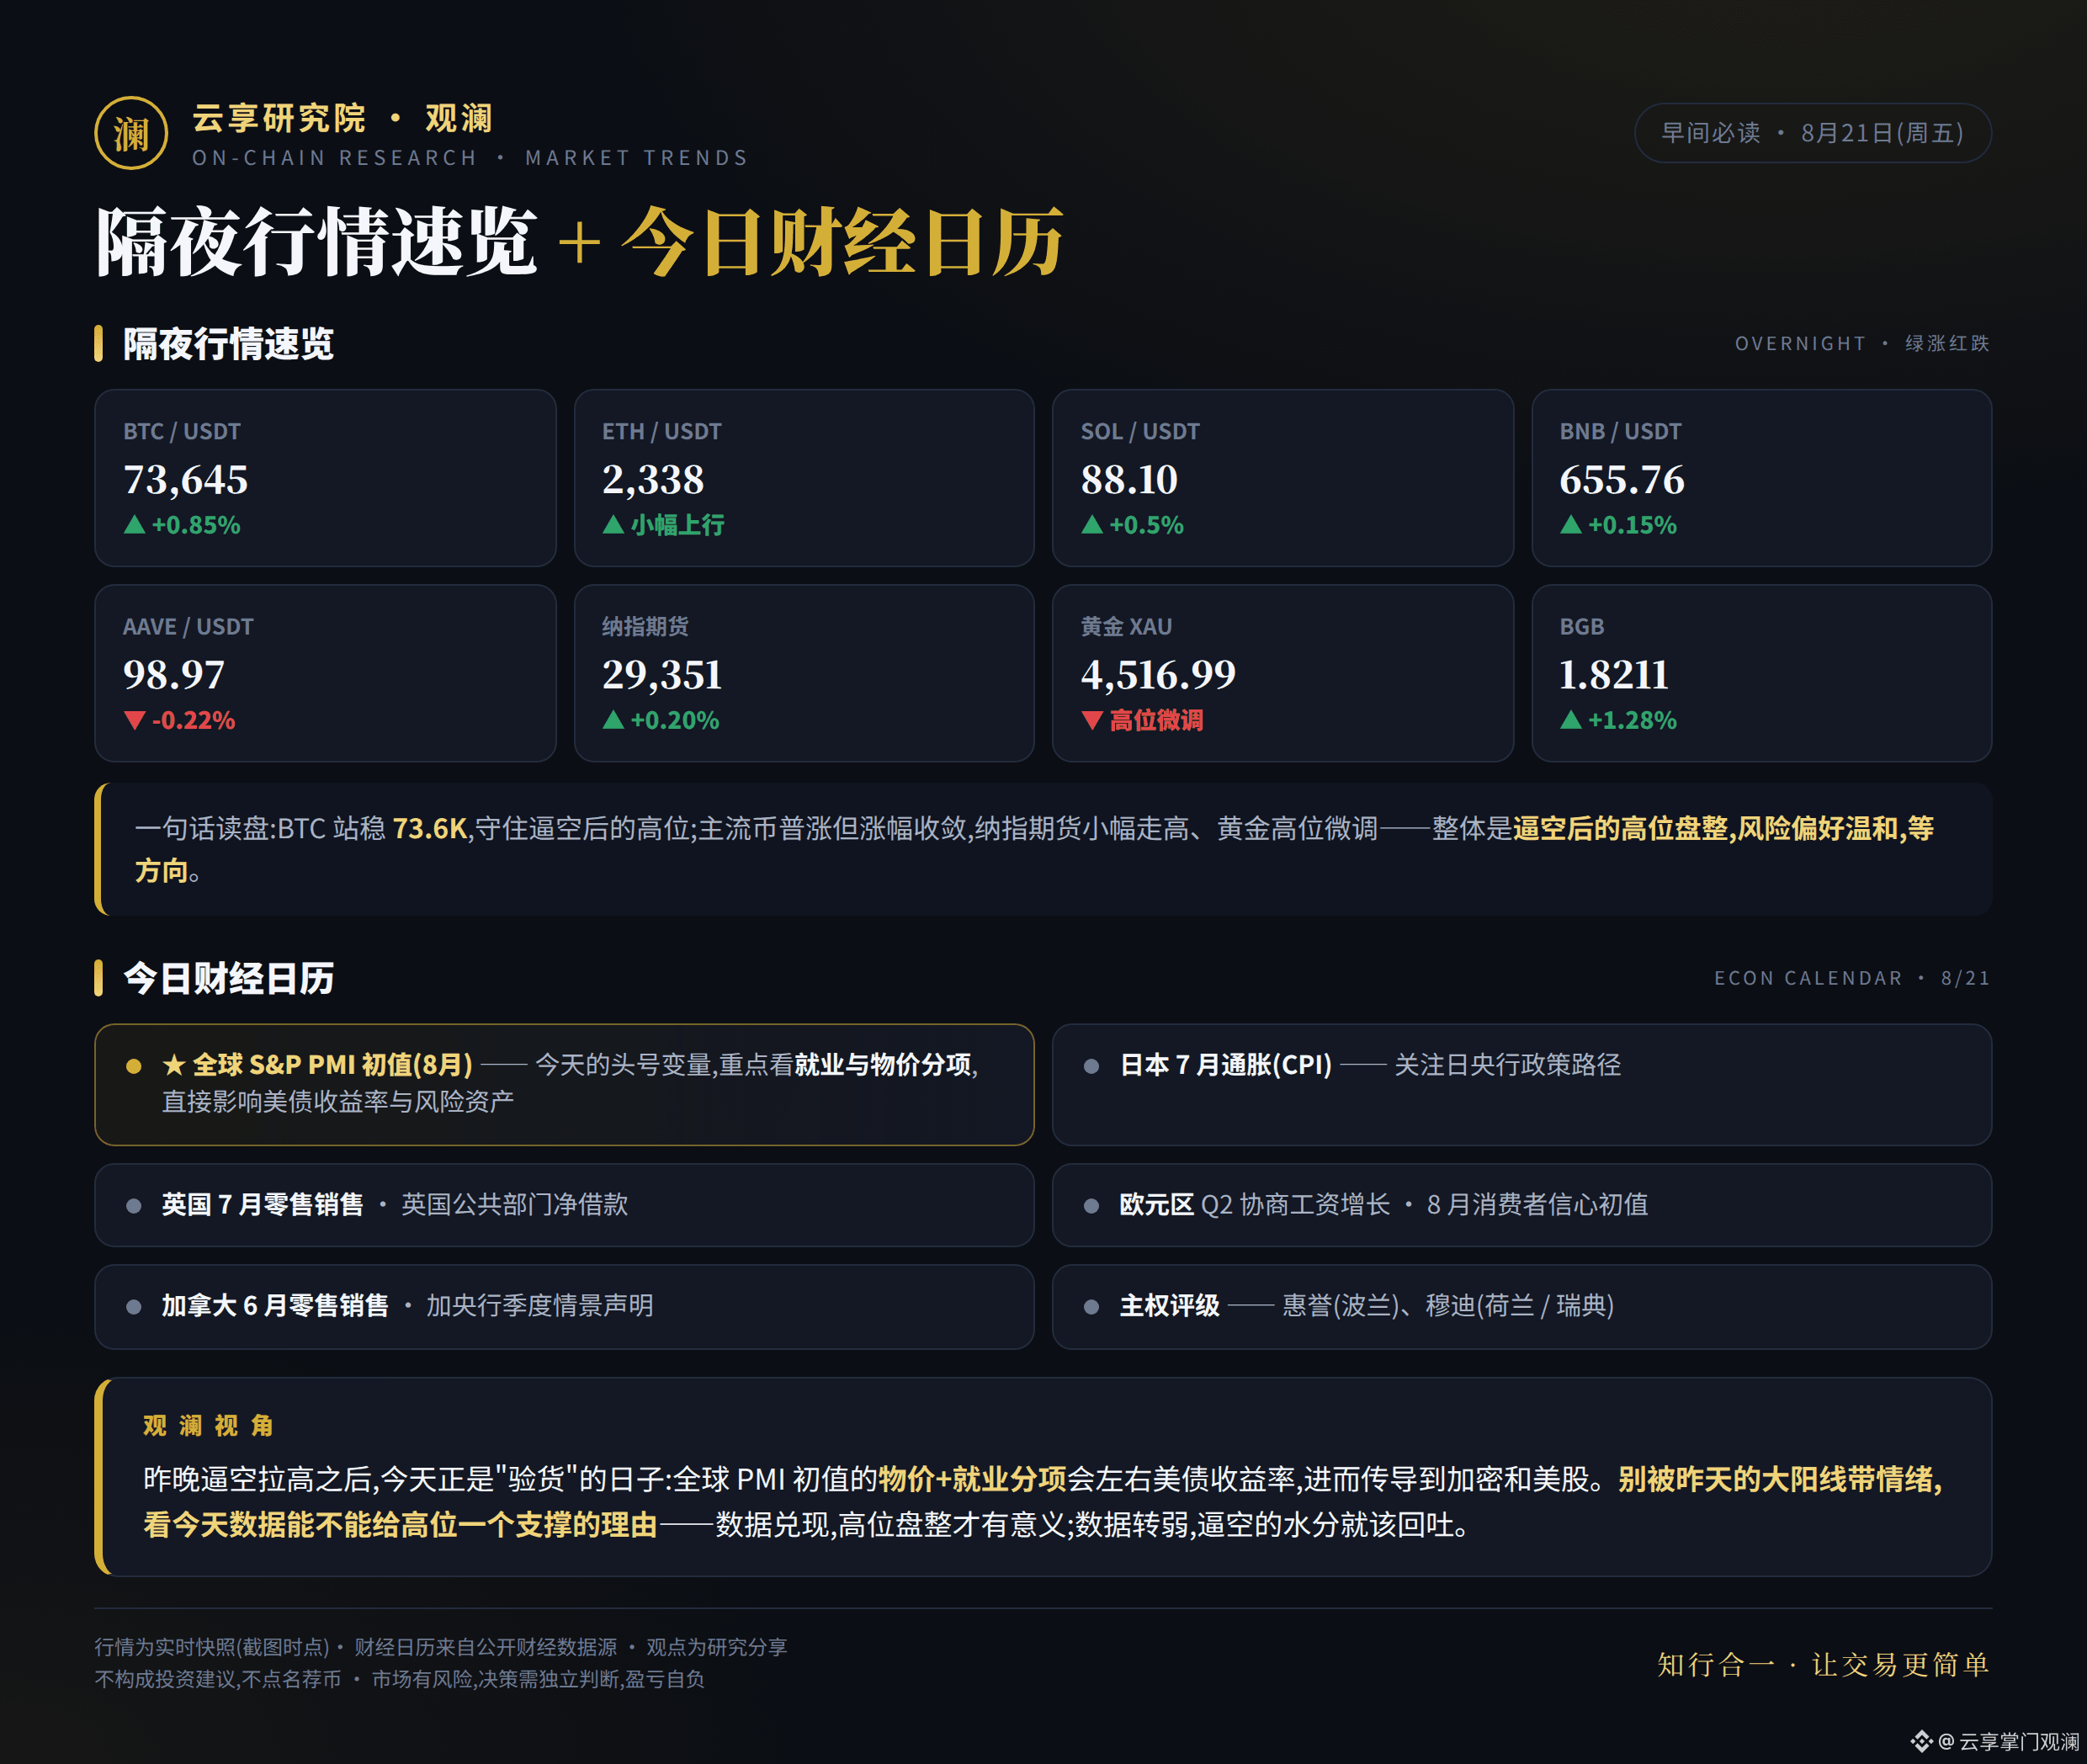
Overnight: BTC held steady at 73.6K and stayed at the high level after that squeeze; ETH and SOL, BNB rose across the board, but the magnitude of the gains clearly narrowed. AAVE and HYPE edged slightly lower. Nasdaq futures ticked up 0.2%. Gold at 4516 made a small adjustment near the highs. In one sentence—after the squeeze lifted prices, we’re now in high-range consolidation. Risk appetite is moderate, and the market is waiting for a direction.
What you should watch most today: the global S&P PMI initial reading (August). Don’t just look at the headline number—focus on two sub-components: employment and prices. These directly influence the trajectory of U.S. Treasury yields, which then filter through to crypto and U.S. stocks. Also take a quick look at Japan’s July CPI, the UK retail data, and Eurozone consumer confidence.
Guankan’s view: Last night’s big bullish candle was fun, but today is the “inspection day.” If the data delivers (PMI holds steady, prices remain under control), there’s reason for support in high-range consolidation. If the data turns weaker, then you should see how much of the excess from the squeeze needs to unwind—back to where it should be. Don’t let yesterday’s emotions drag you into chasing; let today’s data do the deciding.
Data tells the story; sentiment is just noise. Today—let the data speak.
The above is for research and does not constitute investment advice. #Bitcoin #USStocks #PMI
☀️ Good morning, Friday, August 21.
Overnight: BTC held steady at 73.6K and stayed at the high level after that squeeze; ETH and SOL, BNB rose across the board, but the magnitude of the gains clearly narrowed. AAVE and HYPE edged slightly lower. Nasdaq futures ticked up 0.2%. Gold at 4516 made a small adjustment near the highs. In one sentence—after the squeeze lifted prices, we’re now in high-range consolidation. Risk appetite is moderate, and the market is waiting for a direction.
What you should watch most today: the global S&P PMI initial reading (August). Don’t just look at the headline number—focus on two sub-components: employment and prices. These directly influence the trajectory of U.S. Treasury yields, which then filter through to crypto and U.S. stocks. Also take a quick look at Japan’s July CPI, the UK retail data, and Eurozone consumer confidence.
Guankan’s view: Last night’s big bullish candle was fun, but today is the “inspection day.” If the data delivers (PMI holds steady, prices remain under control), there’s reason for support in high-range consolidation. If the data turns weaker, then you should see how much of the excess from the squeeze needs to unwind—back to where it should be. Don’t let yesterday’s emotions drag you into chasing; let today’s data do the deciding.
Data tells the story; sentiment is just noise. Today—let the data speak.
The above is for research and does not constitute investment advice. #Bitcoin #USStocks #PMI
Overnight: BTC held steady at 73.6K and stayed at the high level after that squeeze; ETH and SOL, BNB rose across the board, but the magnitude of the gains clearly narrowed. AAVE and HYPE edged slightly lower. Nasdaq futures ticked up 0.2%. Gold at 4516 made a small adjustment near the highs. In one sentence—after the squeeze lifted prices, we’re now in high-range consolidation. Risk appetite is moderate, and the market is waiting for a direction.
What you should watch most today: the global S&P PMI initial reading (August). Don’t just look at the headline number—focus on two sub-components: employment and prices. These directly influence the trajectory of U.S. Treasury yields, which then filter through to crypto and U.S. stocks. Also take a quick look at Japan’s July CPI, the UK retail data, and Eurozone consumer confidence.
Guankan’s view: Last night’s big bullish candle was fun, but today is the “inspection day.” If the data delivers (PMI holds steady, prices remain under control), there’s reason for support in high-range consolidation. If the data turns weaker, then you should see how much of the excess from the squeeze needs to unwind—back to where it should be. Don’t let yesterday’s emotions drag you into chasing; let today’s data do the deciding.
Data tells the story; sentiment is just noise. Today—let the data speak.
The above is for research and does not constitute investment advice. #Bitcoin #USStocks #PMI
783
·
--
Bullish
How will this rally go next? 📊
In two days, ETH rose over 16.7% and HYPE rose over 17.6%. This morning, both the ups and downs narrowed to within 0.3%.
How will this rally go next? 📊
In two days, ETH rose over 16.7% and HYPE rose over 17.6%. This morning, both the ups and downs narrowed to within 0.3%.
In two days, ETH rose over 16.7% and HYPE rose over 17.6%. This morning, both the ups and downs narrowed to within 0.3%.
A. 继续冲高,创近期新高
68%
B. 高位震荡,横盘消化
10%
C. 冲高回落,逐步补跌
18%
D. 快速转向,行情反转
4%
68 votes • Voting closed
1.1k
·
--
Bullish
I saw someone say BTC’s STH-MVRV is currently "perfectly replicating the three-stage bottoming pattern from 21–22," and that it’s about to rebound. I want to talk about a blind spot in this kind of analysis.
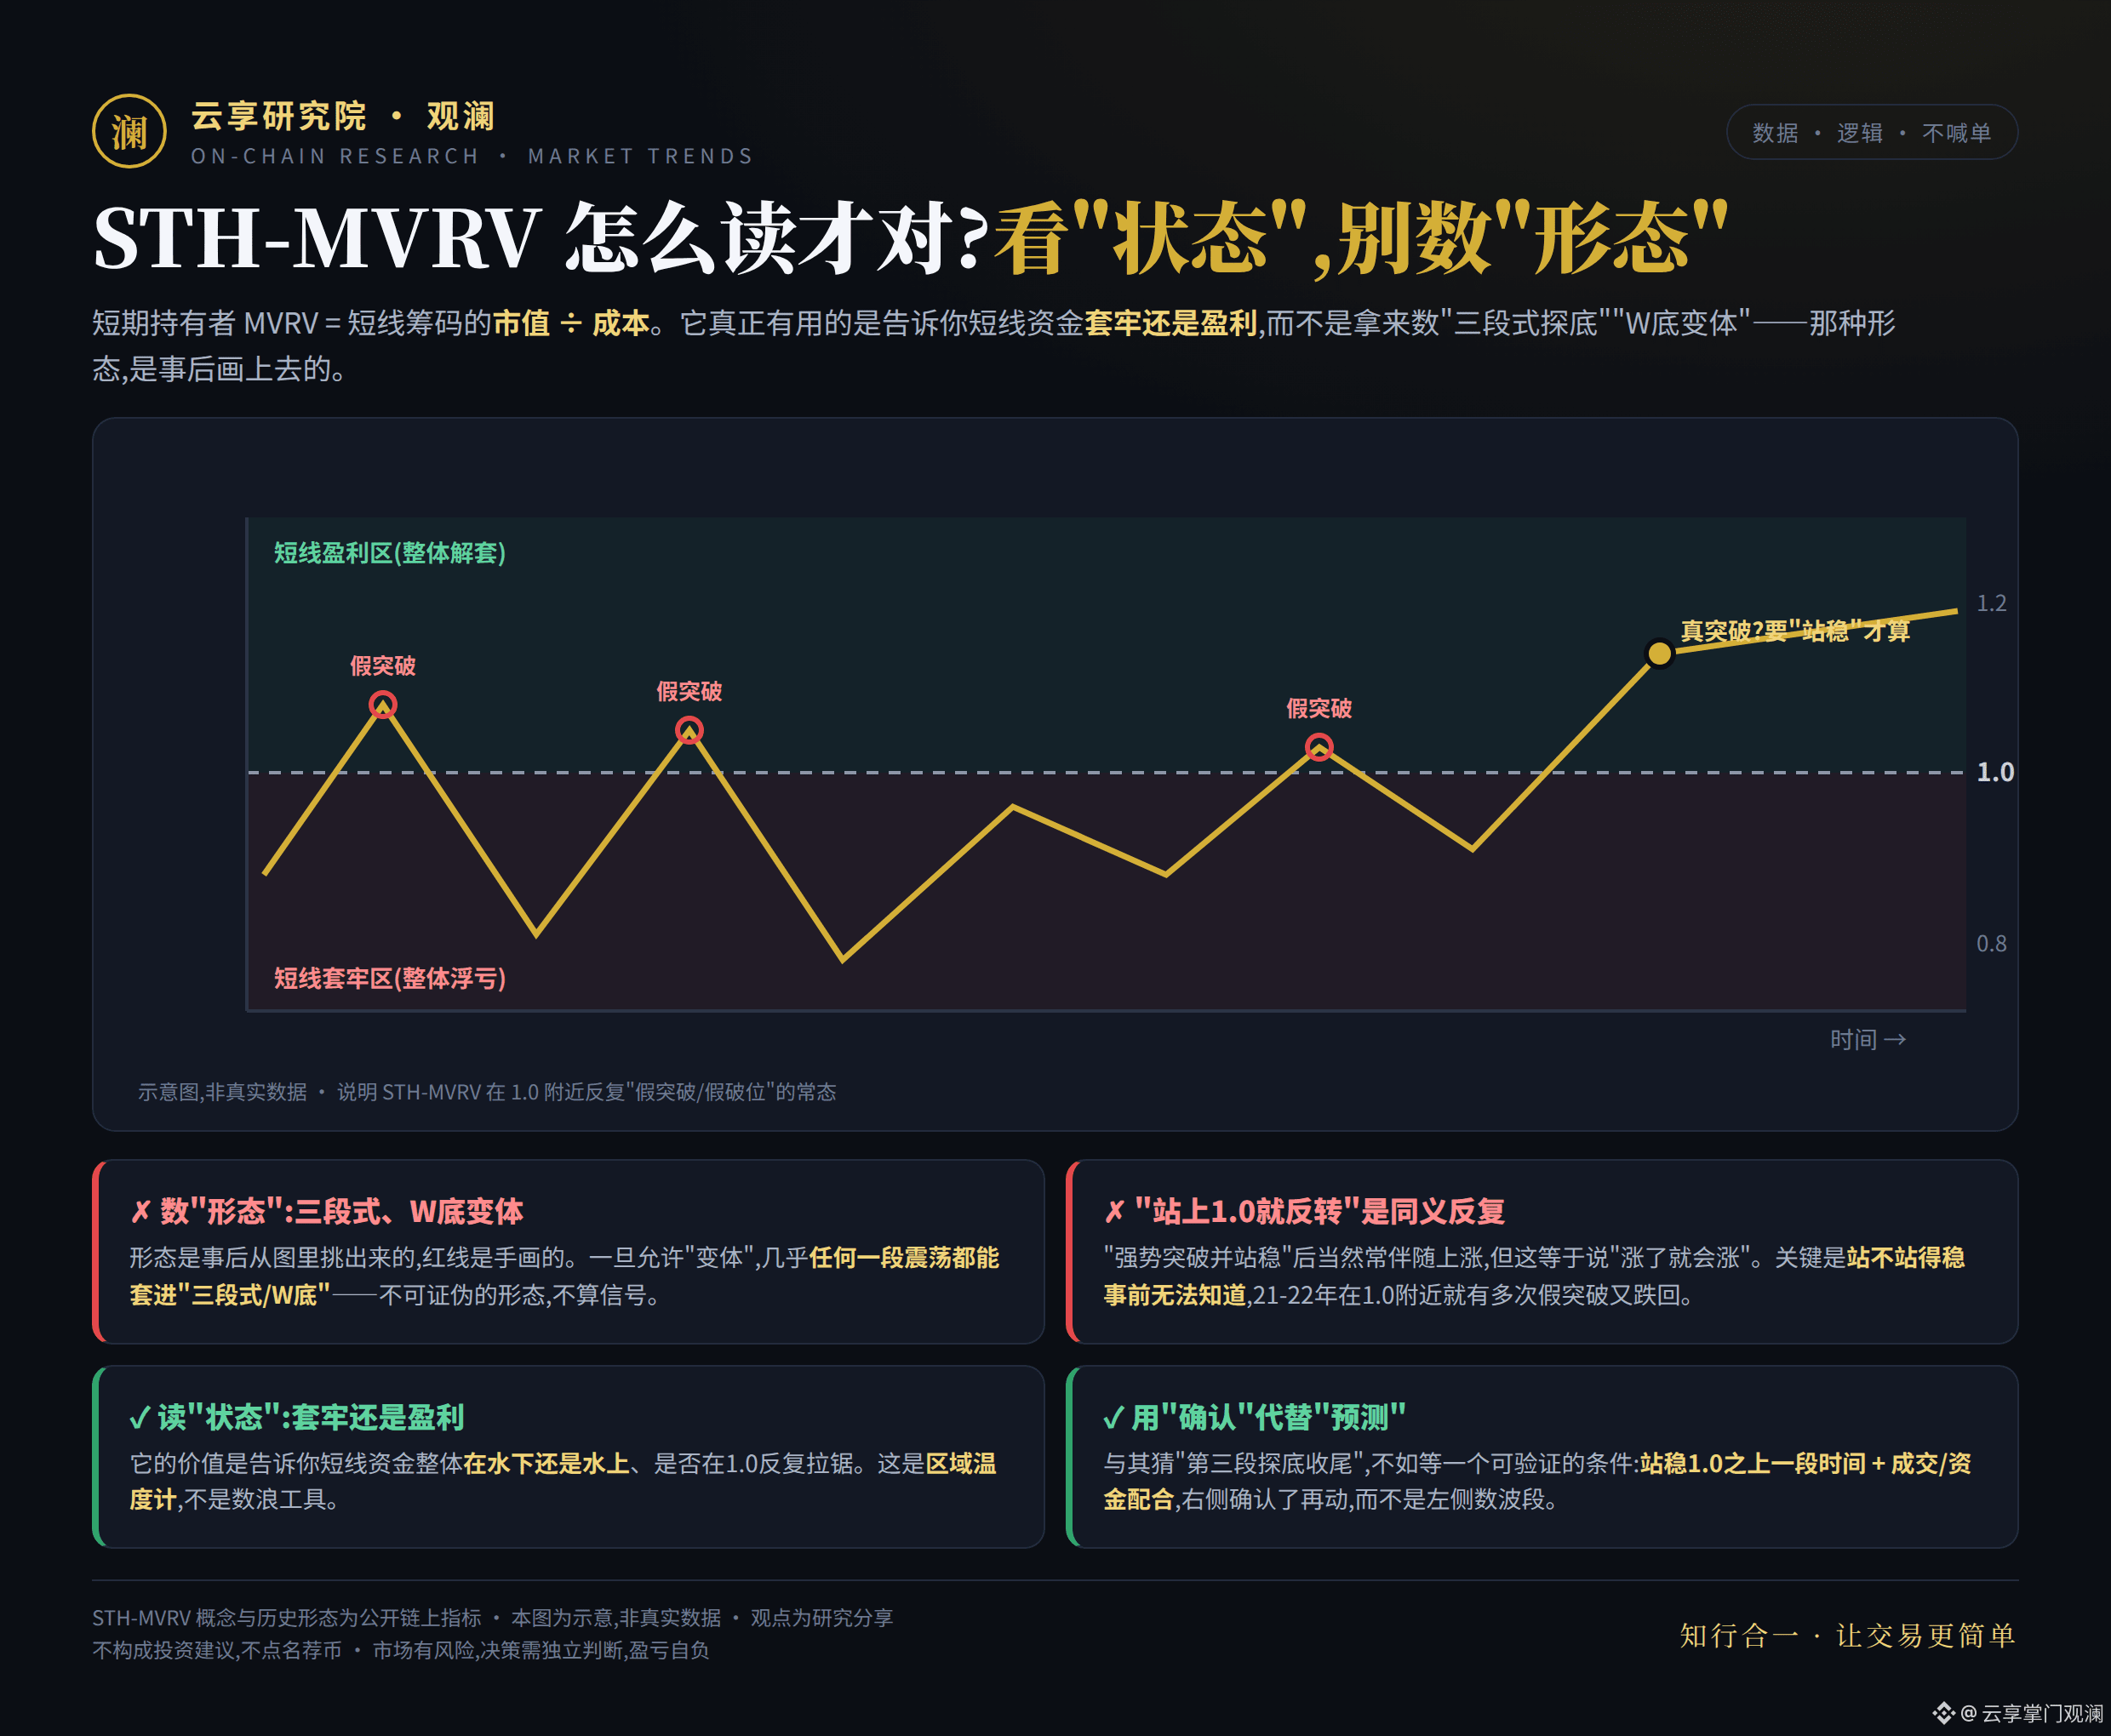
First, what is this indicator: STH-MVRV = the market value of the short-term holders’ coins ÷ cost basis. Falling below 1.0 means this group of short-term funds is overall at a loss; rising above 1.0 means they are broadly back in profit. So its real value is to tell you whether short-term funds are currently "trapped" or "in profit"—it is a state indicator. $ETH
{spot}(ETHUSDT)
But "three-stage bottoming" or "W-bottom variant" is a different matter: that is a shape manually drawn afterward by picking it out of the chart. Once you allow the words "variant," almost any period of oscillation around 1.0 can be forced into a "bottoming fractal." A model that can explain every movement has no predictive power.
And the statement "once it stabilizes above 1.0, the reversal is confirmed on the right side" is itself a tautology—after a breakout and stabilization, prices often rise, of course, but the key question of whether it can truly hold is something no one knows in advance; it can only be confirmed afterward. Look at that 21–22 period: STH-MVRV made many false breakouts and false breakdowns around 1.0. $BTC
{future}(BTCUSDT)
So my suggestion is: use STH-MVRV as a "state thermometer"—to see whether short-term funds are underwater or in profit, and whether they are grinding around 1.0; do not use it to count waves or predict the "end of the third bottoming stage." If you really want to participate, wait until it has stayed above 1.0 for a period of time, then confirm with capital flows, and trade from the right side, rather than rushing in on the left side by counting patterns.
History does rhyme, but "rhyme" can only be heard after the fact; in advance, hearing every fluctuation as the same melody is exactly how people miss the move and get trapped.
For research purposes only, not investment advice, and no coin recommendations.
#Bitcoin #OnChainData #STHMVRV
I saw someone say BTC’s STH-MVRV is currently "perfectly replicating the three-stage bottoming pattern from 21–22," and that it’s about to rebound. I want to talk about a blind spot in this kind of analysis.
First, what is this indicator: STH-MVRV = the market value of the short-term holders’ coins ÷ cost basis. Falling below 1.0 means this group of short-term funds is overall at a loss; rising above 1.0 means they are broadly back in profit. So its real value is to tell you whether short-term funds are currently "trapped" or "in profit"—it is a state indicator. $ETH
But "three-stage bottoming" or "W-bottom variant" is a different matter: that is a shape manually drawn afterward by picking it out of the chart. Once you allow the words "variant," almost any period of oscillation around 1.0 can be forced into a "bottoming fractal." A model that can explain every movement has no predictive power.
And the statement "once it stabilizes above 1.0, the reversal is confirmed on the right side" is itself a tautology—after a breakout and stabilization, prices often rise, of course, but the key question of whether it can truly hold is something no one knows in advance; it can only be confirmed afterward. Look at that 21–22 period: STH-MVRV made many false breakouts and false breakdowns around 1.0. $BTC
So my suggestion is: use STH-MVRV as a "state thermometer"—to see whether short-term funds are underwater or in profit, and whether they are grinding around 1.0; do not use it to count waves or predict the "end of the third bottoming stage." If you really want to participate, wait until it has stayed above 1.0 for a period of time, then confirm with capital flows, and trade from the right side, rather than rushing in on the left side by counting patterns.
History does rhyme, but "rhyme" can only be heard after the fact; in advance, hearing every fluctuation as the same melody is exactly how people miss the move and get trapped.
For research purposes only, not investment advice, and no coin recommendations.
#Bitcoin #OnChainData #STHMVRV
First, what is this indicator: STH-MVRV = the market value of the short-term holders’ coins ÷ cost basis. Falling below 1.0 means this group of short-term funds is overall at a loss; rising above 1.0 means they are broadly back in profit. So its real value is to tell you whether short-term funds are currently "trapped" or "in profit"—it is a state indicator. $ETH
But "three-stage bottoming" or "W-bottom variant" is a different matter: that is a shape manually drawn afterward by picking it out of the chart. Once you allow the words "variant," almost any period of oscillation around 1.0 can be forced into a "bottoming fractal." A model that can explain every movement has no predictive power.
And the statement "once it stabilizes above 1.0, the reversal is confirmed on the right side" is itself a tautology—after a breakout and stabilization, prices often rise, of course, but the key question of whether it can truly hold is something no one knows in advance; it can only be confirmed afterward. Look at that 21–22 period: STH-MVRV made many false breakouts and false breakdowns around 1.0. $BTC
So my suggestion is: use STH-MVRV as a "state thermometer"—to see whether short-term funds are underwater or in profit, and whether they are grinding around 1.0; do not use it to count waves or predict the "end of the third bottoming stage." If you really want to participate, wait until it has stayed above 1.0 for a period of time, then confirm with capital flows, and trade from the right side, rather than rushing in on the left side by counting patterns.
History does rhyme, but "rhyme" can only be heard after the fact; in advance, hearing every fluctuation as the same melody is exactly how people miss the move and get trapped.
For research purposes only, not investment advice, and no coin recommendations.
#Bitcoin #OnChainData #STHMVRV
402
·
--
Bullish
Everyone is looking for the reasons behind a BTC rally. In fact, there are only three core ones—but for each of them, I want to add a “but.”
First: pressure from U.S. Treasuries. The 30-year yield once surged above 5.3%, hitting a multi-year high. How to digest the $40 trillion in Treasuries has become a global issue. Capital is once again seeking assets that aren’t easily diluted—gold and Bitcoin are back in the spotlight. But: this is the “endpoint” logic. What the short-term rate shock really brings is tighter liquidity and a risk-off environment. As a high-beta asset, BTC often drops first, and the scarcity narrative tends to show up later—being bullish at the endpoint doesn’t mean the path is smooth.
Second: regulatory attitudes have changed. The SEC proposed a “Regulation Crypto Assets” framework. It’s no longer only about crackdowns; it’s starting to provide compliance pathways. This is a big change for institutions. But: this is a proposal still in the 60-day public comment period—it’s not the final rule that’s already been implemented. There are also reports of disagreements within the White House and delays in the process. A proposal ≠ the endgame.
Third: Wall Street is moving in. At the White House Crypto Summit, the SEC, CFTC, Coinbase, Ripple, Nasdaq, NYSE, CME, and DTCC all attended. But: “attending” doesn’t mean “capital is already allocated.” The summit is a signal about the framework, not a buying-data report. If you want to know whether real money is entering, you look at verifiable metrics like ETF net inflows, custody size, and stablecoin supply—not a group photo.
Conclusion: all three points are structural, long-term positives. They explain a more durable buying force—not a reason for a sudden one-day explosion. The direction may lean bullish, but don’t treat “macro narrative, regulatory proposals, and big shots showing up” as “already fulfilled facts.” The only things that truly land in your hands are the parts that can be validated by data.
For research purposes only; not investment advice. No specific coins are being recommended.
#Bitcoin #U.S.Treasuries #SECRegulation #Crypto
Everyone is looking for the reasons behind a BTC rally. In fact, there are only three core ones—but for each of them, I want to add a “but.”
First: pressure from U.S. Treasuries. The 30-year yield once surged above 5.3%, hitting a multi-year high. How to digest the $40 trillion in Treasuries has become a global issue. Capital is once again seeking assets that aren’t easily diluted—gold and Bitcoin are back in the spotlight. But: this is the “endpoint” logic. What the short-term rate shock really brings is tighter liquidity and a risk-off environment. As a high-beta asset, BTC often drops first, and the scarcity narrative tends to show up later—being bullish at the endpoint doesn’t mean the path is smooth.
Second: regulatory attitudes have changed. The SEC proposed a “Regulation Crypto Assets” framework. It’s no longer only about crackdowns; it’s starting to provide compliance pathways. This is a big change for institutions. But: this is a proposal still in the 60-day public comment period—it’s not the final rule that’s already been implemented. There are also reports of disagreements within the White House and delays in the process. A proposal ≠ the endgame.
Third: Wall Street is moving in. At the White House Crypto Summit, the SEC, CFTC, Coinbase, Ripple, Nasdaq, NYSE, CME, and DTCC all attended. But: “attending” doesn’t mean “capital is already allocated.” The summit is a signal about the framework, not a buying-data report. If you want to know whether real money is entering, you look at verifiable metrics like ETF net inflows, custody size, and stablecoin supply—not a group photo.
Conclusion: all three points are structural, long-term positives. They explain a more durable buying force—not a reason for a sudden one-day explosion. The direction may lean bullish, but don’t treat “macro narrative, regulatory proposals, and big shots showing up” as “already fulfilled facts.” The only things that truly land in your hands are the parts that can be validated by data.
For research purposes only; not investment advice. No specific coins are being recommended.
#Bitcoin #U.S.Treasuries #SECRegulation #Crypto
First: pressure from U.S. Treasuries. The 30-year yield once surged above 5.3%, hitting a multi-year high. How to digest the $40 trillion in Treasuries has become a global issue. Capital is once again seeking assets that aren’t easily diluted—gold and Bitcoin are back in the spotlight. But: this is the “endpoint” logic. What the short-term rate shock really brings is tighter liquidity and a risk-off environment. As a high-beta asset, BTC often drops first, and the scarcity narrative tends to show up later—being bullish at the endpoint doesn’t mean the path is smooth.
Second: regulatory attitudes have changed. The SEC proposed a “Regulation Crypto Assets” framework. It’s no longer only about crackdowns; it’s starting to provide compliance pathways. This is a big change for institutions. But: this is a proposal still in the 60-day public comment period—it’s not the final rule that’s already been implemented. There are also reports of disagreements within the White House and delays in the process. A proposal ≠ the endgame.
Third: Wall Street is moving in. At the White House Crypto Summit, the SEC, CFTC, Coinbase, Ripple, Nasdaq, NYSE, CME, and DTCC all attended. But: “attending” doesn’t mean “capital is already allocated.” The summit is a signal about the framework, not a buying-data report. If you want to know whether real money is entering, you look at verifiable metrics like ETF net inflows, custody size, and stablecoin supply—not a group photo.
Conclusion: all three points are structural, long-term positives. They explain a more durable buying force—not a reason for a sudden one-day explosion. The direction may lean bullish, but don’t treat “macro narrative, regulatory proposals, and big shots showing up” as “already fulfilled facts.” The only things that truly land in your hands are the parts that can be validated by data.
For research purposes only; not investment advice. No specific coins are being recommended.
#Bitcoin #U.S.Treasuries #SECRegulation #Crypto

1
3
2k
·
--
【Yunxiang Research Institute · Morning News】August 20, Thursday, morning session
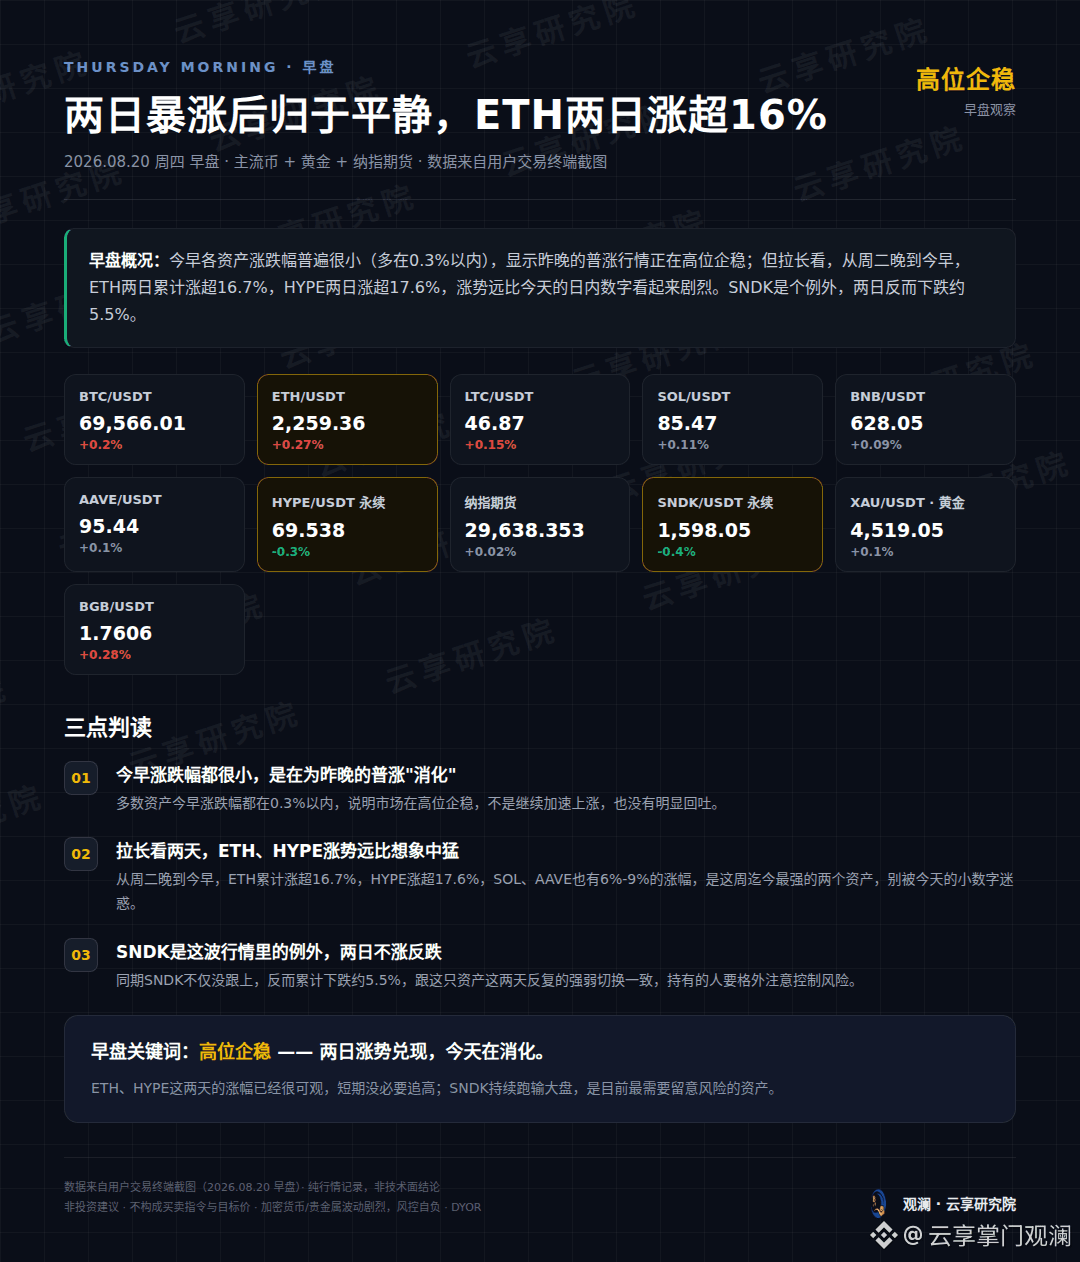
This morning, the price movements across assets were generally small (mostly within 0.3%), indicating that last night’s broad-based rally is stabilizing at high levels. However, when looking over a longer period—from Tuesday evening to this morning—ETH has gained more than 16.7% over two days, and HYPE has risen more than 17.6% over two days. The upward momentum is far more dramatic than today’s intraday numbers suggest. SNDK is the exception: instead, it fell by about 5.5% over the two days. $ETH
{spot}(ETHUSDT)
Three takeaways:
01 This morning’s gains and losses are all small—this is the “digesting” of last night’s broad-based rally. Most assets this morning moved within 0.3%, suggesting the market is stabilizing at high levels. It’s not accelerating further upward, and there’s no clear pullback.
02 Looking across the two days, the rally in ETH and HYPE is much stronger than expected—from Tuesday evening to this morning, ETH is up more than 16.7% and HYPE up more than 17.6%. SOL and AAVE also gained 6%–9%. These are the two strongest assets so far this week. Don’t be misled by today’s small numbers.
03 SNDK is the exception in this round of the market. It didn’t rise over two days—it actually declined. During the same period, SNDK not only failed to keep up but also dropped by about 5.5% cumulatively. This matches the repeated switching of strength and weakness over the past two days. Holders should take extra care to manage risk.
Morning-session keywords: stabilization at high levels. ETH and HYPE’s gains over the past two days are already quite significant—there’s no need to chase at this point in the short term. SNDK, continuing to underperform the broader market, is currently the asset where risk needs the most attention.
The above is only my personal market record and observations and does not constitute any investment advice. Markets involve risk, and decisions should be made independently.
—— Guanlan @ Yunxiang Research Institute
【Yunxiang Research Institute · Morning News】August 20, Thursday, morning session
This morning, the price movements across assets were generally small (mostly within 0.3%), indicating that last night’s broad-based rally is stabilizing at high levels. However, when looking over a longer period—from Tuesday evening to this morning—ETH has gained more than 16.7% over two days, and HYPE has risen more than 17.6% over two days. The upward momentum is far more dramatic than today’s intraday numbers suggest. SNDK is the exception: instead, it fell by about 5.5% over the two days. $ETH
Three takeaways:
01 This morning’s gains and losses are all small—this is the “digesting” of last night’s broad-based rally. Most assets this morning moved within 0.3%, suggesting the market is stabilizing at high levels. It’s not accelerating further upward, and there’s no clear pullback.
02 Looking across the two days, the rally in ETH and HYPE is much stronger than expected—from Tuesday evening to this morning, ETH is up more than 16.7% and HYPE up more than 17.6%. SOL and AAVE also gained 6%–9%. These are the two strongest assets so far this week. Don’t be misled by today’s small numbers.
03 SNDK is the exception in this round of the market. It didn’t rise over two days—it actually declined. During the same period, SNDK not only failed to keep up but also dropped by about 5.5% cumulatively. This matches the repeated switching of strength and weakness over the past two days. Holders should take extra care to manage risk.
Morning-session keywords: stabilization at high levels. ETH and HYPE’s gains over the past two days are already quite significant—there’s no need to chase at this point in the short term. SNDK, continuing to underperform the broader market, is currently the asset where risk needs the most attention.
The above is only my personal market record and observations and does not constitute any investment advice. Markets involve risk, and decisions should be made independently.
—— Guanlan @ Yunxiang Research Institute
This morning, the price movements across assets were generally small (mostly within 0.3%), indicating that last night’s broad-based rally is stabilizing at high levels. However, when looking over a longer period—from Tuesday evening to this morning—ETH has gained more than 16.7% over two days, and HYPE has risen more than 17.6% over two days. The upward momentum is far more dramatic than today’s intraday numbers suggest. SNDK is the exception: instead, it fell by about 5.5% over the two days. $ETH
Three takeaways:
01 This morning’s gains and losses are all small—this is the “digesting” of last night’s broad-based rally. Most assets this morning moved within 0.3%, suggesting the market is stabilizing at high levels. It’s not accelerating further upward, and there’s no clear pullback.
02 Looking across the two days, the rally in ETH and HYPE is much stronger than expected—from Tuesday evening to this morning, ETH is up more than 16.7% and HYPE up more than 17.6%. SOL and AAVE also gained 6%–9%. These are the two strongest assets so far this week. Don’t be misled by today’s small numbers.
03 SNDK is the exception in this round of the market. It didn’t rise over two days—it actually declined. During the same period, SNDK not only failed to keep up but also dropped by about 5.5% cumulatively. This matches the repeated switching of strength and weakness over the past two days. Holders should take extra care to manage risk.
Morning-session keywords: stabilization at high levels. ETH and HYPE’s gains over the past two days are already quite significant—there’s no need to chase at this point in the short term. SNDK, continuing to underperform the broader market, is currently the asset where risk needs the most attention.
The above is only my personal market record and observations and does not constitute any investment advice. Markets involve risk, and decisions should be made independently.
—— Guanlan @ Yunxiang Research Institute
889
·
--
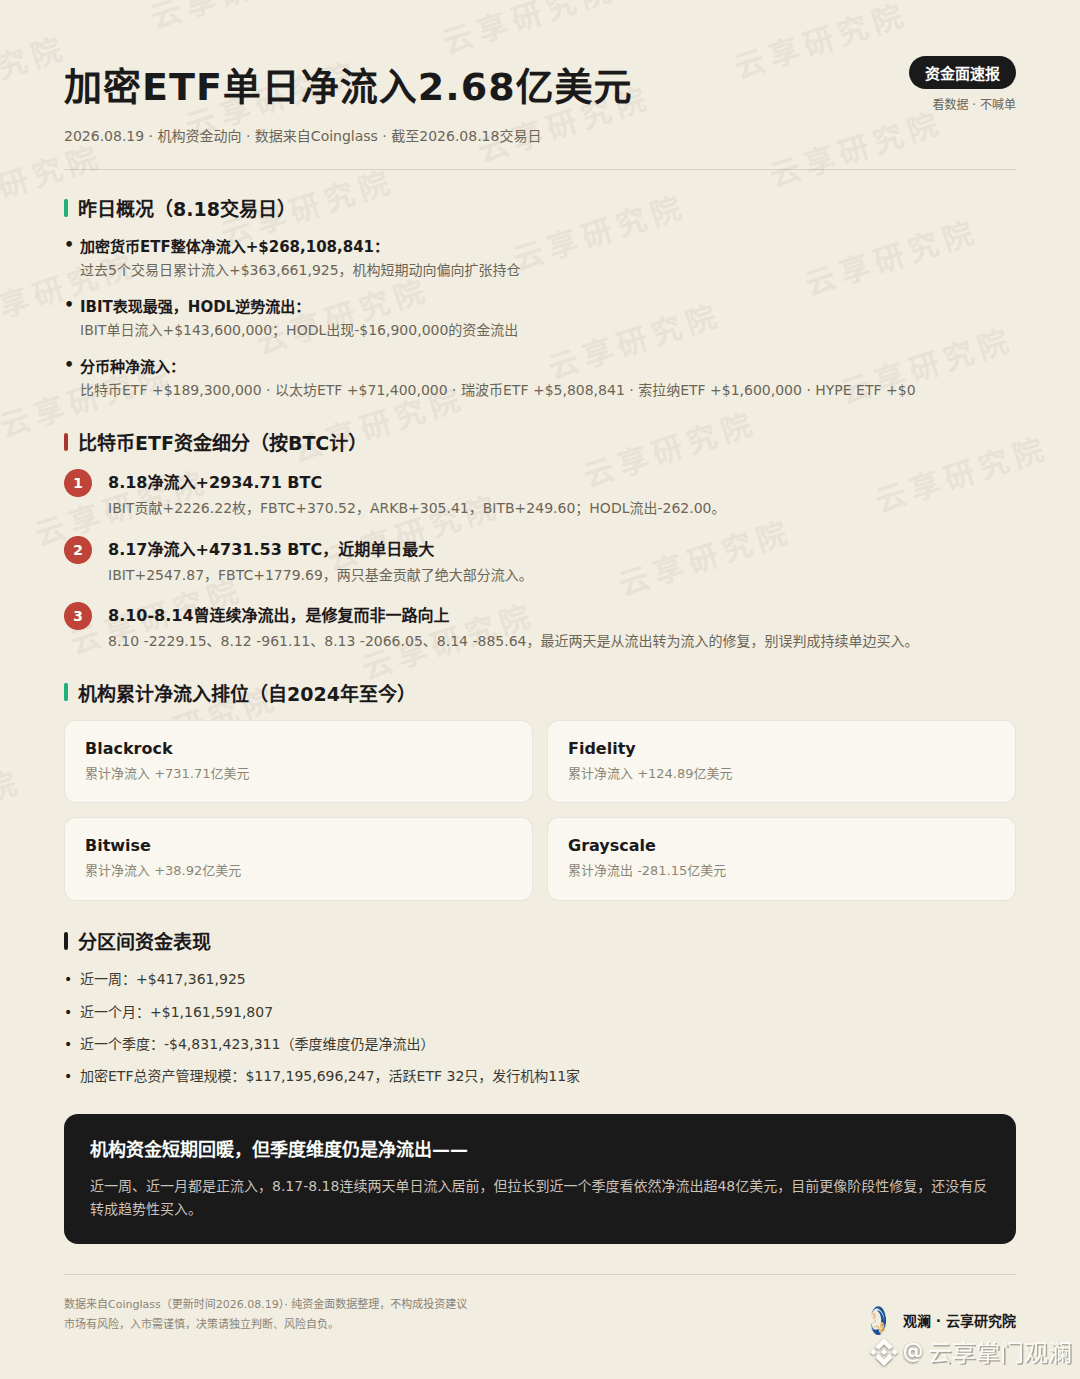
[Yunxiang Research Institute · Capital Flow Speed Report] Crypto ETFs saw a daily net inflow of $268.0 million
Data source: Coinglass, as of the trading day of 2026.08.18.
Yesterday’s snapshot: Total net inflow for crypto currency ETFs was +$268,108,841. Over the past 5 trading days, cumulative net inflow reached +$363,661,925. In the short term, institutional positioning appears inclined toward expanding holdings. IBIT delivered the strongest performance, with a daily inflow of +$143,600,000; HODL saw a cash outflow of -$16,900,000. By coin: Bitcoin ETFs +$189,300,000; Ethereum ETFs +$71,400,000; Ripple (XRP) ETFs +$5,808,841; Solana ETFs +$1,600,000; HYPE ETFs +$0.
Bitcoin ETF capital breakdown (in BTC terms): 8.18 net inflow +2934.71 BTC. IBIT contributed +2226.22, FBTC +370.52, ARKB +305.41, BITB +249.60, and HODL had an outflow of -262.00. On 8.17, net inflow was +4731.53 BTC, the largest single-day figure recently. IBIT +2547.87 and FBTC +1779.69 accounted for most of it. However, from 8.10 to 8.14 there were consecutive net outflows (8.10 -2229.15, 8.12 -961.11, 8.13 -2066.05, 8.14 -885.64). The past two days have been a repair phase shifting from outflow to inflow—don’t misread it as a sustained one-way buying trend.
Ranking by cumulative net inflow (from 2024 to today): Blackrock +$73.171B, Fidelity +$12.489B, Bitwise +$3.892B. Grayscale, on the other hand, is a cumulative net outflow of -$28.115B.
Fund performance by time window: Past week +$417,361,925; past month +$1,161,591,807; past quarter -$4,831,423,311. On a quarterly basis, it’s still a net outflow. Total AUM for crypto ETFs: $117,195,696,247. Number of active ETFs: 32. Number of issuing institutions: 11.
Personal view: Institutional capital has indeed been warming up in the short term. It ranks near the top with two consecutive days of net inflows on 8.17–8.18, but when you extend the horizon to roughly the last quarter, it still shows a net outflow of over $4.8B. Right now, it looks more like a phase of rebalancing/repair rather than a full trend reversal into sustained buying. Don’t treat short-term data as a conclusion.
The above is only my personal market record and observation and does not constitute any investment advice. The market has risk, and decisions should be made independently.
— Looking Out @ Yunxiang Research Institute
[Yunxiang Research Institute · Capital Flow Speed Report] Crypto ETFs saw a daily net inflow of $268.0 million
Data source: Coinglass, as of the trading day of 2026.08.18.
Yesterday’s snapshot: Total net inflow for crypto currency ETFs was +$268,108,841. Over the past 5 trading days, cumulative net inflow reached +$363,661,925. In the short term, institutional positioning appears inclined toward expanding holdings. IBIT delivered the strongest performance, with a daily inflow of +$143,600,000; HODL saw a cash outflow of -$16,900,000. By coin: Bitcoin ETFs +$189,300,000; Ethereum ETFs +$71,400,000; Ripple (XRP) ETFs +$5,808,841; Solana ETFs +$1,600,000; HYPE ETFs +$0.
Bitcoin ETF capital breakdown (in BTC terms): 8.18 net inflow +2934.71 BTC. IBIT contributed +2226.22, FBTC +370.52, ARKB +305.41, BITB +249.60, and HODL had an outflow of -262.00. On 8.17, net inflow was +4731.53 BTC, the largest single-day figure recently. IBIT +2547.87 and FBTC +1779.69 accounted for most of it. However, from 8.10 to 8.14 there were consecutive net outflows (8.10 -2229.15, 8.12 -961.11, 8.13 -2066.05, 8.14 -885.64). The past two days have been a repair phase shifting from outflow to inflow—don’t misread it as a sustained one-way buying trend.
Ranking by cumulative net inflow (from 2024 to today): Blackrock +$73.171B, Fidelity +$12.489B, Bitwise +$3.892B. Grayscale, on the other hand, is a cumulative net outflow of -$28.115B.
Fund performance by time window: Past week +$417,361,925; past month +$1,161,591,807; past quarter -$4,831,423,311. On a quarterly basis, it’s still a net outflow. Total AUM for crypto ETFs: $117,195,696,247. Number of active ETFs: 32. Number of issuing institutions: 11.
Personal view: Institutional capital has indeed been warming up in the short term. It ranks near the top with two consecutive days of net inflows on 8.17–8.18, but when you extend the horizon to roughly the last quarter, it still shows a net outflow of over $4.8B. Right now, it looks more like a phase of rebalancing/repair rather than a full trend reversal into sustained buying. Don’t treat short-term data as a conclusion.
The above is only my personal market record and observation and does not constitute any investment advice. The market has risk, and decisions should be made independently.
— Looking Out @ Yunxiang Research Institute
Data source: Coinglass, as of the trading day of 2026.08.18.
Yesterday’s snapshot: Total net inflow for crypto currency ETFs was +$268,108,841. Over the past 5 trading days, cumulative net inflow reached +$363,661,925. In the short term, institutional positioning appears inclined toward expanding holdings. IBIT delivered the strongest performance, with a daily inflow of +$143,600,000; HODL saw a cash outflow of -$16,900,000. By coin: Bitcoin ETFs +$189,300,000; Ethereum ETFs +$71,400,000; Ripple (XRP) ETFs +$5,808,841; Solana ETFs +$1,600,000; HYPE ETFs +$0.
Bitcoin ETF capital breakdown (in BTC terms): 8.18 net inflow +2934.71 BTC. IBIT contributed +2226.22, FBTC +370.52, ARKB +305.41, BITB +249.60, and HODL had an outflow of -262.00. On 8.17, net inflow was +4731.53 BTC, the largest single-day figure recently. IBIT +2547.87 and FBTC +1779.69 accounted for most of it. However, from 8.10 to 8.14 there were consecutive net outflows (8.10 -2229.15, 8.12 -961.11, 8.13 -2066.05, 8.14 -885.64). The past two days have been a repair phase shifting from outflow to inflow—don’t misread it as a sustained one-way buying trend.
Ranking by cumulative net inflow (from 2024 to today): Blackrock +$73.171B, Fidelity +$12.489B, Bitwise +$3.892B. Grayscale, on the other hand, is a cumulative net outflow of -$28.115B.
Fund performance by time window: Past week +$417,361,925; past month +$1,161,591,807; past quarter -$4,831,423,311. On a quarterly basis, it’s still a net outflow. Total AUM for crypto ETFs: $117,195,696,247. Number of active ETFs: 32. Number of issuing institutions: 11.
Personal view: Institutional capital has indeed been warming up in the short term. It ranks near the top with two consecutive days of net inflows on 8.17–8.18, but when you extend the horizon to roughly the last quarter, it still shows a net outflow of over $4.8B. Right now, it looks more like a phase of rebalancing/repair rather than a full trend reversal into sustained buying. Don’t treat short-term data as a conclusion.
The above is only my personal market record and observation and does not constitute any investment advice. The market has risk, and decisions should be made independently.
— Looking Out @ Yunxiang Research Institute
1
1
5.8k
·
--
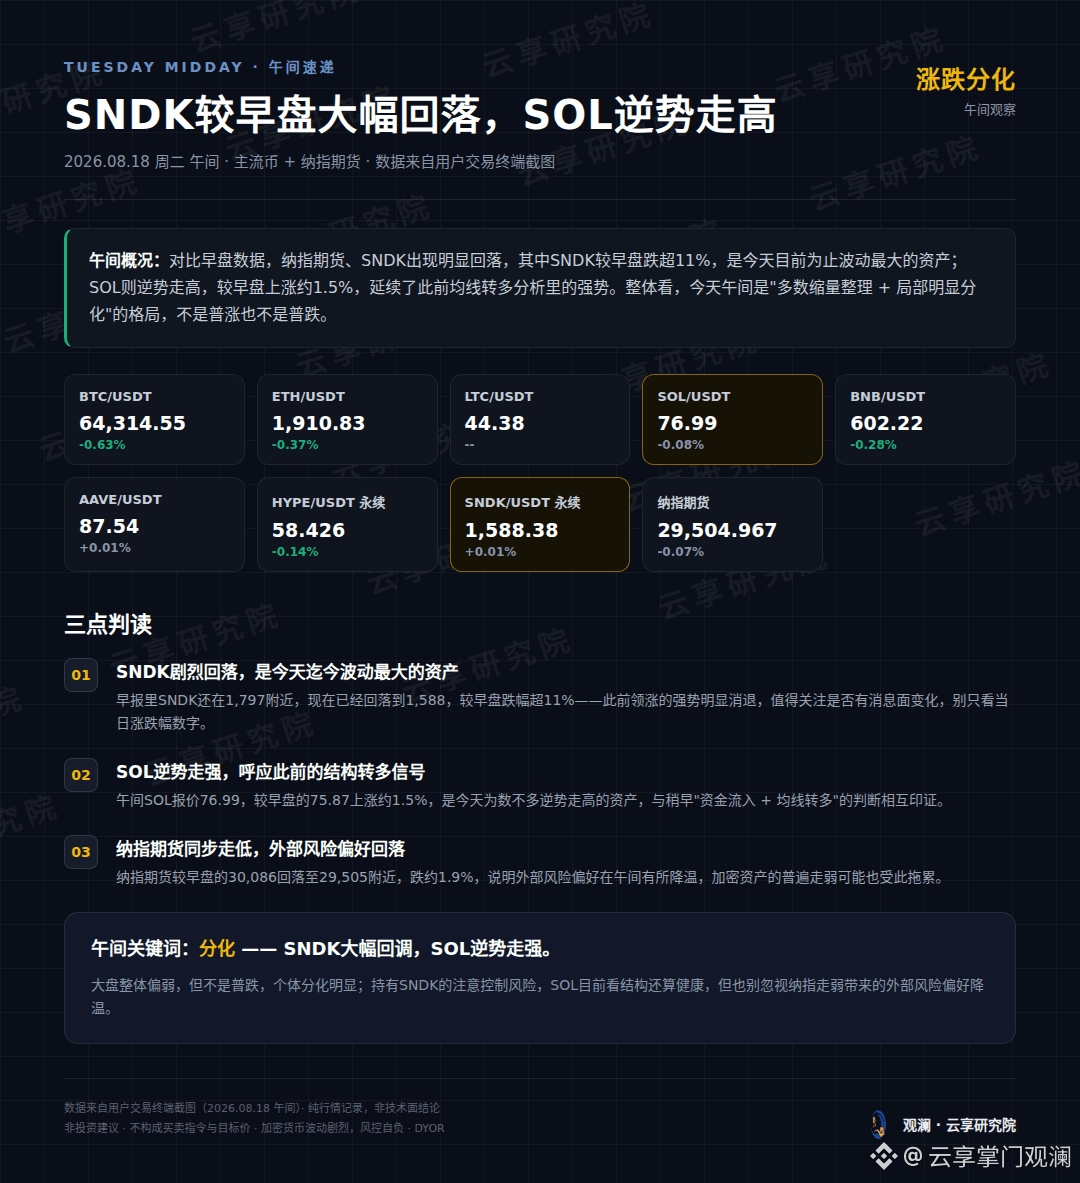
【Yunxiang Research Institute·Midday Quick Update】August 18, Tuesday Midday
Compared with the early-morning data, Nasdaq index futures and SNDK both saw a clear pullback. In particular, SNDK fell more than 11% from the early session, making it the most volatile asset so far today. Meanwhile, SOL moved higher against the trend, up about 1.5% from the early session. Overall, at midday, the market is in a pattern of "mostly lower-volume consolidation + localized, significant divergence".
Three points to judge:
01 SNDK’s sharp drop—it's the most volatile asset so far today. In the morning news report, SNDK was still around 1,797, but it has now fallen to 1,588, a decline of over 11% versus the early session. The strong leadership it previously showed has clearly faded. It’s worth paying attention to whether there has been any change on the news front—don’t just look at that day’s percentage move.$SOL
{future}(SOLUSDT)
02 SOL strengthens against the trend, echoing the prior structural signals turning bullish. At midday, SOL is quoted at 76.99, up about 1.5% from the early-session 75.87. It’s one of the few assets moving higher against the trend today, mutually corroborating the earlier assessment of "funds inflow + moving averages turning bullish."
03 Nasdaq index futures move lower in sync, indicating a retreat in external risk appetite. Nasdaq index futures fell from the early-session 30,086 to around 29,505, down about 1.9%, suggesting that external risk appetite has cooled somewhat by midday. The widespread weakness in crypto assets may also be dragged down by this.
Midday keywords: divergence. The broader market is relatively weak, but it isn’t a broad sell-off—there is clear differentiation among individual names. If you hold SNDK, be sure to manage risk. SOL still looks structurally healthy for now, but don’t ignore the external risk-appetite cooling brought by Nasdaq’s weakness.
The above is only my personal market notes and observations, and does not constitute any investment advice. Markets involve risk; decisions must be made independently.$SNDK
{future}(SNDKUSDT)
—— GuoLan @ Yunxiang Research Institute
【Yunxiang Research Institute·Midday Quick Update】August 18, Tuesday Midday
Compared with the early-morning data, Nasdaq index futures and SNDK both saw a clear pullback. In particular, SNDK fell more than 11% from the early session, making it the most volatile asset so far today. Meanwhile, SOL moved higher against the trend, up about 1.5% from the early session. Overall, at midday, the market is in a pattern of "mostly lower-volume consolidation + localized, significant divergence".
Three points to judge:
01 SNDK’s sharp drop—it's the most volatile asset so far today. In the morning news report, SNDK was still around 1,797, but it has now fallen to 1,588, a decline of over 11% versus the early session. The strong leadership it previously showed has clearly faded. It’s worth paying attention to whether there has been any change on the news front—don’t just look at that day’s percentage move.$SOL
02 SOL strengthens against the trend, echoing the prior structural signals turning bullish. At midday, SOL is quoted at 76.99, up about 1.5% from the early-session 75.87. It’s one of the few assets moving higher against the trend today, mutually corroborating the earlier assessment of "funds inflow + moving averages turning bullish."
03 Nasdaq index futures move lower in sync, indicating a retreat in external risk appetite. Nasdaq index futures fell from the early-session 30,086 to around 29,505, down about 1.9%, suggesting that external risk appetite has cooled somewhat by midday. The widespread weakness in crypto assets may also be dragged down by this.
Midday keywords: divergence. The broader market is relatively weak, but it isn’t a broad sell-off—there is clear differentiation among individual names. If you hold SNDK, be sure to manage risk. SOL still looks structurally healthy for now, but don’t ignore the external risk-appetite cooling brought by Nasdaq’s weakness.
The above is only my personal market notes and observations, and does not constitute any investment advice. Markets involve risk; decisions must be made independently.$SNDK
—— GuoLan @ Yunxiang Research Institute
Compared with the early-morning data, Nasdaq index futures and SNDK both saw a clear pullback. In particular, SNDK fell more than 11% from the early session, making it the most volatile asset so far today. Meanwhile, SOL moved higher against the trend, up about 1.5% from the early session. Overall, at midday, the market is in a pattern of "mostly lower-volume consolidation + localized, significant divergence".
Three points to judge:
01 SNDK’s sharp drop—it's the most volatile asset so far today. In the morning news report, SNDK was still around 1,797, but it has now fallen to 1,588, a decline of over 11% versus the early session. The strong leadership it previously showed has clearly faded. It’s worth paying attention to whether there has been any change on the news front—don’t just look at that day’s percentage move.$SOL
02 SOL strengthens against the trend, echoing the prior structural signals turning bullish. At midday, SOL is quoted at 76.99, up about 1.5% from the early-session 75.87. It’s one of the few assets moving higher against the trend today, mutually corroborating the earlier assessment of "funds inflow + moving averages turning bullish."
03 Nasdaq index futures move lower in sync, indicating a retreat in external risk appetite. Nasdaq index futures fell from the early-session 30,086 to around 29,505, down about 1.9%, suggesting that external risk appetite has cooled somewhat by midday. The widespread weakness in crypto assets may also be dragged down by this.
Midday keywords: divergence. The broader market is relatively weak, but it isn’t a broad sell-off—there is clear differentiation among individual names. If you hold SNDK, be sure to manage risk. SOL still looks structurally healthy for now, but don’t ignore the external risk-appetite cooling brought by Nasdaq’s weakness.
The above is only my personal market notes and observations, and does not constitute any investment advice. Markets involve risk; decisions must be made independently.$SNDK
—— GuoLan @ Yunxiang Research Institute
419
Log in to explore more content
Join global crypto users on Binance Square
⚡️ Get latest and useful information about crypto.
💬 Trusted by the world’s largest crypto exchange.
👍 Discover real insights from verified creators.
Email / Phone number
Trending Topics
AppleDebutsFoldablePhone
672 views
60 Discussing
#appledebutsfoldablephone iPhone Fold 2026: Apple’s Secret Plan to Kill the Samsung Galaxy Z Fold 8iPhone Fold 2026: Apple’s Secret Plan to Kill the Samsung Galaxy Z Fold 8
Apple is poised to make its long-anticipated entry into the foldable smartphone market with the iPhone Fold, set for release in 2026. This strategic move positions Apple as a direct competitor to Samsung, which has maintained a dominant presence in the foldable segment since the launch of its Galaxy Z Fold series in 2019. By using its globally recognized brand and tightly integrated ecosystem, Apple aims to challenge Samsung’s leadership. However, this ambitious step brings with it critical considerations, including pricing strategies, supply chain readiness, and consumer trust in a first-generation foldable device.$NIL $IDOL $SPORTFUN
Isabella-I
·1 Likes
·6 views
US10YTreasuryYieldHitsHighestSinceNov2023
4,303 views
123 Discussing
USTreasuryToBuyBackUpTo$6BLongDatedDebt
8,693 views
127 Discussing