

Waw 1
175 Posts

Waw 1
Report
Block User
Trader & Builder Arc | Founder: @ReverseAgency
0 Following
2 Followers
5 Liked
Posts
·
--
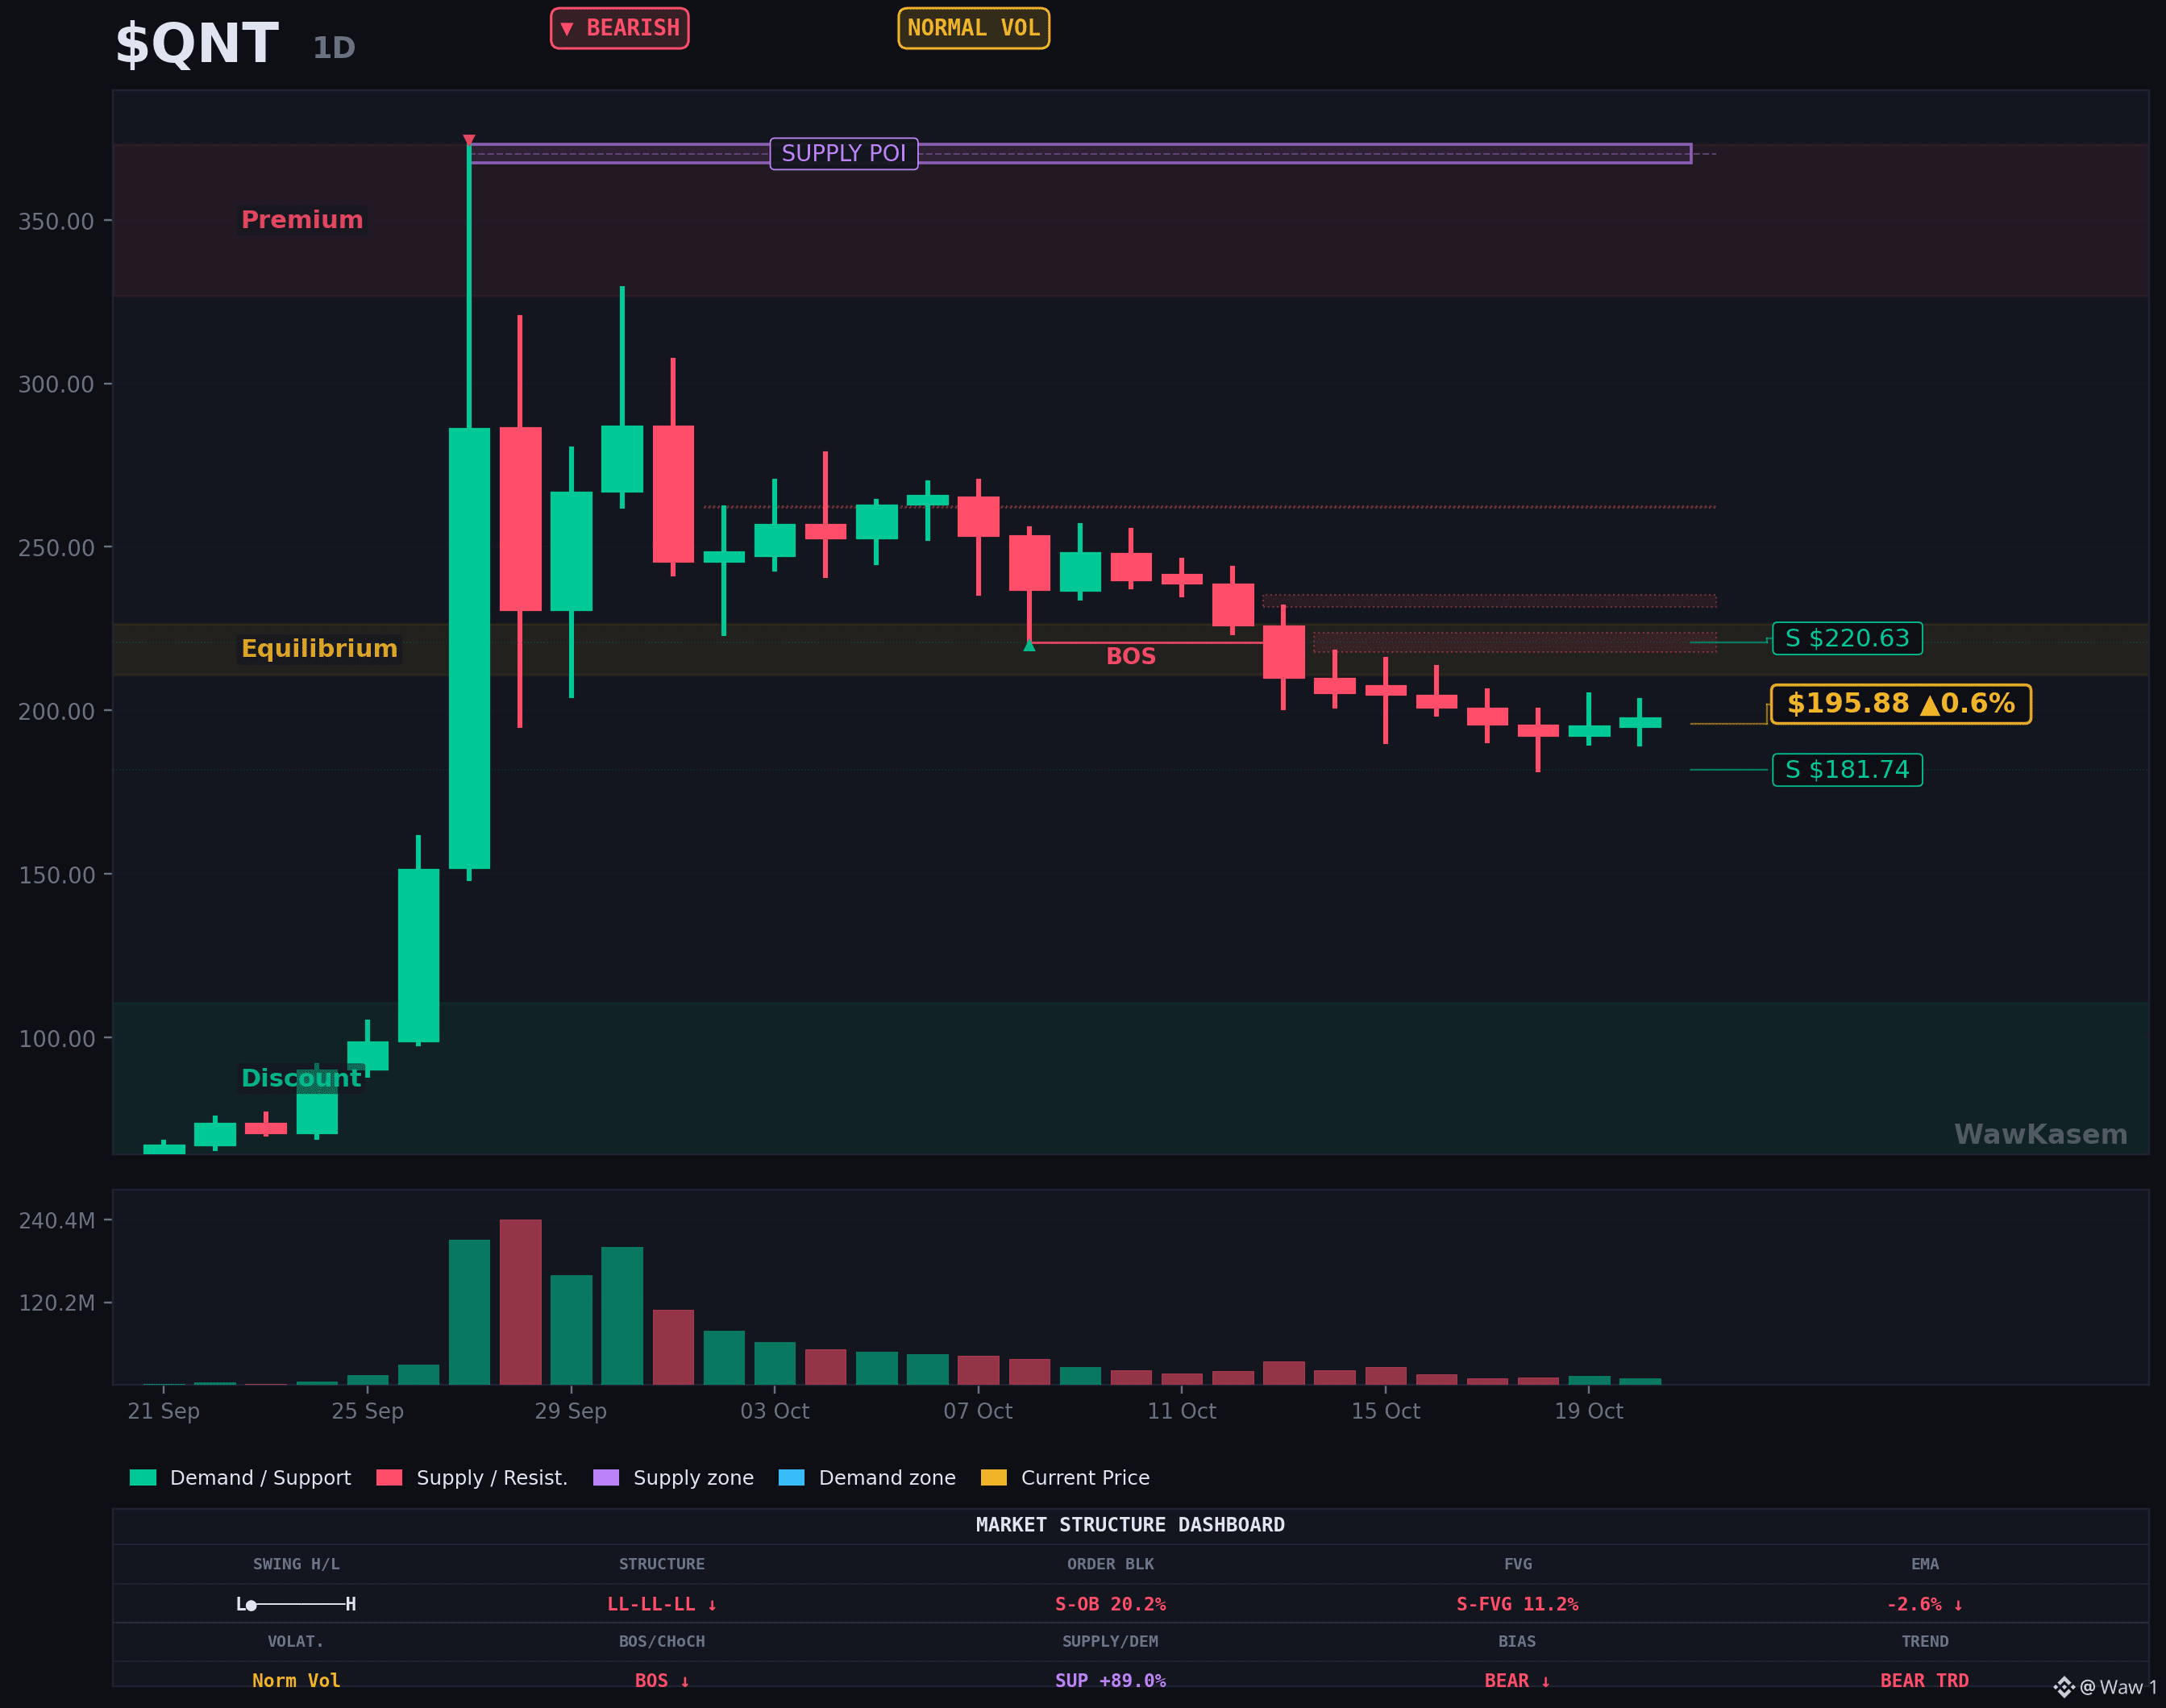
$QNT trades at 196.10 and is up 205.6 percent over thirty days. That number hides the other half of the story.
Almost all of it happened in one session. On 27 September the token opened at 151.60, printed 373.00 intraday and closed at 286.26 on 210.8 million of spot volume. The session before had traded 29.4 million. The session after traded 240.4 million.
Since that wick the price has given back 47.4 percent. The highest close of the twenty three sessions that followed is 287.15 on 30 September, the last seven completed sessions have all closed below 210, and the token has not traded above 217.73 since 13 October.
The part worth measuring is not the drawdown, it is the participation. Rolling volume over the last twenty four hours is 10.3 million against a thirty day average of 51.8 million, so a fifth of normal. The session of 17 October finished at 9.0 million, the thinnest completed day since 24 September, which is the day before the move started. Average daily range has fallen from 12.12 percent over the twelve sessions before last week to 9.98 percent over the last seven.
Positioning says the same thing. Open interest on the perpetual was 52,329 tokens on 21 September and reads 148,220 now, after topping out at 157,992 at 03:00 this morning. The long short account ratio has spent the last twelve hours between 0.9786 and 1.0153, which is parity. Nobody is leaning either way on a token that tripled in a month.
Spot sits 7.9 percent above the 181.74 low of 18 October and 9.9 percent below the 217.73 high of 14 October.
Follow for the data behind the move, not the headline.
#quant #altcoin #crypto #defi #bitcoin
47
·
--
$NEAR trades at 4.9370, back to flat on the day at minus 0.1 percent after tagging 4.6340 this morning. The bounce off that low is 6.5 percent.
Turnover was 121.24M over the last 24 hours against a 30 day average of 201.68M, so 0.60x, across 459,654 trades. The full round trip down and back up happened on under two thirds of the usual volume.
Open interest carries the story of the dip. It stood at 52.76M tokens at 20:00 UTC yesterday, peaked at 53.96M at 10:00 this morning while price was still falling, and has eased back to 52.58M since. In dollar terms it went from 259.32M to 249.85M across the same window.
The positioning side is the part worth watching. The long short account ratio bottomed at 1.4149 at 10:00, then printed 1.4361, 1.4468, 1.4802 and 1.5056 at 14:00. Four consecutive hourly increases, taking it to 60 accounts in 100 holding longs, with the biggest jump landing after the low was set.
Funding turned at the 08:00 settlement, minus 0.0018 percent, the first negative print since 16:00 on 18 October.
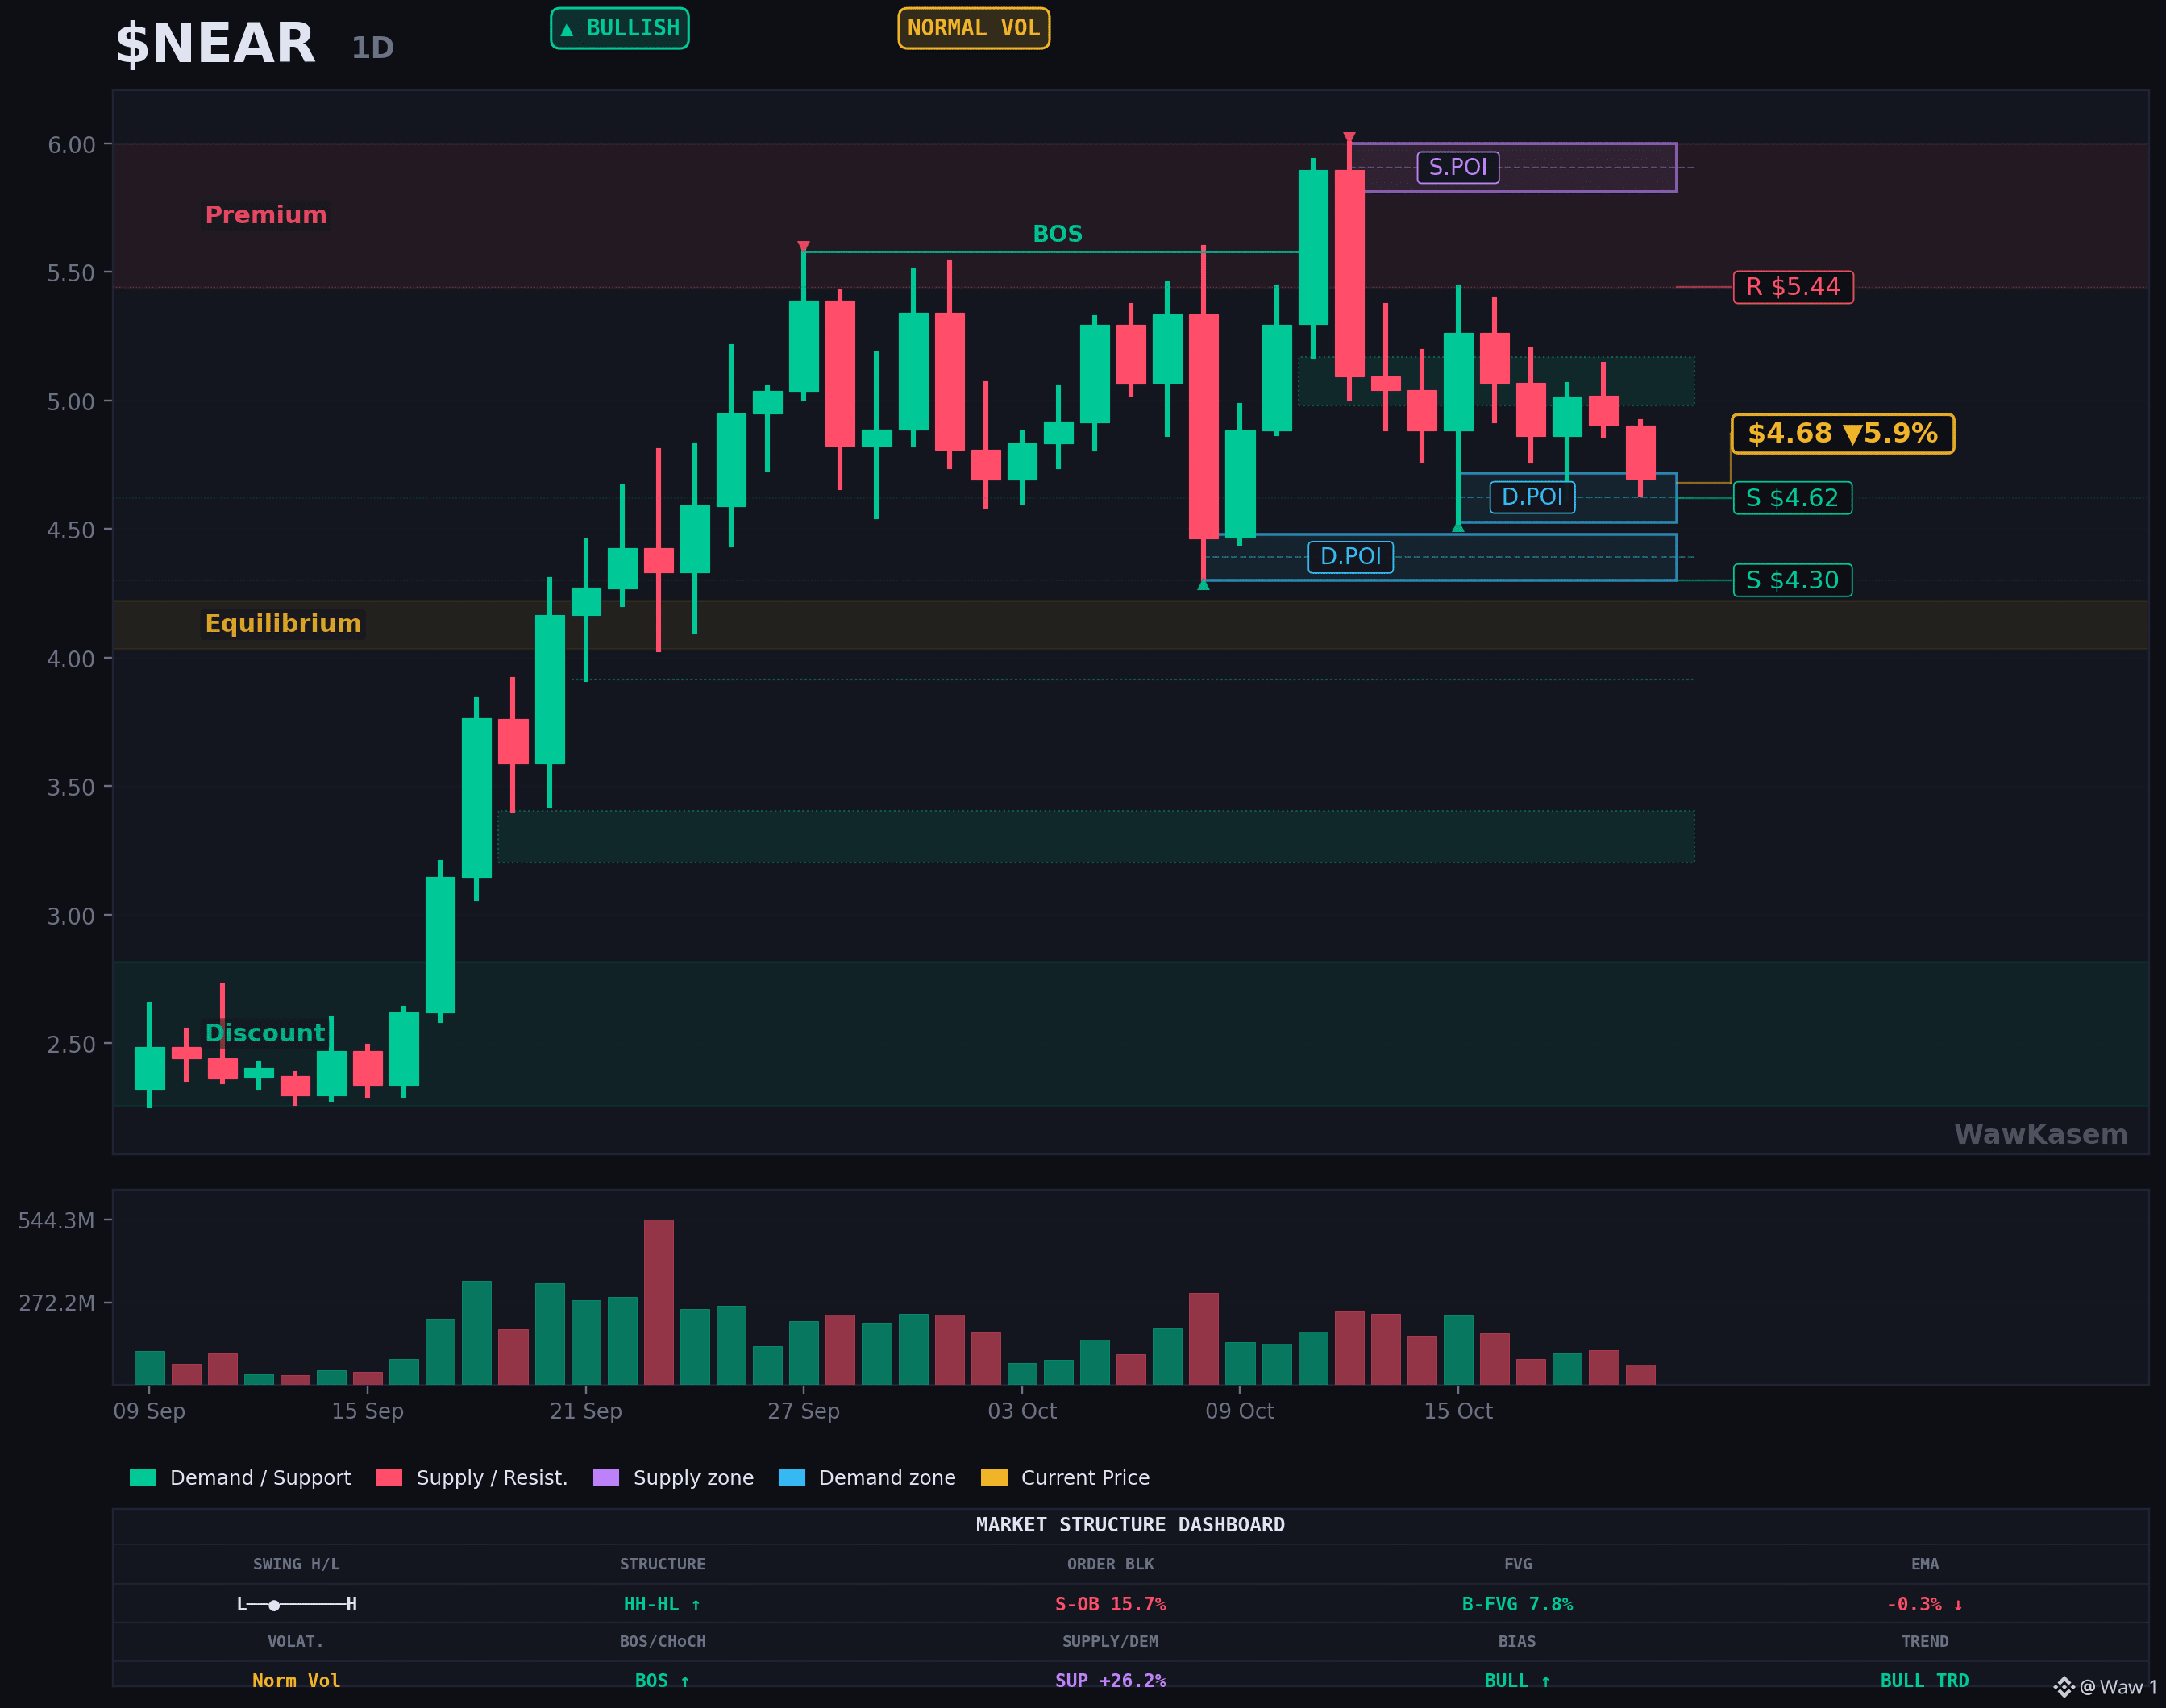
On the daily the trend is still higher highs and higher lows. The session low at 4.6340 landed on the 4.62 support that has held since 10 October, and the next level under it is 4.30. The 6.00 of 12 October sits 17.7 percent overhead, the 3.916 of 21 September is 26.1 percent down.
Rank 17, a 6.13B cap, and four straight hourly prints of accounts adding longs while it recovered.
Follow for the data behind the move, not the headline.
#near #altcoin #crypto #defi #bitcoin
56
·
--
$INJ is up 11.4% on the day, and the volume behind that move is the part worth looking at.
Start with the tape. The main USDT pair traded 9.4M over the last 24 hours against a 14.5M thirty day average. That is 65% of a normal day. A double digit green candle usually arrives with volume above average, not a third below it. Price ran from 6.899 to 7.81 and sits at 7.70.
Now the positioning. The long short account ratio on the perpetual is 0.84. Below one means more accounts are short than long. Over the last sixteen hours it moved 0.77, 0.77, 0.80, 0.84, so the short side is unwinding slowly while price climbs.
Step back a week and the picture flattens. $INJ is up 0.33% over seven days. Two days ago the daily candle wicked to 6.42 before closing at 6.75. Today gives back exactly that. It is a round trip, not a trend.
I looked for something dated today to explain it and found nothing. The closest dated event is October 6, when Canary Capital said its staked Injective product was imminently launching. That was four days before this candle, with no confirmation since.
What the chain produced is measurable. Fees over the last 24 hours: 8,028 dollars. Over 30 days: 227,642, every dollar of it routed back to holders. Lifetime: 39.3M. Against a market cap near 772M that is an annualized run rate around 2.8M. Injective is tagged as a real world assets protocol for its tokenized equity markets, and that is the revenue those markets generate today.
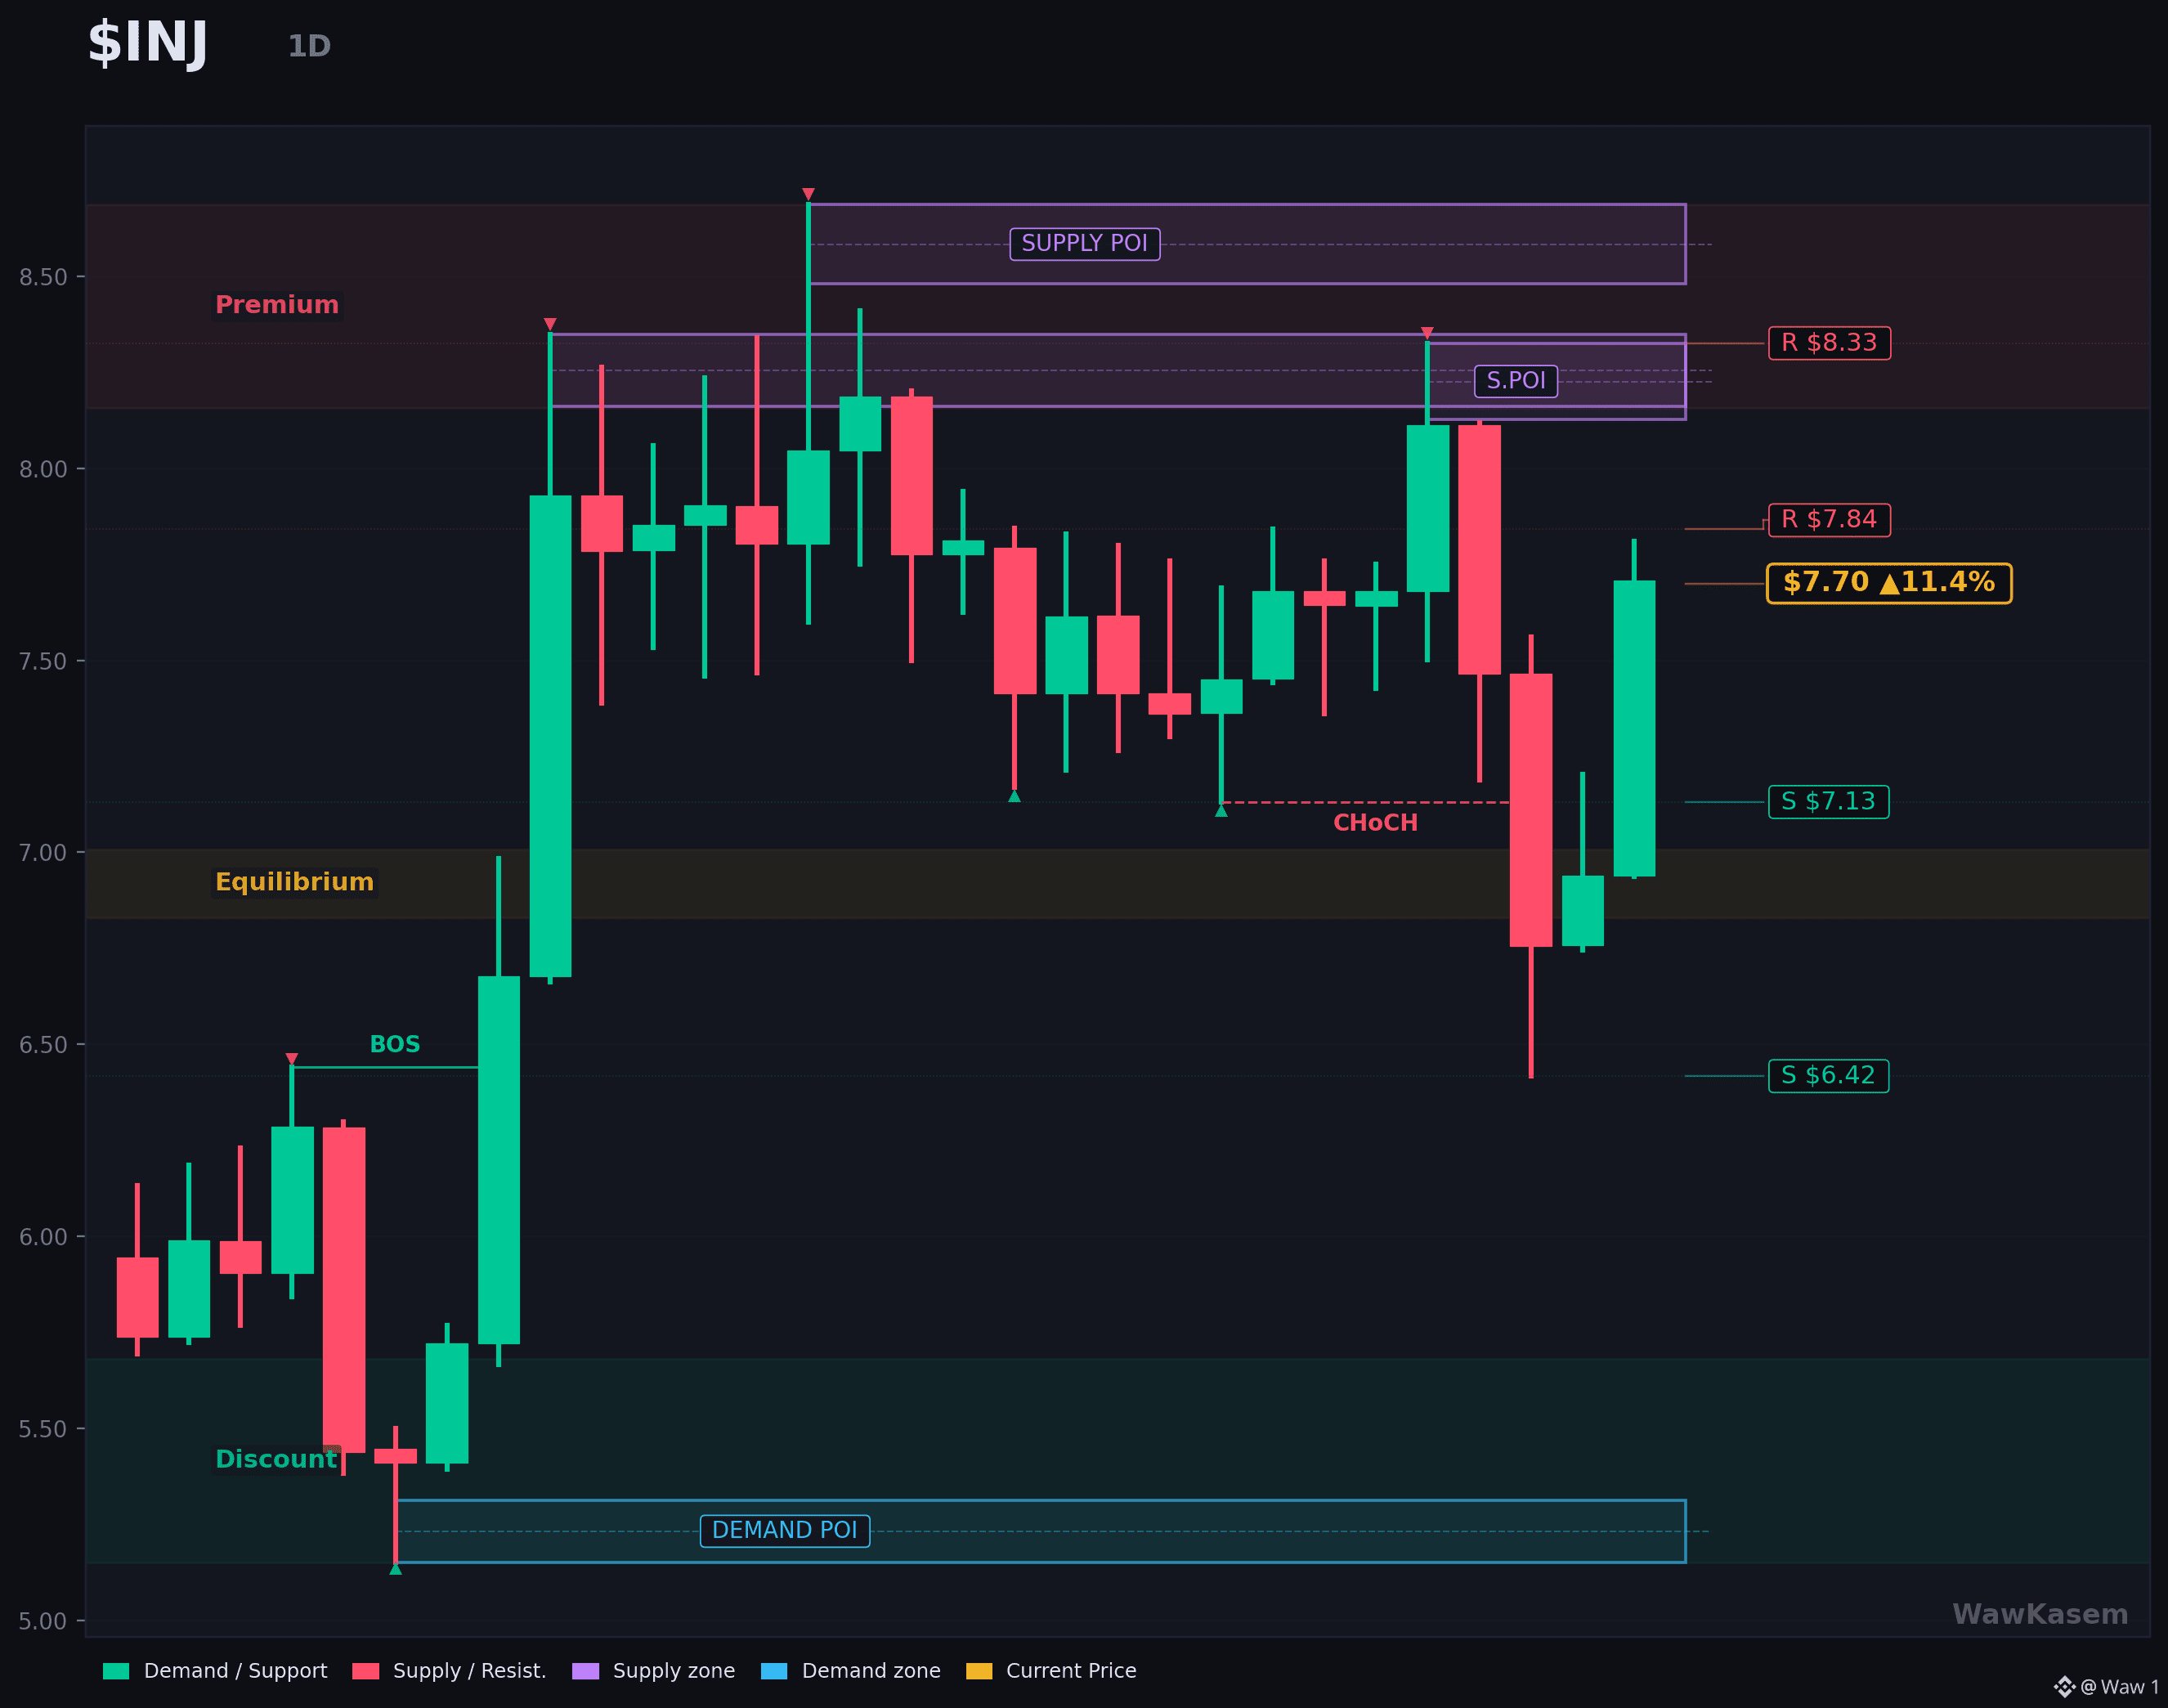
Levels: resistance at 7.84 then 8.33, support at 7.13 then 6.42. The 30 day range is 5.151 to 8.687.
Follow me for daily data driven breakdowns on trending coins.
#injective #rwa #defi #altcoin #crypto
38
·
--
$CARDS is up 133% over thirty days and the protocol behind it earned 1,077,862 dollars in the last twenty four hours alone. That second number is the one worth your time.
This is a real world asset play in the most literal sense. The protocol tokenizes graded physical trading cards and sells randomized packs against them, and every pack sold is revenue. Measured over the last thirty days that revenue is 15,515,682 dollars. Annualize it and you get roughly 189M against a 245M market cap, so the token trades at about 1.3 times sales. There are very few places in this market where you can write that sentence with a straight face, because almost nothing here has sales to measure.
Lifetime revenue is 108,717,168 dollars. This is not a narrative waiting for adoption, the adoption already happened and it is denominated in Pokemon cards.
Now the detail nobody is looking at. Revenue routed back to token holders over the last thirty days totals 11,574 dollars, and 8,086 of that landed in the last twenty four hours. In other words, the holder side of the machine was essentially switched off for a month and has just been switched back on. Lifetime, that line has paid out 748,306 dollars. Whether it stays on is the entire thesis from here, because a protocol earning a million a day that sends nothing to its token is just a good business with a ticker attached.
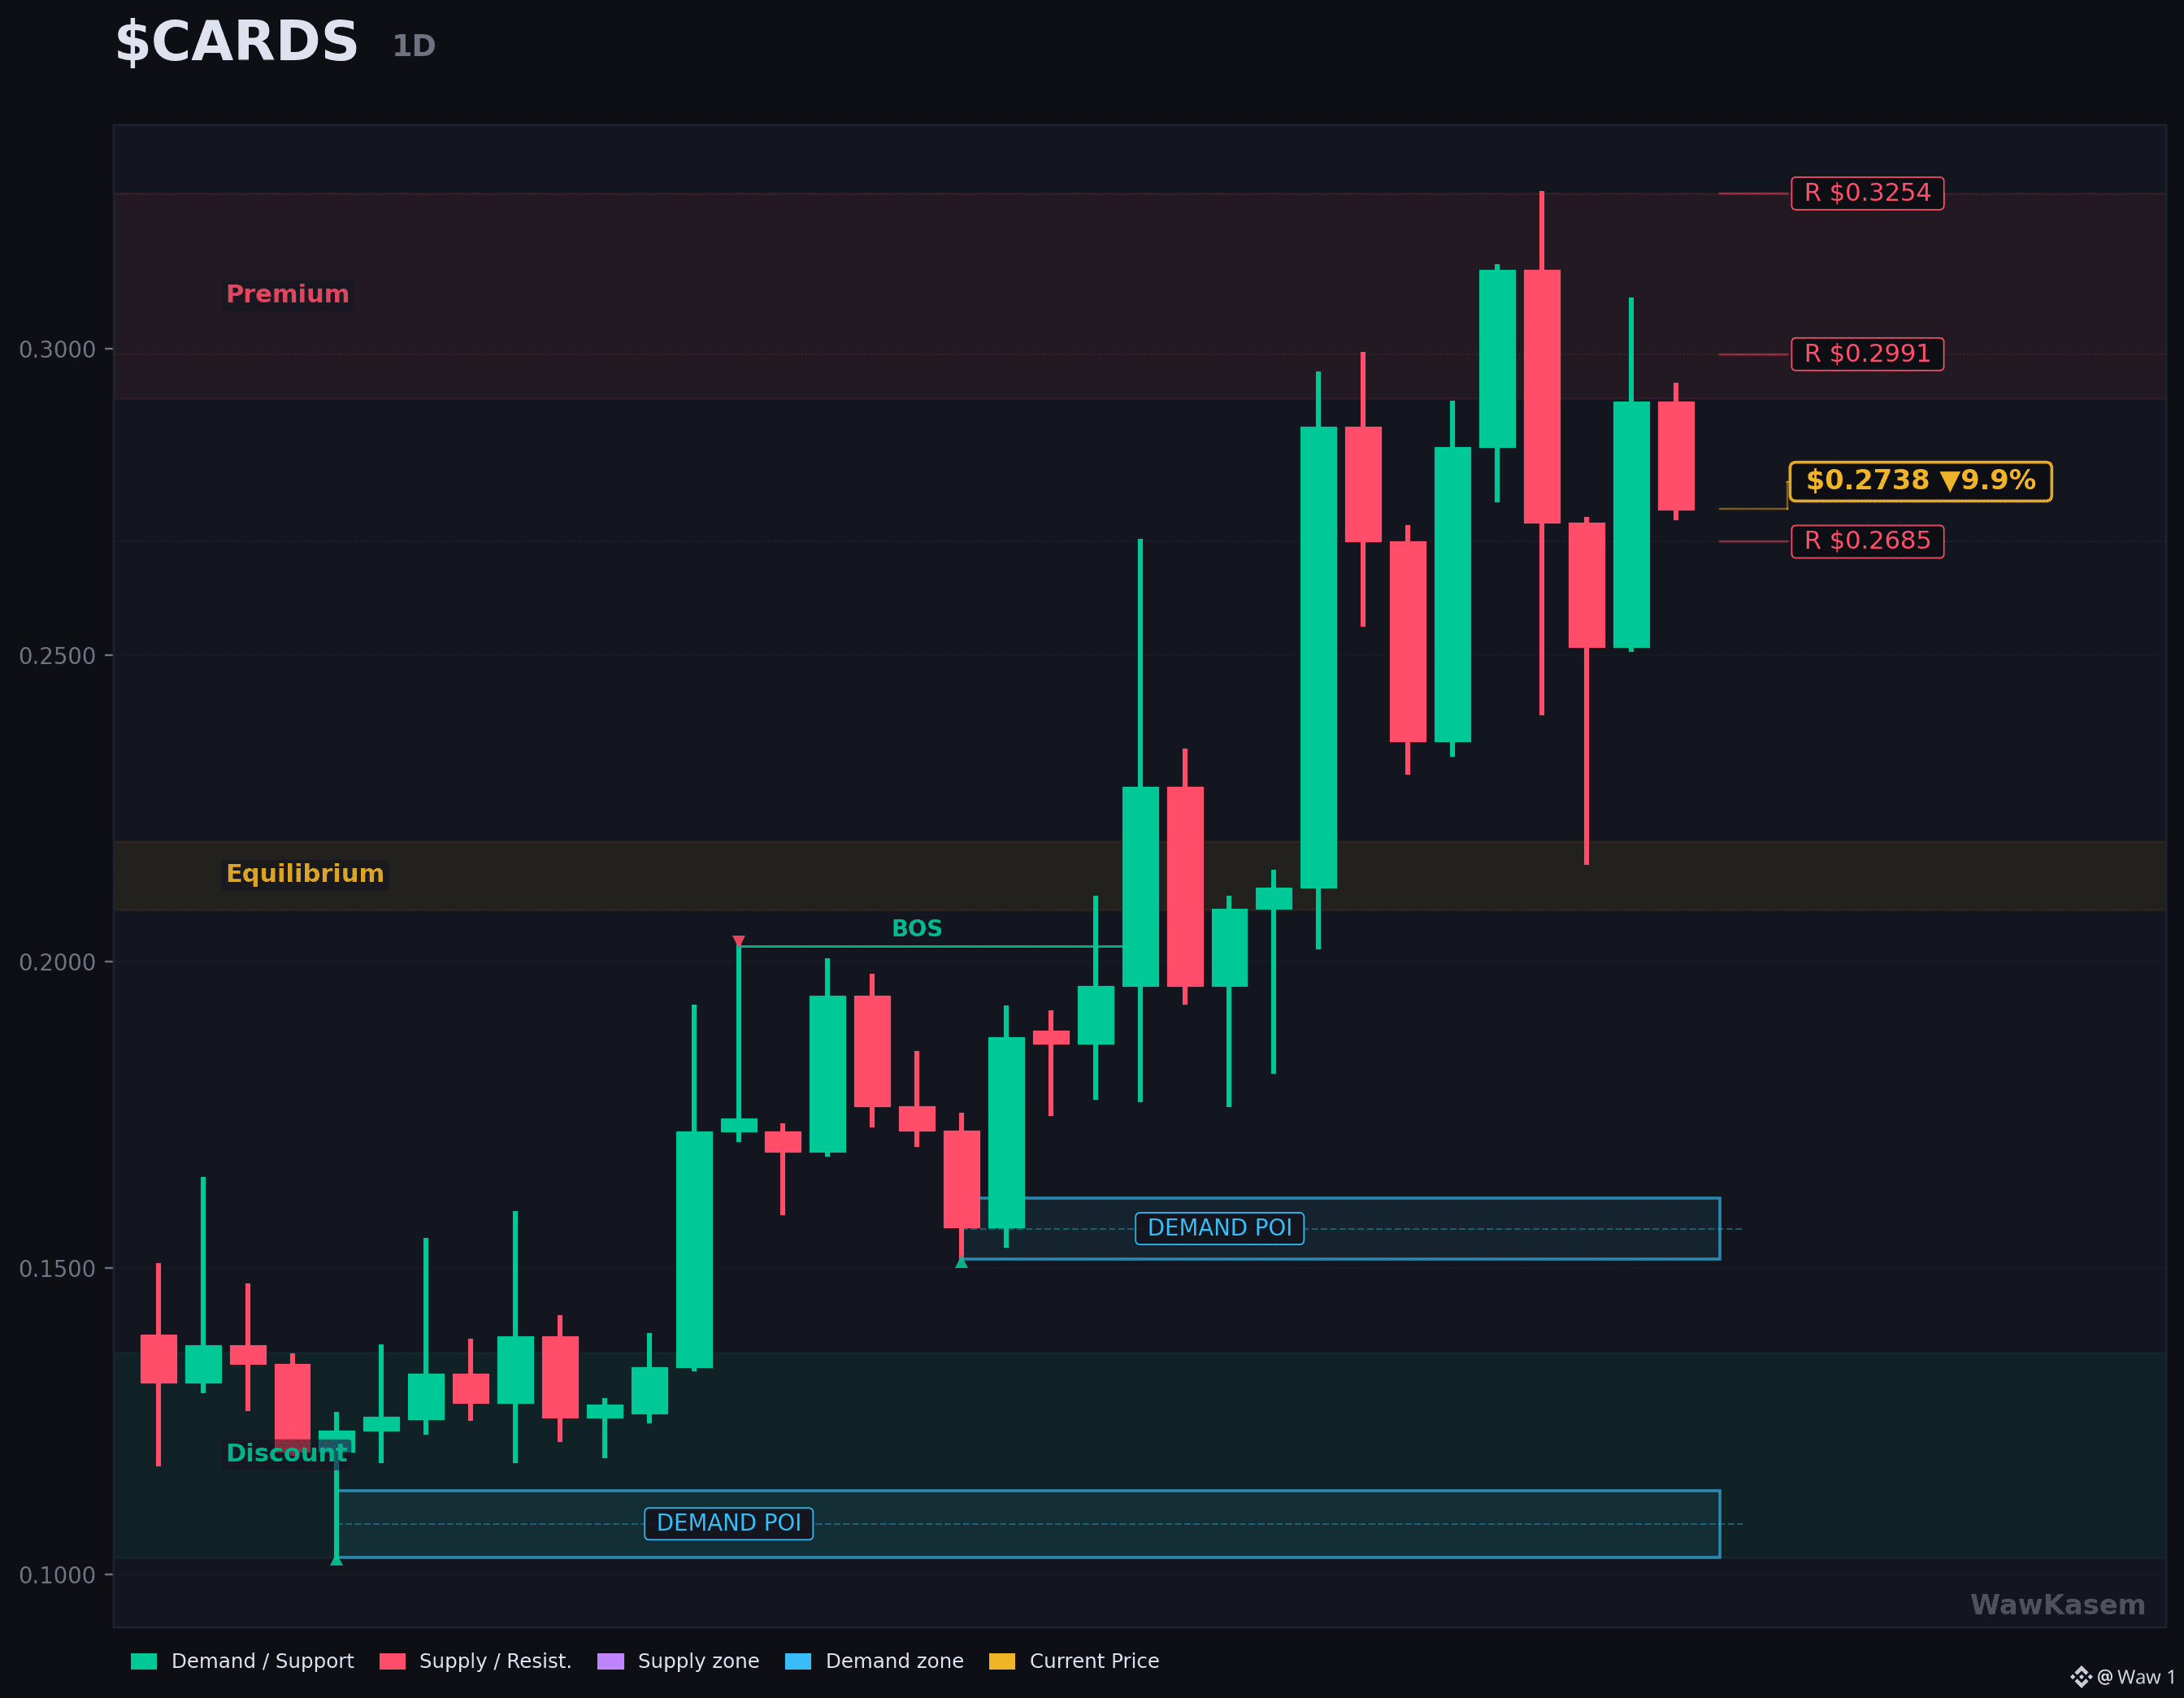
Levels: 0.3254 is the high and the first resistance, 0.2991 and 0.2685 are stacked under it, and price sits at 0.2738 after giving back 9.8% today. The demand zone from the September base sits between 0.155 and 0.165.
Follow me for daily on chain breakdowns like this one.
#cards #rwa #altcoin #crypto #solana
99
·
--
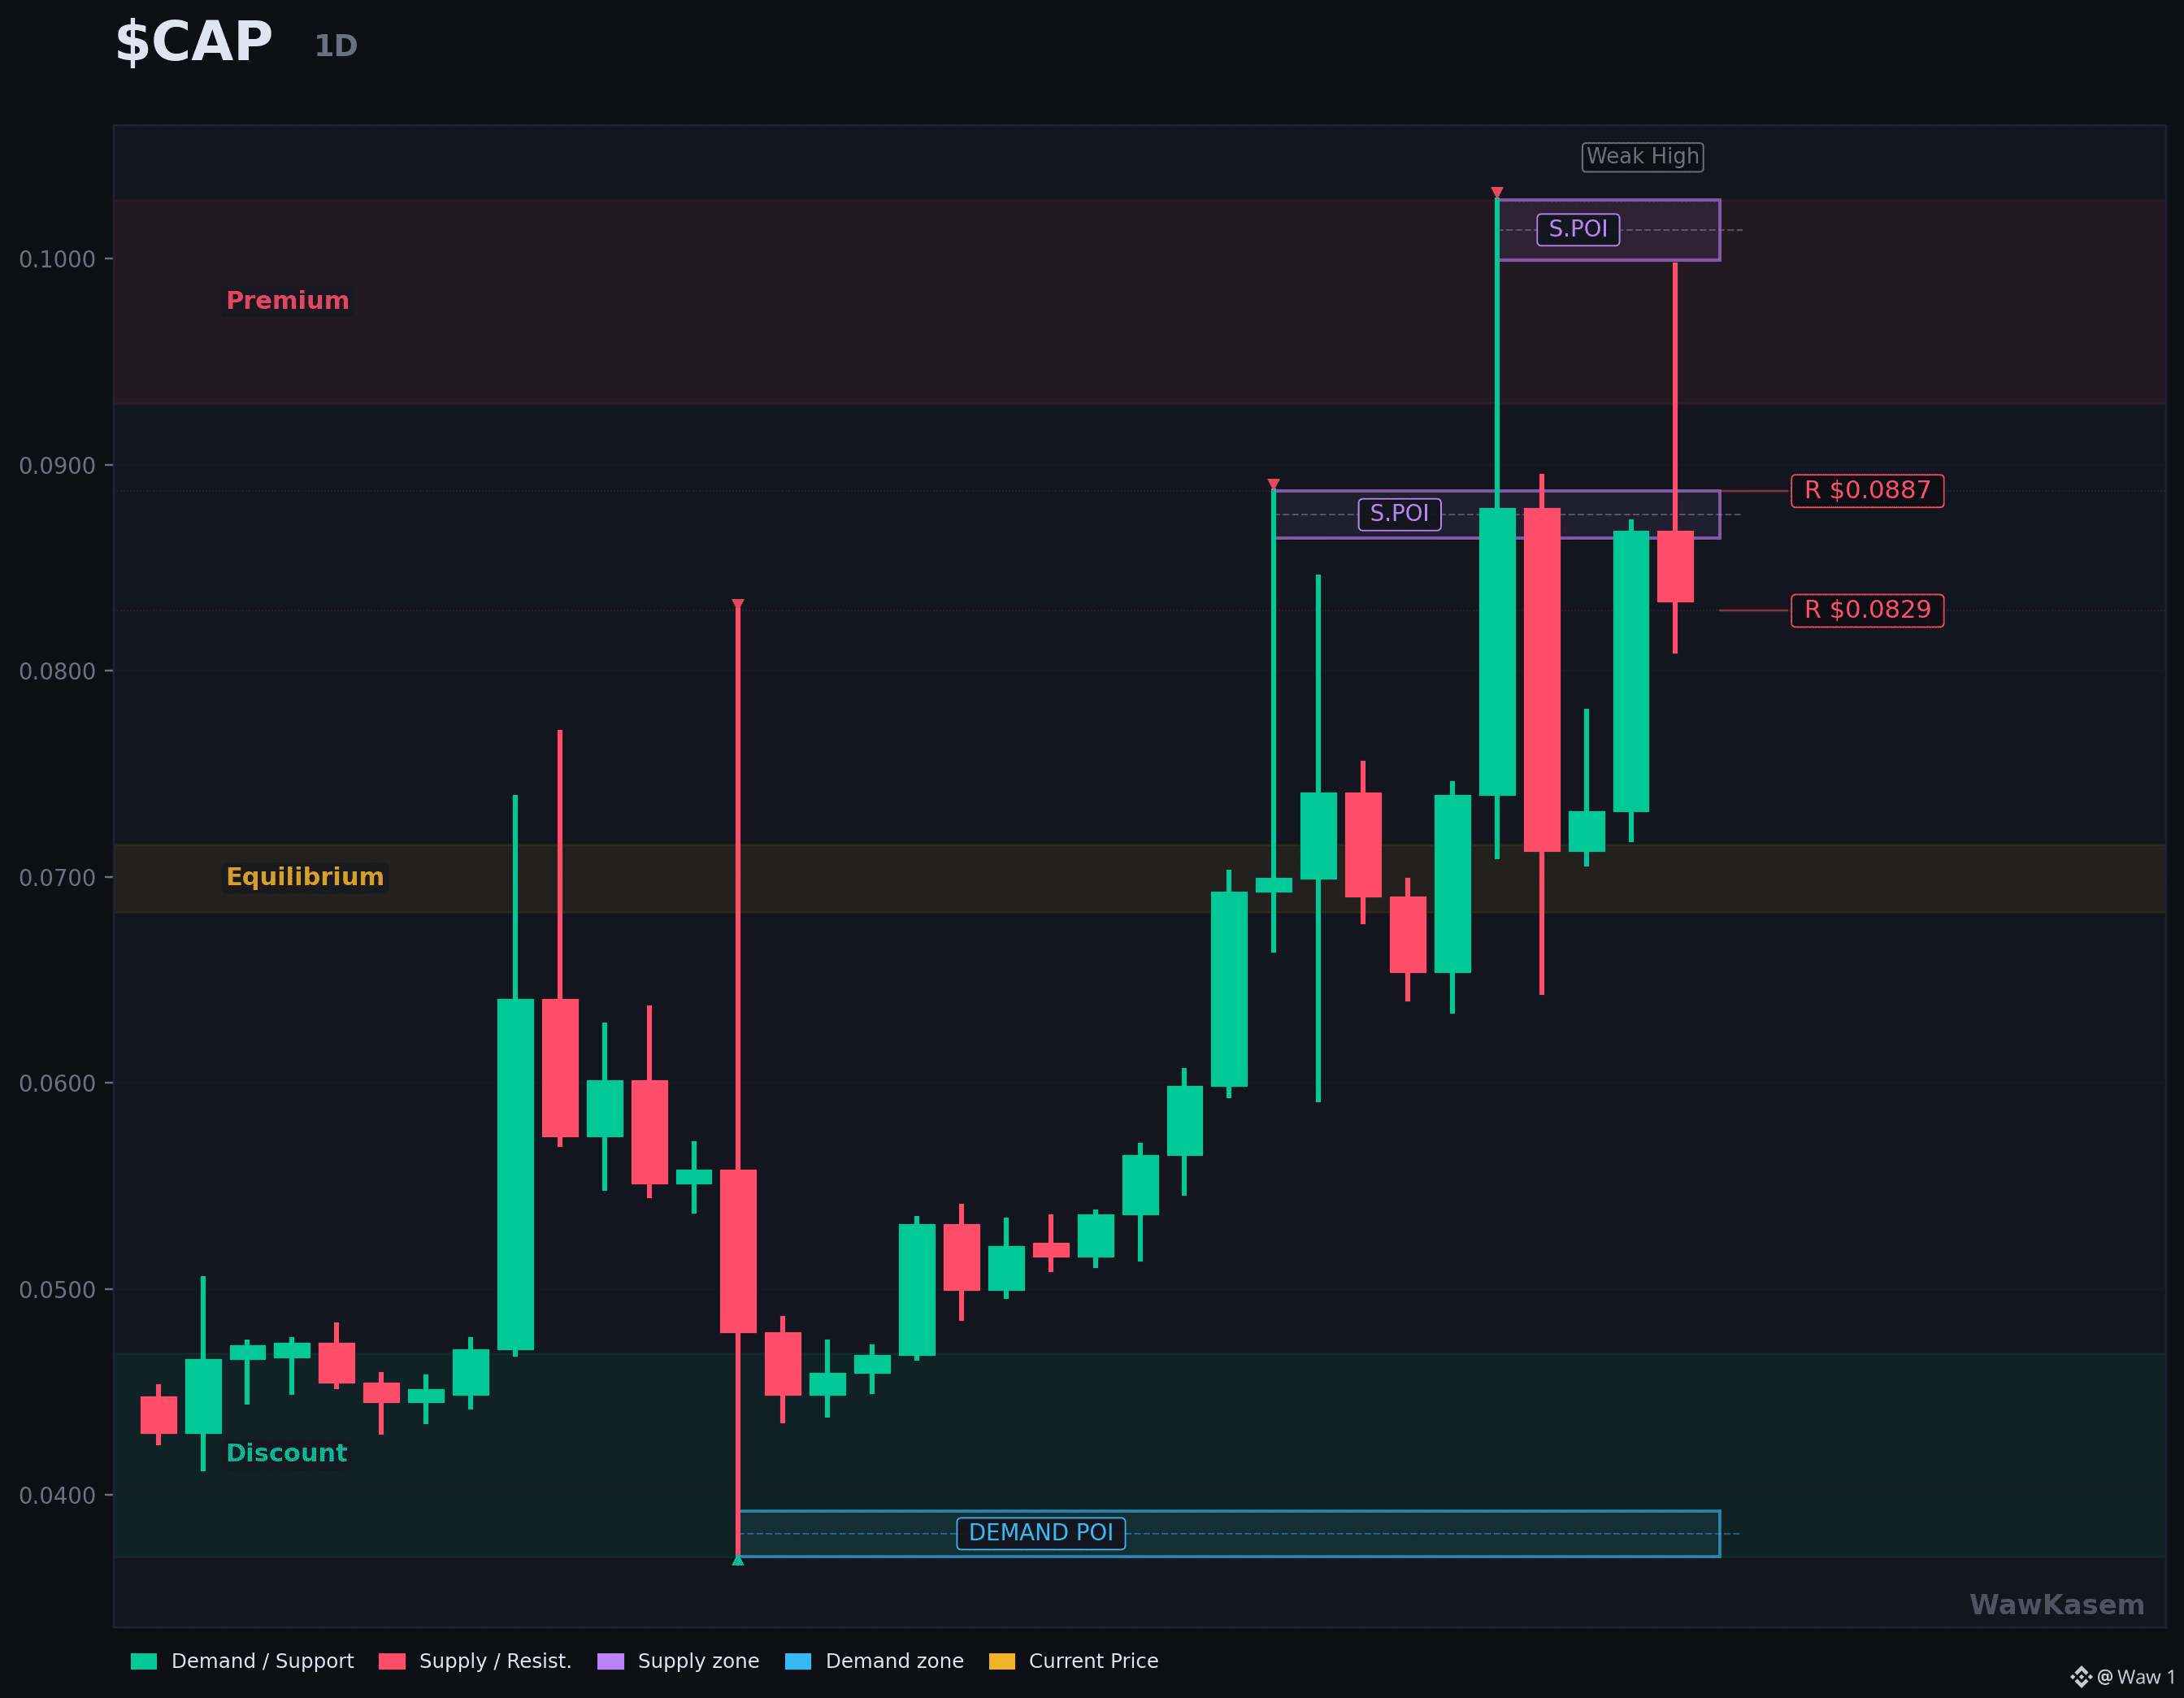
$CAP is the first name on today's trending list with a real market cap behind it, up 14.6% in 24 hours, and the interesting part is that nothing was announced.
I went looking for the catalyst and there is none. No partnership, no listing, no upgrade dated this week. What the tape shows instead is a squeeze: price tagged 0.0997 intraday, handed most of it back, and sits at 0.0834 as I write. Turnover is 9.47M against a 5.62M thirty day average, so 1.7 times normal. Active, but nowhere near the 40 times you see when something real lands.
Now the part that matters more than the candle. Deposits went the other way while the token went up. Total value locked is 271.7M today against 324.6M on September 11, so down 16% in a month, and down 44% from the 483.8M peak printed on January 28. The token is rallying into shrinking collateral.
That cuts both ways and this is the honest read. A 130.5M market cap against 271.7M of deposits means the token is priced at roughly half the value it secures, which is cheap on any credit style framework. But the deposit trend has been negative for eight months, and a protocol that earns on deposits earns less every month at this rate.
Levels: 0.0887 is the supply that capped the last two attempts, 0.0829 is the one price is fighting right now, and the demand zone sits at 0.037 where the thirty day low was printed.
What turns this from a squeeze into a trend is the deposit line bending back up. Nothing else.
Follow me for daily on chain breakdowns like this one.
#cap #defi #altcoin #crypto #stablecoin
60
·
--
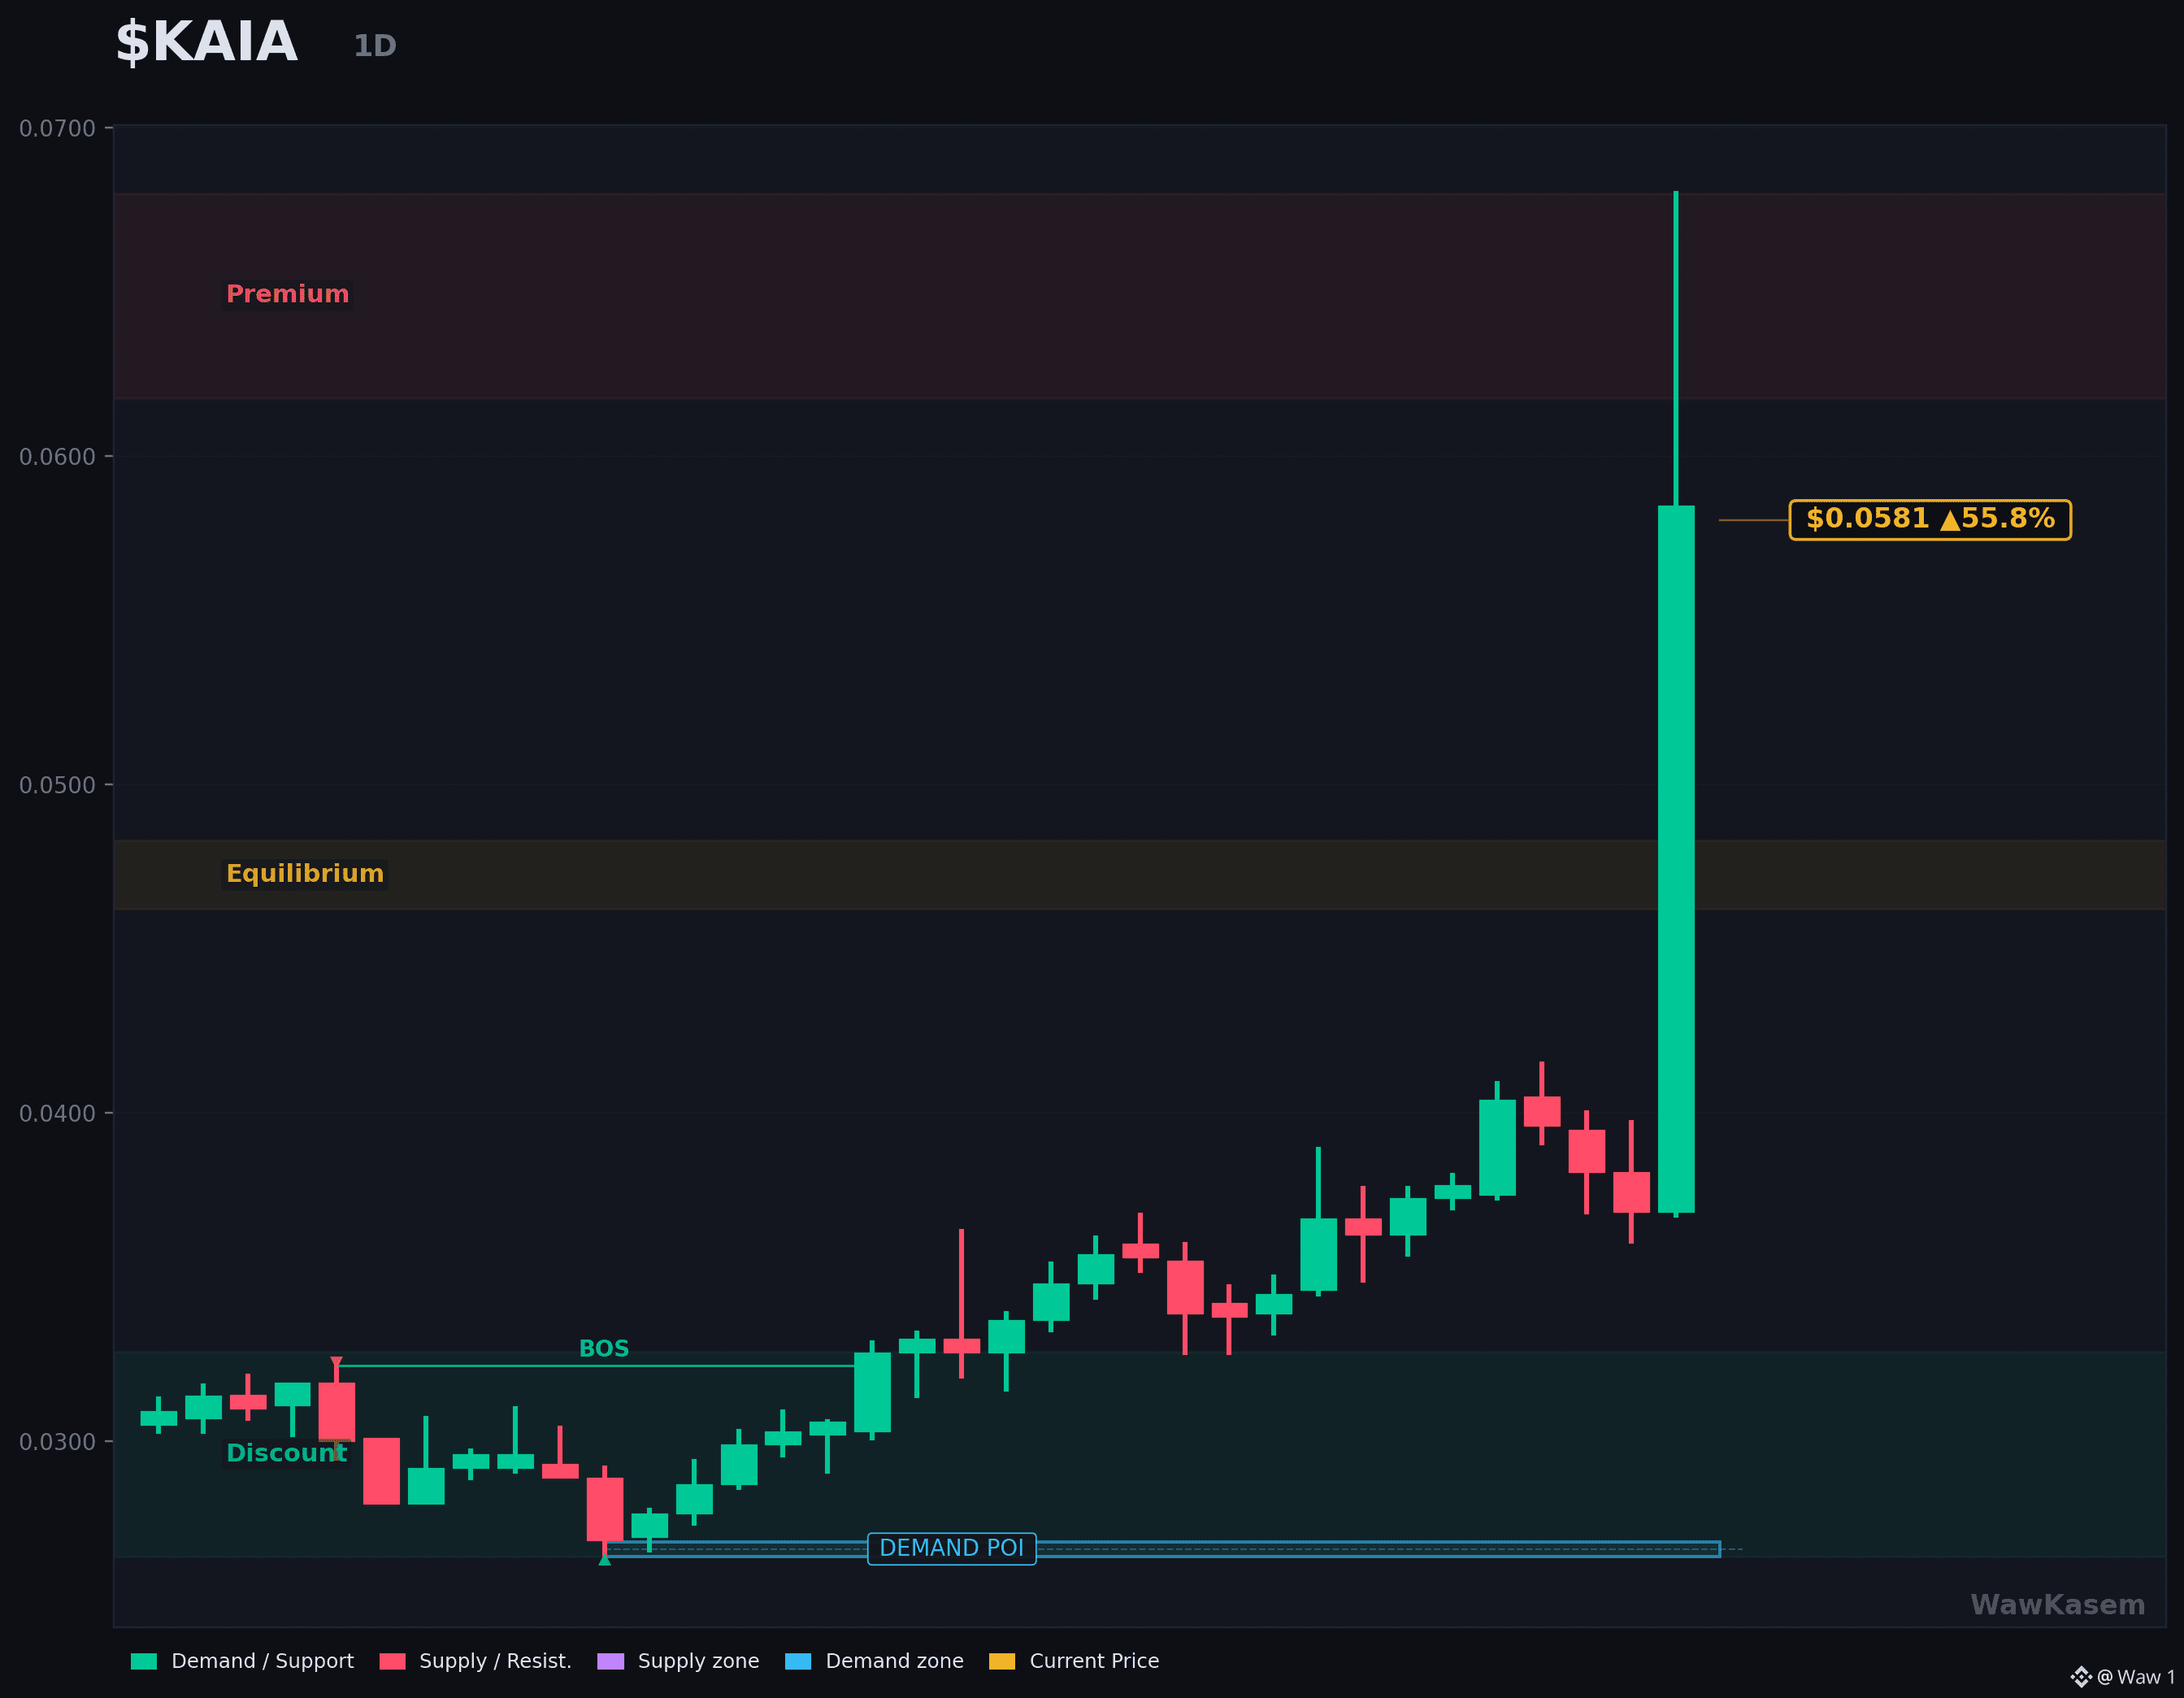
$KAIA is the biggest mover on the trending list today, up 56.7% in a single session, and the reason is not on the chart.
Won trading opened for the token on October 9 at 18:30 KST on the largest exchange in South Korea, against the won, bitcoin and tether. Deposits there route over the Kaia network itself, so the listing added chain traffic and not just a new order book. Korean retail flow is fast and concentrated, and the turnover shows it: 30.4M of volume in 24 hours against a 30 day average of 0.7M. Forty three times the normal daily activity.
Price went from 0.0363 to 0.0583, which is 60.6% over seven days, and tagged 0.068 intraday before giving back a third of the candle. That 0.068 print is the 30 day high and the exact level where the session failed, so it is the only line that matters now. The 30 day low is 0.0265, so the token still sits 120% above where it traded three weeks ago.
Here is the part the listing does not fix. The Kaia chain holds 9.08M of total value locked and produced 2,421 dollars of fees over the last 30 days, against a 374M market cap. Price is discounting an audience, not usage. Listings bring buyers for a few sessions, and the chain has to convert them into activity before volume decays back toward that 0.7M average.
What I am watching: whether daily volume holds above 5M next week, and whether the chain fee line moves at all. If turnover fades and fees stay flat, the 0.0363 open becomes the magnet.
Follow me for daily on chain breakdowns like this one.
#kaia #altcoin #crypto #defi #bitcoin
26
·
--
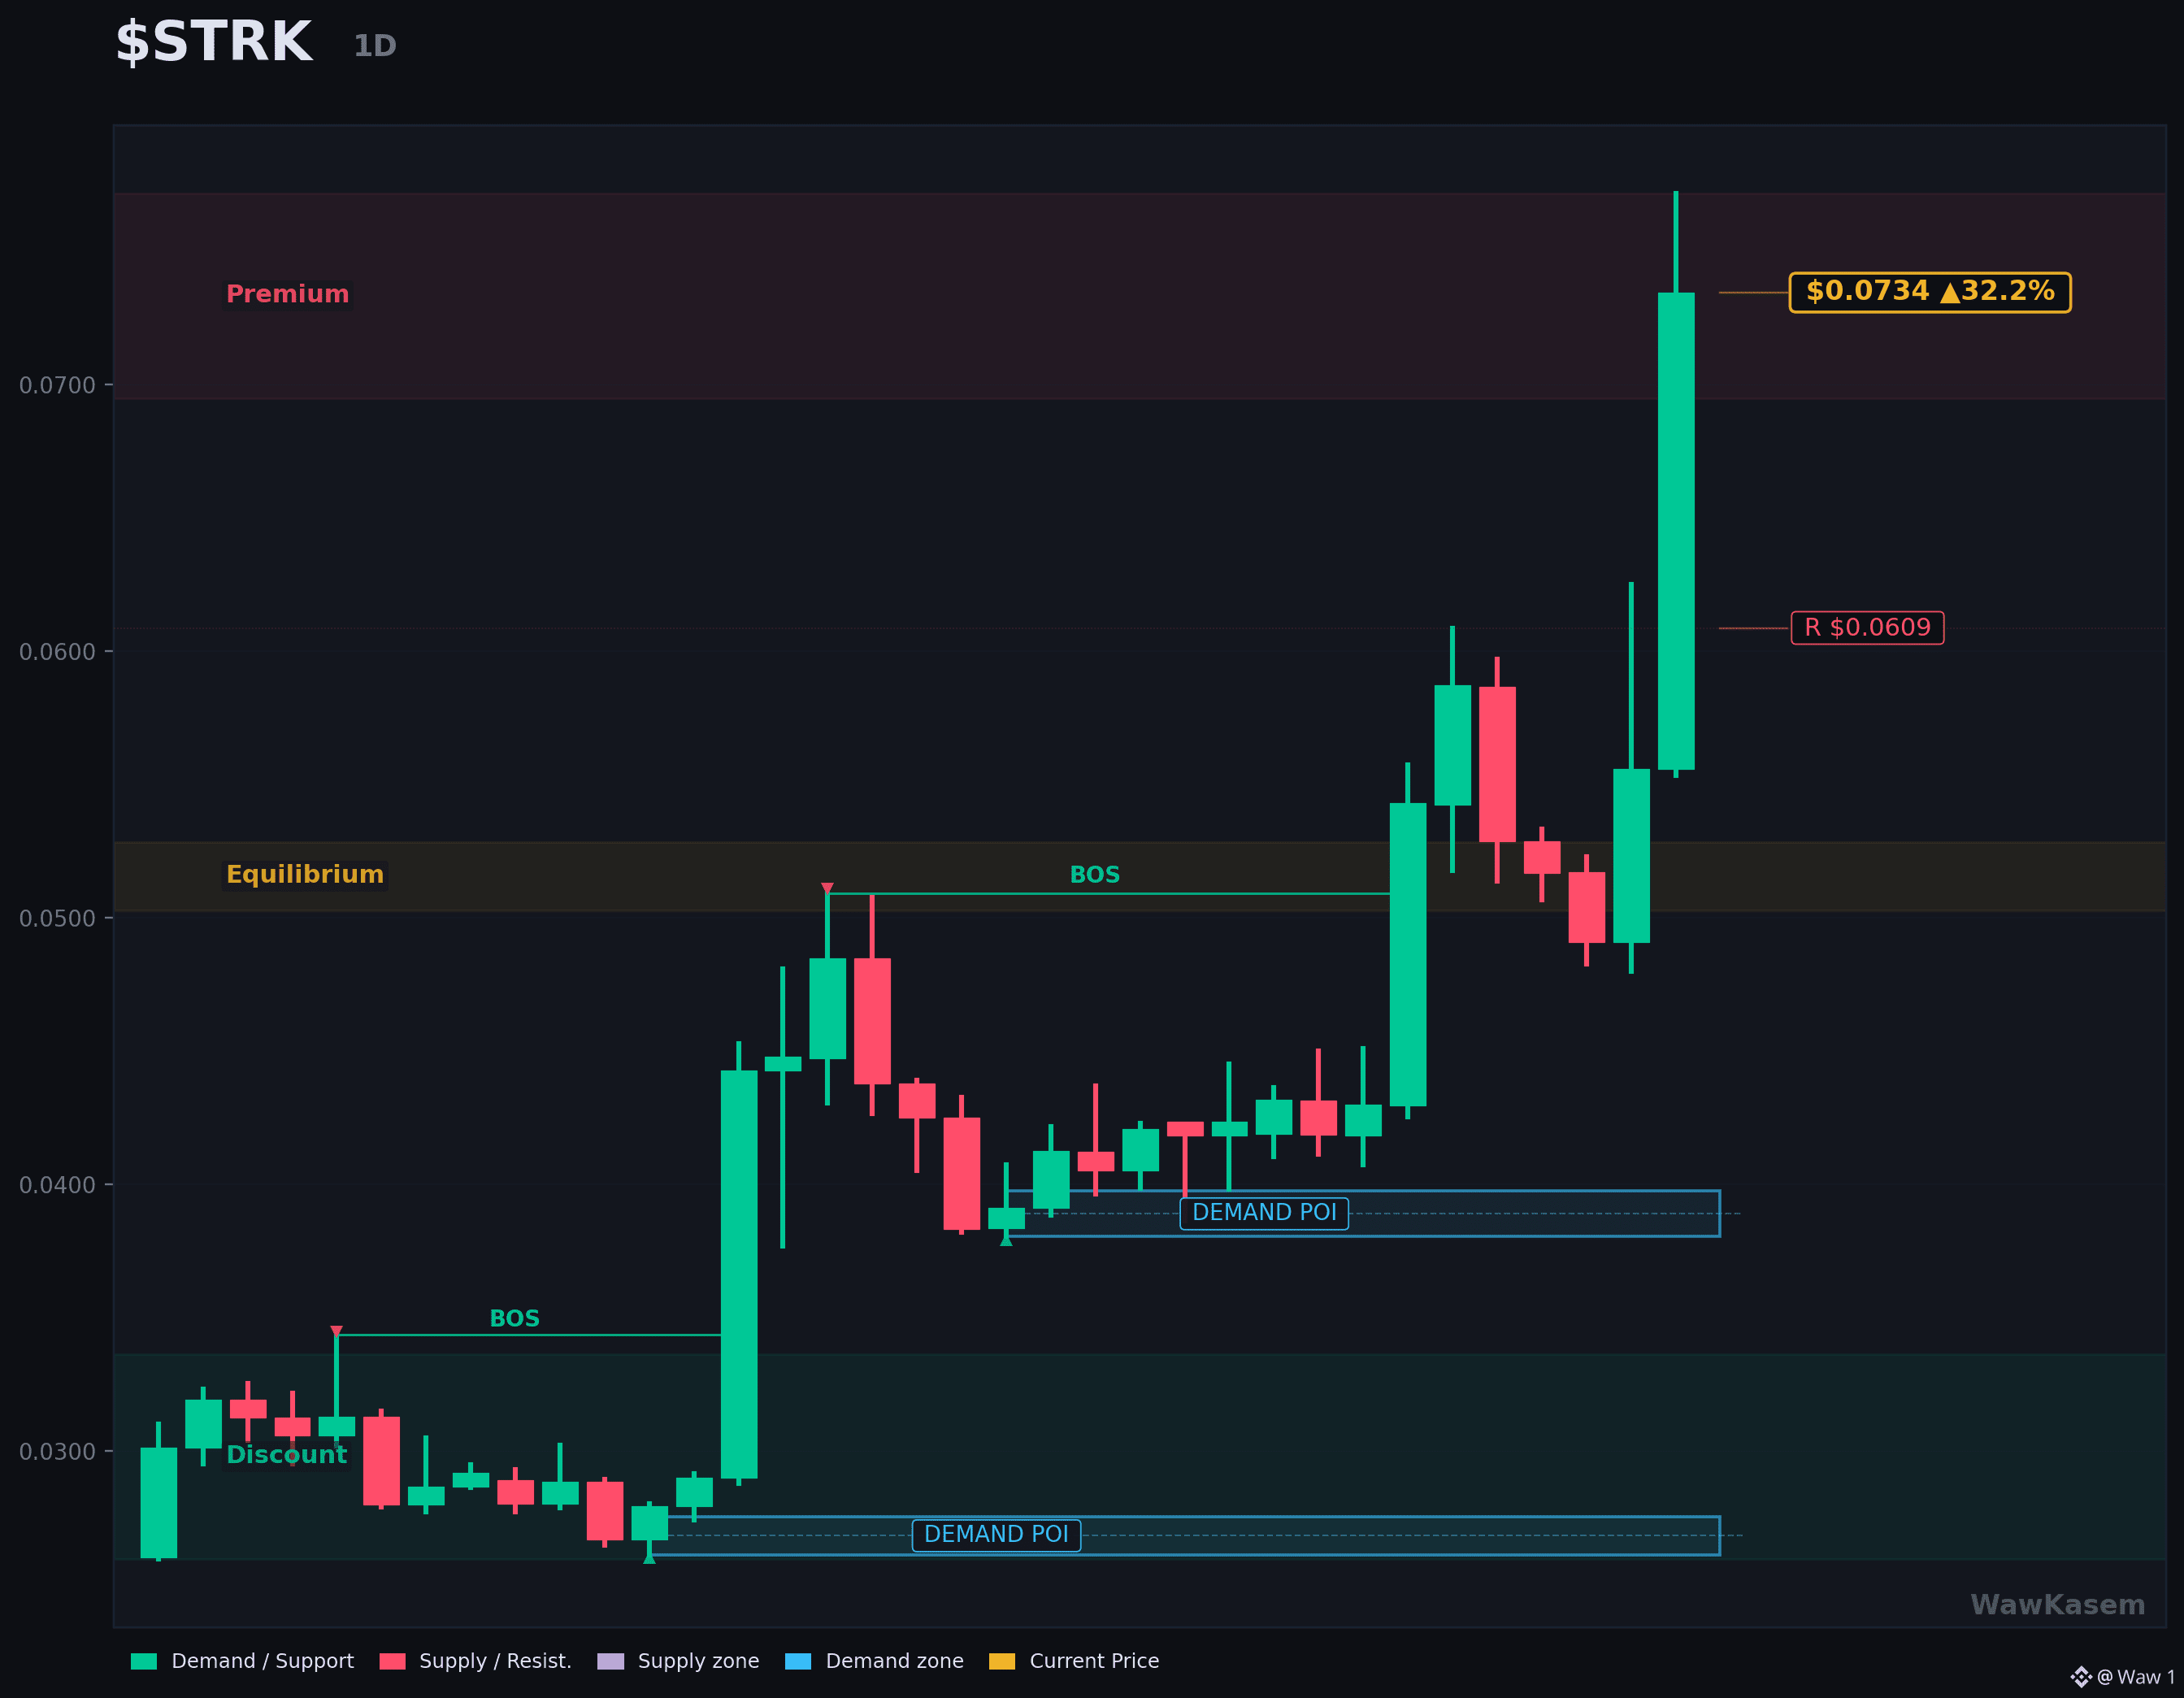
$STRK is the number one trending token on the list today, up 26.3% in a session and 70.8% over the week, and the reason is not technical.
On October 8 the founder of the team behind the network, Eli Ben-Sasson, posted that the project is actively considering leaving its layer 2 role to become its own layer 1 chain, with the goal of being the first fully quantum resistant network, targeting 2027. Not confirmed yet. The timing is what matters: one day earlier, a researcher at the Ethereum Foundation warned that AI driven mathematics could break the signature scheme both major chains rely on in months rather than years. The market spent two days pricing quantum resistance and this token sits closest to that story.
Live numbers:
Price: 0.07341 USD
24h: +26.3%, high 0.07716, low 0.05466
7d: +70.8%
30d: +134.8%
Market cap: 543.8M USD, rank 110
24h volume: 425M USD
Volume says it is real buying, not a thin wick. The main USDT pair traded 53.1M USD today against an 8.7M average over the previous 30 days, six times normal, and today's 0.07716 is a new 30 day high.
The counterweight, measured rather than argued: the network collected 225,778 USD of fees over the last 30 days and holds 165M in total value locked. The market is paying 543.8M for a chain earning about 226,000 a month from usage. This is a repricing on a roadmap, not on demand.
Levels. Below price: 0.0625, yesterday's high, then 0.05466. Above price: 0.07716, today's high and the 30 day ceiling.
Context: STRK is 98.3% below its all time high of 4.41 from February 2024.
Follow me for daily market breakdowns.
#starknet #ethereum #altcoin #crypto
68
·
--
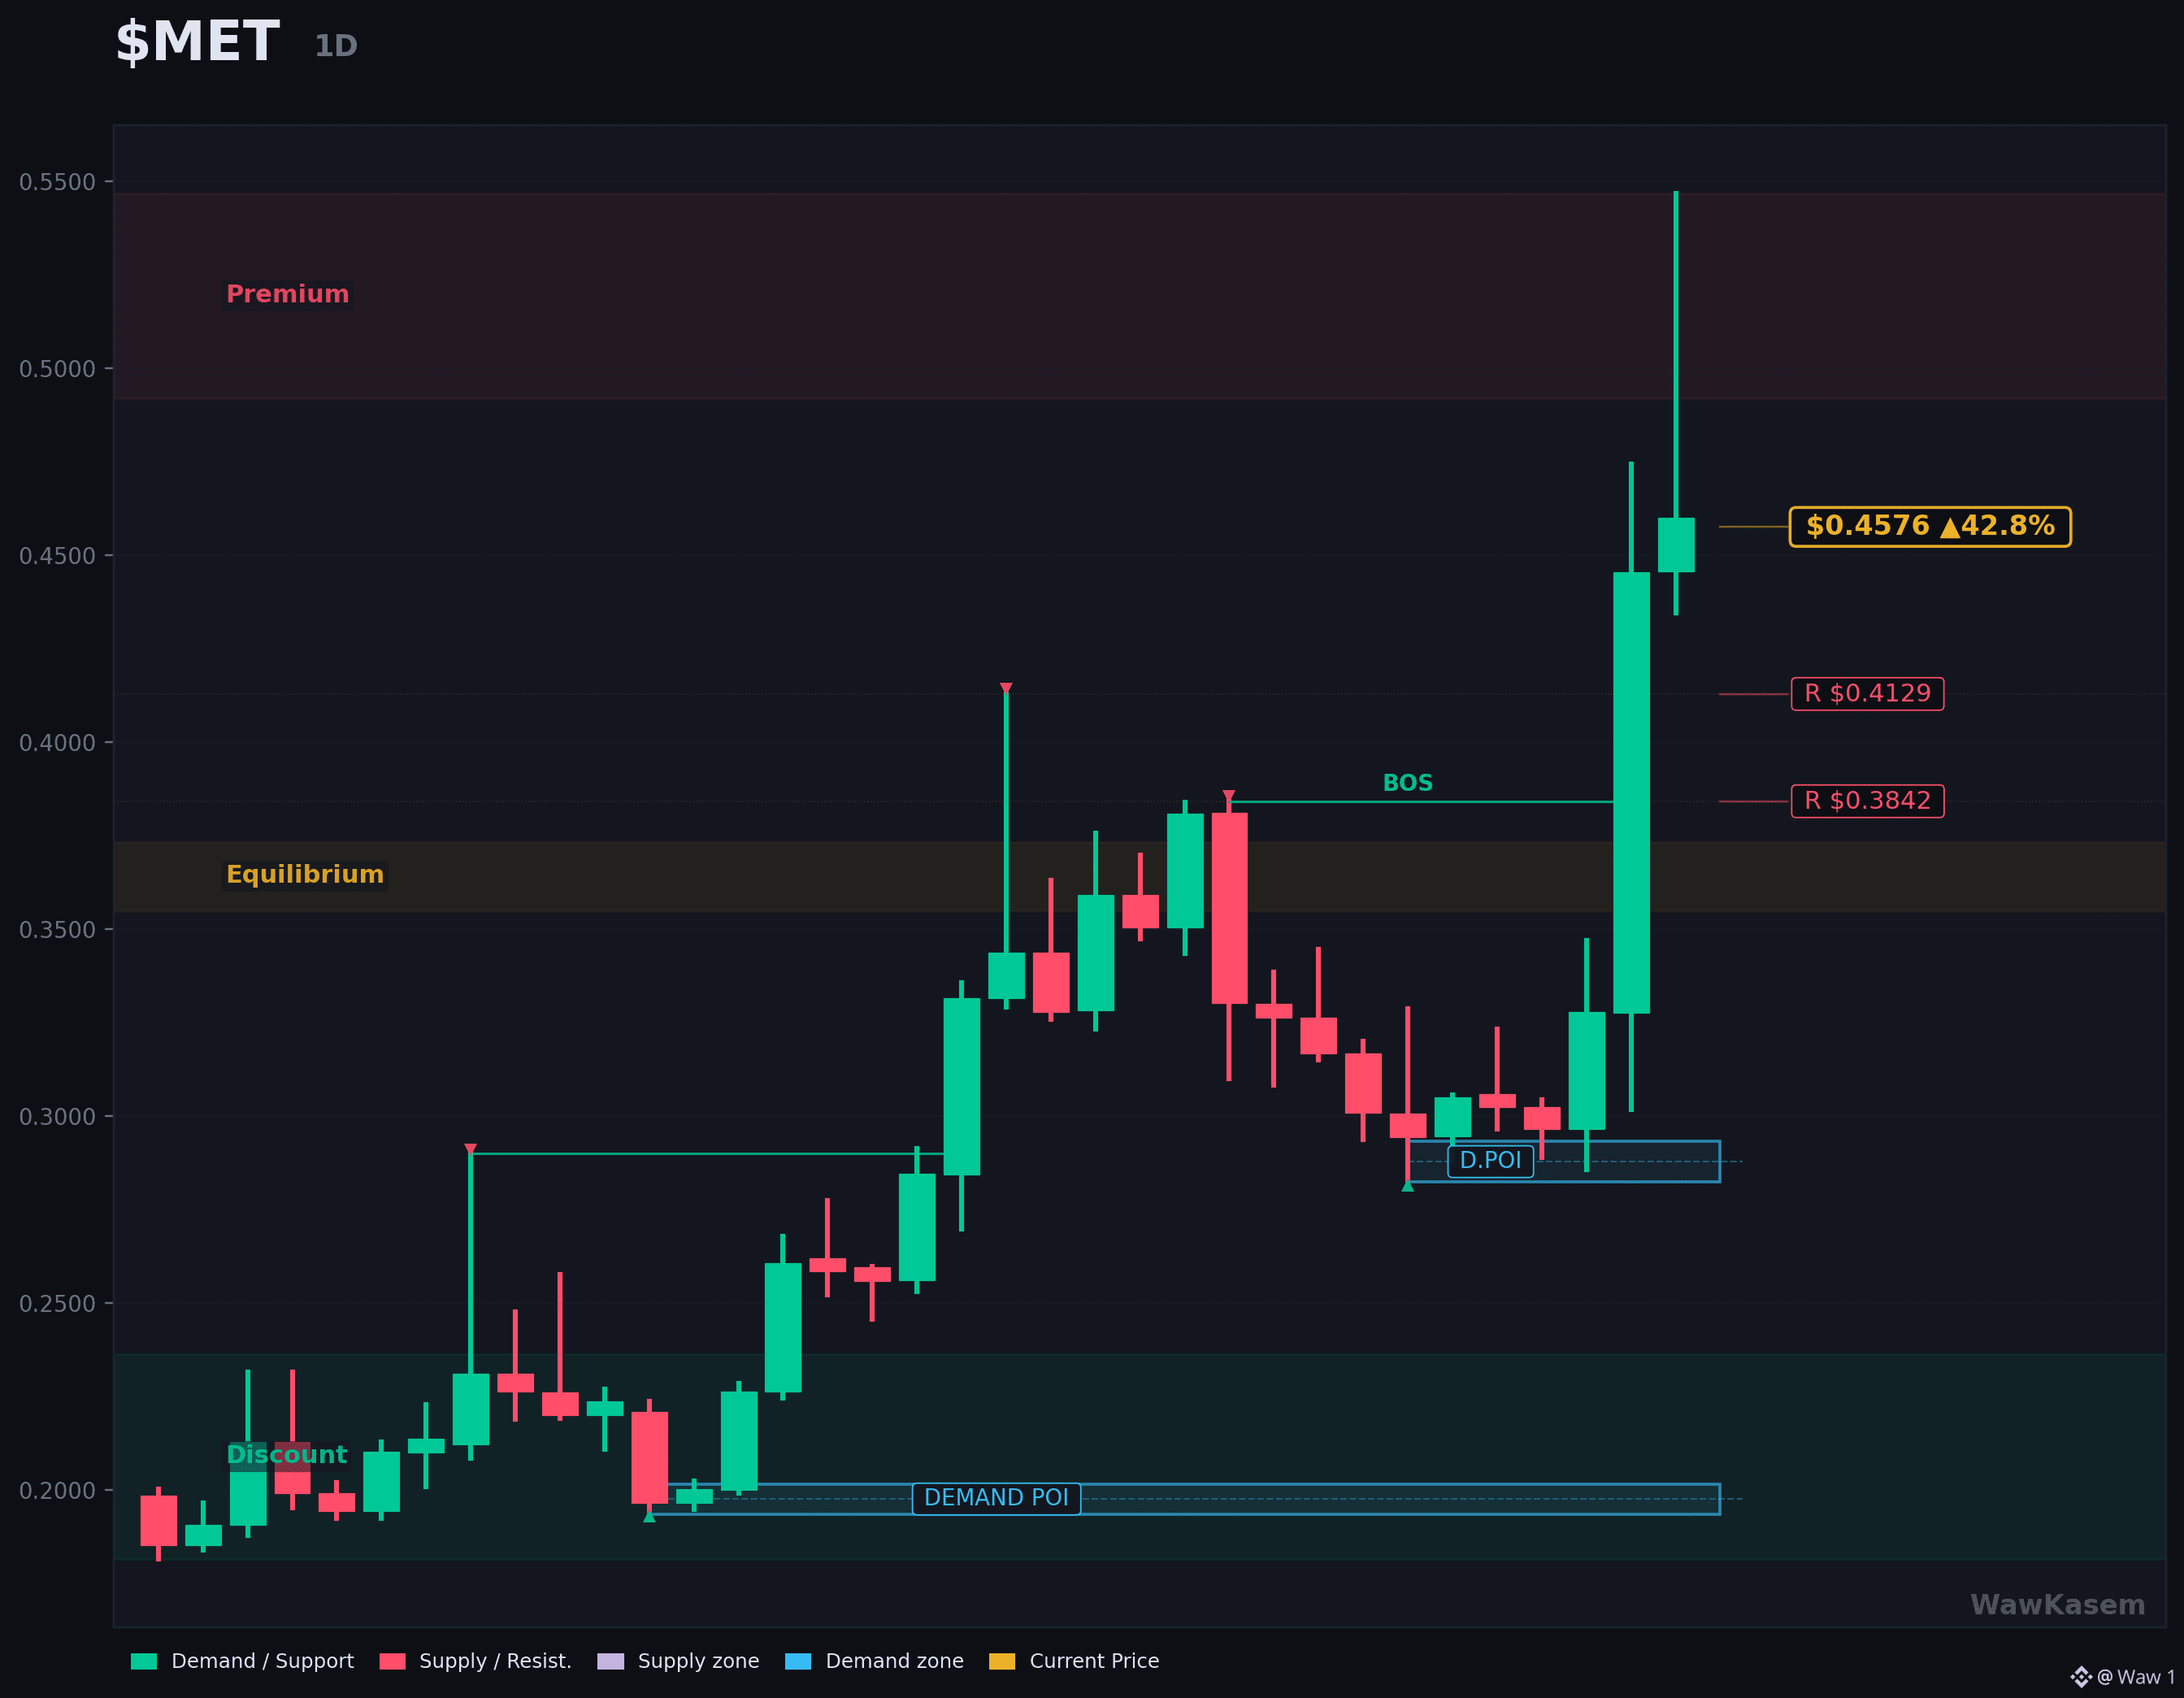
$MET is the strongest move on the trending list today, up 42.8% in a single session and 132% over thirty days.
Live numbers:
Price: 0.4577 USD
24h: +42.5%, high 0.5468, low 0.4345
7d: +53.6%
30d: +132.8%
Market cap: 255M USD, rank 163
24h volume: 284M USD
The session has two halves. Price opened at 0.4456, ran to 0.5468 which is a new high for the month, then gave back 16% from that peak and now sits at 0.4577. The previous thirty day high was 0.4744, so the breakout is real but it has not held its best level.
Volume backs the interest rather than contradicting it. The main USDT pair traded 30.2M today against a 4.2M average over the previous thirty days, so roughly seven times its normal activity.
What makes this one different from the usual trending spike is that the protocol underneath produces measurable numbers. It handled 153.2M of trading volume in the last 24 hours, which is 6.9% of all decentralized trading on Solana, and it generated 34.1M in fees over thirty days.
What that fee machine does not do yet is pay the token. Holder revenue over the same thirty days is zero, and protocol revenue is 4.11M. So a 255M valuation looks cheap against activity and expensive against anything that currently reaches holders. That gap is the whole debate on this one.
Levels. Below price: 0.4345, today's low, then 0.3842. Above price: 0.4744, then 0.5468.
Follow me for daily market breakdowns.
#defi #solana #altcoin #crypto
71
·
--
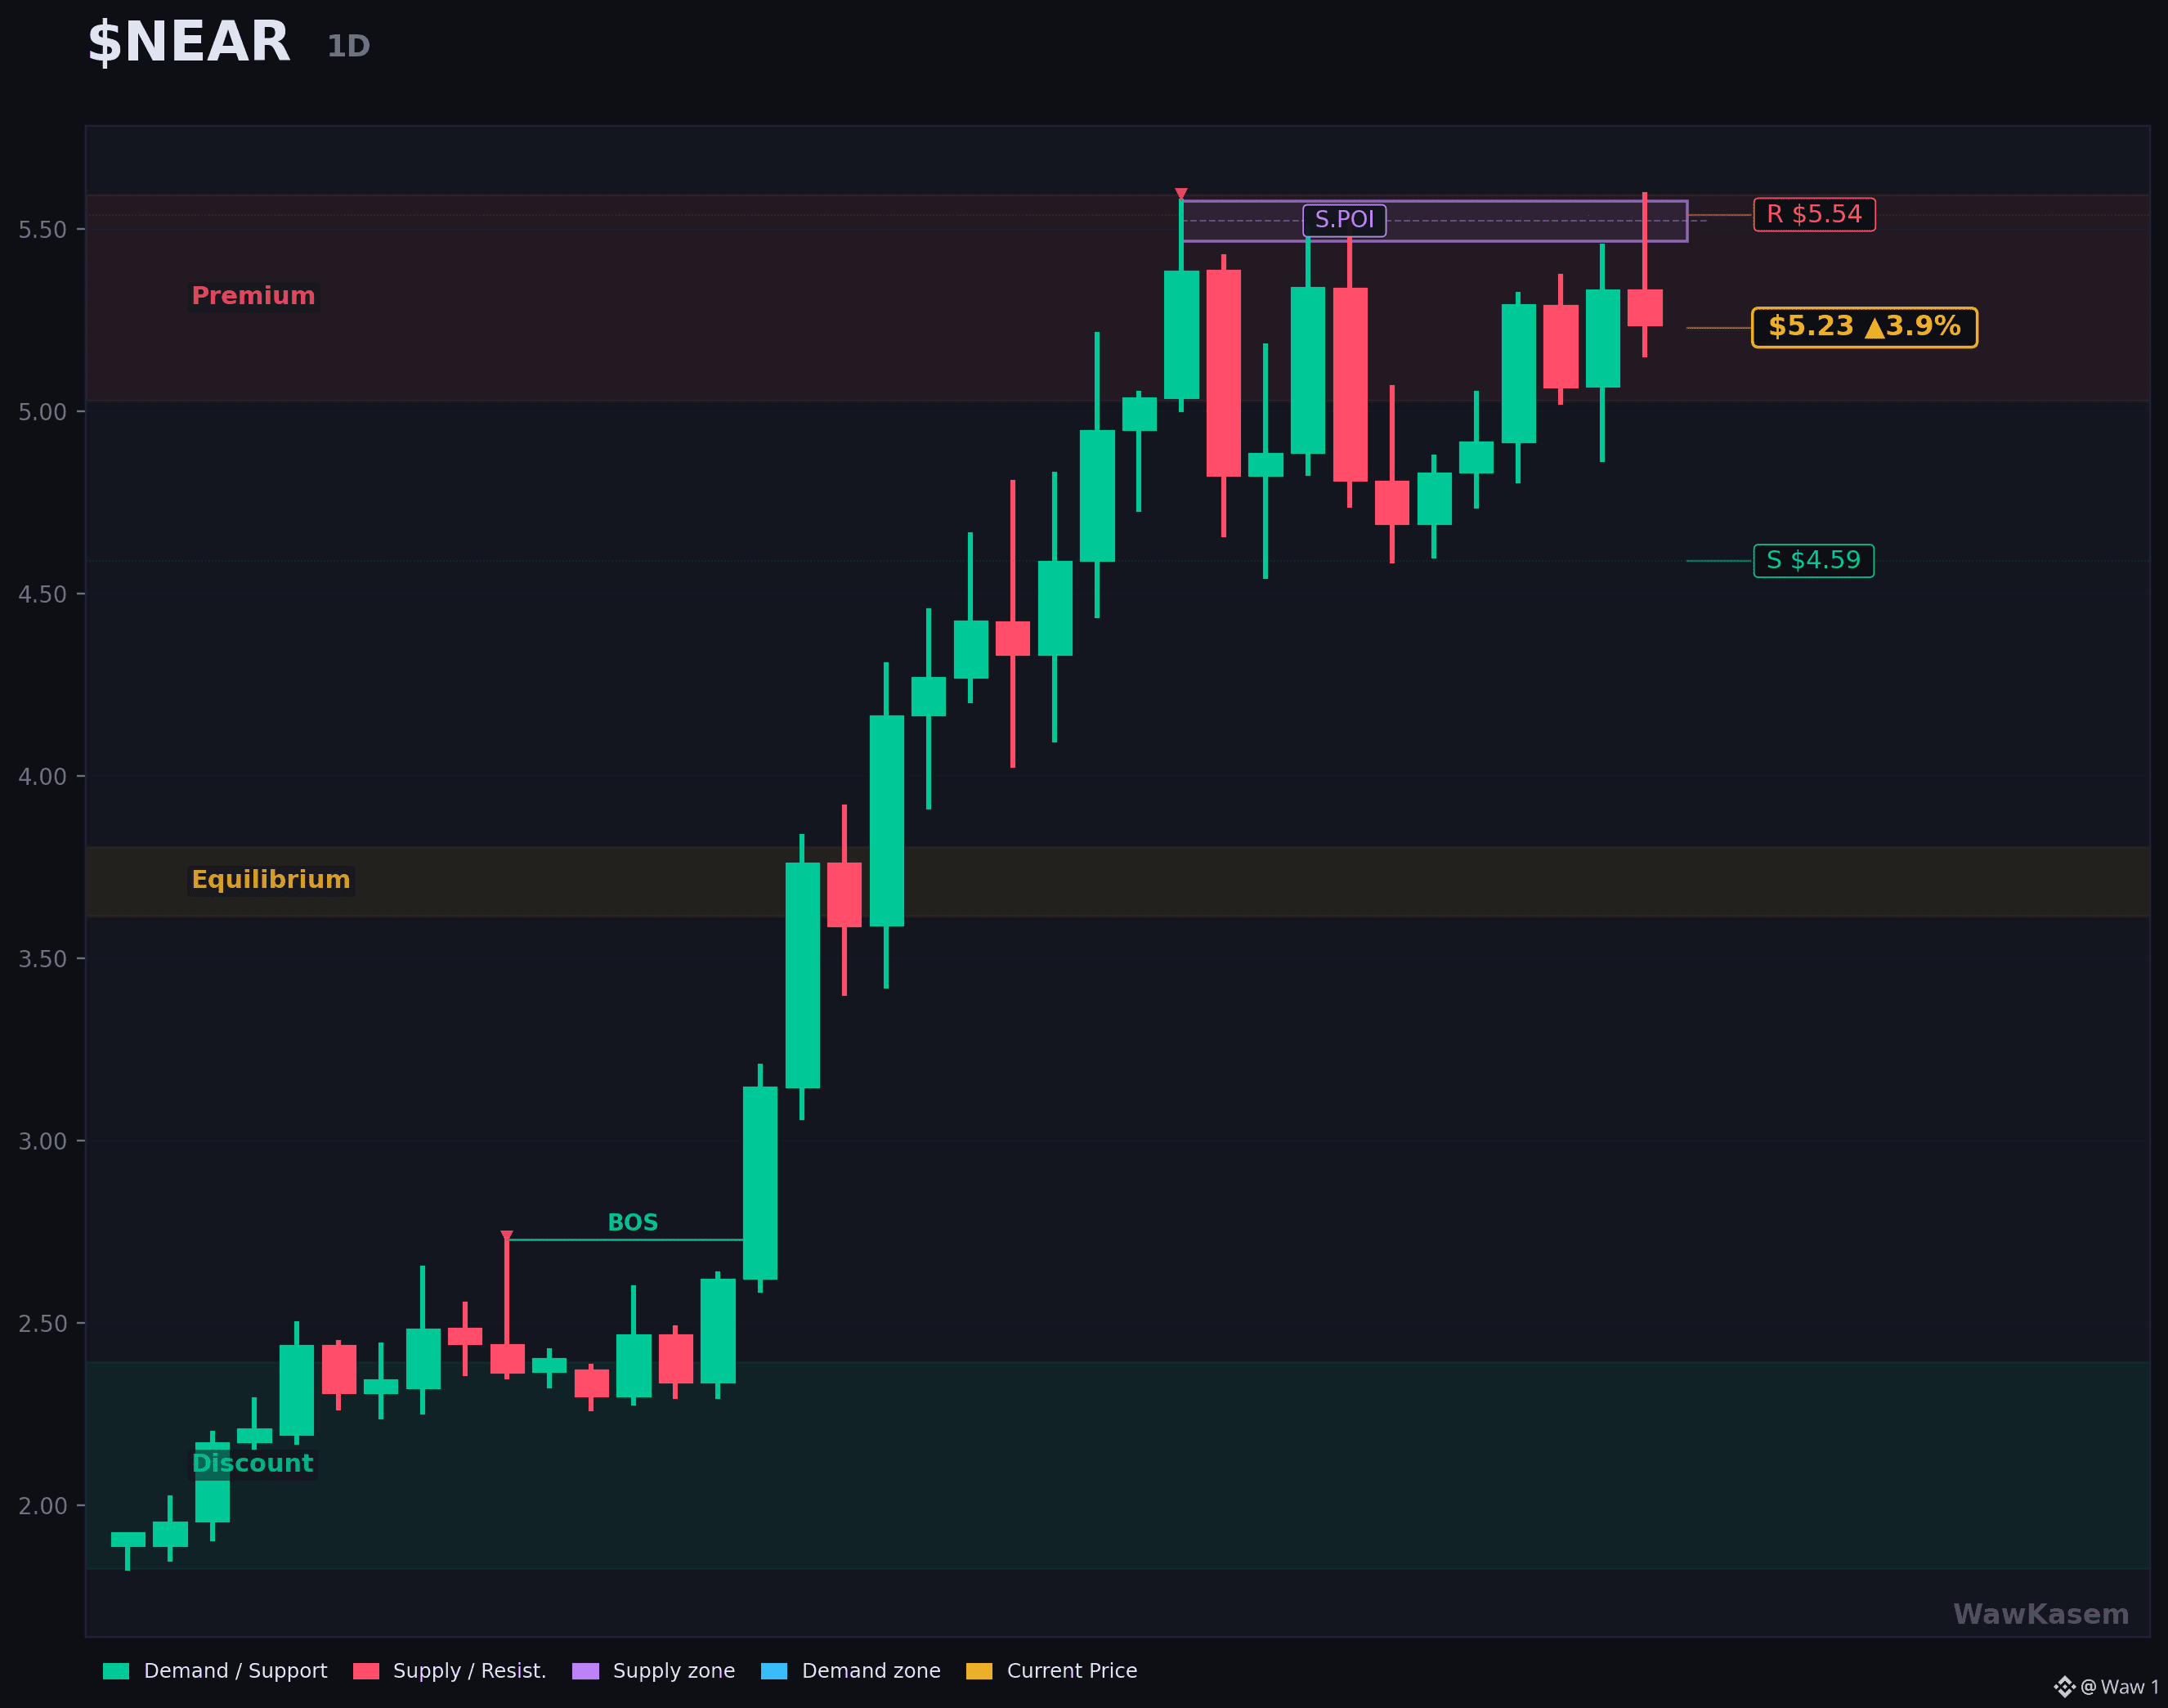
$NEAR traded at 5.595 today, the highest price it has printed in at least 40 sessions.
Live numbers:
Price: 5.246 USD
24h: +4.1%, high 5.595, low 5.155
7d: +0.5%
30d: +127.3%
Market cap: 6.86B USD, rank 21
24h volume: 1.28B USD
The month behind it: price was 2.256 at the 30 day low in mid September. From there to today's high is +148%, and the market cap has gone from under 3B to 6.86B.
What makes the session notable is the rest of the tape. The market corrected hard yesterday, and this opened at 5.335 and pushed to a new high anyway.
Volume is below its own average though: 106M USD on the main USDT pair today against a 176M average over the previous 30 days. The new high came on lighter participation than the move that built it, which is the part to watch.
Levels. Below price: 5.155, today's low, then 4.59. Above price: 5.595, today's high.
Context: NEAR is 74.4% below its all time high of 20.44 from January 2022.
Follow me for daily trending breakdowns.
#near #altcoin #crypto #defi
79
·
--
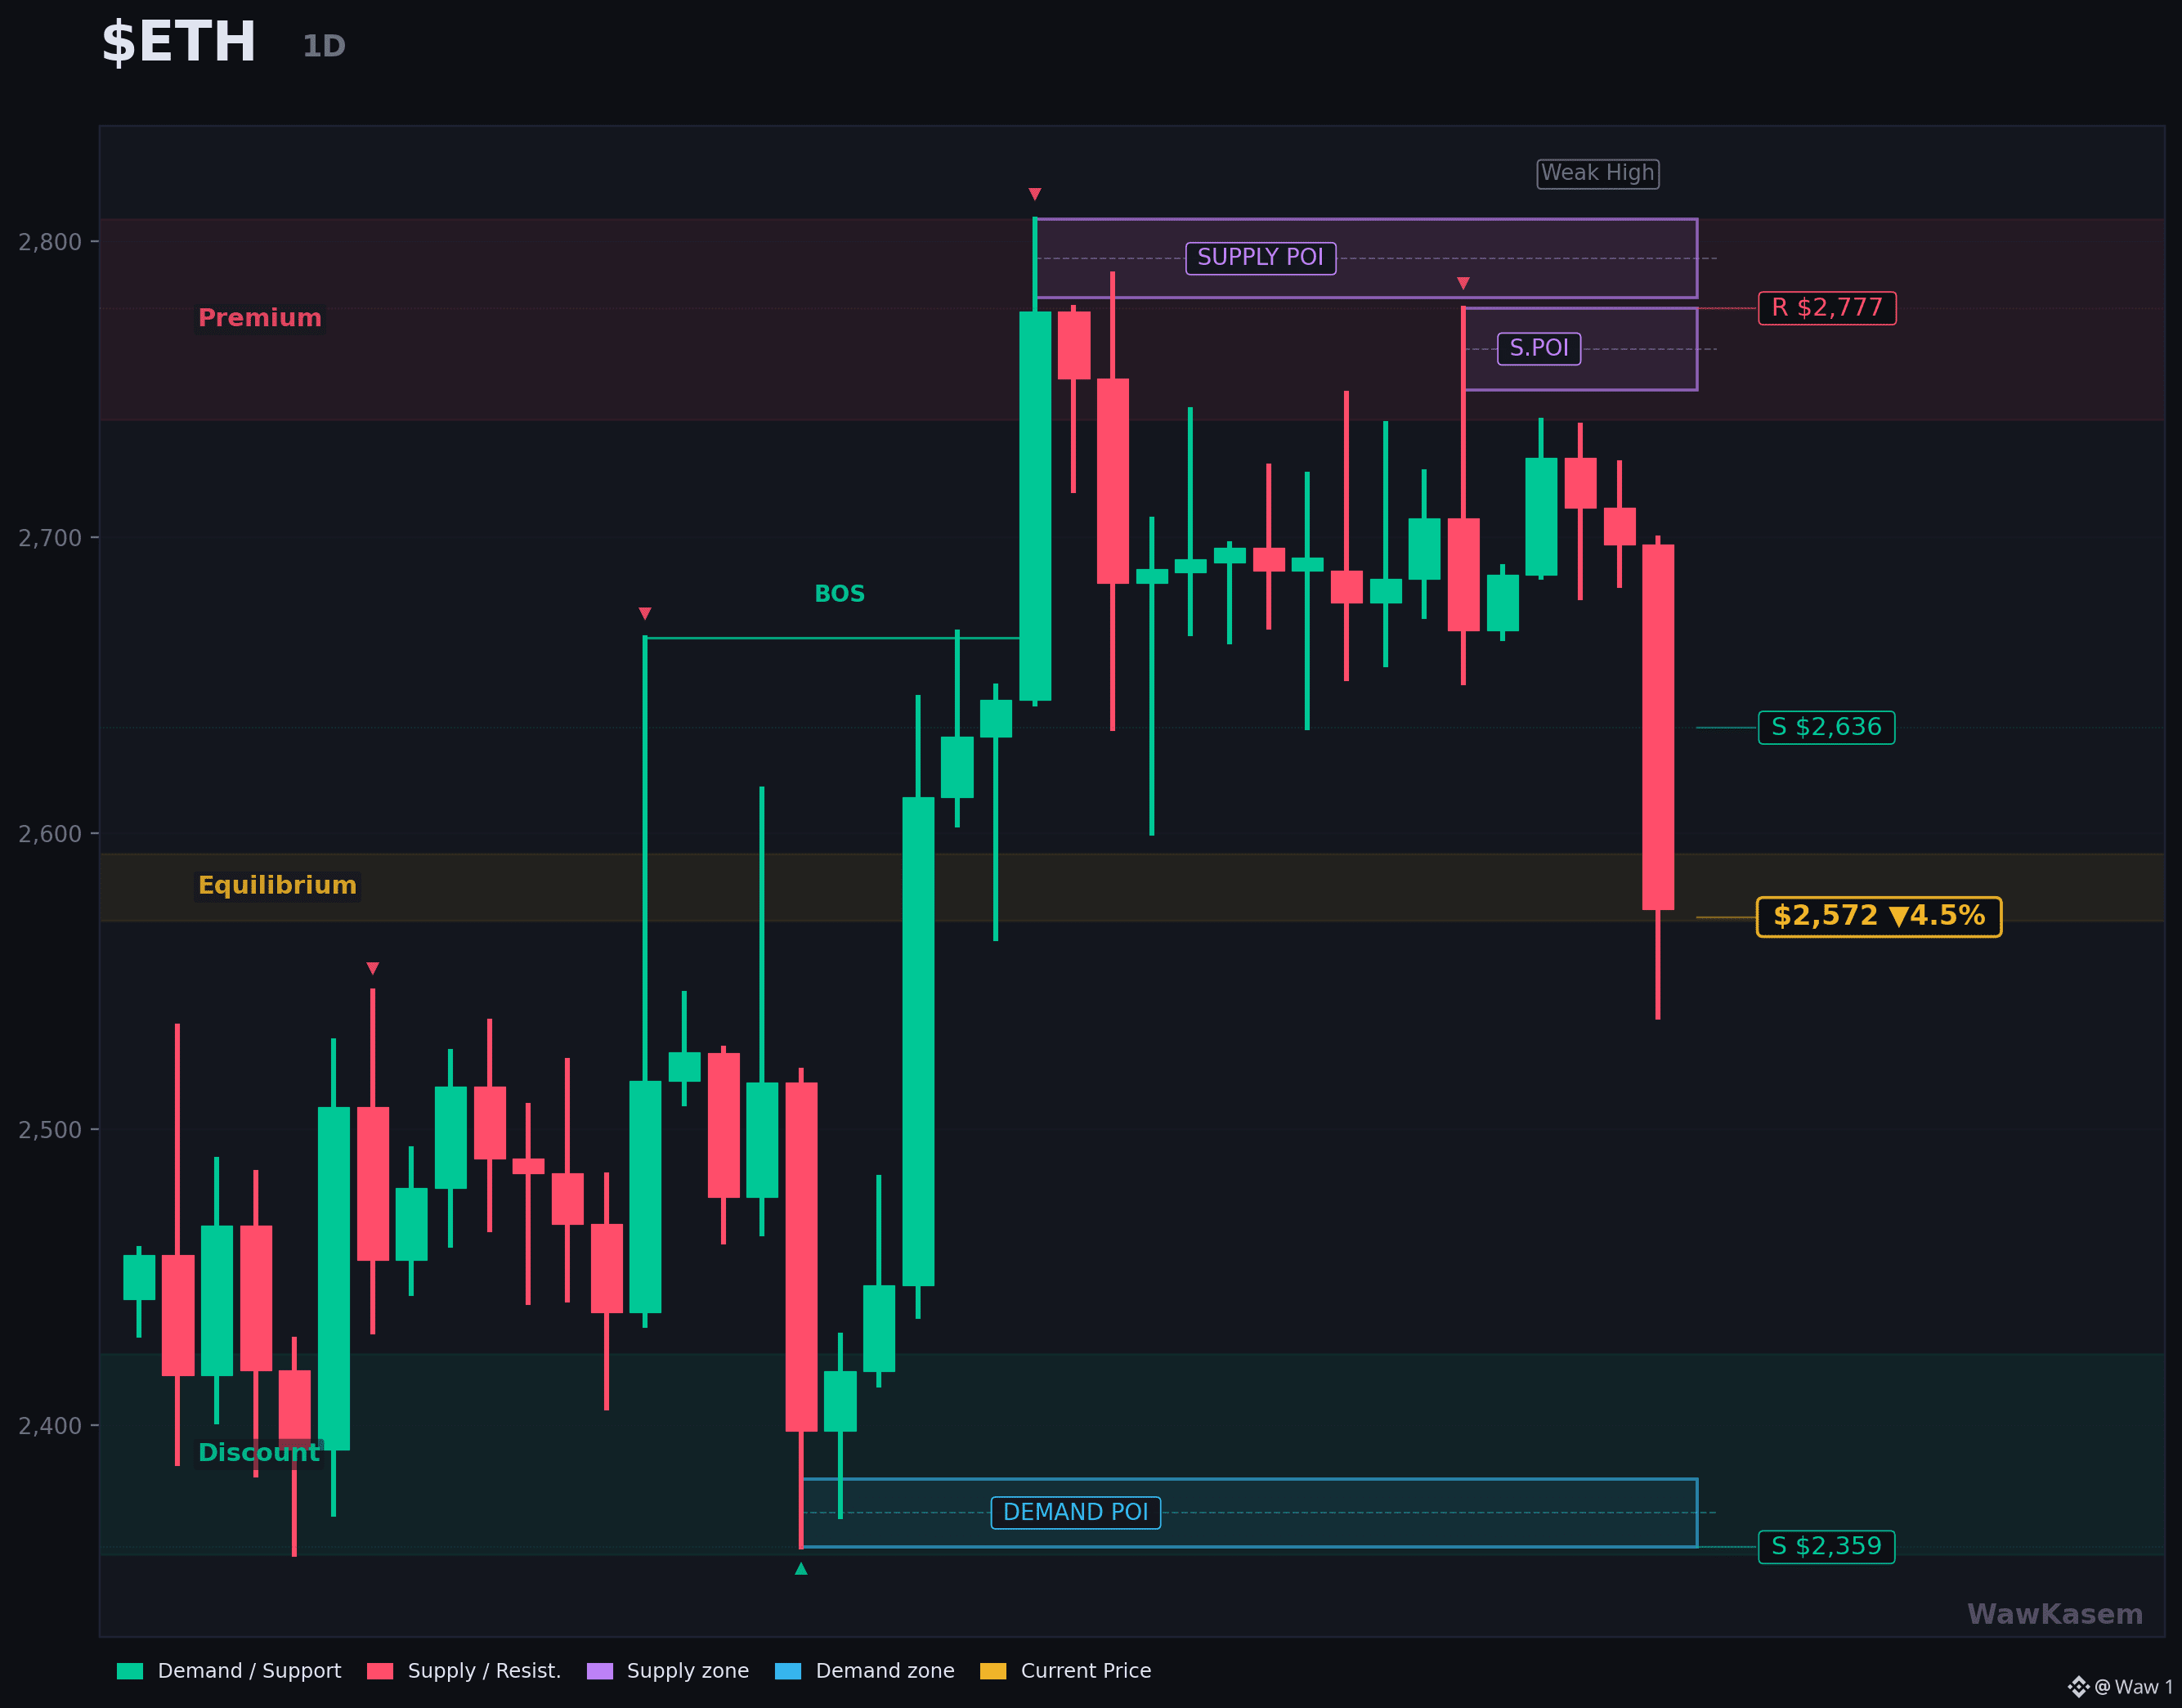
$ETH printed 2,538 today, its weakest level since September 19, and the session lost 4.4%.
Live numbers:
Price: 2,574 USD
24h: -4.4%, high 2,700, low 2,538
7d: -4.4%
30d: +3.2%
Market cap: 314.24B USD, rank 2
24h volume: 17.80B USD
The shape of the day: open at 2,697, high at 2,700 in the first hour, then a straight slide to 2,538 before a partial recovery to 2,574.
Volume is the detail that separates this from the last few sessions: 1.06B USD on the main USDT pair today against a 748M average over the previous 30 days. That is 1.4 times the recent norm, and the three sessions before it ran between 265M and 733M. Sellers showed up with size this time.
The four sessions before today held between 2,679 and 2,739, a shelf just over 2% wide. It broke in one move.
Where it sits: 2,358 is the 30 day low from mid September, 2,807 the 30 day high. Price is in the bottom quarter of that band.
Levels. Below price: 2,538, today's low, then 2,358. Above price: 2,700, then 2,739.
Follow me for daily trending breakdowns.
#ethereum #eth #defi #altcoin #crypto
2
·
--
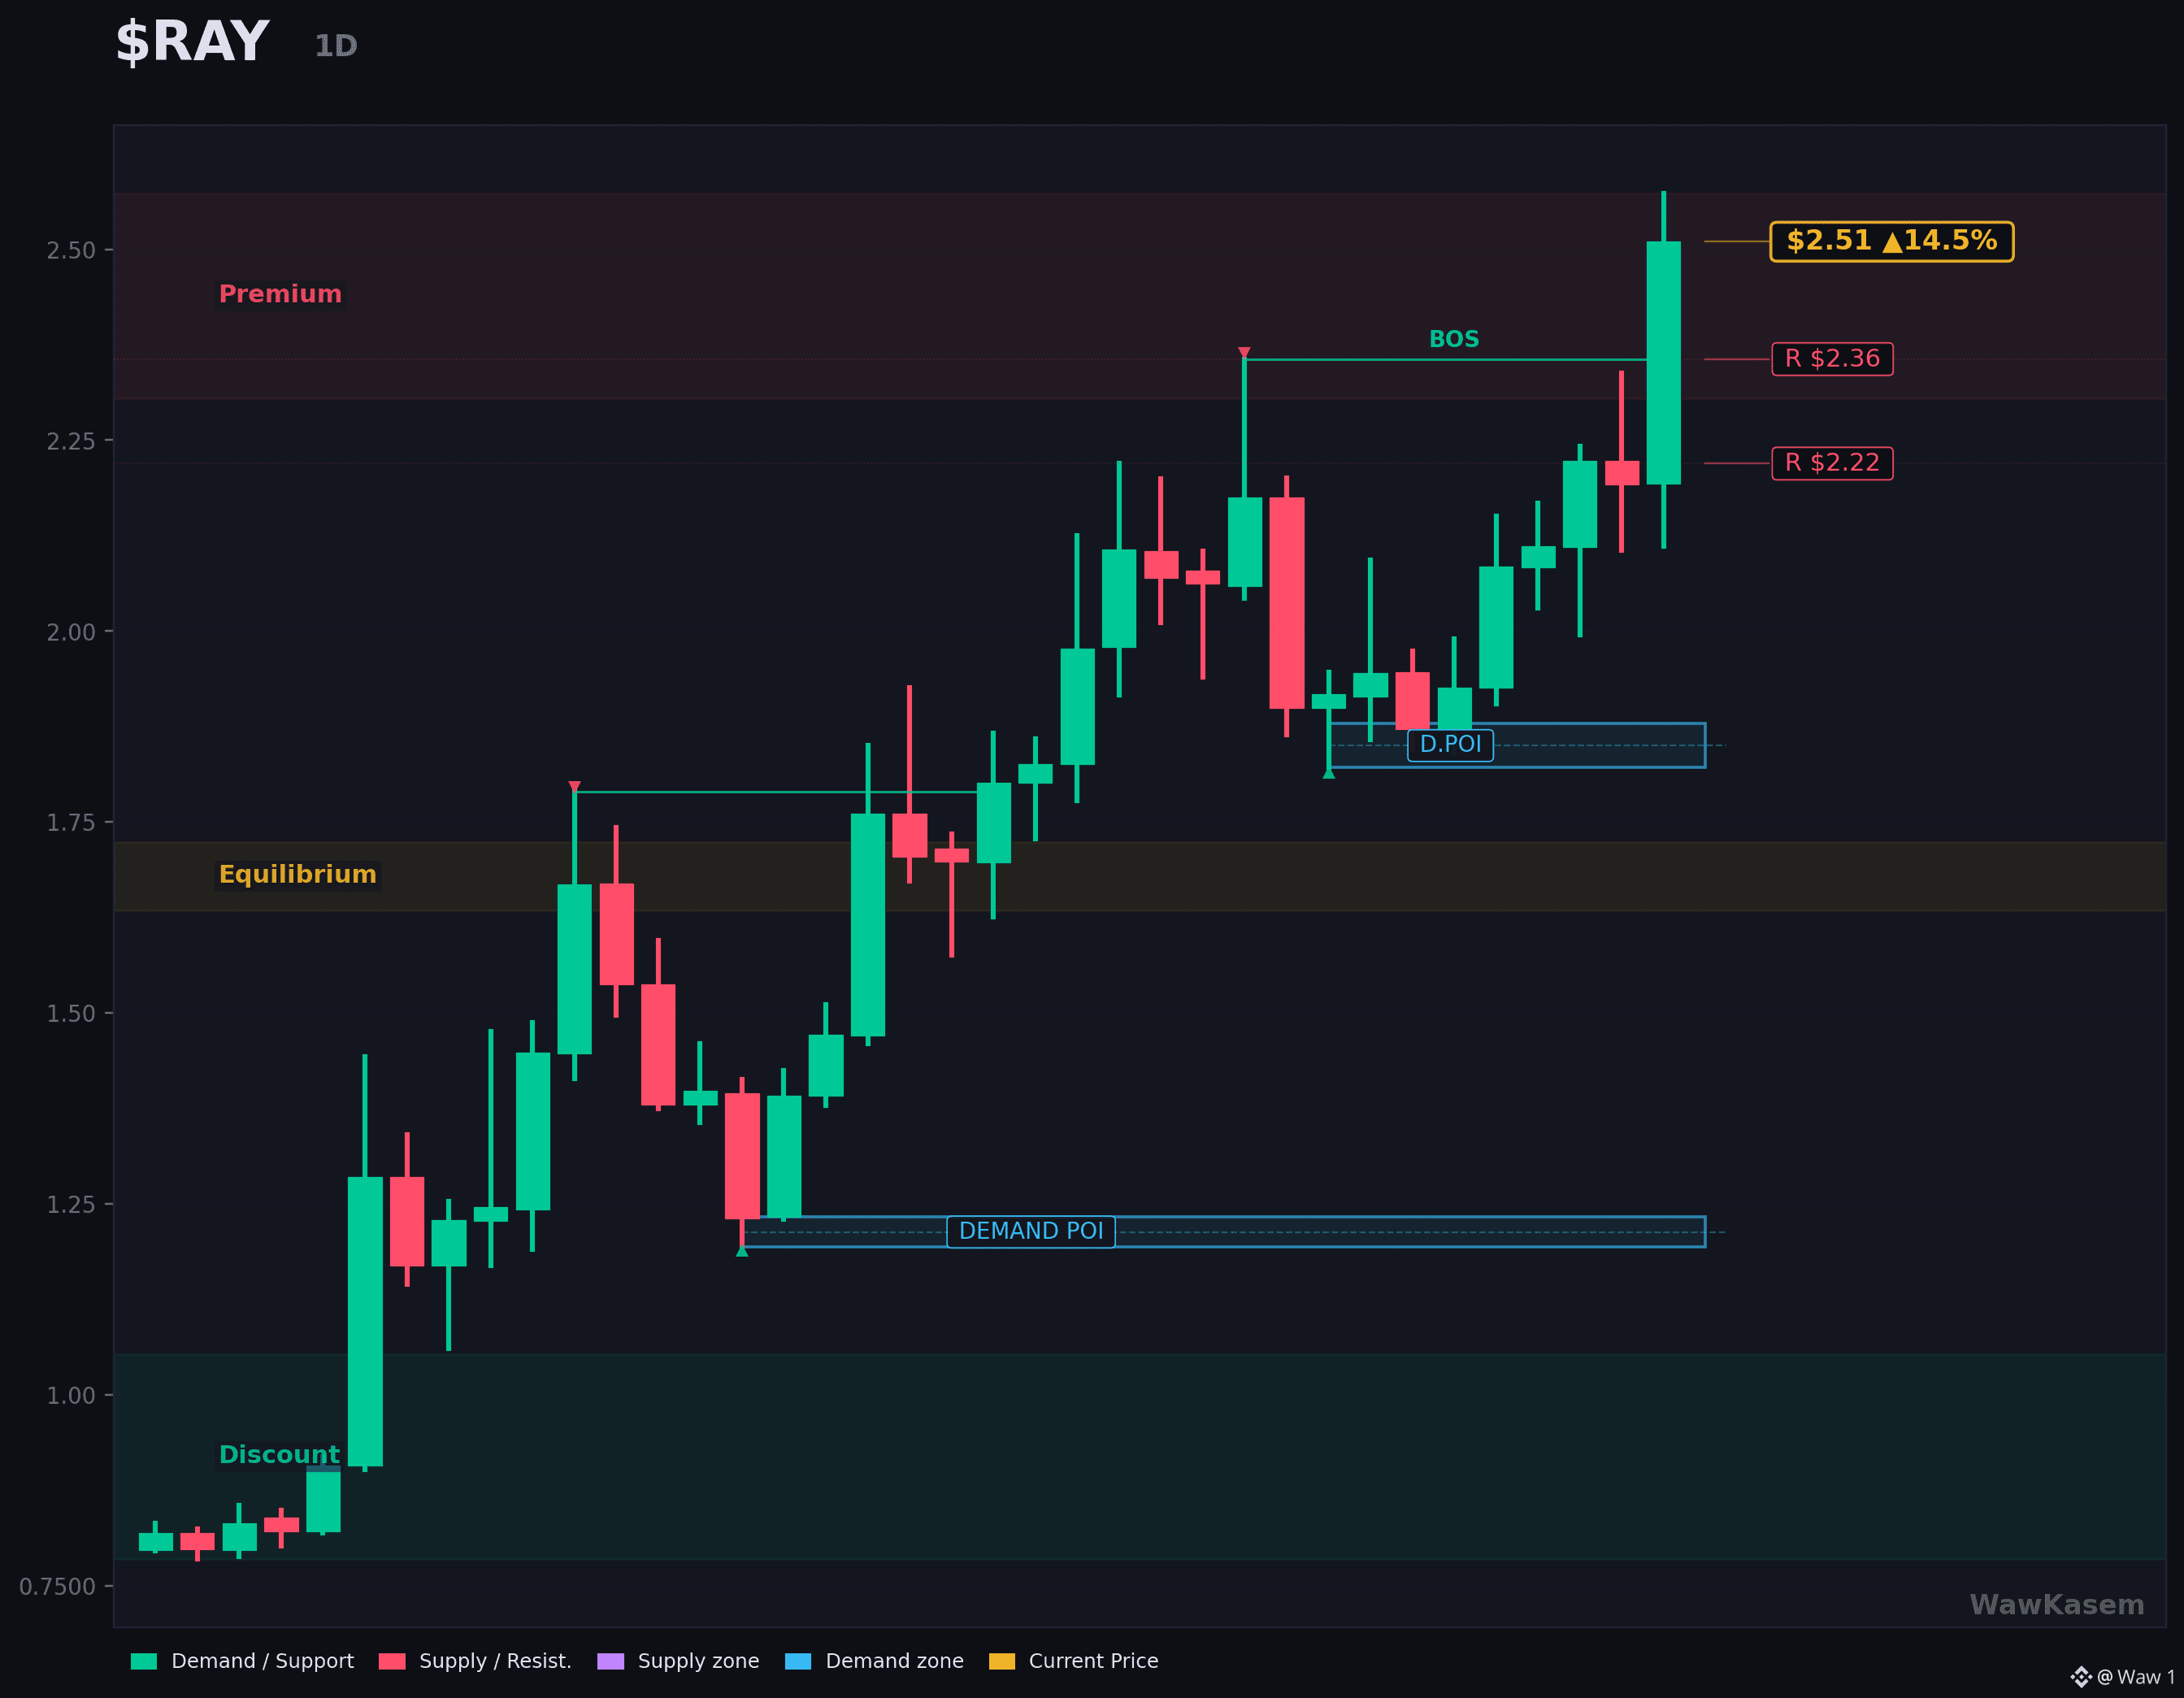
$RAY is up 23.2% since I covered it here on September 24, from 2.0255 to 2.4956, and today it printed 2.5729, a new 30 day high.
Live numbers:
Price: 2.4956 USD
24h: +14.3%, high 2.5729, low 2.1107
7d: +21.2%
30d: +109.2%
Market cap: 670M USD, rank 99
24h volume: 220M USD
What makes today unusual is the context. The rest of the market is red: most large caps are down between 2% and 8% on the session, and this is up 14.3% with a new monthly high.
Volume confirms it is real: 23.6M USD on the main USDT pair today against an 11.3M average over the previous 30 days, so just over twice the recent norm.
One thing has changed since September 24. Back then the rank was 106 and the caveat was supply: 269.7M tokens of a 555M maximum. The rank is now 99 and the supply picture is identical, so fully diluted value is 1.37B against a 670M market cap.
Levels. Below price: 2.36, then 2.22. Above price: 2.5729, today's high.
Context: RAY is 85.3% below its all time high of 16.83 from September 2021.
Follow me for daily trending breakdowns.
#raydium #solana #defi #altcoin #crypto
3
·
--
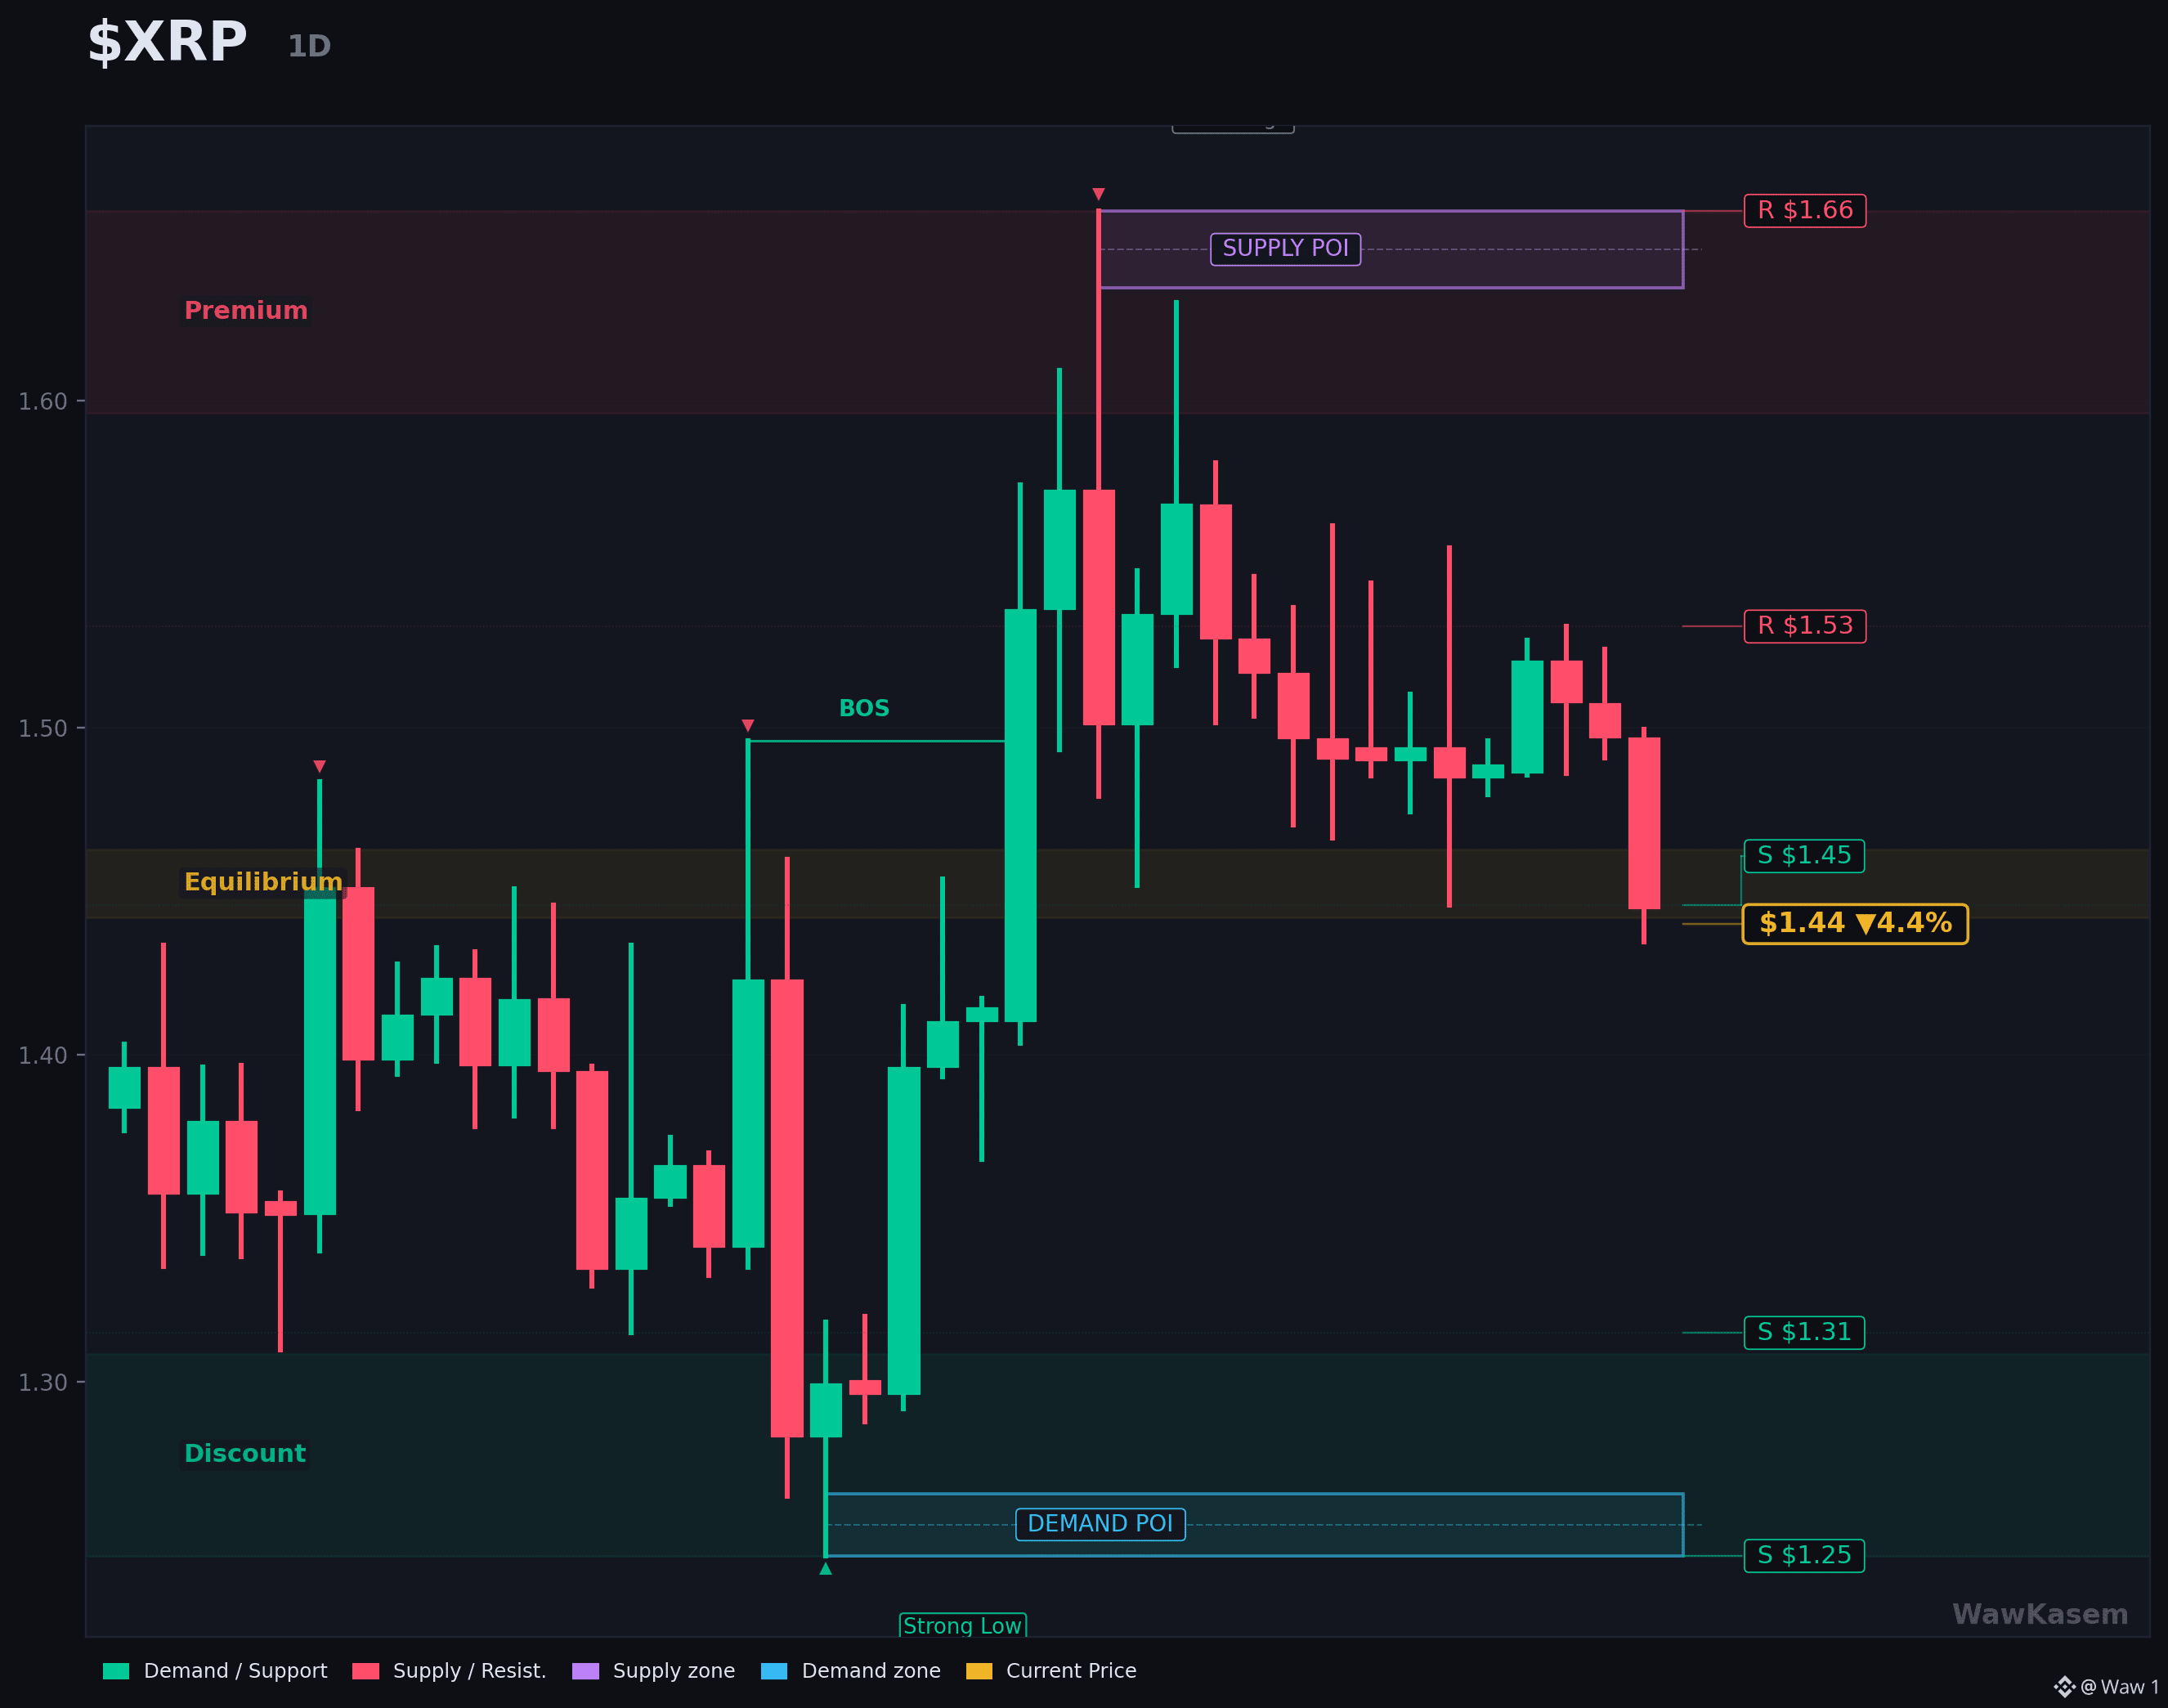
$XRP closed at 1.4449 today, its weakest level since September 21, after breaking the range it had held for two weeks.
Live numbers:
Price: 1.4449 USD
24h: -4.4%, high 1.4996, low 1.4345
7d: -4.6%
30d: +3.3%
Market cap: 91.14B USD, rank 5
24h volume: 2.27B USD
Yesterday the range was the story: seven days of movement adding up to 0.09%, and a daily band of 1.57%. Today that compression resolved to the downside. Price opened at 1.497 and did not trade above 1.4996 at any point.
The level that broke is 1.45, which had held as the floor of the sideways phase. Next reference below is 1.31, and there is little traded structure in between.
Volume still does not confirm much: 151M USD on the main USDT pair against a 246M average over the previous 30 days. The break happened on roughly 60% of normal participation.
Levels. Below price: 1.4345, today's low, then 1.31. Above price: 1.45, then 1.53.
Context: XRP is 60.4% below its all time high of 3.65 from July 2025.
Follow me for daily trending breakdowns.
#xrp #ripple #altcoin #crypto
5
·
--
One criterion filters most of this list for a 2027 horizon: how much of the supply is already out. A token still holding a large unissued share spends the cycle absorbing its own emission. $AVAX is where that maths is uncomfortable. Rank 26, market cap 4.96B, but 443.3M tokens circulating out of a 720M maximum. That is 61.6% out, and fully diluted value sits at 5.26B. The remaining 38% has to be absorbed by new demand before price can compound.
Compare with what a clean float looks like: a token with 97% or more already circulating has no overhang left, and every dollar of demand goes to price instead of to the sellers of newly unlocked supply.
So the honest answer is not a ticker, it is a screen: top 100, circulating above 90% of maximum, and fully diluted value within 15% of market cap. Run it before picking anything to hold for two years.
Context on the name above: AVAX is 92.3% below its all time high of 144.96 from November 2021, and +42% over 30 days.
Follow me for daily trending breakdowns.
#avax #altseason #altcoin #crypto
5
Log in to explore more content
Join global crypto users on Binance Square
⚡️ Get latest and useful information about crypto.
💬 Trusted by the world’s largest crypto exchange.
👍 Discover real insights from verified creators.
Email / Phone number
Trending Topics
BinancePick
2.6M views
141,426 Discussing
Join #EarningsSeason: Predict Earnings on Binance Pick, Share Your Take on Binance Square!
Binance Square Official
·401 Likes
·338.5k views
EarningsSeason
5M views
24,334 Discussing
FranklinTempletonFilesForTwoDividendToBitcoinETFs
1,564 views
88 Discussing