
Trading Different 1
109 Posts

Trading Different 1
Enhance your investments and trading strategy with our indicators. Optimize your Entry Points. Extend your Take Profits. Minimize your Stop Loss.
0 Following
0 Followers
0 Liked
Posts
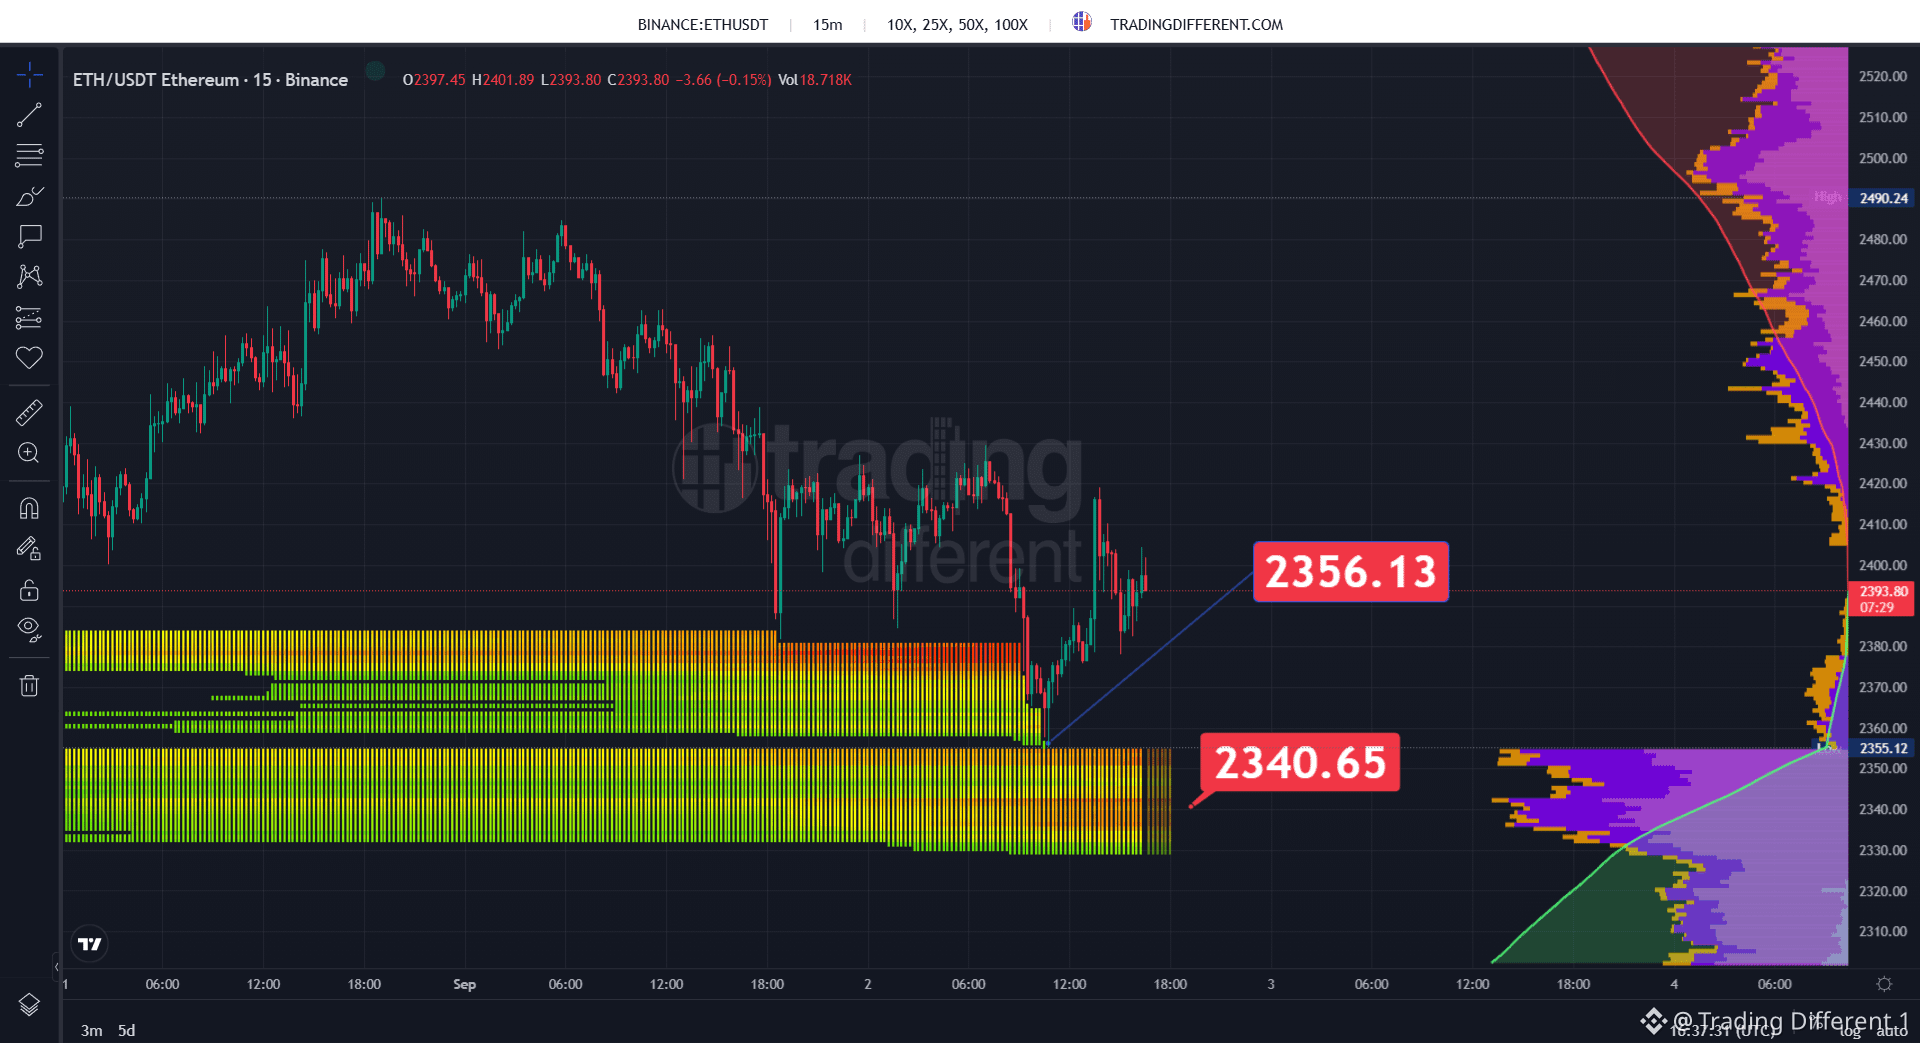
#ETH maintains pressure on an important long liquidation zone. With the price near 2,394, the move has already reached the 2,356 block and reacted from that area. Lower down, there is a second relevant concentration around 2,340, still exposed if bearish pressure returns. In the short term, 2,356–2,340 concentrates the main risk of liquidations shown by the Heatmap.
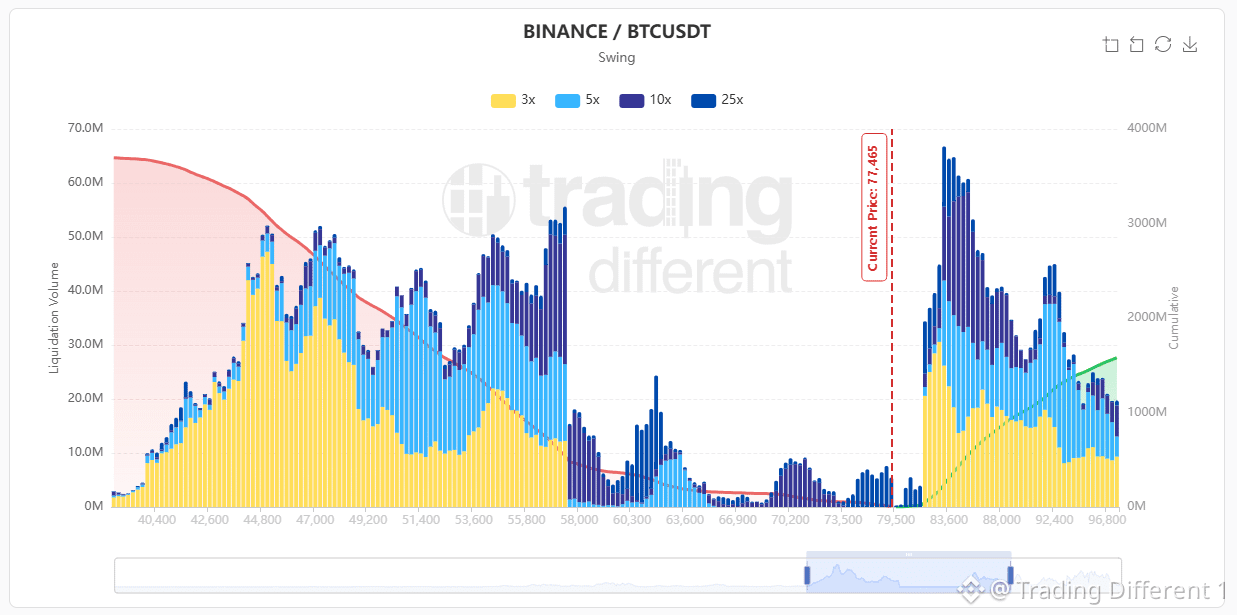
#BTC shows a significant imbalance on the Swing map. With the price near 77,465, short liquidations increase strongly from 82K, with the highest concentration between 83K–86K and new blocks moving toward 88K–93K. Below, long liquidations form a much more extensive structure between 44K–58K, though they are considerably farther from the current price. In cumulative terms, the heaviest load remains underneath, but due to proximity the first major liquidation block is above, from 82K–83K.
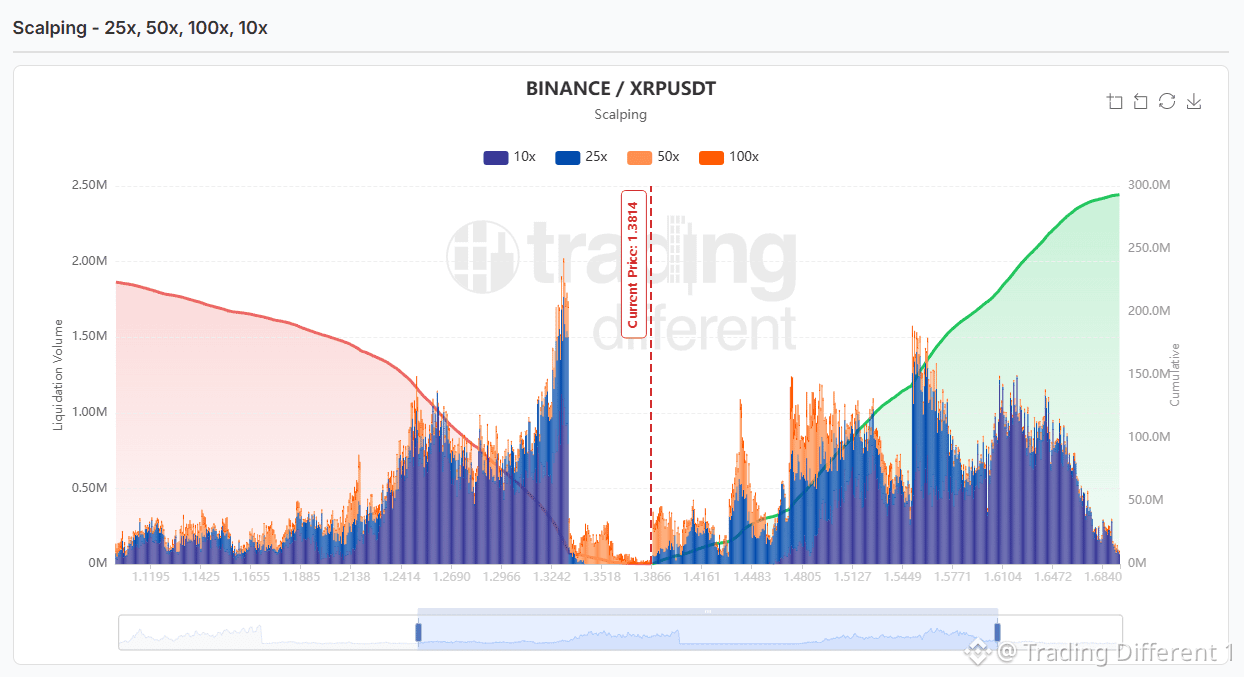
#XRP displays a Scalping map that is fairly split, even though there is a higher total accumulation of liquidations above the current price, around 1.3814. Below, the most relevant block of leveraged longs is concentrated approximately between 1.24 and 1.33, with a particularly strong peak near 1.32–1.33. On the upside, short liquidations start gaining density from 1.44–1.48, but the concentration becomes much more significant between 1.50 and 1.65, with several blocks loaded at 25x, 50x, and 100x. The map leaves meaningful liquidity in both directions, but in accumulated terms, the biggest fuel remains on the upside.
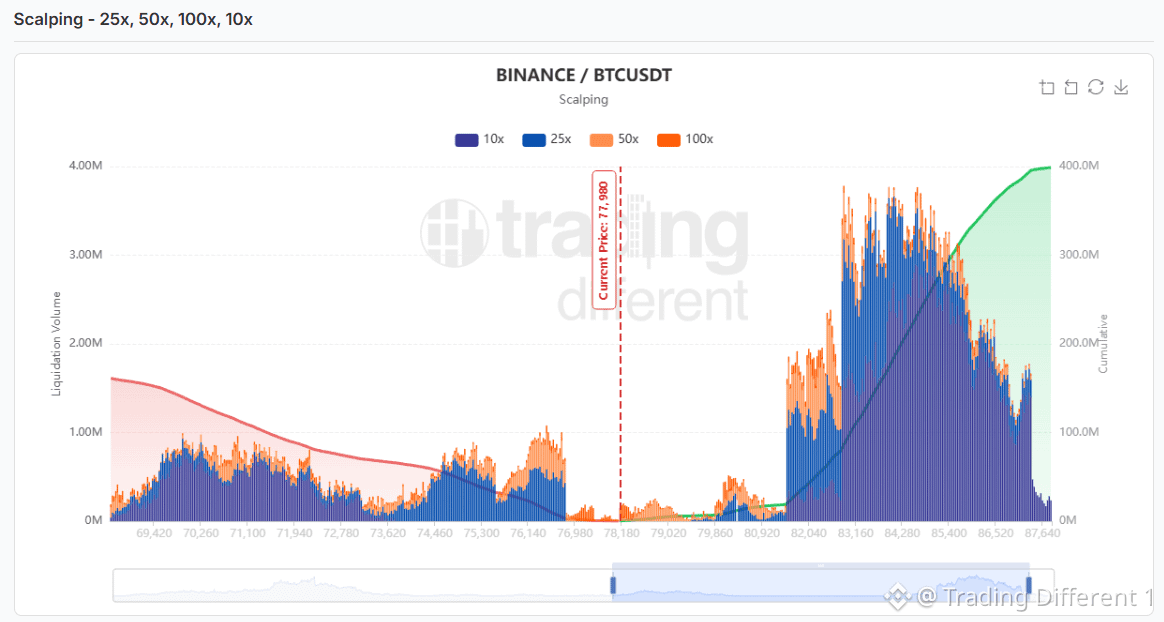
#BTC shows a very clear imbalance on the Scalping liquidation map.
With the price near 77,980, the highest concentration of leveraged positions is above: from approximately 82K it starts to grow strongly, with the main block between 83K and 86K. If the price moves into that area, the shorts would progressively be exposed to liquidations.
Below, there are also vulnerable longs, but the buildup is considerably smaller.
The map doesn’t indicate direction; it shows where the fuel is concentrated. And right now, the heaviest load is on top.
With the price near 77,980, the highest concentration of leveraged positions is above: from approximately 82K it starts to grow strongly, with the main block between 83K and 86K. If the price moves into that area, the shorts would progressively be exposed to liquidations.
Below, there are also vulnerable longs, but the buildup is considerably smaller.
The map doesn’t indicate direction; it shows where the fuel is concentrated. And right now, the heaviest load is on top.
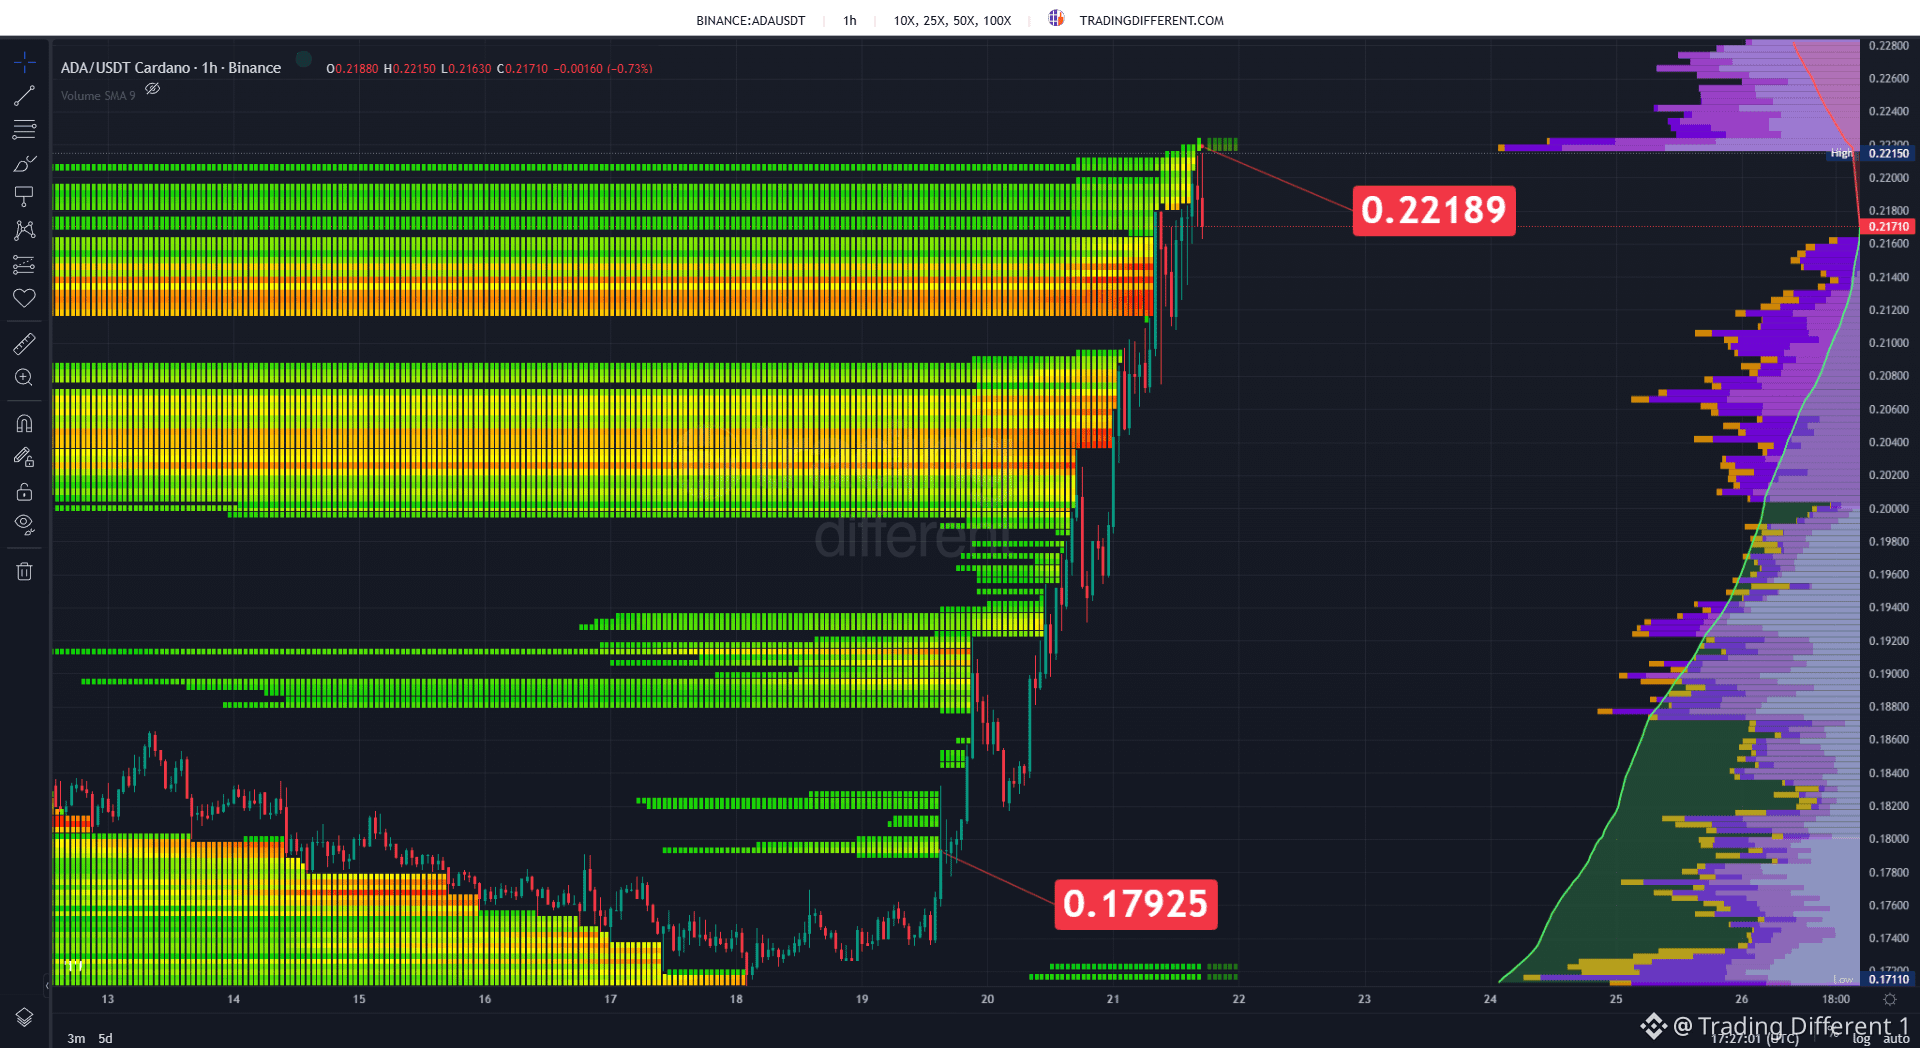
#ADA trades near 0.2171 USD after a strong bullish acceleration from the 0.18 USD zone. The 1H Liquidation Heatmap shows how the price successively broke through large concentrations of short liquidations and ended up reaching the upper block, with a reference close to 0.22189 USD. In this move upward, leveraged positions of 10X, 25X, 50X, and 100X were exposed, while much of the lower zones were left behind as price continued to rise. After touching approximately 0.2215 USD, ADA pulled back to 0.217 USD; now the focus is whether it can break again into the remaining liquidity above 0.22 USD or start to move away from that area following the strong bullish run.
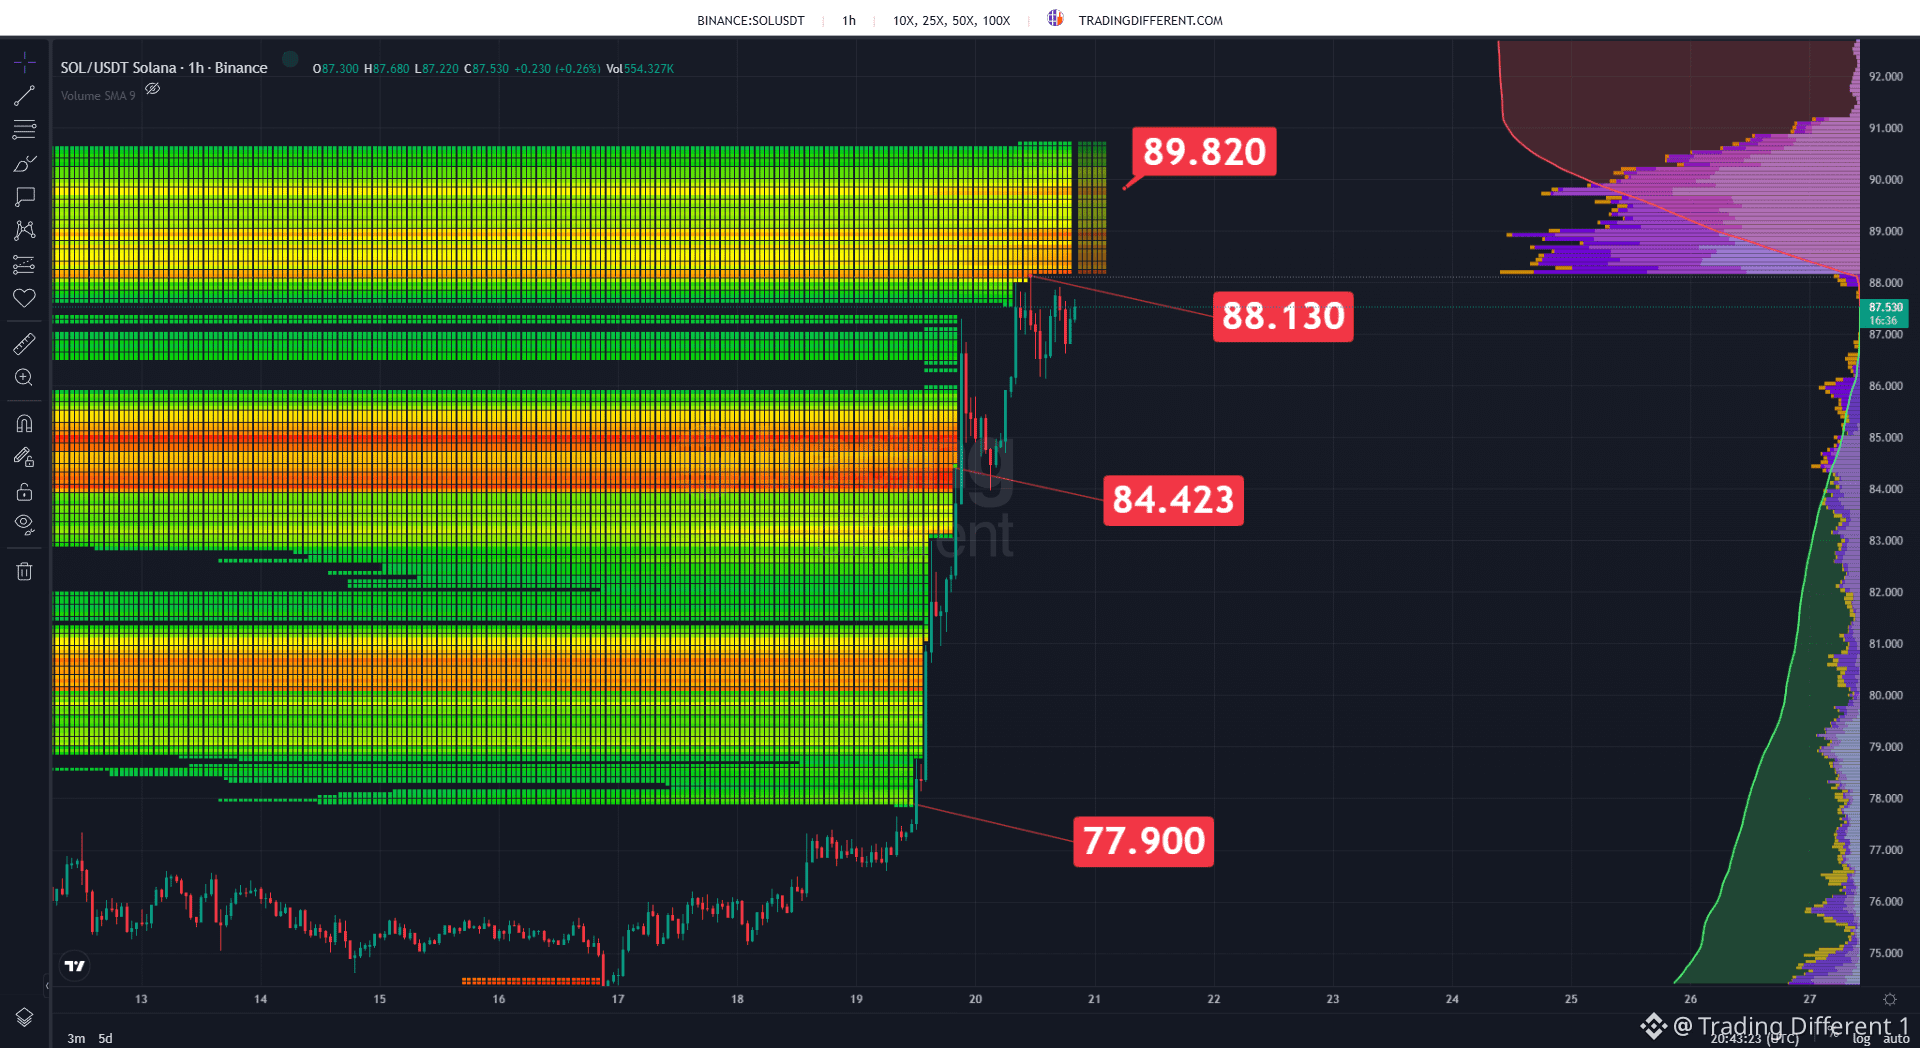
#SOL trades near 87.53 USD after a strong bullish impulse from the 78 USD zone. The 1H Liquidation Heatmap shows that price has already successively swept through short-liquidation areas at 84.42 USD and is now practically sitting on another marked zone around 88.13 USD. Above that, there remains an even more important and dense block, with a heavy concentration of leveraged positions of 10X, 25X, 50X, and 100X up to approximately 89.82 USD. If SOL keeps pushing higher, those shorts become increasingly exposed; whereas a reversal would again put price back below the zones already swept during this fast bullish move.
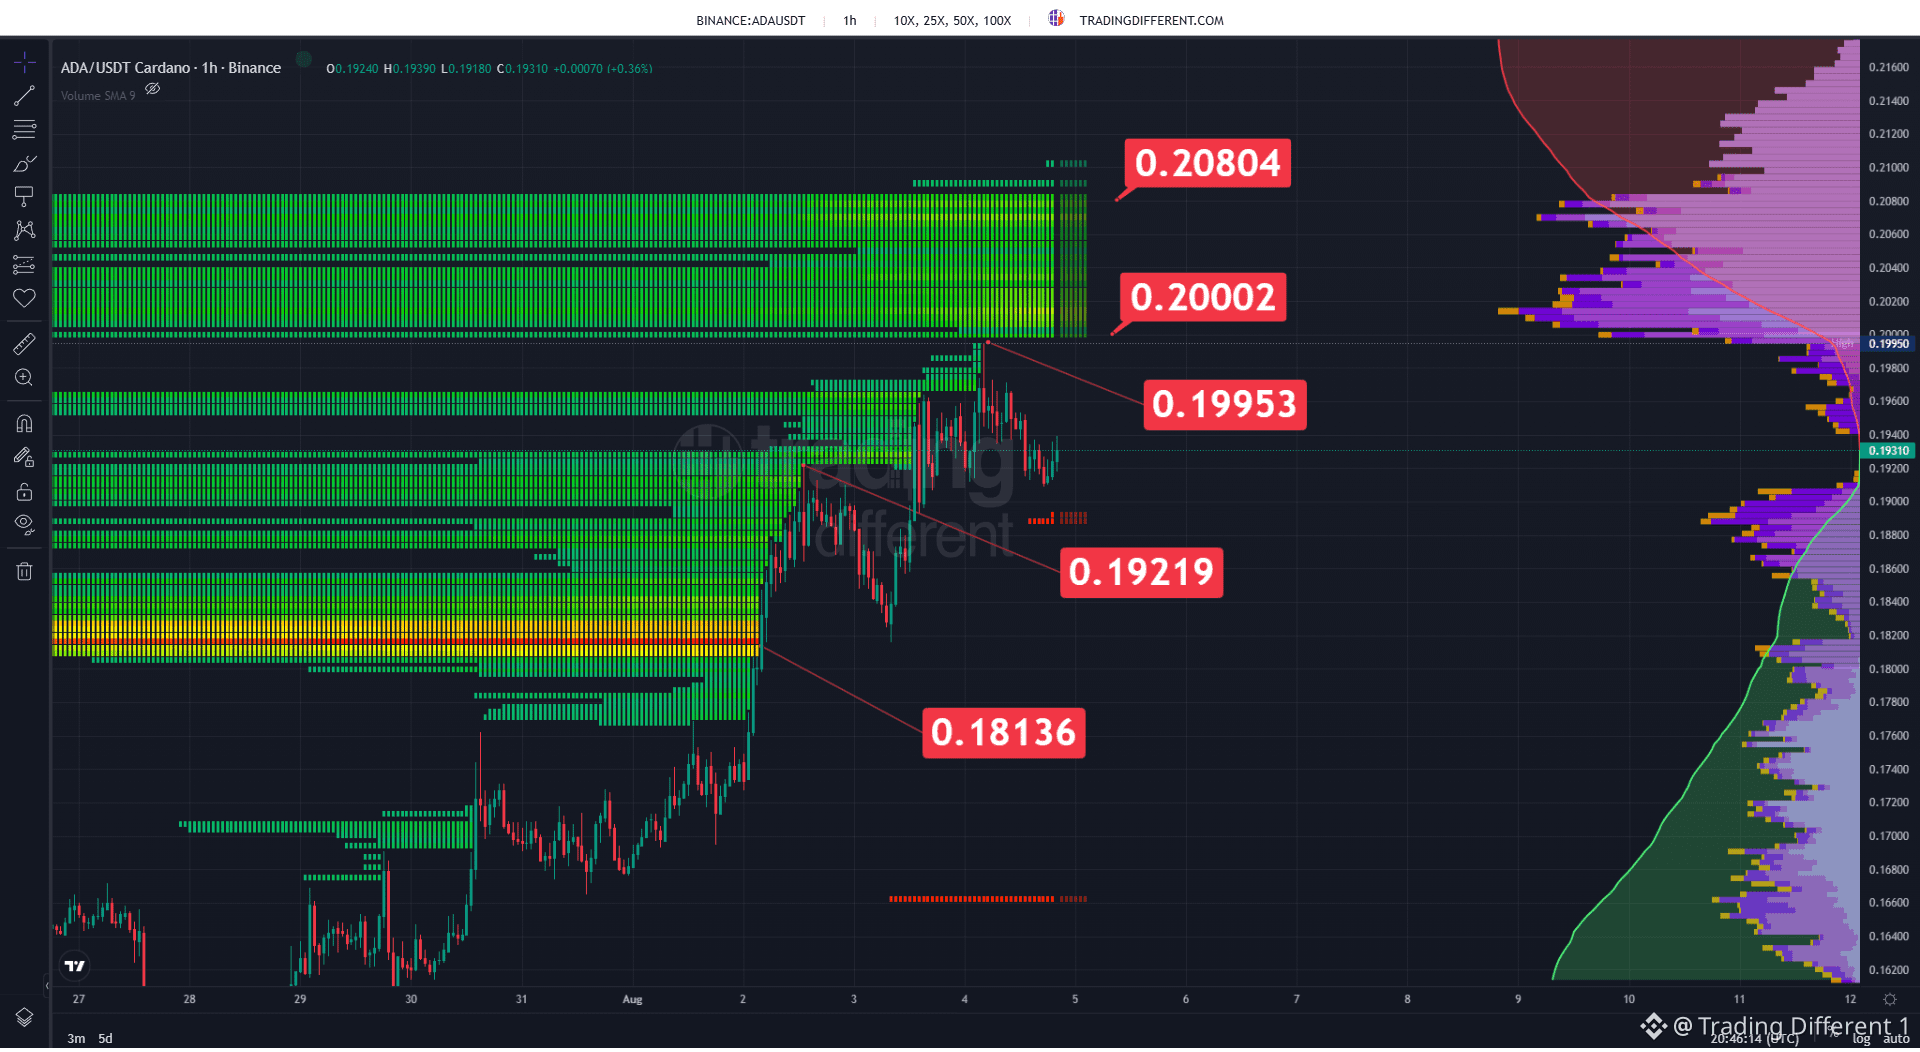
#ADA is trading near 0.1931 USD while the Liquidation Heatmap shows that the price remains between several short liquidation zones that are very close to each other. The first relevant concentration appears around 0.1995 USD, followed by additional blocks at 0.2000 USD and 0.2080 USD, forming an upper liquidity band that could attract the market if buying pressure continues. Below the price, the main long liquidation zones are located near 0.1922 USD and 0.1814 USD, although the most important concentration continues to be the lower one. 📊 With the price trading between both extremes, attention focuses on whether ADA manages to reclaim the 0.1995 USD area to begin sweeping the accumulated short positions, or if it instead seeks liquidity again at the lower levels before defining the next move.
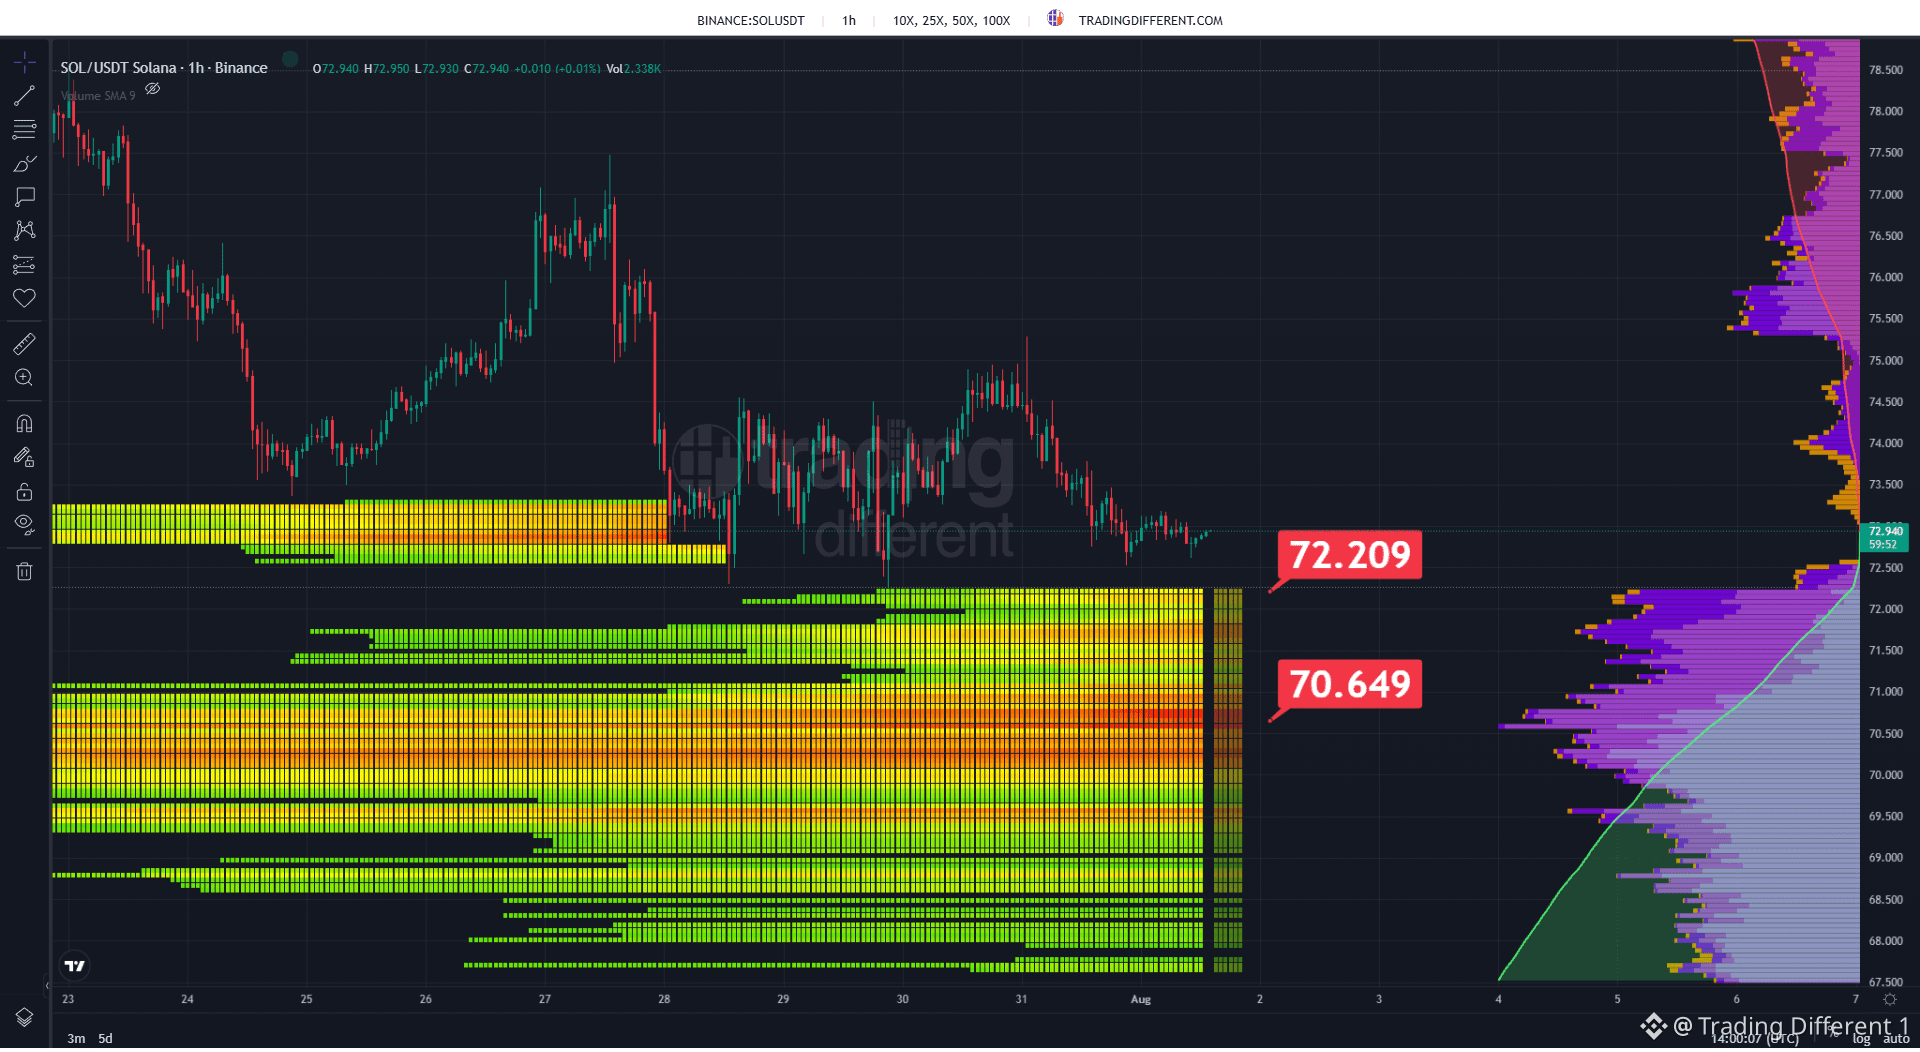
#SOL Solana is trading near 72.94 USD as the Liquidation Heatmap keeps the main long-liquidation concentrations below the price. The first relevant zone appears around 72.21 USD, very close to the current quote, but the largest liquidity block remains concentrated near 70.65 USD, where a wide accumulation of vulnerable long positions persists. 📉 As long as price continues trading above these areas, the market remains incentivized to seek that liquidity before developing a broader move. If selling pressure continues, the 70.65 USD zone remains the most important liquidation target on the chart.
Log in to explore more content