
BlockJammer
2.9k Posts

BlockJammer
Report
Block User
Best Trader: Twitter/X:@YousafJam1 ;; A best Analyst for Technical and fundamental crypto tasks|| DYOR
Open Trade
2 Years
5 Following
1.1K+ Followers
5.4K+ Liked
Posts
Portfolio
All
Quotes
PINNED
·
--
Technical Analysis Report for RED/USDT
$RED /USDT is currently trading at $0.4000, marking a +100% increase in the past 24 hours. The price surged from a 24h low of $0.2000 to a high of $0.4000, indicating a sharp breakout. This extreme price movement suggests high volatility, likely due to its pre-market launch status. The 7-day moving average (MA7) is at $0.4000, reflecting the sharp increase, while other moving averages (MA25 and MA99) are not available due to limited trading history.
The trading volume is relatively low after the initial spike, indicating a potential consolidation phase or a cooling-off period after the surge. If buying momentum continues, RED/USDT could maintain its current level or attempt to push higher. However, if early investors start taking profits, there is a possibility of a retracement towards $0.30-$0.25 levels.
Traders should watch for volume increases and price stability before entering, as pre-market tokens often experience rapid price fluctuations. Confirmation of support levels and sustained demand will be crucial for further bullish continuation.
Technical Analysis Report for RED/USDT
$RED /USDT is currently trading at $0.4000, marking a +100% increase in the past 24 hours. The price surged from a 24h low of $0.2000 to a high of $0.4000, indicating a sharp breakout. This extreme price movement suggests high volatility, likely due to its pre-market launch status. The 7-day moving average (MA7) is at $0.4000, reflecting the sharp increase, while other moving averages (MA25 and MA99) are not available due to limited trading history.
The trading volume is relatively low after the initial spike, indicating a potential consolidation phase or a cooling-off period after the surge. If buying momentum continues, RED/USDT could maintain its current level or attempt to push higher. However, if early investors start taking profits, there is a possibility of a retracement towards $0.30-$0.25 levels.
Traders should watch for volume increases and price stability before entering, as pre-market tokens often experience rapid price fluctuations. Confirmation of support levels and sustained demand will be crucial for further bullish continuation.
$RED /USDT is currently trading at $0.4000, marking a +100% increase in the past 24 hours. The price surged from a 24h low of $0.2000 to a high of $0.4000, indicating a sharp breakout. This extreme price movement suggests high volatility, likely due to its pre-market launch status. The 7-day moving average (MA7) is at $0.4000, reflecting the sharp increase, while other moving averages (MA25 and MA99) are not available due to limited trading history.
The trading volume is relatively low after the initial spike, indicating a potential consolidation phase or a cooling-off period after the surge. If buying momentum continues, RED/USDT could maintain its current level or attempt to push higher. However, if early investors start taking profits, there is a possibility of a retracement towards $0.30-$0.25 levels.
Traders should watch for volume increases and price stability before entering, as pre-market tokens often experience rapid price fluctuations. Confirmation of support levels and sustained demand will be crucial for further bullish continuation.

7
6
12
20.5k
PINNED
·
--
$BTC /USDT Technical Analysis – Reversal or Further Drop?
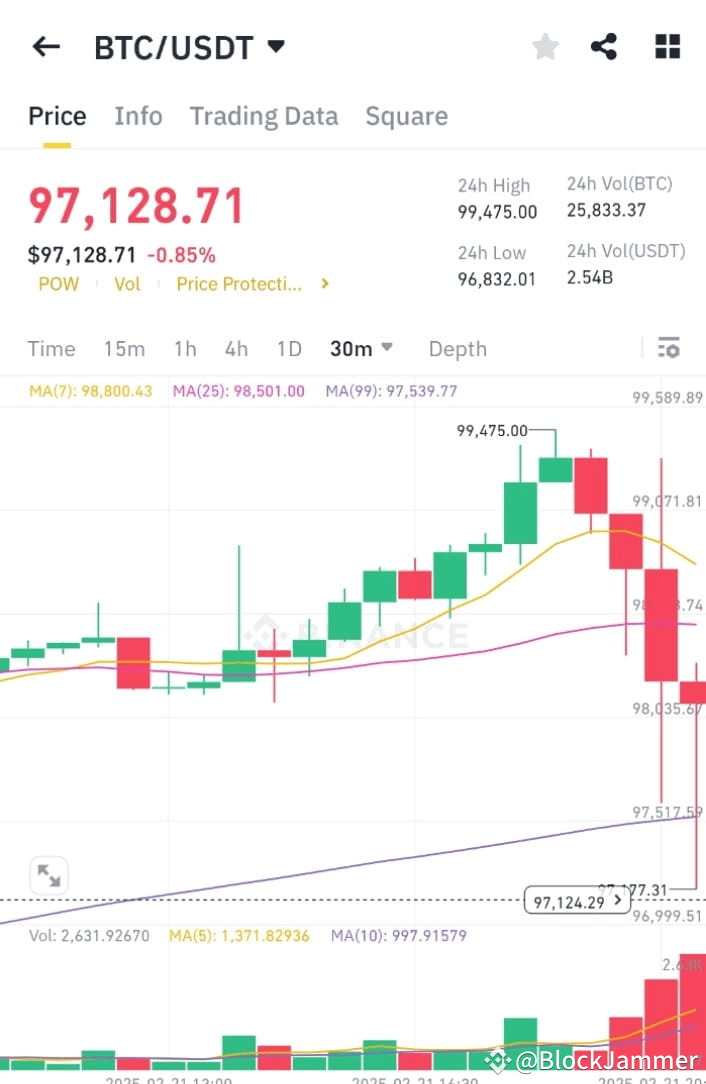
Bitcoin ($BTC ) is currently trading at $97,128.71, showing a -0.85% decline, with a 24h high of $99,475 and a 24h low of $96,832. The short-term trend indicates a pullback after hitting resistance near $99,500, where sellers took control. The 7-day MA ($98,800.43) and 25-day MA ($98,501.00) are above the current price, signaling short-term bearish momentum. Additionally, the 99-day MA ($97,539.77) is acting as minor support. If BTC breaks below $96,800, it could test deeper support levels around $96,000 – $95,500. However, if BTC reclaims the $98,000 level, a bounce towards $99,000 – $100,000 is possible.
Trading Signals – Entry & Targets
Bullish Scenario: If BTC holds above $97,000 and reclaims $98,000, buy with targets at $98,800 – $99,500 – $100,500. Stop-loss at $96,500.
Bearish Scenario: If BTC loses $96,800, short entries can target $96,000 – $95,500 – $94,800. Stop-loss at $97,500.
Key Resistance: $98,000 – $99,500 – $100,500
Key Support: $96,800 – $96,000 – $95,500
Traders should watch for volume confirmation and a breakout above resistance before taking long positions. A sharp bounce from support could trigger another bullish rally!
$BTC /USDT Technical Analysis – Reversal or Further Drop?
Bitcoin ($BTC ) is currently trading at $97,128.71, showing a -0.85% decline, with a 24h high of $99,475 and a 24h low of $96,832. The short-term trend indicates a pullback after hitting resistance near $99,500, where sellers took control. The 7-day MA ($98,800.43) and 25-day MA ($98,501.00) are above the current price, signaling short-term bearish momentum. Additionally, the 99-day MA ($97,539.77) is acting as minor support. If BTC breaks below $96,800, it could test deeper support levels around $96,000 – $95,500. However, if BTC reclaims the $98,000 level, a bounce towards $99,000 – $100,000 is possible.
Trading Signals – Entry & Targets
Bullish Scenario: If BTC holds above $97,000 and reclaims $98,000, buy with targets at $98,800 – $99,500 – $100,500. Stop-loss at $96,500.
Bearish Scenario: If BTC loses $96,800, short entries can target $96,000 – $95,500 – $94,800. Stop-loss at $97,500.
Key Resistance: $98,000 – $99,500 – $100,500
Key Support: $96,800 – $96,000 – $95,500
Traders should watch for volume confirmation and a breakout above resistance before taking long positions. A sharp bounce from support could trigger another bullish rally!
Bitcoin ($BTC ) is currently trading at $97,128.71, showing a -0.85% decline, with a 24h high of $99,475 and a 24h low of $96,832. The short-term trend indicates a pullback after hitting resistance near $99,500, where sellers took control. The 7-day MA ($98,800.43) and 25-day MA ($98,501.00) are above the current price, signaling short-term bearish momentum. Additionally, the 99-day MA ($97,539.77) is acting as minor support. If BTC breaks below $96,800, it could test deeper support levels around $96,000 – $95,500. However, if BTC reclaims the $98,000 level, a bounce towards $99,000 – $100,000 is possible.
Trading Signals – Entry & Targets
Bullish Scenario: If BTC holds above $97,000 and reclaims $98,000, buy with targets at $98,800 – $99,500 – $100,500. Stop-loss at $96,500.
Bearish Scenario: If BTC loses $96,800, short entries can target $96,000 – $95,500 – $94,800. Stop-loss at $97,500.
Key Resistance: $98,000 – $99,500 – $100,500
Key Support: $96,800 – $96,000 – $95,500
Traders should watch for volume confirmation and a breakout above resistance before taking long positions. A sharp bounce from support could trigger another bullish rally!
1
1
8
18.9k
·
--
$DASH /USDT Market Analysis – Bullish Momentum Continues
DASH/USDT is showing a powerful bullish breakout on the 1-hour timeframe, with price surging nearly 12% intraday and reaching a strong local high near 48.04 USDT. The market structure remains highly aggressive as buyers continue dominating the order book with over 62% bid strength, indicating strong accumulation pressure from bulls. Volume has expanded significantly above normal levels, confirming that this rally is supported by real market participation rather than weak speculative movement. After bouncing from the 41.56 support zone, DASH delivered a sharp impulsive rally, which signals growing confidence among short-term traders and momentum investors. If buyers maintain control above the 47.00–47.20 support region, the market could attempt another breakout toward the psychological resistance levels around 49.50 and 50.00 USDT in the upcoming sessions.
From a trading perspective, momentum traders should focus on pullback entries instead of chasing candles after extended moves. The current trend remains strongly bullish, but short-term volatility may increase after such a rapid expansion. Smart traders can watch for healthy retracements near EMA support zones before entering fresh long positions with proper risk management. As long as DASH holds above the breakout range, overall sentiment remains positive and buyers are likely to stay in control. However, a breakdown below 46.80 USDT could trigger temporary profit-taking and short-term consolidation. Overall, DASH is currently one of the stronger gainers in the market, and traders should remain disciplined, follow volume confirmation, and use stop-loss protection to maximize profitable opportunities while minimizing unnecessary risk.
$DASH /USDT Market Analysis – Bullish Momentum Continues
DASH/USDT is showing a powerful bullish breakout on the 1-hour timeframe, with price surging nearly 12% intraday and reaching a strong local high near 48.04 USDT. The market structure remains highly aggressive as buyers continue dominating the order book with over 62% bid strength, indicating strong accumulation pressure from bulls. Volume has expanded significantly above normal levels, confirming that this rally is supported by real market participation rather than weak speculative movement. After bouncing from the 41.56 support zone, DASH delivered a sharp impulsive rally, which signals growing confidence among short-term traders and momentum investors. If buyers maintain control above the 47.00–47.20 support region, the market could attempt another breakout toward the psychological resistance levels around 49.50 and 50.00 USDT in the upcoming sessions.
From a trading perspective, momentum traders should focus on pullback entries instead of chasing candles after extended moves. The current trend remains strongly bullish, but short-term volatility may increase after such a rapid expansion. Smart traders can watch for healthy retracements near EMA support zones before entering fresh long positions with proper risk management. As long as DASH holds above the breakout range, overall sentiment remains positive and buyers are likely to stay in control. However, a breakdown below 46.80 USDT could trigger temporary profit-taking and short-term consolidation. Overall, DASH is currently one of the stronger gainers in the market, and traders should remain disciplined, follow volume confirmation, and use stop-loss protection to maximize profitable opportunities while minimizing unnecessary risk.
DASH/USDT is showing a powerful bullish breakout on the 1-hour timeframe, with price surging nearly 12% intraday and reaching a strong local high near 48.04 USDT. The market structure remains highly aggressive as buyers continue dominating the order book with over 62% bid strength, indicating strong accumulation pressure from bulls. Volume has expanded significantly above normal levels, confirming that this rally is supported by real market participation rather than weak speculative movement. After bouncing from the 41.56 support zone, DASH delivered a sharp impulsive rally, which signals growing confidence among short-term traders and momentum investors. If buyers maintain control above the 47.00–47.20 support region, the market could attempt another breakout toward the psychological resistance levels around 49.50 and 50.00 USDT in the upcoming sessions.
From a trading perspective, momentum traders should focus on pullback entries instead of chasing candles after extended moves. The current trend remains strongly bullish, but short-term volatility may increase after such a rapid expansion. Smart traders can watch for healthy retracements near EMA support zones before entering fresh long positions with proper risk management. As long as DASH holds above the breakout range, overall sentiment remains positive and buyers are likely to stay in control. However, a breakdown below 46.80 USDT could trigger temporary profit-taking and short-term consolidation. Overall, DASH is currently one of the stronger gainers in the market, and traders should remain disciplined, follow volume confirmation, and use stop-loss protection to maximize profitable opportunities while minimizing unnecessary risk.

143
·
--
$BANANAS31 /USDT Market Report – Bullish Momentum Building
BANANAS31/USDT is showing a strong bullish breakout structure after a powerful move from the 0.0096 support zone toward the recent high near 0.0117. The pair has gained impressive momentum with strong buying pressure and high market participation, as reflected by the massive 24h trading volume. Buyers successfully pushed the price above key short-term resistance levels, creating a bullish continuation pattern on the 1-hour timeframe. Even after touching the 0.0117 high, the market is showing healthy consolidation instead of a heavy dump, which is usually considered a positive sign for momentum traders. The current price action around 0.0113 indicates that bulls are still defending the market and preparing for another possible upside expansion if volume remains strong.
From a trading perspective, traders should closely watch the support area between 0.0110 – 0.0109. As long as price holds above this zone, bullish continuation toward 0.0117 and potentially higher levels remains possible. A breakout above 0.0117 with strong candle confirmation could trigger fresh momentum buying and attract more intraday traders. However, traders should avoid emotional entries after large green candles and instead wait for smart pullbacks or breakout confirmations for safer risk management. Volume is the key driver here — increasing volume with bullish candles may signal continuation, while weak volume near resistance can lead to short-term corrections. Overall, BANANAS31/USDT currently remains one of the stronger gainers in the market, and disciplined traders focusing on trend confirmation, proper stop-loss placement, and breakout momentum may find profitable opportunities in the ongoing bullish setup.
$BANANAS31 /USDT Market Report – Bullish Momentum Building
BANANAS31/USDT is showing a strong bullish breakout structure after a powerful move from the 0.0096 support zone toward the recent high near 0.0117. The pair has gained impressive momentum with strong buying pressure and high market participation, as reflected by the massive 24h trading volume. Buyers successfully pushed the price above key short-term resistance levels, creating a bullish continuation pattern on the 1-hour timeframe. Even after touching the 0.0117 high, the market is showing healthy consolidation instead of a heavy dump, which is usually considered a positive sign for momentum traders. The current price action around 0.0113 indicates that bulls are still defending the market and preparing for another possible upside expansion if volume remains strong.
From a trading perspective, traders should closely watch the support area between 0.0110 – 0.0109. As long as price holds above this zone, bullish continuation toward 0.0117 and potentially higher levels remains possible. A breakout above 0.0117 with strong candle confirmation could trigger fresh momentum buying and attract more intraday traders. However, traders should avoid emotional entries after large green candles and instead wait for smart pullbacks or breakout confirmations for safer risk management. Volume is the key driver here — increasing volume with bullish candles may signal continuation, while weak volume near resistance can lead to short-term corrections. Overall, BANANAS31/USDT currently remains one of the stronger gainers in the market, and disciplined traders focusing on trend confirmation, proper stop-loss placement, and breakout momentum may find profitable opportunities in the ongoing bullish setup.
BANANAS31/USDT is showing a strong bullish breakout structure after a powerful move from the 0.0096 support zone toward the recent high near 0.0117. The pair has gained impressive momentum with strong buying pressure and high market participation, as reflected by the massive 24h trading volume. Buyers successfully pushed the price above key short-term resistance levels, creating a bullish continuation pattern on the 1-hour timeframe. Even after touching the 0.0117 high, the market is showing healthy consolidation instead of a heavy dump, which is usually considered a positive sign for momentum traders. The current price action around 0.0113 indicates that bulls are still defending the market and preparing for another possible upside expansion if volume remains strong.
From a trading perspective, traders should closely watch the support area between 0.0110 – 0.0109. As long as price holds above this zone, bullish continuation toward 0.0117 and potentially higher levels remains possible. A breakout above 0.0117 with strong candle confirmation could trigger fresh momentum buying and attract more intraday traders. However, traders should avoid emotional entries after large green candles and instead wait for smart pullbacks or breakout confirmations for safer risk management. Volume is the key driver here — increasing volume with bullish candles may signal continuation, while weak volume near resistance can lead to short-term corrections. Overall, BANANAS31/USDT currently remains one of the stronger gainers in the market, and disciplined traders focusing on trend confirmation, proper stop-loss placement, and breakout momentum may find profitable opportunities in the ongoing bullish setup.

1
198
·
--
$BTC /USDT Market Report
Bitcoin (BTC/USDT) is showing strong recovery momentum after defending the major support zone near 78,754, where buyers aggressively stepped in and pushed price back toward the 79,900 – 80,000 resistance area. The 1-hour chart reflects a bullish rebound structure with consecutive green candles, indicating that market sentiment is shifting back in favor of the bulls. Current price action around 79,918 with positive daily growth of +0.40% suggests that traders are regaining confidence after recent volatility. Order-book strength is also highly impressive, with buyers dominating nearly 69%, signaling strong accumulation pressure and increasing chances of an upside continuation if BTC successfully breaks above the psychological 80K barrier. Volume remains healthy, which confirms active participation from institutional and retail traders.
From a trading perspective, smart traders should closely monitor the 80,300 – 81,300 resistance region, as a clean breakout above this zone could trigger a fresh bullish rally toward higher targets. On the downside, the 79,100 – 78,700 area remains a critical support range where dip-buyers may re-enter aggressively. The market currently favors short-term bullish momentum, but disciplined risk management remains essential due to ongoing volatility in the crypto market. Traders looking for profitable opportunities may focus on breakout confirmations rather than emotional entries. Overall, BTC is showing signs of rebuilding bullish strength, and if buying momentum continues increasing, this recovery phase could transform into a stronger upward trend in the coming sessions.
$BTC /USDT Market Report
Bitcoin (BTC/USDT) is showing strong recovery momentum after defending the major support zone near 78,754, where buyers aggressively stepped in and pushed price back toward the 79,900 – 80,000 resistance area. The 1-hour chart reflects a bullish rebound structure with consecutive green candles, indicating that market sentiment is shifting back in favor of the bulls. Current price action around 79,918 with positive daily growth of +0.40% suggests that traders are regaining confidence after recent volatility. Order-book strength is also highly impressive, with buyers dominating nearly 69%, signaling strong accumulation pressure and increasing chances of an upside continuation if BTC successfully breaks above the psychological 80K barrier. Volume remains healthy, which confirms active participation from institutional and retail traders.
From a trading perspective, smart traders should closely monitor the 80,300 – 81,300 resistance region, as a clean breakout above this zone could trigger a fresh bullish rally toward higher targets. On the downside, the 79,100 – 78,700 area remains a critical support range where dip-buyers may re-enter aggressively. The market currently favors short-term bullish momentum, but disciplined risk management remains essential due to ongoing volatility in the crypto market. Traders looking for profitable opportunities may focus on breakout confirmations rather than emotional entries. Overall, BTC is showing signs of rebuilding bullish strength, and if buying momentum continues increasing, this recovery phase could transform into a stronger upward trend in the coming sessions.
Bitcoin (BTC/USDT) is showing strong recovery momentum after defending the major support zone near 78,754, where buyers aggressively stepped in and pushed price back toward the 79,900 – 80,000 resistance area. The 1-hour chart reflects a bullish rebound structure with consecutive green candles, indicating that market sentiment is shifting back in favor of the bulls. Current price action around 79,918 with positive daily growth of +0.40% suggests that traders are regaining confidence after recent volatility. Order-book strength is also highly impressive, with buyers dominating nearly 69%, signaling strong accumulation pressure and increasing chances of an upside continuation if BTC successfully breaks above the psychological 80K barrier. Volume remains healthy, which confirms active participation from institutional and retail traders.
From a trading perspective, smart traders should closely monitor the 80,300 – 81,300 resistance region, as a clean breakout above this zone could trigger a fresh bullish rally toward higher targets. On the downside, the 79,100 – 78,700 area remains a critical support range where dip-buyers may re-enter aggressively. The market currently favors short-term bullish momentum, but disciplined risk management remains essential due to ongoing volatility in the crypto market. Traders looking for profitable opportunities may focus on breakout confirmations rather than emotional entries. Overall, BTC is showing signs of rebuilding bullish strength, and if buying momentum continues increasing, this recovery phase could transform into a stronger upward trend in the coming sessions.

1
119
·
--
Bullish
$SAGA /USDT Market Report
SAGA/USDT is showing a powerful bullish breakout on the 1-hour timeframe, gaining more than 37% within 24 hours, which clearly confirms strong buyer dominance and aggressive market momentum. The price successfully moved from the 0.0218 support zone toward the current trading area near 0.0367, while printing higher highs and higher lows — a classic bullish continuation structure. Trading volume has expanded significantly with over 2.03B SAGA volume, indicating that institutional and high-volume traders are actively participating in the move. The recent candles near the 0.0382 resistance zone show temporary consolidation rather than weakness, which usually signals that buyers are preparing for another potential breakout attempt. As long as the price remains above the 0.0350 – 0.0345 support area, bullish momentum remains intact and dip-buying opportunities may continue to attract traders.
From a trading perspective, momentum traders should closely watch the breakout above 0.0382, as a strong candle close above this resistance could open the path toward new short-term targets around 0.0400 – 0.0450. However, because the coin has already experienced a sharp rally, smart risk management is essential. Traders should avoid emotional entries during peak volatility and instead wait for healthy pullbacks or confirmed breakout retests before entering positions. The current structure favors bulls, but profit-taking near resistance levels can create temporary corrections. Overall, SAGA currently stands among the strongest gainers in the market, supported by strong volume, bullish sentiment, and consistent buying pressure — making it a high-attention coin for short-term momentum and breakout traders.
$SAGA /USDT Market Report
SAGA/USDT is showing a powerful bullish breakout on the 1-hour timeframe, gaining more than 37% within 24 hours, which clearly confirms strong buyer dominance and aggressive market momentum. The price successfully moved from the 0.0218 support zone toward the current trading area near 0.0367, while printing higher highs and higher lows — a classic bullish continuation structure. Trading volume has expanded significantly with over 2.03B SAGA volume, indicating that institutional and high-volume traders are actively participating in the move. The recent candles near the 0.0382 resistance zone show temporary consolidation rather than weakness, which usually signals that buyers are preparing for another potential breakout attempt. As long as the price remains above the 0.0350 – 0.0345 support area, bullish momentum remains intact and dip-buying opportunities may continue to attract traders.
From a trading perspective, momentum traders should closely watch the breakout above 0.0382, as a strong candle close above this resistance could open the path toward new short-term targets around 0.0400 – 0.0450. However, because the coin has already experienced a sharp rally, smart risk management is essential. Traders should avoid emotional entries during peak volatility and instead wait for healthy pullbacks or confirmed breakout retests before entering positions. The current structure favors bulls, but profit-taking near resistance levels can create temporary corrections. Overall, SAGA currently stands among the strongest gainers in the market, supported by strong volume, bullish sentiment, and consistent buying pressure — making it a high-attention coin for short-term momentum and breakout traders.
SAGA/USDT is showing a powerful bullish breakout on the 1-hour timeframe, gaining more than 37% within 24 hours, which clearly confirms strong buyer dominance and aggressive market momentum. The price successfully moved from the 0.0218 support zone toward the current trading area near 0.0367, while printing higher highs and higher lows — a classic bullish continuation structure. Trading volume has expanded significantly with over 2.03B SAGA volume, indicating that institutional and high-volume traders are actively participating in the move. The recent candles near the 0.0382 resistance zone show temporary consolidation rather than weakness, which usually signals that buyers are preparing for another potential breakout attempt. As long as the price remains above the 0.0350 – 0.0345 support area, bullish momentum remains intact and dip-buying opportunities may continue to attract traders.
From a trading perspective, momentum traders should closely watch the breakout above 0.0382, as a strong candle close above this resistance could open the path toward new short-term targets around 0.0400 – 0.0450. However, because the coin has already experienced a sharp rally, smart risk management is essential. Traders should avoid emotional entries during peak volatility and instead wait for healthy pullbacks or confirmed breakout retests before entering positions. The current structure favors bulls, but profit-taking near resistance levels can create temporary corrections. Overall, SAGA currently stands among the strongest gainers in the market, supported by strong volume, bullish sentiment, and consistent buying pressure — making it a high-attention coin for short-term momentum and breakout traders.

1
225
·
--
Bullish
$APE
{spot}(APEUSDT)
/USDT is showing a strong bullish breakout on the 1H timeframe, with price surging toward the 0.1917 resistance after forming a solid base near 0.1380. The sharp impulsive move backed by rising volume indicates aggressive buyer participation and momentum continuation. Despite a minor pullback from the highs, price is still holding above the key support zone around 0.1650–0.1700, which suggests bulls are maintaining control. The 22% daily gain and strong 7-day performance confirm that APE is currently one of the leading gainers, attracting both momentum traders and short-term swing opportunities.
For traders, the current structure favors a “buy-the-dip” strategy rather than chasing the top. A healthy retest of the 0.1650–0.1700 zone could offer a high-probability entry with tight risk management below 0.1600. If bullish momentum continues, a breakout above 0.1920 may open the path toward the psychological 0.2000 level and beyond. However, traders should remain cautious of rejection near resistance, as profit-taking could trigger short-term volatility. Overall, the trend remains bullish, and disciplined entries on pullbacks with proper risk management can provide profitable opportunities in this strong market setup.
$APE
/USDT is showing a strong bullish breakout on the 1H timeframe, with price surging toward the 0.1917 resistance after forming a solid base near 0.1380. The sharp impulsive move backed by rising volume indicates aggressive buyer participation and momentum continuation. Despite a minor pullback from the highs, price is still holding above the key support zone around 0.1650–0.1700, which suggests bulls are maintaining control. The 22% daily gain and strong 7-day performance confirm that APE is currently one of the leading gainers, attracting both momentum traders and short-term swing opportunities.
For traders, the current structure favors a “buy-the-dip” strategy rather than chasing the top. A healthy retest of the 0.1650–0.1700 zone could offer a high-probability entry with tight risk management below 0.1600. If bullish momentum continues, a breakout above 0.1920 may open the path toward the psychological 0.2000 level and beyond. However, traders should remain cautious of rejection near resistance, as profit-taking could trigger short-term volatility. Overall, the trend remains bullish, and disciplined entries on pullbacks with proper risk management can provide profitable opportunities in this strong market setup.
/USDT is showing a strong bullish breakout on the 1H timeframe, with price surging toward the 0.1917 resistance after forming a solid base near 0.1380. The sharp impulsive move backed by rising volume indicates aggressive buyer participation and momentum continuation. Despite a minor pullback from the highs, price is still holding above the key support zone around 0.1650–0.1700, which suggests bulls are maintaining control. The 22% daily gain and strong 7-day performance confirm that APE is currently one of the leading gainers, attracting both momentum traders and short-term swing opportunities.
For traders, the current structure favors a “buy-the-dip” strategy rather than chasing the top. A healthy retest of the 0.1650–0.1700 zone could offer a high-probability entry with tight risk management below 0.1600. If bullish momentum continues, a breakout above 0.1920 may open the path toward the psychological 0.2000 level and beyond. However, traders should remain cautious of rejection near resistance, as profit-taking could trigger short-term volatility. Overall, the trend remains bullish, and disciplined entries on pullbacks with proper risk management can provide profitable opportunities in this strong market setup.

1
181
·
--
Bullish
Ethereum ($ETH
{future}(ETHUSDT)
/USDT) is showing a strong bullish structure, trading around $2,390 with a steady +1.20% gain, reflecting healthy momentum and buyer confidence. The price has respected the $2,306–$2,320 zone as a solid demand base, followed by a clean series of higher highs and higher lows—clear signs of an uptrend continuation. The recent push toward the $2,404 resistance indicates aggressive buying pressure, although a slight rejection suggests short-term consolidation. Volume remains supportive, signaling that this move is not weak and could extend further if buyers maintain control above the immediate support.
For traders, the market presents a favorable buy-on-dip opportunity rather than chasing highs. A professional approach would be to look for entries near $2,365–$2,375 support, with confirmation from bullish candles. As long as ETH holds above this zone, upside targets toward $2,420–$2,450 remain highly probable. However, risk management is key—placing a stop-loss below $2,345 protects against sudden reversals. Momentum traders can also watch for a breakout above $2,405, which could trigger a continuation rally. Overall, ETH remains in a bullish phase, and disciplined entries with trend confirmation can help traders capture high-probability, profitable moves.
Ethereum ($ETH
/USDT) is showing a strong bullish structure, trading around $2,390 with a steady +1.20% gain, reflecting healthy momentum and buyer confidence. The price has respected the $2,306–$2,320 zone as a solid demand base, followed by a clean series of higher highs and higher lows—clear signs of an uptrend continuation. The recent push toward the $2,404 resistance indicates aggressive buying pressure, although a slight rejection suggests short-term consolidation. Volume remains supportive, signaling that this move is not weak and could extend further if buyers maintain control above the immediate support.
For traders, the market presents a favorable buy-on-dip opportunity rather than chasing highs. A professional approach would be to look for entries near $2,365–$2,375 support, with confirmation from bullish candles. As long as ETH holds above this zone, upside targets toward $2,420–$2,450 remain highly probable. However, risk management is key—placing a stop-loss below $2,345 protects against sudden reversals. Momentum traders can also watch for a breakout above $2,405, which could trigger a continuation rally. Overall, ETH remains in a bullish phase, and disciplined entries with trend confirmation can help traders capture high-probability, profitable moves.
/USDT) is showing a strong bullish structure, trading around $2,390 with a steady +1.20% gain, reflecting healthy momentum and buyer confidence. The price has respected the $2,306–$2,320 zone as a solid demand base, followed by a clean series of higher highs and higher lows—clear signs of an uptrend continuation. The recent push toward the $2,404 resistance indicates aggressive buying pressure, although a slight rejection suggests short-term consolidation. Volume remains supportive, signaling that this move is not weak and could extend further if buyers maintain control above the immediate support.
For traders, the market presents a favorable buy-on-dip opportunity rather than chasing highs. A professional approach would be to look for entries near $2,365–$2,375 support, with confirmation from bullish candles. As long as ETH holds above this zone, upside targets toward $2,420–$2,450 remain highly probable. However, risk management is key—placing a stop-loss below $2,345 protects against sudden reversals. Momentum traders can also watch for a breakout above $2,405, which could trigger a continuation rally. Overall, ETH remains in a bullish phase, and disciplined entries with trend confirmation can help traders capture high-probability, profitable moves.

1
83
·
--
$ENSO
{future}(ENSOUSDT)
/USDT is currently showing strong bullish recovery momentum, trading around $1.10 with a +27% daily gain, positioning itself as a notable gainer in the infrastructure category. The chart reveals a sharp breakout from the $0.80–$0.90 accumulation zone, followed by an impulsive move toward the $1.30 high, indicating aggressive buying pressure and strong participation (25M+ volume). After the spike, price has entered a healthy consolidation phase, forming tight candles around the $1.05–$1.12 region—this is a positive sign, as it suggests buyers are holding positions rather than exiting, maintaining bullish structure on the 1H timeframe.
From a trading outlook, ENSO remains bullish above the $1.00 psychological support, which now acts as a key demand zone. A controlled pullback into $1.00–$1.05 can offer a strategic dip-buying opportunity, targeting a retest of $1.30 and potentially extending toward $1.40+ if momentum continues. The order book also reflects strong buyer dominance (68%), reinforcing bullish sentiment. However, traders should stay cautious of rejection near previous highs—if price loses $1.00, a deeper retracement toward $0.90 is possible. Overall, the setup favors trend continuation, and the most effective strategy here is to buy controlled pullbacks with proper risk management, avoiding chasing extended green candles.
$ENSO
/USDT is currently showing strong bullish recovery momentum, trading around $1.10 with a +27% daily gain, positioning itself as a notable gainer in the infrastructure category. The chart reveals a sharp breakout from the $0.80–$0.90 accumulation zone, followed by an impulsive move toward the $1.30 high, indicating aggressive buying pressure and strong participation (25M+ volume). After the spike, price has entered a healthy consolidation phase, forming tight candles around the $1.05–$1.12 region—this is a positive sign, as it suggests buyers are holding positions rather than exiting, maintaining bullish structure on the 1H timeframe.
From a trading outlook, ENSO remains bullish above the $1.00 psychological support, which now acts as a key demand zone. A controlled pullback into $1.00–$1.05 can offer a strategic dip-buying opportunity, targeting a retest of $1.30 and potentially extending toward $1.40+ if momentum continues. The order book also reflects strong buyer dominance (68%), reinforcing bullish sentiment. However, traders should stay cautious of rejection near previous highs—if price loses $1.00, a deeper retracement toward $0.90 is possible. Overall, the setup favors trend continuation, and the most effective strategy here is to buy controlled pullbacks with proper risk management, avoiding chasing extended green candles.
/USDT is currently showing strong bullish recovery momentum, trading around $1.10 with a +27% daily gain, positioning itself as a notable gainer in the infrastructure category. The chart reveals a sharp breakout from the $0.80–$0.90 accumulation zone, followed by an impulsive move toward the $1.30 high, indicating aggressive buying pressure and strong participation (25M+ volume). After the spike, price has entered a healthy consolidation phase, forming tight candles around the $1.05–$1.12 region—this is a positive sign, as it suggests buyers are holding positions rather than exiting, maintaining bullish structure on the 1H timeframe.
From a trading outlook, ENSO remains bullish above the $1.00 psychological support, which now acts as a key demand zone. A controlled pullback into $1.00–$1.05 can offer a strategic dip-buying opportunity, targeting a retest of $1.30 and potentially extending toward $1.40+ if momentum continues. The order book also reflects strong buyer dominance (68%), reinforcing bullish sentiment. However, traders should stay cautious of rejection near previous highs—if price loses $1.00, a deeper retracement toward $0.90 is possible. Overall, the setup favors trend continuation, and the most effective strategy here is to buy controlled pullbacks with proper risk management, avoiding chasing extended green candles.

1
130
·
--
Bullish
$ORCA
{future}(ORCAUSDT)
/USDT is showing exceptional bullish momentum, currently trading around $1.86 with a massive +58% daily gain, clearly marking it as one of the top gainers in the DeFi sector. The price has aggressively expanded from the $0.94 base and printed a strong high near $2.11, indicating heavy buyer dominance and breakout strength. The 1H structure reflects a clean uptrend with higher highs and higher lows, supported by strong volume (over 60M USDT), which confirms genuine market participation rather than a weak pump. Despite a slight pullback after the recent high, bulls have quickly stepped back in, pushing price toward continuation—this signals trend sustainability rather than exhaustion.
From a trading perspective, ORCA remains bullish as long as it holds above the $1.65–$1.70 support zone, which now acts as a key demand area. A successful retest of this zone could provide a high-probability long entry, targeting the previous high at $2.10 and potentially extending toward $2.20–$2.30 if momentum continues. However, traders should remain cautious of volatility after such a sharp move—tight risk management is essential. A break below $1.65 may trigger short-term correction toward $1.40. Overall, the market structure favors buyers, and trend-following strategies (buy dips, not tops) are currently the most profitable approach in this setup.
$ORCA
/USDT is showing exceptional bullish momentum, currently trading around $1.86 with a massive +58% daily gain, clearly marking it as one of the top gainers in the DeFi sector. The price has aggressively expanded from the $0.94 base and printed a strong high near $2.11, indicating heavy buyer dominance and breakout strength. The 1H structure reflects a clean uptrend with higher highs and higher lows, supported by strong volume (over 60M USDT), which confirms genuine market participation rather than a weak pump. Despite a slight pullback after the recent high, bulls have quickly stepped back in, pushing price toward continuation—this signals trend sustainability rather than exhaustion.
From a trading perspective, ORCA remains bullish as long as it holds above the $1.65–$1.70 support zone, which now acts as a key demand area. A successful retest of this zone could provide a high-probability long entry, targeting the previous high at $2.10 and potentially extending toward $2.20–$2.30 if momentum continues. However, traders should remain cautious of volatility after such a sharp move—tight risk management is essential. A break below $1.65 may trigger short-term correction toward $1.40. Overall, the market structure favors buyers, and trend-following strategies (buy dips, not tops) are currently the most profitable approach in this setup.
/USDT is showing exceptional bullish momentum, currently trading around $1.86 with a massive +58% daily gain, clearly marking it as one of the top gainers in the DeFi sector. The price has aggressively expanded from the $0.94 base and printed a strong high near $2.11, indicating heavy buyer dominance and breakout strength. The 1H structure reflects a clean uptrend with higher highs and higher lows, supported by strong volume (over 60M USDT), which confirms genuine market participation rather than a weak pump. Despite a slight pullback after the recent high, bulls have quickly stepped back in, pushing price toward continuation—this signals trend sustainability rather than exhaustion.
From a trading perspective, ORCA remains bullish as long as it holds above the $1.65–$1.70 support zone, which now acts as a key demand area. A successful retest of this zone could provide a high-probability long entry, targeting the previous high at $2.10 and potentially extending toward $2.20–$2.30 if momentum continues. However, traders should remain cautious of volatility after such a sharp move—tight risk management is essential. A break below $1.65 may trigger short-term correction toward $1.40. Overall, the market structure favors buyers, and trend-following strategies (buy dips, not tops) are currently the most profitable approach in this setup.

1
94
·
--
Bullish
$SPK
{spot}(SPKUSDT)
/USDT is showing strong bullish momentum, emerging as a high-performing DeFi gainer with an impressive +43% surge in a short period. The price action reflects a clear breakout structure, where buyers have stepped in aggressively after holding the 0.030 zone as a solid base. The sharp impulsive move toward the 0.058 area confirms strong demand, supported by high volume (2.22B SPK), which signals genuine market participation rather than a weak pump. On the 1H timeframe, the formation of higher highs and higher lows indicates a sustained uptrend, while the current consolidation just below resistance suggests that bulls are absorbing selling pressure rather than losing control.
From a trading perspective, this setup favors continuation if momentum holds. The immediate resistance lies around 0.058–0.060, and a clean breakout above this zone could trigger another leg up toward 0.065+. Meanwhile, the previous breakout area near 0.047–0.050 now acts as a strong support zone, offering a potential pullback entry for traders looking to join the trend. Conservative traders should wait for either a breakout confirmation with volume or a healthy retracement to support, while aggressive traders may capitalize on the current consolidation phase. Risk management remains key—placing stop losses below the recent structure ensures protection against sudden volatility, as such rapid gainers can experience sharp corrections.
$SPK
/USDT is showing strong bullish momentum, emerging as a high-performing DeFi gainer with an impressive +43% surge in a short period. The price action reflects a clear breakout structure, where buyers have stepped in aggressively after holding the 0.030 zone as a solid base. The sharp impulsive move toward the 0.058 area confirms strong demand, supported by high volume (2.22B SPK), which signals genuine market participation rather than a weak pump. On the 1H timeframe, the formation of higher highs and higher lows indicates a sustained uptrend, while the current consolidation just below resistance suggests that bulls are absorbing selling pressure rather than losing control.
From a trading perspective, this setup favors continuation if momentum holds. The immediate resistance lies around 0.058–0.060, and a clean breakout above this zone could trigger another leg up toward 0.065+. Meanwhile, the previous breakout area near 0.047–0.050 now acts as a strong support zone, offering a potential pullback entry for traders looking to join the trend. Conservative traders should wait for either a breakout confirmation with volume or a healthy retracement to support, while aggressive traders may capitalize on the current consolidation phase. Risk management remains key—placing stop losses below the recent structure ensures protection against sudden volatility, as such rapid gainers can experience sharp corrections.
/USDT is showing strong bullish momentum, emerging as a high-performing DeFi gainer with an impressive +43% surge in a short period. The price action reflects a clear breakout structure, where buyers have stepped in aggressively after holding the 0.030 zone as a solid base. The sharp impulsive move toward the 0.058 area confirms strong demand, supported by high volume (2.22B SPK), which signals genuine market participation rather than a weak pump. On the 1H timeframe, the formation of higher highs and higher lows indicates a sustained uptrend, while the current consolidation just below resistance suggests that bulls are absorbing selling pressure rather than losing control.
From a trading perspective, this setup favors continuation if momentum holds. The immediate resistance lies around 0.058–0.060, and a clean breakout above this zone could trigger another leg up toward 0.065+. Meanwhile, the previous breakout area near 0.047–0.050 now acts as a strong support zone, offering a potential pullback entry for traders looking to join the trend. Conservative traders should wait for either a breakout confirmation with volume or a healthy retracement to support, while aggressive traders may capitalize on the current consolidation phase. Risk management remains key—placing stop losses below the recent structure ensures protection against sudden volatility, as such rapid gainers can experience sharp corrections.

2
60
·
--
Bullish
$LUMIA
{spot}(LUMIAUSDT)
/USDT is demonstrating a strong bullish recovery, currently trading near $0.1227 with a solid +12.26% daily gain, placing it among today’s notable gainers. The price action shows a clean reversal from the $0.1040 demand zone, followed by a steady series of higher highs and higher lows—confirming a short-term uptrend. The recent push toward $0.1250 resistance highlights strong buying pressure, supported by a dominant bid side in the order book (~65%), which signals market confidence. The structure remains bullish as long as price holds above the $0.1180–$0.1200 support zone, indicating that buyers are still in control despite minor intraday pullbacks.
From a trading perspective, patience is key to maximizing profitability. Instead of chasing the current highs, traders should look for a healthy pullback toward the $0.1180–$0.1200 area for optimal entries with better risk-reward. A confirmed breakout and strong close above $0.1250 can open the door for further upside toward $0.1300–$0.1350 levels. Volume continuation will be crucial—sustained momentum supports trend continuation, while weakening volume may trigger short-term consolidation. A disciplined stop-loss below $0.1150 is advisable to manage downside risk. Overall, LUMIA/USDT is in a bullish phase, and smart traders will focus on pullback entries and breakout confirmations to capture the next leg of this upward move.
$LUMIA
/USDT is demonstrating a strong bullish recovery, currently trading near $0.1227 with a solid +12.26% daily gain, placing it among today’s notable gainers. The price action shows a clean reversal from the $0.1040 demand zone, followed by a steady series of higher highs and higher lows—confirming a short-term uptrend. The recent push toward $0.1250 resistance highlights strong buying pressure, supported by a dominant bid side in the order book (~65%), which signals market confidence. The structure remains bullish as long as price holds above the $0.1180–$0.1200 support zone, indicating that buyers are still in control despite minor intraday pullbacks.
From a trading perspective, patience is key to maximizing profitability. Instead of chasing the current highs, traders should look for a healthy pullback toward the $0.1180–$0.1200 area for optimal entries with better risk-reward. A confirmed breakout and strong close above $0.1250 can open the door for further upside toward $0.1300–$0.1350 levels. Volume continuation will be crucial—sustained momentum supports trend continuation, while weakening volume may trigger short-term consolidation. A disciplined stop-loss below $0.1150 is advisable to manage downside risk. Overall, LUMIA/USDT is in a bullish phase, and smart traders will focus on pullback entries and breakout confirmations to capture the next leg of this upward move.
/USDT is demonstrating a strong bullish recovery, currently trading near $0.1227 with a solid +12.26% daily gain, placing it among today’s notable gainers. The price action shows a clean reversal from the $0.1040 demand zone, followed by a steady series of higher highs and higher lows—confirming a short-term uptrend. The recent push toward $0.1250 resistance highlights strong buying pressure, supported by a dominant bid side in the order book (~65%), which signals market confidence. The structure remains bullish as long as price holds above the $0.1180–$0.1200 support zone, indicating that buyers are still in control despite minor intraday pullbacks.
From a trading perspective, patience is key to maximizing profitability. Instead of chasing the current highs, traders should look for a healthy pullback toward the $0.1180–$0.1200 area for optimal entries with better risk-reward. A confirmed breakout and strong close above $0.1250 can open the door for further upside toward $0.1300–$0.1350 levels. Volume continuation will be crucial—sustained momentum supports trend continuation, while weakening volume may trigger short-term consolidation. A disciplined stop-loss below $0.1150 is advisable to manage downside risk. Overall, LUMIA/USDT is in a bullish phase, and smart traders will focus on pullback entries and breakout confirmations to capture the next leg of this upward move.

1
67
·
--
Bullish
$MET
{future}(METUSDT)
/USDT is showing strong bullish momentum, currently trading around $0.1943 with an impressive +19.9% daily gain, confirming its position among today’s top gainers. The chart reflects a sharp impulsive move from the $0.1445 support zone to a recent high near $0.2434, indicating aggressive buyer dominance and high-volume participation. However, the presence of a long upper wick near the top signals initial profit-taking and potential short-term exhaustion. Price is now consolidating just below the breakout zone, which is a healthy sign after such a rapid rally. As long as price holds above the $0.1830–$0.1900 support region, the bullish structure remains intact and continuation toward higher levels is likely.
For traders, the current setup offers a strategic opportunity rather than a chase entry. A controlled pullback toward the $0.1850–$0.1900 demand zone can provide a safer entry with better risk-reward, while a breakout and strong close above $0.2050 could trigger the next leg up toward $0.2200–$0.2430. Volume remains a key confirmation factor—sustained buying pressure will validate continuation, while declining volume may signal deeper retracement. Risk management is crucial: placing stop-loss below $0.1800 can help protect capital. Overall, MET/USDT remains in a bullish trend, and traders should focus on pullback entries and breakout confirmations to capitalize on this momentum-driven move.
$MET
/USDT is showing strong bullish momentum, currently trading around $0.1943 with an impressive +19.9% daily gain, confirming its position among today’s top gainers. The chart reflects a sharp impulsive move from the $0.1445 support zone to a recent high near $0.2434, indicating aggressive buyer dominance and high-volume participation. However, the presence of a long upper wick near the top signals initial profit-taking and potential short-term exhaustion. Price is now consolidating just below the breakout zone, which is a healthy sign after such a rapid rally. As long as price holds above the $0.1830–$0.1900 support region, the bullish structure remains intact and continuation toward higher levels is likely.
For traders, the current setup offers a strategic opportunity rather than a chase entry. A controlled pullback toward the $0.1850–$0.1900 demand zone can provide a safer entry with better risk-reward, while a breakout and strong close above $0.2050 could trigger the next leg up toward $0.2200–$0.2430. Volume remains a key confirmation factor—sustained buying pressure will validate continuation, while declining volume may signal deeper retracement. Risk management is crucial: placing stop-loss below $0.1800 can help protect capital. Overall, MET/USDT remains in a bullish trend, and traders should focus on pullback entries and breakout confirmations to capitalize on this momentum-driven move.
/USDT is showing strong bullish momentum, currently trading around $0.1943 with an impressive +19.9% daily gain, confirming its position among today’s top gainers. The chart reflects a sharp impulsive move from the $0.1445 support zone to a recent high near $0.2434, indicating aggressive buyer dominance and high-volume participation. However, the presence of a long upper wick near the top signals initial profit-taking and potential short-term exhaustion. Price is now consolidating just below the breakout zone, which is a healthy sign after such a rapid rally. As long as price holds above the $0.1830–$0.1900 support region, the bullish structure remains intact and continuation toward higher levels is likely.
For traders, the current setup offers a strategic opportunity rather than a chase entry. A controlled pullback toward the $0.1850–$0.1900 demand zone can provide a safer entry with better risk-reward, while a breakout and strong close above $0.2050 could trigger the next leg up toward $0.2200–$0.2430. Volume remains a key confirmation factor—sustained buying pressure will validate continuation, while declining volume may signal deeper retracement. Risk management is crucial: placing stop-loss below $0.1800 can help protect capital. Overall, MET/USDT remains in a bullish trend, and traders should focus on pullback entries and breakout confirmations to capitalize on this momentum-driven move.

2
146
·
--
Bullish
$ALLO
{spot}(ALLOUSDT)
/USDT is maintaining a strong bullish structure, currently trading around 0.1253 with an 11%+ gain, confirming its position among the top AI gainers. The price has shown a steady uptrend from the 0.1000 region, forming consistent higher highs and higher lows, which reflects sustained buying pressure. The recent push toward the 0.1257 high indicates that momentum is still intact, with buyers actively stepping in on minor pullbacks. The candle structure remains clean and bullish, suggesting confidence in the market and continuation potential if volume supports the move.
From a trading perspective, this setup favors trend-following strategies. The immediate support zone lies around 0.1210–0.1180, where pullbacks can offer attractive entry opportunities for buyers aiming to ride the trend. A confirmed breakout above 0.1257 with strong volume could trigger the next bullish leg, opening room for further upside. However, traders should remain disciplined and watch for rejection signals near resistance, as short-term consolidation is possible after the recent rally. Overall, ALLO/USDT presents a high-probability momentum trade, and with proper risk management and timing, traders can capitalize on both breakout and dip-buying opportunities in this strong uptrend.
$ALLO
/USDT is maintaining a strong bullish structure, currently trading around 0.1253 with an 11%+ gain, confirming its position among the top AI gainers. The price has shown a steady uptrend from the 0.1000 region, forming consistent higher highs and higher lows, which reflects sustained buying pressure. The recent push toward the 0.1257 high indicates that momentum is still intact, with buyers actively stepping in on minor pullbacks. The candle structure remains clean and bullish, suggesting confidence in the market and continuation potential if volume supports the move.
From a trading perspective, this setup favors trend-following strategies. The immediate support zone lies around 0.1210–0.1180, where pullbacks can offer attractive entry opportunities for buyers aiming to ride the trend. A confirmed breakout above 0.1257 with strong volume could trigger the next bullish leg, opening room for further upside. However, traders should remain disciplined and watch for rejection signals near resistance, as short-term consolidation is possible after the recent rally. Overall, ALLO/USDT presents a high-probability momentum trade, and with proper risk management and timing, traders can capitalize on both breakout and dip-buying opportunities in this strong uptrend.
/USDT is maintaining a strong bullish structure, currently trading around 0.1253 with an 11%+ gain, confirming its position among the top AI gainers. The price has shown a steady uptrend from the 0.1000 region, forming consistent higher highs and higher lows, which reflects sustained buying pressure. The recent push toward the 0.1257 high indicates that momentum is still intact, with buyers actively stepping in on minor pullbacks. The candle structure remains clean and bullish, suggesting confidence in the market and continuation potential if volume supports the move.
From a trading perspective, this setup favors trend-following strategies. The immediate support zone lies around 0.1210–0.1180, where pullbacks can offer attractive entry opportunities for buyers aiming to ride the trend. A confirmed breakout above 0.1257 with strong volume could trigger the next bullish leg, opening room for further upside. However, traders should remain disciplined and watch for rejection signals near resistance, as short-term consolidation is possible after the recent rally. Overall, ALLO/USDT presents a high-probability momentum trade, and with proper risk management and timing, traders can capitalize on both breakout and dip-buying opportunities in this strong uptrend.

1
29
·
--
Bullish
$SUPER
{spot}(SUPERUSDT)
/USDT continues to show strong bullish momentum, currently trading around 0.1426 after an impressive 22%+ surge, making it one of the top gainers in the NFT sector. The price recently reached a high near 0.1589, followed by a healthy pullback and consolidation phase. This behavior is typical after a strong rally, where early buyers take profits and the market stabilizes before the next move. The structure still reflects strength, with higher lows forming and buying interest visible in the order book, indicating that bulls are still active despite short-term cooling.
From a trading perspective, this setup offers controlled opportunities. The zone around 0.1400–0.1350 is acting as a key support area, where dip-buying could provide favorable entries if price holds. On the upside, a strong breakout above 0.1589 with volume confirmation can open the door for another bullish leg. However, traders should remain cautious of rejection at resistance and manage risk accordingly. Overall, SUPER/USDT remains a high-momentum asset, and with disciplined entries, proper stop-loss placement, and patience, traders can capitalize on both continuation and pullback strategies in this trending market.
$SUPER
/USDT continues to show strong bullish momentum, currently trading around 0.1426 after an impressive 22%+ surge, making it one of the top gainers in the NFT sector. The price recently reached a high near 0.1589, followed by a healthy pullback and consolidation phase. This behavior is typical after a strong rally, where early buyers take profits and the market stabilizes before the next move. The structure still reflects strength, with higher lows forming and buying interest visible in the order book, indicating that bulls are still active despite short-term cooling.
From a trading perspective, this setup offers controlled opportunities. The zone around 0.1400–0.1350 is acting as a key support area, where dip-buying could provide favorable entries if price holds. On the upside, a strong breakout above 0.1589 with volume confirmation can open the door for another bullish leg. However, traders should remain cautious of rejection at resistance and manage risk accordingly. Overall, SUPER/USDT remains a high-momentum asset, and with disciplined entries, proper stop-loss placement, and patience, traders can capitalize on both continuation and pullback strategies in this trending market.
/USDT continues to show strong bullish momentum, currently trading around 0.1426 after an impressive 22%+ surge, making it one of the top gainers in the NFT sector. The price recently reached a high near 0.1589, followed by a healthy pullback and consolidation phase. This behavior is typical after a strong rally, where early buyers take profits and the market stabilizes before the next move. The structure still reflects strength, with higher lows forming and buying interest visible in the order book, indicating that bulls are still active despite short-term cooling.
From a trading perspective, this setup offers controlled opportunities. The zone around 0.1400–0.1350 is acting as a key support area, where dip-buying could provide favorable entries if price holds. On the upside, a strong breakout above 0.1589 with volume confirmation can open the door for another bullish leg. However, traders should remain cautious of rejection at resistance and manage risk accordingly. Overall, SUPER/USDT remains a high-momentum asset, and with disciplined entries, proper stop-loss placement, and patience, traders can capitalize on both continuation and pullback strategies in this trending market.

1
110
·
--
Bullish
$ALLO
{spot}(ALLOUSDT)
/USDT is showing strong bullish momentum, currently trading around 0.1119 with an impressive gain of nearly 13%, positioning it among the top gainers in the AI sector. The price has steadily climbed from the 0.0980 zone, forming higher highs and higher lows—clear confirmation of an active uptrend. The recent push toward the 0.1133 resistance level reflects strong buying pressure and market confidence. Candlestick structure remains healthy, with bullish continuation patterns indicating that buyers are still in control, supported by consistent volume and upward momentum.
For traders, the current structure offers strategic opportunities. A pullback toward the 0.1070–0.1040 zone could act as a strong support area for potential dip entries, especially for those looking to join the trend with better risk-reward. Breakout traders should watch for a clean move above 0.1133 with volume confirmation, which could trigger the next leg upward. However, risk management remains key, as rejection from resistance may lead to short-term consolidation. Overall, ALLO/USDT presents a high-probability trending setup, and disciplined entries with proper stop-loss placement can help traders capture profitable moves in this momentum-driven market.
$ALLO
/USDT is showing strong bullish momentum, currently trading around 0.1119 with an impressive gain of nearly 13%, positioning it among the top gainers in the AI sector. The price has steadily climbed from the 0.0980 zone, forming higher highs and higher lows—clear confirmation of an active uptrend. The recent push toward the 0.1133 resistance level reflects strong buying pressure and market confidence. Candlestick structure remains healthy, with bullish continuation patterns indicating that buyers are still in control, supported by consistent volume and upward momentum.
For traders, the current structure offers strategic opportunities. A pullback toward the 0.1070–0.1040 zone could act as a strong support area for potential dip entries, especially for those looking to join the trend with better risk-reward. Breakout traders should watch for a clean move above 0.1133 with volume confirmation, which could trigger the next leg upward. However, risk management remains key, as rejection from resistance may lead to short-term consolidation. Overall, ALLO/USDT presents a high-probability trending setup, and disciplined entries with proper stop-loss placement can help traders capture profitable moves in this momentum-driven market.
/USDT is showing strong bullish momentum, currently trading around 0.1119 with an impressive gain of nearly 13%, positioning it among the top gainers in the AI sector. The price has steadily climbed from the 0.0980 zone, forming higher highs and higher lows—clear confirmation of an active uptrend. The recent push toward the 0.1133 resistance level reflects strong buying pressure and market confidence. Candlestick structure remains healthy, with bullish continuation patterns indicating that buyers are still in control, supported by consistent volume and upward momentum.
For traders, the current structure offers strategic opportunities. A pullback toward the 0.1070–0.1040 zone could act as a strong support area for potential dip entries, especially for those looking to join the trend with better risk-reward. Breakout traders should watch for a clean move above 0.1133 with volume confirmation, which could trigger the next leg upward. However, risk management remains key, as rejection from resistance may lead to short-term consolidation. Overall, ALLO/USDT presents a high-probability trending setup, and disciplined entries with proper stop-loss placement can help traders capture profitable moves in this momentum-driven market.

1
99
·
--
Bullish
$SUPER
{spot}(SUPERUSDT)
/USDT has delivered a strong bullish move, currently trading around 0.1444 after gaining over 24%, marking it as a top gainer in the market. The price recently pushed toward a high of 0.1589, showing clear buying momentum and strong interest from traders. However, after the sharp rally, the market is now entering a short consolidation phase with small red candles forming near resistance. This indicates that early buyers are taking profits while the market decides its next direction. The key support zone lies around 0.1400–0.1350, and as long as price holds above this area, the bullish structure remains intact.
For traders, this setup offers two clear strategies. Aggressive traders can look for dip-buying opportunities near support levels, targeting a continuation move toward 0.1589 and potentially higher if volume increases. Conservative traders should wait for a confirmed breakout above the recent high, supported by strong volume, before entering positions. Risk management is essential here, as rejection from resistance could lead to a short-term pullback. Overall, SUPER/USDT remains a high-momentum asset, and with proper entry and discipline, it can provide profitable trading opportunities in the current market conditions.
$SUPER
/USDT has delivered a strong bullish move, currently trading around 0.1444 after gaining over 24%, marking it as a top gainer in the market. The price recently pushed toward a high of 0.1589, showing clear buying momentum and strong interest from traders. However, after the sharp rally, the market is now entering a short consolidation phase with small red candles forming near resistance. This indicates that early buyers are taking profits while the market decides its next direction. The key support zone lies around 0.1400–0.1350, and as long as price holds above this area, the bullish structure remains intact.
For traders, this setup offers two clear strategies. Aggressive traders can look for dip-buying opportunities near support levels, targeting a continuation move toward 0.1589 and potentially higher if volume increases. Conservative traders should wait for a confirmed breakout above the recent high, supported by strong volume, before entering positions. Risk management is essential here, as rejection from resistance could lead to a short-term pullback. Overall, SUPER/USDT remains a high-momentum asset, and with proper entry and discipline, it can provide profitable trading opportunities in the current market conditions.
/USDT has delivered a strong bullish move, currently trading around 0.1444 after gaining over 24%, marking it as a top gainer in the market. The price recently pushed toward a high of 0.1589, showing clear buying momentum and strong interest from traders. However, after the sharp rally, the market is now entering a short consolidation phase with small red candles forming near resistance. This indicates that early buyers are taking profits while the market decides its next direction. The key support zone lies around 0.1400–0.1350, and as long as price holds above this area, the bullish structure remains intact.
For traders, this setup offers two clear strategies. Aggressive traders can look for dip-buying opportunities near support levels, targeting a continuation move toward 0.1589 and potentially higher if volume increases. Conservative traders should wait for a confirmed breakout above the recent high, supported by strong volume, before entering positions. Risk management is essential here, as rejection from resistance could lead to a short-term pullback. Overall, SUPER/USDT remains a high-momentum asset, and with proper entry and discipline, it can provide profitable trading opportunities in the current market conditions.

1
103
·
--
Bullish
$GUN
{spot}(GUNUSDT)
/USDT continues to demonstrate a strong bullish structure, maintaining its position as a steady gainer with +10% upside after a powerful rally. The price has advanced from the 0.0145 base to a recent high near 0.0235, forming a clear series of higher highs and higher lows on the 1H timeframe. The current pullback toward 0.0211 appears to be a healthy correction after an extended move, rather than a trend reversal. This type of retracement often signals profit-taking while keeping the overall bullish momentum intact. With buy-side pressure still relatively balanced and structure holding above key levels, the trend remains favorable for continuation if support zones are respected.
From a trading perspective, this setup offers a high-probability continuation opportunity if approached with patience. Immediate support is forming around 0.0205–0.0210, while resistance remains near 0.0235–0.0240. A successful hold above support followed by bullish confirmation could provide a strong re-entry zone, while a breakout above resistance may trigger the next impulsive leg. Traders should focus on buying controlled pullbacks or confirmed breakouts, avoiding emotional entries at peaks. Risk management is essential — placing stop-loss below support can protect against deeper corrections. Overall, GUN/USDT remains structurally bullish, offering disciplined traders a solid chance to capitalize on continuation momentum.
$GUN
/USDT continues to demonstrate a strong bullish structure, maintaining its position as a steady gainer with +10% upside after a powerful rally. The price has advanced from the 0.0145 base to a recent high near 0.0235, forming a clear series of higher highs and higher lows on the 1H timeframe. The current pullback toward 0.0211 appears to be a healthy correction after an extended move, rather than a trend reversal. This type of retracement often signals profit-taking while keeping the overall bullish momentum intact. With buy-side pressure still relatively balanced and structure holding above key levels, the trend remains favorable for continuation if support zones are respected.
From a trading perspective, this setup offers a high-probability continuation opportunity if approached with patience. Immediate support is forming around 0.0205–0.0210, while resistance remains near 0.0235–0.0240. A successful hold above support followed by bullish confirmation could provide a strong re-entry zone, while a breakout above resistance may trigger the next impulsive leg. Traders should focus on buying controlled pullbacks or confirmed breakouts, avoiding emotional entries at peaks. Risk management is essential — placing stop-loss below support can protect against deeper corrections. Overall, GUN/USDT remains structurally bullish, offering disciplined traders a solid chance to capitalize on continuation momentum.
/USDT continues to demonstrate a strong bullish structure, maintaining its position as a steady gainer with +10% upside after a powerful rally. The price has advanced from the 0.0145 base to a recent high near 0.0235, forming a clear series of higher highs and higher lows on the 1H timeframe. The current pullback toward 0.0211 appears to be a healthy correction after an extended move, rather than a trend reversal. This type of retracement often signals profit-taking while keeping the overall bullish momentum intact. With buy-side pressure still relatively balanced and structure holding above key levels, the trend remains favorable for continuation if support zones are respected.
From a trading perspective, this setup offers a high-probability continuation opportunity if approached with patience. Immediate support is forming around 0.0205–0.0210, while resistance remains near 0.0235–0.0240. A successful hold above support followed by bullish confirmation could provide a strong re-entry zone, while a breakout above resistance may trigger the next impulsive leg. Traders should focus on buying controlled pullbacks or confirmed breakouts, avoiding emotional entries at peaks. Risk management is essential — placing stop-loss below support can protect against deeper corrections. Overall, GUN/USDT remains structurally bullish, offering disciplined traders a solid chance to capitalize on continuation momentum.

1
24
·
--
Bullish
$AUDIO
{spot}(AUDIOUSDT)
/USDT is showing a strong recovery structure after forming a clear base near the 0.0190 demand zone, followed by a sharp bullish impulsive move toward 0.027+ highs. Currently trading around 0.0243, the price is consolidating after the breakout, which reflects a healthy pause rather than weakness. The shift from a downtrend into higher lows and strong bullish candles on the 1H timeframe signals that momentum is gradually transitioning in favor of buyers. Additionally, solid buy-side pressure and increasing volume indicate accumulation, suggesting that the market is preparing for a potential continuation if key levels are respected.
From a trading perspective, AUDIO is offering a structured opportunity rather than a hype-driven move, making it more stable compared to other gainers. Immediate support lies around 0.0230–0.0235, while resistance is seen near 0.0265–0.0275. A breakout above this resistance with volume confirmation could initiate the next bullish leg. Traders should focus on buying pullbacks near support or entering on breakout retests, rather than chasing mid-range price action. Maintaining a disciplined stop-loss below support is essential to manage risk. Overall, AUDIO/USDT is shaping into a controlled bullish setup, providing a balanced opportunity for traders seeking both momentum and stability in short-term trades.
$AUDIO
/USDT is showing a strong recovery structure after forming a clear base near the 0.0190 demand zone, followed by a sharp bullish impulsive move toward 0.027+ highs. Currently trading around 0.0243, the price is consolidating after the breakout, which reflects a healthy pause rather than weakness. The shift from a downtrend into higher lows and strong bullish candles on the 1H timeframe signals that momentum is gradually transitioning in favor of buyers. Additionally, solid buy-side pressure and increasing volume indicate accumulation, suggesting that the market is preparing for a potential continuation if key levels are respected.
From a trading perspective, AUDIO is offering a structured opportunity rather than a hype-driven move, making it more stable compared to other gainers. Immediate support lies around 0.0230–0.0235, while resistance is seen near 0.0265–0.0275. A breakout above this resistance with volume confirmation could initiate the next bullish leg. Traders should focus on buying pullbacks near support or entering on breakout retests, rather than chasing mid-range price action. Maintaining a disciplined stop-loss below support is essential to manage risk. Overall, AUDIO/USDT is shaping into a controlled bullish setup, providing a balanced opportunity for traders seeking both momentum and stability in short-term trades.
/USDT is showing a strong recovery structure after forming a clear base near the 0.0190 demand zone, followed by a sharp bullish impulsive move toward 0.027+ highs. Currently trading around 0.0243, the price is consolidating after the breakout, which reflects a healthy pause rather than weakness. The shift from a downtrend into higher lows and strong bullish candles on the 1H timeframe signals that momentum is gradually transitioning in favor of buyers. Additionally, solid buy-side pressure and increasing volume indicate accumulation, suggesting that the market is preparing for a potential continuation if key levels are respected.
From a trading perspective, AUDIO is offering a structured opportunity rather than a hype-driven move, making it more stable compared to other gainers. Immediate support lies around 0.0230–0.0235, while resistance is seen near 0.0265–0.0275. A breakout above this resistance with volume confirmation could initiate the next bullish leg. Traders should focus on buying pullbacks near support or entering on breakout retests, rather than chasing mid-range price action. Maintaining a disciplined stop-loss below support is essential to manage risk. Overall, AUDIO/USDT is shaping into a controlled bullish setup, providing a balanced opportunity for traders seeking both momentum and stability in short-term trades.

1
55
·
--
Bullish
$GUN
{spot}(GUNUSDT)
/USDT is showing a powerful bullish breakout, climbing over 28% and confirming strong upside momentum in the short term. The price has surged cleanly from the 0.0143 support zone to a high near 0.01949, forming a sharp impulsive move backed by solid volume — a clear indication of aggressive buyer dominance. The structure on the 1H timeframe reflects a classic breakout rally with strong continuation potential, as price is currently holding near highs around 0.0191, showing minimal weakness. This kind of price behavior typically signals strength, where buyers remain in control and dips are quickly absorbed, keeping the bullish trend intact.
From a trading perspective, the smarter approach here is to avoid chasing extended candles and instead focus on strategic entries. Immediate support is forming around 0.0180–0.0185, while resistance lies near the 0.0195–0.0200 zone. A confirmed breakout above this resistance can trigger the next leg up, potentially opening room for further gains. Traders should watch for pullback entries with bullish confirmation or a clean breakout with volume expansion. Risk management is key in such fast-moving setups — placing a stop-loss below support helps protect against sudden reversals. Overall, GUN/USDT is behaving like a strong gainer with bullish continuation potential, offering attractive short-term opportunities for disciplined traders.
$GUN
/USDT is showing a powerful bullish breakout, climbing over 28% and confirming strong upside momentum in the short term. The price has surged cleanly from the 0.0143 support zone to a high near 0.01949, forming a sharp impulsive move backed by solid volume — a clear indication of aggressive buyer dominance. The structure on the 1H timeframe reflects a classic breakout rally with strong continuation potential, as price is currently holding near highs around 0.0191, showing minimal weakness. This kind of price behavior typically signals strength, where buyers remain in control and dips are quickly absorbed, keeping the bullish trend intact.
From a trading perspective, the smarter approach here is to avoid chasing extended candles and instead focus on strategic entries. Immediate support is forming around 0.0180–0.0185, while resistance lies near the 0.0195–0.0200 zone. A confirmed breakout above this resistance can trigger the next leg up, potentially opening room for further gains. Traders should watch for pullback entries with bullish confirmation or a clean breakout with volume expansion. Risk management is key in such fast-moving setups — placing a stop-loss below support helps protect against sudden reversals. Overall, GUN/USDT is behaving like a strong gainer with bullish continuation potential, offering attractive short-term opportunities for disciplined traders.
/USDT is showing a powerful bullish breakout, climbing over 28% and confirming strong upside momentum in the short term. The price has surged cleanly from the 0.0143 support zone to a high near 0.01949, forming a sharp impulsive move backed by solid volume — a clear indication of aggressive buyer dominance. The structure on the 1H timeframe reflects a classic breakout rally with strong continuation potential, as price is currently holding near highs around 0.0191, showing minimal weakness. This kind of price behavior typically signals strength, where buyers remain in control and dips are quickly absorbed, keeping the bullish trend intact.
From a trading perspective, the smarter approach here is to avoid chasing extended candles and instead focus on strategic entries. Immediate support is forming around 0.0180–0.0185, while resistance lies near the 0.0195–0.0200 zone. A confirmed breakout above this resistance can trigger the next leg up, potentially opening room for further gains. Traders should watch for pullback entries with bullish confirmation or a clean breakout with volume expansion. Risk management is key in such fast-moving setups — placing a stop-loss below support helps protect against sudden reversals. Overall, GUN/USDT is behaving like a strong gainer with bullish continuation potential, offering attractive short-term opportunities for disciplined traders.

1
121
Log in to explore more content
Join global crypto users on Binance Square
⚡️ Get latest and useful information about crypto.
💬 Trusted by the world’s largest crypto exchange.
👍 Discover real insights from verified creators.
Email / Phone number
Trending Topics
SECReceivesGrayscaleLitecoinTrustETFFiling
83 views
34 Discussing
💎 Institutional Attention Reaches Litecoin
Grayscale’s ETF filing has placed $LTC in a bigger conversation. For spot traders, developments like this are a reminder to study strong assets before making any entry.
#secreceivesgrayscalelitecointrustetffiling
CryptoMahibaloch
·0 Likes
·21 views
ClarityActFacesProceduralVoteSept15
76,609 views
994 Discussing
US10YearTreasuryYieldNears5%
28,167 views
504 Discussing