
白先生
747 Posts

白先生
 Square Verified
Report
Block User
17年入圈,推特投研博主 (X: @Baisircrypto)丨比特币定投玩家丨E卫兵总部创始人

原创之星
Open Trade

ETH Holder
Occasional Trader
6.3 Years
111 Following
2.2K+ Followers
10.0K+ Liked
1 Badges
Posts
Portfolio
All
Quotes
Videos
PINNED
·
--
Ethereum and Bitcoin plummet? Don't worry, a rebound is coming!
Last week I predicted that $ETH could be considered divine, as it perfectly predicted the drop to the position of 2660!
Lao Bai made a video, about 4 minutes long, and after watching it, you will have a more comprehensive and clear judgment on the direction of the upcoming market and the trading strategy. #美国非农数据超预期 #比特币波动性 #美股2026预测
Ethereum and Bitcoin plummet? Don't worry, a rebound is coming!
Last week I predicted that $ETH could be considered divine, as it perfectly predicted the drop to the position of 2660!
Lao Bai made a video, about 4 minutes long, and after watching it, you will have a more comprehensive and clear judgment on the direction of the upcoming market and the trading strategy. #美国非农数据超预期 #比特币波动性 #美股2026预测
Last week I predicted that $ETH could be considered divine, as it perfectly predicted the drop to the position of 2660!
Lao Bai made a video, about 4 minutes long, and after watching it, you will have a more comprehensive and clear judgment on the direction of the upcoming market and the trading strategy. #美国非农数据超预期 #比特币波动性 #美股2026预测
2
2
12
1.7k
·
--
A few days ago, #ETH got scared shitless by a mere pullback, and now after the slightest bounce today, people are shouting that the bull market is back?
Either trade the swings and share signals— even if you lose on your own trades, you can still make money from commissions—or stick to dollar-cost averaging. Once you've bought, get on with your life. Don't stare at the K-line every day and give yourself anxiety.
Lao Bai finished building his DCA position a month ago, so there really isn't much room to maneuver now. Today I'll just share a quick take on the short-term direction and keep my market instincts sharp.
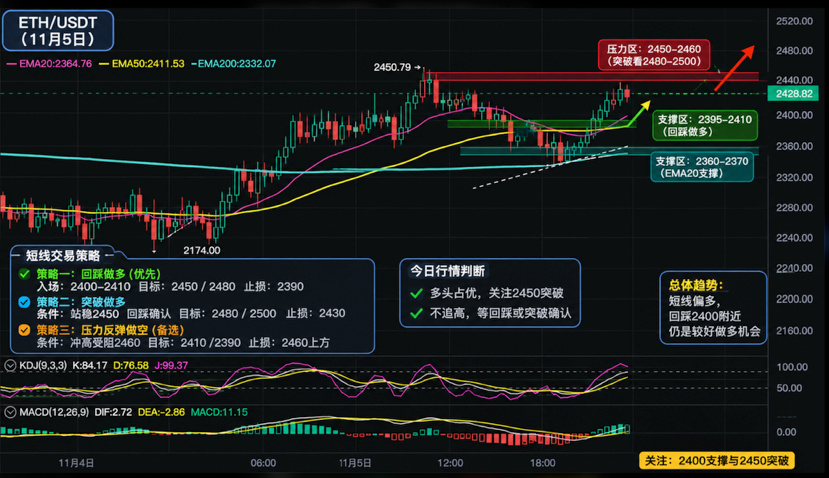
🌟 Today is actually pretty important, because the price has climbed back above EMA50 and EMA200. Previously, ETH had been trading below the daily moving averages for a long time, and rebounds were consistently capped by EMA200. This suggests the bulls are starting to regain the initiative.
🌟 The daily KDJ's J value is now at 104, and the 4-hour KDJ's J value is also close to 100. This suggests short-term buying pressure is quite concentrated. Although the trend has improved, chasing longs around $2,428 doesn't offer an attractive risk-reward ratio.
🌟 A better strategy is to wait for a pullback—for example, if $2,400 holds, then look toward $2,450 and $2,480. The risk-reward would be much better!
A few days ago, #ETH got scared shitless by a mere pullback, and now after the slightest bounce today, people are shouting that the bull market is back?
Either trade the swings and share signals— even if you lose on your own trades, you can still make money from commissions—or stick to dollar-cost averaging. Once you've bought, get on with your life. Don't stare at the K-line every day and give yourself anxiety.
Lao Bai finished building his DCA position a month ago, so there really isn't much room to maneuver now. Today I'll just share a quick take on the short-term direction and keep my market instincts sharp.
🌟 Today is actually pretty important, because the price has climbed back above EMA50 and EMA200. Previously, ETH had been trading below the daily moving averages for a long time, and rebounds were consistently capped by EMA200. This suggests the bulls are starting to regain the initiative.
🌟 The daily KDJ's J value is now at 104, and the 4-hour KDJ's J value is also close to 100. This suggests short-term buying pressure is quite concentrated. Although the trend has improved, chasing longs around $2,428 doesn't offer an attractive risk-reward ratio.
🌟 A better strategy is to wait for a pullback—for example, if $2,400 holds, then look toward $2,450 and $2,480. The risk-reward would be much better!
Either trade the swings and share signals— even if you lose on your own trades, you can still make money from commissions—or stick to dollar-cost averaging. Once you've bought, get on with your life. Don't stare at the K-line every day and give yourself anxiety.
Lao Bai finished building his DCA position a month ago, so there really isn't much room to maneuver now. Today I'll just share a quick take on the short-term direction and keep my market instincts sharp.
🌟 Today is actually pretty important, because the price has climbed back above EMA50 and EMA200. Previously, ETH had been trading below the daily moving averages for a long time, and rebounds were consistently capped by EMA200. This suggests the bulls are starting to regain the initiative.
🌟 The daily KDJ's J value is now at 104, and the 4-hour KDJ's J value is also close to 100. This suggests short-term buying pressure is quite concentrated. Although the trend has improved, chasing longs around $2,428 doesn't offer an attractive risk-reward ratio.
🌟 A better strategy is to wait for a pullback—for example, if $2,400 holds, then look toward $2,450 and $2,480. The risk-reward would be much better!
94
·
--
2026.10.24 ETH Market Update:
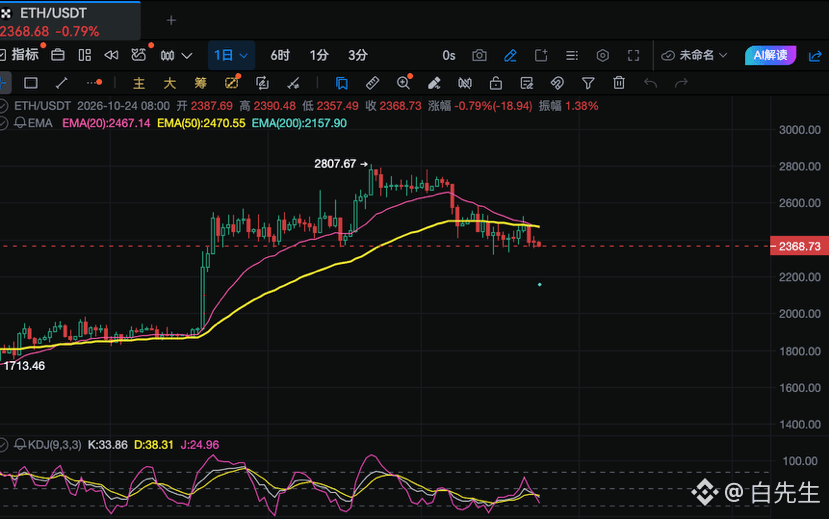
ETH is currently trading around $2,368. After retreating from a high of $2,807, it has continued to weaken on the daily chart and has fallen below the EMA20 and EMA50. These two moving averages are now acting as resistance around $2,467–$2,470.
Technically, the bearish structure on the daily chart still has the upper hand, and the KDJ has yet to confirm a clear reversal. The 4-hour chart is also continuing its downtrend.
On the 1-hour chart, the price continues to move lower, with rebound highs gradually declining. The KDJ is near oversold territory, but there is not yet a reliable reversal pattern. A technical rebound may occur in the short term, or the price may continue to test the previous low.
In the near term, this looks more like weak consolidation within a downtrend than a confirmed bottom. The key is to watch whether support at 2,350 holds and whether a rebound can reclaim the 2,400–2,470 range.
For our long-term spot holdings, we can simply continue to hold. There’s still no problem!
2026.10.24 ETH Market Update:
ETH is currently trading around $2,368. After retreating from a high of $2,807, it has continued to weaken on the daily chart and has fallen below the EMA20 and EMA50. These two moving averages are now acting as resistance around $2,467–$2,470.
Technically, the bearish structure on the daily chart still has the upper hand, and the KDJ has yet to confirm a clear reversal. The 4-hour chart is also continuing its downtrend.
On the 1-hour chart, the price continues to move lower, with rebound highs gradually declining. The KDJ is near oversold territory, but there is not yet a reliable reversal pattern. A technical rebound may occur in the short term, or the price may continue to test the previous low.
In the near term, this looks more like weak consolidation within a downtrend than a confirmed bottom. The key is to watch whether support at 2,350 holds and whether a rebound can reclaim the 2,400–2,470 range.
For our long-term spot holdings, we can simply continue to hold. There’s still no problem!
ETH is currently trading around $2,368. After retreating from a high of $2,807, it has continued to weaken on the daily chart and has fallen below the EMA20 and EMA50. These two moving averages are now acting as resistance around $2,467–$2,470.
Technically, the bearish structure on the daily chart still has the upper hand, and the KDJ has yet to confirm a clear reversal. The 4-hour chart is also continuing its downtrend.
On the 1-hour chart, the price continues to move lower, with rebound highs gradually declining. The KDJ is near oversold territory, but there is not yet a reliable reversal pattern. A technical rebound may occur in the short term, or the price may continue to test the previous low.
In the near term, this looks more like weak consolidation within a downtrend than a confirmed bottom. The key is to watch whether support at 2,350 holds and whether a rebound can reclaim the 2,400–2,470 range.
For our long-term spot holdings, we can simply continue to hold. There’s still no problem!
1
1
780
·
--
2026.10.21 ETH Market Update:
The bullish outlook discussed yesterday remains fully valid. ETH has rebounded from its recent low near $2,400 and is now at $2,481, up about 1.31% today. Short-term buying has recovered somewhat, but this alone is not enough to conclude that the decline is over.
The current price is near the EMA50 ($2,482), while the EMA20 ($2,498) above it adds another layer of short-term resistance. Technically, the KDJ has rebounded, indicating stronger recovery momentum; however, the MACD remains below the zero line and has yet to confirm a trend reversal.
For now, it’s more appropriate to treat this as a rebound. Whether ETH can reclaim $2,500 decisively matters more than a single day’s gain. If the daily price can hold firmly above $2,500 and stay above it after a pullback, there may be a chance to test $2,550–$2,600 next!
2026.10.21 ETH Market Update:
The bullish outlook discussed yesterday remains fully valid. ETH has rebounded from its recent low near $2,400 and is now at $2,481, up about 1.31% today. Short-term buying has recovered somewhat, but this alone is not enough to conclude that the decline is over.
The current price is near the EMA50 ($2,482), while the EMA20 ($2,498) above it adds another layer of short-term resistance. Technically, the KDJ has rebounded, indicating stronger recovery momentum; however, the MACD remains below the zero line and has yet to confirm a trend reversal.
For now, it’s more appropriate to treat this as a rebound. Whether ETH can reclaim $2,500 decisively matters more than a single day’s gain. If the daily price can hold firmly above $2,500 and stay above it after a pullback, there may be a chance to test $2,550–$2,600 next!
The bullish outlook discussed yesterday remains fully valid. ETH has rebounded from its recent low near $2,400 and is now at $2,481, up about 1.31% today. Short-term buying has recovered somewhat, but this alone is not enough to conclude that the decline is over.
The current price is near the EMA50 ($2,482), while the EMA20 ($2,498) above it adds another layer of short-term resistance. Technically, the KDJ has rebounded, indicating stronger recovery momentum; however, the MACD remains below the zero line and has yet to confirm a trend reversal.
For now, it’s more appropriate to treat this as a rebound. Whether ETH can reclaim $2,500 decisively matters more than a single day’s gain. If the daily price can hold firmly above $2,500 and stay above it after a pullback, there may be a chance to test $2,550–$2,600 next!
白先生
·
--
2026.10.17 ETH Market Update:
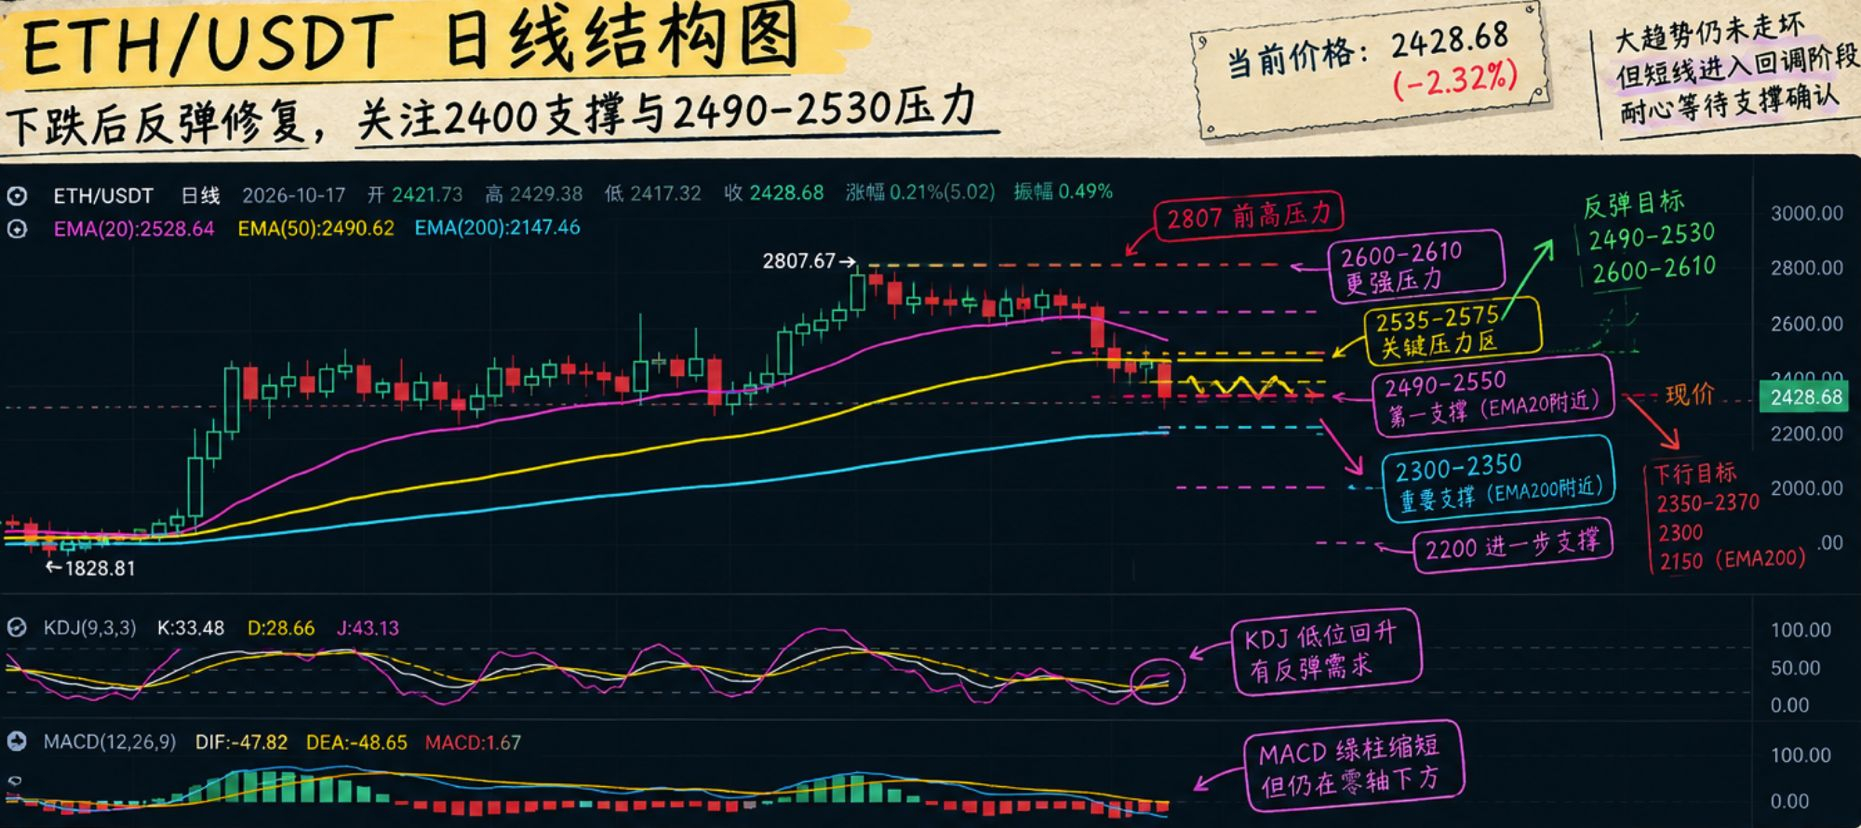
ETH has continued to pull back from its high of 2807.67 and remains in a weak consolidation phase. Today, the price tried to stabilize above 2400, but there is still no clear signal of a trend reversal.
Resistance from moving averages
The current price is below EMA20 (2528) and EMA50 (2490), so the short-term trend remains bearish. The 2490–2530 range is the first major resistance zone.
KDJ shows signs of recovery
The indicator shows signs of rebounding from low levels, so a short-term bounce is possible, but price action still needs to confirm it.
Medium- and long-term support remains below
EMA200 is around 2147, still well below the current price. If the daily chart continues to weaken and the price falls below around 2350, watch for the risk of a deeper correction.
My strategy is to favor buying on dips. If the 2400–2420 area holds and the price breaks back above 2450, it may go on to test 2490–2530. A sustained move back above this range would help repair the daily chart structure.
ETH has continued to pull back from its high of 2807.67 and remains in a weak consolidation phase. Today, the price tried to stabilize above 2400, but there is still no clear signal of a trend reversal.
Resistance from moving averages
The current price is below EMA20 (2528) and EMA50 (2490), so the short-term trend remains bearish. The 2490–2530 range is the first major resistance zone.
KDJ shows signs of recovery
The indicator shows signs of rebounding from low levels, so a short-term bounce is possible, but price action still needs to confirm it.
Medium- and long-term support remains below
EMA200 is around 2147, still well below the current price. If the daily chart continues to weaken and the price falls below around 2350, watch for the risk of a deeper correction.
My strategy is to favor buying on dips. If the 2400–2420 area holds and the price breaks back above 2450, it may go on to test 2490–2530. A sustained move back above this range would help repair the daily chart structure.
161
·
--
2026.10.18 ETH Market Analysis:
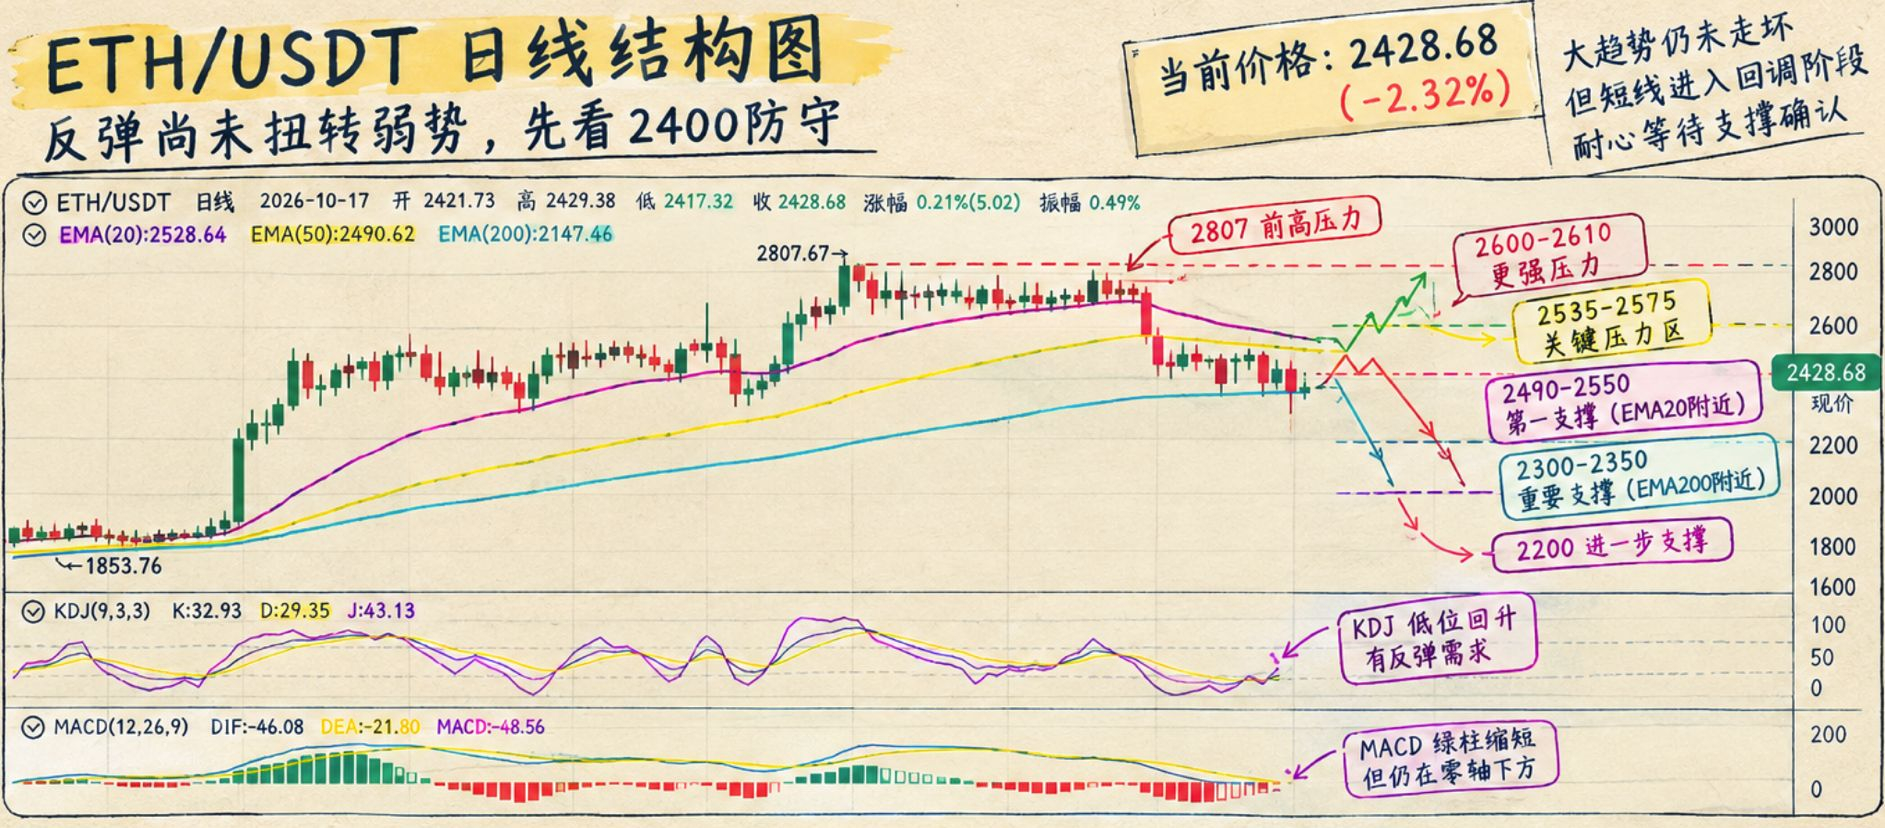
🌟 A quick recap of the price action over this period:
1. In the first phase, ETH took off from around $1,850 and surged to a high of $2,807.67, completing a clear upward trend.
2. In the second phase, ETH failed to break through near $2,808, then continued to pull back and fell below the EMA20 and EMA50. The previous bullish structure has been compromised, and the short-term outlook has shifted from strong to weak.
3. The current price is around $2,418. Although the daily chart has bounced slightly, the MACD remains in negative territory. For now, this can only be viewed as a recovery during a downtrend; there is no clear signal of a trend reversal yet.
🌟 So, the market is currently biased toward bearish consolidation, and the key level to watch is whether $2,400 holds.
1. The KDJ is currently at relatively low levels and showing signs of a modest recovery, but the MACD remains weak. Only if the price regains $2,485–$2,520 could the daily chart structure gradually recover.
2. This is also the direction I lean toward. A bottoming signal may emerge around $2,400, followed by a move back above $2,485–$2,500 and another test of $2,515–$2,550!
2026.10.18 ETH Market Analysis:
🌟 A quick recap of the price action over this period:
1. In the first phase, ETH took off from around $1,850 and surged to a high of $2,807.67, completing a clear upward trend.
2. In the second phase, ETH failed to break through near $2,808, then continued to pull back and fell below the EMA20 and EMA50. The previous bullish structure has been compromised, and the short-term outlook has shifted from strong to weak.
3. The current price is around $2,418. Although the daily chart has bounced slightly, the MACD remains in negative territory. For now, this can only be viewed as a recovery during a downtrend; there is no clear signal of a trend reversal yet.
🌟 So, the market is currently biased toward bearish consolidation, and the key level to watch is whether $2,400 holds.
1. The KDJ is currently at relatively low levels and showing signs of a modest recovery, but the MACD remains weak. Only if the price regains $2,485–$2,520 could the daily chart structure gradually recover.
2. This is also the direction I lean toward. A bottoming signal may emerge around $2,400, followed by a move back above $2,485–$2,500 and another test of $2,515–$2,550!
🌟 A quick recap of the price action over this period:
1. In the first phase, ETH took off from around $1,850 and surged to a high of $2,807.67, completing a clear upward trend.
2. In the second phase, ETH failed to break through near $2,808, then continued to pull back and fell below the EMA20 and EMA50. The previous bullish structure has been compromised, and the short-term outlook has shifted from strong to weak.
3. The current price is around $2,418. Although the daily chart has bounced slightly, the MACD remains in negative territory. For now, this can only be viewed as a recovery during a downtrend; there is no clear signal of a trend reversal yet.
🌟 So, the market is currently biased toward bearish consolidation, and the key level to watch is whether $2,400 holds.
1. The KDJ is currently at relatively low levels and showing signs of a modest recovery, but the MACD remains weak. Only if the price regains $2,485–$2,520 could the daily chart structure gradually recover.
2. This is also the direction I lean toward. A bottoming signal may emerge around $2,400, followed by a move back above $2,485–$2,500 and another test of $2,515–$2,550!
1.1k
·
--
2026.10.17 ETH Market Update:
ETH has continued to pull back from its high of 2807.67 and remains in a weak consolidation phase. Today, the price tried to stabilize above 2400, but there is still no clear signal of a trend reversal.
Resistance from moving averages
The current price is below EMA20 (2528) and EMA50 (2490), so the short-term trend remains bearish. The 2490–2530 range is the first major resistance zone.
KDJ shows signs of recovery
The indicator shows signs of rebounding from low levels, so a short-term bounce is possible, but price action still needs to confirm it.
Medium- and long-term support remains below
EMA200 is around 2147, still well below the current price. If the daily chart continues to weaken and the price falls below around 2350, watch for the risk of a deeper correction.
My strategy is to favor buying on dips. If the 2400–2420 area holds and the price breaks back above 2450, it may go on to test 2490–2530. A sustained move back above this range would help repair the daily chart structure.
2026.10.17 ETH Market Update:
ETH has continued to pull back from its high of 2807.67 and remains in a weak consolidation phase. Today, the price tried to stabilize above 2400, but there is still no clear signal of a trend reversal.
Resistance from moving averages
The current price is below EMA20 (2528) and EMA50 (2490), so the short-term trend remains bearish. The 2490–2530 range is the first major resistance zone.
KDJ shows signs of recovery
The indicator shows signs of rebounding from low levels, so a short-term bounce is possible, but price action still needs to confirm it.
Medium- and long-term support remains below
EMA200 is around 2147, still well below the current price. If the daily chart continues to weaken and the price falls below around 2350, watch for the risk of a deeper correction.
My strategy is to favor buying on dips. If the 2400–2420 area holds and the price breaks back above 2450, it may go on to test 2490–2530. A sustained move back above this range would help repair the daily chart structure.
ETH has continued to pull back from its high of 2807.67 and remains in a weak consolidation phase. Today, the price tried to stabilize above 2400, but there is still no clear signal of a trend reversal.
Resistance from moving averages
The current price is below EMA20 (2528) and EMA50 (2490), so the short-term trend remains bearish. The 2490–2530 range is the first major resistance zone.
KDJ shows signs of recovery
The indicator shows signs of rebounding from low levels, so a short-term bounce is possible, but price action still needs to confirm it.
Medium- and long-term support remains below
EMA200 is around 2147, still well below the current price. If the daily chart continues to weaken and the price falls below around 2350, watch for the risk of a deeper correction.
My strategy is to favor buying on dips. If the 2400–2420 area holds and the price breaks back above 2450, it may go on to test 2490–2530. A sustained move back above this range would help repair the daily chart structure.
1
186
·
--
2026.10.15 ETH Market Update:
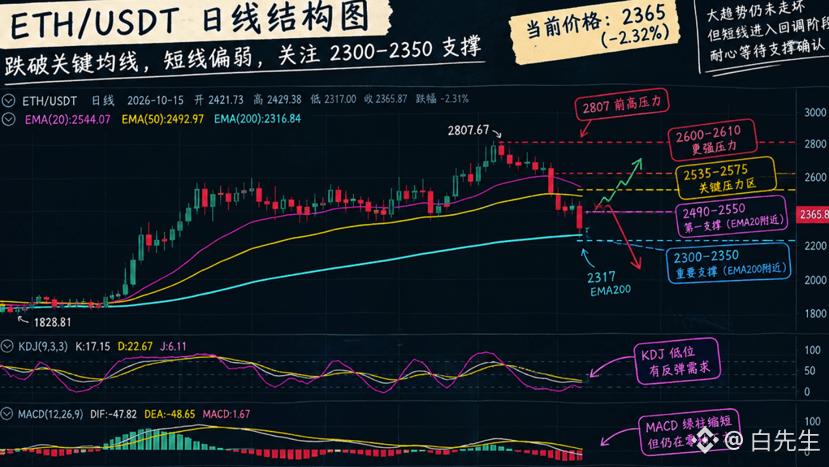
ETH has fallen to around $2,365 today, continuing to weaken after pulling back from its high of $2,800 and entering a clear correction phase.
The 200-day moving average is currently around $2,317 and is the key support to watch. If the price breaks below it, it will be very difficult to make another run at new highs in the short term, and it could continue falling toward the $2,200 area!
We’re back in a range where dollar-cost averaging makes sense. For those who regretted not buying earlier, this could also be a good spot to buy ETH on the spot market—but continue to prioritize spot purchases. A meaningful recovery signal will only appear if the price reclaims the $2,490–$2,550 range, so we’ll need to wait patiently!
2026.10.15 ETH Market Update:
ETH has fallen to around $2,365 today, continuing to weaken after pulling back from its high of $2,800 and entering a clear correction phase.
The 200-day moving average is currently around $2,317 and is the key support to watch. If the price breaks below it, it will be very difficult to make another run at new highs in the short term, and it could continue falling toward the $2,200 area!
We’re back in a range where dollar-cost averaging makes sense. For those who regretted not buying earlier, this could also be a good spot to buy ETH on the spot market—but continue to prioritize spot purchases. A meaningful recovery signal will only appear if the price reclaims the $2,490–$2,550 range, so we’ll need to wait patiently!
ETH has fallen to around $2,365 today, continuing to weaken after pulling back from its high of $2,800 and entering a clear correction phase.
The 200-day moving average is currently around $2,317 and is the key support to watch. If the price breaks below it, it will be very difficult to make another run at new highs in the short term, and it could continue falling toward the $2,200 area!
We’re back in a range where dollar-cost averaging makes sense. For those who regretted not buying earlier, this could also be a good spot to buy ETH on the spot market—but continue to prioritize spot purchases. A meaningful recovery signal will only appear if the price reclaims the $2,490–$2,550 range, so we’ll need to wait patiently!
325
·
--
2026.10.10 ETH Market Update:
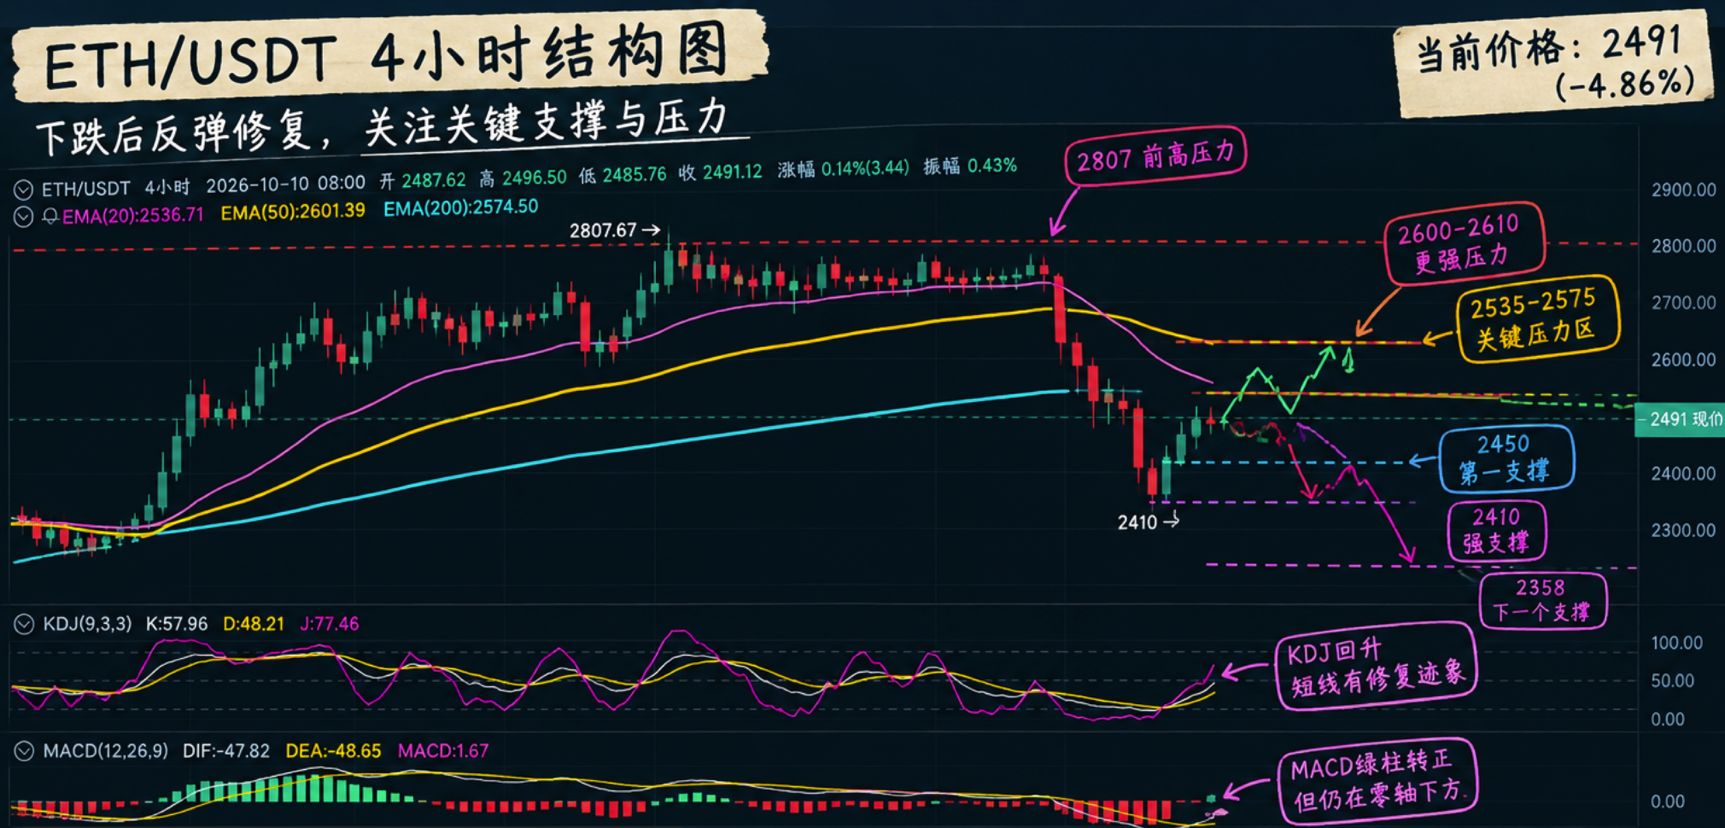
ETH has fallen rapidly from around 2,700 to the 2,410 area, and has now rebounded to $2,491. The upward structure has been broken, and the market is now in a post-decline recovery phase.
➤ Technical analysis:
The current price is below the EMA20 (2,536), EMA200 (2,574), and EMA50 (2,601), with multiple resistance levels overhead.
Short-term rebound signals have emerged: KDJ is recovering, and the MACD histogram has turned positive. However, DIF and DEA remain below the zero line, so for now this can only be viewed as a recovery after the decline—not a confirmed reversal. If the price falls again, it could potentially reach around 2,358.
➤ Possible scenarios
Scenario A: The rebound continues
The price needs to reclaim 2,535 and break decisively above 2,575 before it has a chance to test 2,600–2,610. Watch whether it can hold after a pullback following the breakout.
Scenario B: The rebound fails
If the 2,535–2,575 area holds as resistance and the price falls back below 2,450, the market may retest 2,410. If that level gives way, watch 2,358.
Scenario C: Range-bound trading near the lows
If the 2,410–2,535 range is not decisively broken for now, the market may continue to form a base with choppy price action. Avoid rushing to call a one-way trend.
➤ Strategy
In the short term, you can wait for confirmation of a breakout above 2,535–2,575, or watch for signs of a rebound in the 2,450–2,410 support zone before considering entering in stages.
Reassess whether the trend has recovered only after the price has firmly reclaimed the area above 2,600.
2026.10.10 ETH Market Update:
ETH has fallen rapidly from around 2,700 to the 2,410 area, and has now rebounded to $2,491. The upward structure has been broken, and the market is now in a post-decline recovery phase.
➤ Technical analysis:
The current price is below the EMA20 (2,536), EMA200 (2,574), and EMA50 (2,601), with multiple resistance levels overhead.
Short-term rebound signals have emerged: KDJ is recovering, and the MACD histogram has turned positive. However, DIF and DEA remain below the zero line, so for now this can only be viewed as a recovery after the decline—not a confirmed reversal. If the price falls again, it could potentially reach around 2,358.
➤ Possible scenarios
Scenario A: The rebound continues
The price needs to reclaim 2,535 and break decisively above 2,575 before it has a chance to test 2,600–2,610. Watch whether it can hold after a pullback following the breakout.
Scenario B: The rebound fails
If the 2,535–2,575 area holds as resistance and the price falls back below 2,450, the market may retest 2,410. If that level gives way, watch 2,358.
Scenario C: Range-bound trading near the lows
If the 2,410–2,535 range is not decisively broken for now, the market may continue to form a base with choppy price action. Avoid rushing to call a one-way trend.
➤ Strategy
In the short term, you can wait for confirmation of a breakout above 2,535–2,575, or watch for signs of a rebound in the 2,450–2,410 support zone before considering entering in stages.
Reassess whether the trend has recovered only after the price has firmly reclaimed the area above 2,600.
ETH has fallen rapidly from around 2,700 to the 2,410 area, and has now rebounded to $2,491. The upward structure has been broken, and the market is now in a post-decline recovery phase.
➤ Technical analysis:
The current price is below the EMA20 (2,536), EMA200 (2,574), and EMA50 (2,601), with multiple resistance levels overhead.
Short-term rebound signals have emerged: KDJ is recovering, and the MACD histogram has turned positive. However, DIF and DEA remain below the zero line, so for now this can only be viewed as a recovery after the decline—not a confirmed reversal. If the price falls again, it could potentially reach around 2,358.
➤ Possible scenarios
Scenario A: The rebound continues
The price needs to reclaim 2,535 and break decisively above 2,575 before it has a chance to test 2,600–2,610. Watch whether it can hold after a pullback following the breakout.
Scenario B: The rebound fails
If the 2,535–2,575 area holds as resistance and the price falls back below 2,450, the market may retest 2,410. If that level gives way, watch 2,358.
Scenario C: Range-bound trading near the lows
If the 2,410–2,535 range is not decisively broken for now, the market may continue to form a base with choppy price action. Avoid rushing to call a one-way trend.
➤ Strategy
In the short term, you can wait for confirmation of a breakout above 2,535–2,575, or watch for signs of a rebound in the 2,450–2,410 support zone before considering entering in stages.
Reassess whether the trend has recovered only after the price has firmly reclaimed the area above 2,600.
638
·
--
2026.10.2 ETH Market Analysis:
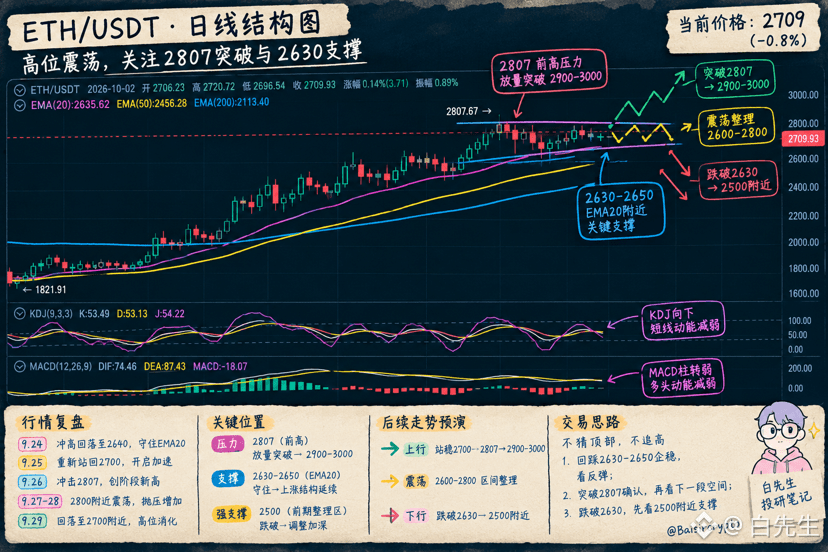
ETH continues to trade sideways around 2700 today, and the overall structure has not yet turned bearish.
Previously, ETH broke out from 1800 all the way to 2600, then surged to 2807. Now it’s in consolidation at a high level after the upswing.
Currently, focus on two key levels:
2807: The previous high resistance. Only after a volume-supported breakout can it further open up room for upside; next, watch 2900-3000.
2630-2650: Around the EMA20 area—also a crucial short-term support. As long as it holds here, the overall uptrend structure remains intact.
2026.10.2 ETH Market Analysis:
ETH continues to trade sideways around 2700 today, and the overall structure has not yet turned bearish.
Previously, ETH broke out from 1800 all the way to 2600, then surged to 2807. Now it’s in consolidation at a high level after the upswing.
Currently, focus on two key levels:
2807: The previous high resistance. Only after a volume-supported breakout can it further open up room for upside; next, watch 2900-3000.
2630-2650: Around the EMA20 area—also a crucial short-term support. As long as it holds here, the overall uptrend structure remains intact.
ETH continues to trade sideways around 2700 today, and the overall structure has not yet turned bearish.
Previously, ETH broke out from 1800 all the way to 2600, then surged to 2807. Now it’s in consolidation at a high level after the upswing.
Currently, focus on two key levels:
2807: The previous high resistance. Only after a volume-supported breakout can it further open up room for upside; next, watch 2900-3000.
2630-2650: Around the EMA20 area—also a crucial short-term support. As long as it holds here, the overall uptrend structure remains intact.
515
·
--
2026.9.29 ETH Market Update:
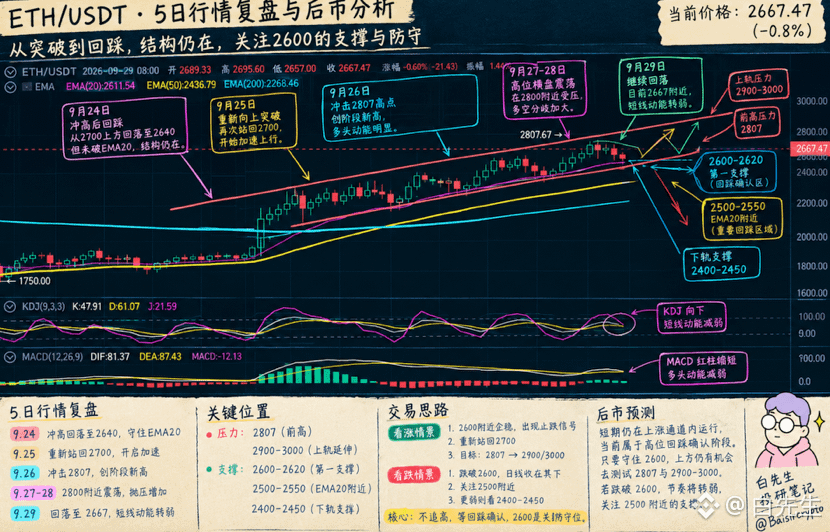
In the past few days, ETH has really been frustrating. It surged to 2700 on the 24th and then pulled back, but overall the EMA20 still suggests the uptrend structure is temporarily intact.
On the 25th–26th, the price moved back above 2700 and set a stage high of 2807.67. This stage belongs to the acceleration phase after a breakout.
However, on the 27th–28th, there was no further breakout near 2800. The price gradually returned to a range-bound movement between 2700 and 2750. This indicates that selling pressure above has started to increase, but there is still support underneath.
Today, price has returned to around 2667—down from the 2807 peak by about 5%. Meanwhile, the KDJ is turning downward and the MACD histogram has weakened, with short-term momentum clearly weaker than in the previous days.
Above 2700 is the resistance zone, while around 2600 is the line dividing bulls and bears.
2026.9.29 ETH Market Update:
In the past few days, ETH has really been frustrating. It surged to 2700 on the 24th and then pulled back, but overall the EMA20 still suggests the uptrend structure is temporarily intact.
On the 25th–26th, the price moved back above 2700 and set a stage high of 2807.67. This stage belongs to the acceleration phase after a breakout.
However, on the 27th–28th, there was no further breakout near 2800. The price gradually returned to a range-bound movement between 2700 and 2750. This indicates that selling pressure above has started to increase, but there is still support underneath.
Today, price has returned to around 2667—down from the 2807 peak by about 5%. Meanwhile, the KDJ is turning downward and the MACD histogram has weakened, with short-term momentum clearly weaker than in the previous days.
Above 2700 is the resistance zone, while around 2600 is the line dividing bulls and bears.
In the past few days, ETH has really been frustrating. It surged to 2700 on the 24th and then pulled back, but overall the EMA20 still suggests the uptrend structure is temporarily intact.
On the 25th–26th, the price moved back above 2700 and set a stage high of 2807.67. This stage belongs to the acceleration phase after a breakout.
However, on the 27th–28th, there was no further breakout near 2800. The price gradually returned to a range-bound movement between 2700 and 2750. This indicates that selling pressure above has started to increase, but there is still support underneath.
Today, price has returned to around 2667—down from the 2807 peak by about 5%. Meanwhile, the KDJ is turning downward and the MACD histogram has weakened, with short-term momentum clearly weaker than in the previous days.
Above 2700 is the resistance zone, while around 2600 is the line dividing bulls and bears.
295
·
--
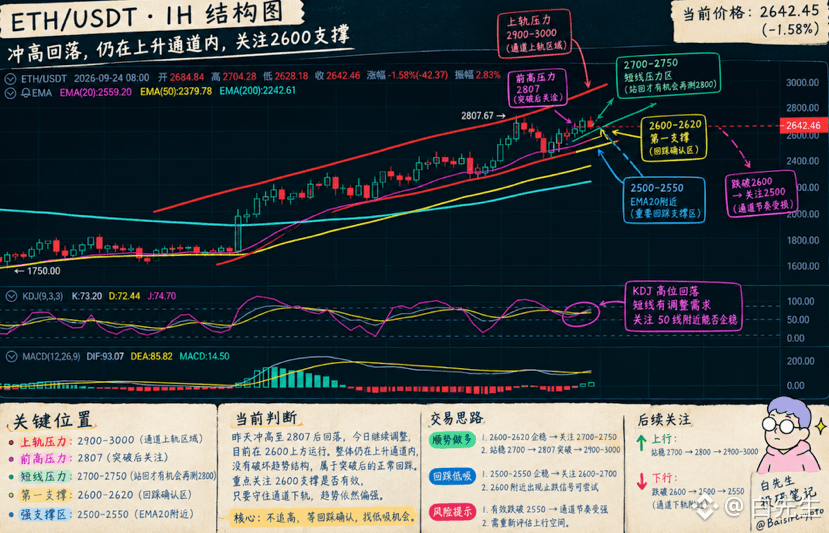
After hitting 2807 yesterday and then pulling back, today the daily chart continues to weaken, currently around 2642.
From a structure standpoint, the market hasn’t yet broken the previous uptrend channel, but in the short term it has entered a pullback and confirmation phase.
Today, the key focus is 2600–2620—this is also the pullback zone after the prior breakout. If it holds here, it still counts as strength!
If 2600 breaks down decisively, then the uptrend channel will need to be reassessed, and the next target will be around 2500.
However, right now it looks more like a normal retracement after a push up near 2800, and it hasn’t reached the confirmation stage of a trend reversal. Most likely, it will continue moving upward!
After hitting 2807 yesterday and then pulling back, today the daily chart continues to weaken, currently around 2642.
From a structure standpoint, the market hasn’t yet broken the previous uptrend channel, but in the short term it has entered a pullback and confirmation phase.
Today, the key focus is 2600–2620—this is also the pullback zone after the prior breakout. If it holds here, it still counts as strength!
If 2600 breaks down decisively, then the uptrend channel will need to be reassessed, and the next target will be around 2500.
However, right now it looks more like a normal retracement after a push up near 2800, and it hasn’t reached the confirmation stage of a trend reversal. Most likely, it will continue moving upward!
From a structure standpoint, the market hasn’t yet broken the previous uptrend channel, but in the short term it has entered a pullback and confirmation phase.
Today, the key focus is 2600–2620—this is also the pullback zone after the prior breakout. If it holds here, it still counts as strength!
If 2600 breaks down decisively, then the uptrend channel will need to be reassessed, and the next target will be around 2500.
However, right now it looks more like a normal retracement after a push up near 2800, and it hasn’t reached the confirmation stage of a trend reversal. Most likely, it will continue moving upward!
573
·
--
2026.9.23 ETH intraday行情
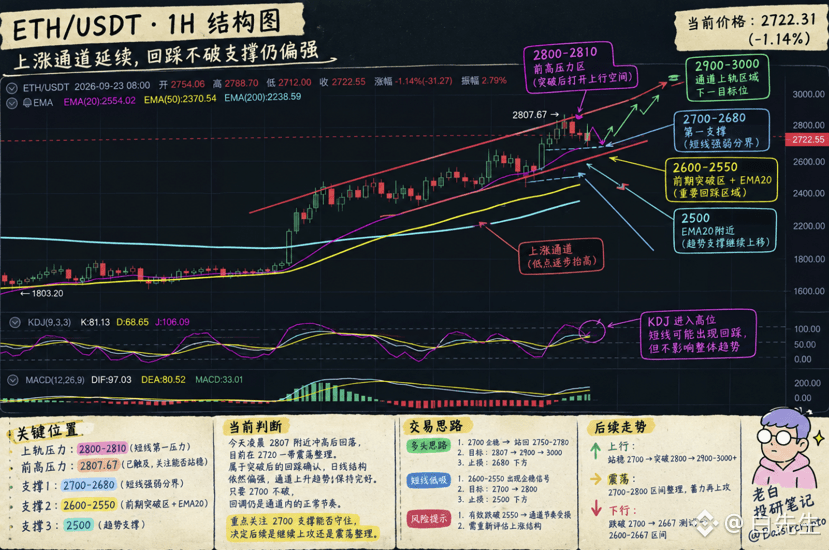
Currently, the short-term upward channel has basically formed. The key focus is whether this upward channel can continue to hold:
* 2700–2680: First support, the short-term strength/weakness dividing line
* 2600–2550: The prior breakout zone + near the EMA20, a more important pullback area
* 2807: The current previous high; only after price reclaims above it can the upside space be considered opened again
* 2900–3000: The next resistance area projected based on the channel’s upper boundary
Short-term strategy:
If price stabilizes and turns up around 2700, and then reclaims 2750–2780, you can continue to watch the move toward 2807 → 2900
2026.9.23 ETH intraday行情
Currently, the short-term upward channel has basically formed. The key focus is whether this upward channel can continue to hold:
* 2700–2680: First support, the short-term strength/weakness dividing line
* 2600–2550: The prior breakout zone + near the EMA20, a more important pullback area
* 2807: The current previous high; only after price reclaims above it can the upside space be considered opened again
* 2900–3000: The next resistance area projected based on the channel’s upper boundary
Short-term strategy:
If price stabilizes and turns up around 2700, and then reclaims 2750–2780, you can continue to watch the move toward 2807 → 2900
Currently, the short-term upward channel has basically formed. The key focus is whether this upward channel can continue to hold:
* 2700–2680: First support, the short-term strength/weakness dividing line
* 2600–2550: The prior breakout zone + near the EMA20, a more important pullback area
* 2807: The current previous high; only after price reclaims above it can the upside space be considered opened again
* 2900–3000: The next resistance area projected based on the channel’s upper boundary
Short-term strategy:
If price stabilizes and turns up around 2700, and then reclaims 2750–2780, you can continue to watch the move toward 2807 → 2900
923
·
--
2026.9.19 ETH intraday market
From the daily chart, ETH has directly broken above 2700 today. The high is 2749, and it is currently at 2727, with a strong bullish candle body pushing forward.
In terms of indicators, the EMA20/50/200 remains in a bullish alignment, and the MACD stays positive, suggesting the daily trend is still relatively strong. However, the KDJ has already entered the overbought zone—J is above 100. After a continuous surge in the short term, it is completely normal to see a pullback, a high-level consolidation, and even a retest.
So going forward, what I care about most is:
Holding above 2668 → then targeting 2749 → breaking through 2800
If there is a clear high-and-reversal near above 2700, first watch whether 2668 can hold. As long as the daily structure does not break back down below 2600, there is really a good chance of continuing to push toward 2800.
2026.9.19 ETH intraday market
From the daily chart, ETH has directly broken above 2700 today. The high is 2749, and it is currently at 2727, with a strong bullish candle body pushing forward.
In terms of indicators, the EMA20/50/200 remains in a bullish alignment, and the MACD stays positive, suggesting the daily trend is still relatively strong. However, the KDJ has already entered the overbought zone—J is above 100. After a continuous surge in the short term, it is completely normal to see a pullback, a high-level consolidation, and even a retest.
So going forward, what I care about most is:
Holding above 2668 → then targeting 2749 → breaking through 2800
If there is a clear high-and-reversal near above 2700, first watch whether 2668 can hold. As long as the daily structure does not break back down below 2600, there is really a good chance of continuing to push toward 2800.
From the daily chart, ETH has directly broken above 2700 today. The high is 2749, and it is currently at 2727, with a strong bullish candle body pushing forward.
In terms of indicators, the EMA20/50/200 remains in a bullish alignment, and the MACD stays positive, suggesting the daily trend is still relatively strong. However, the KDJ has already entered the overbought zone—J is above 100. After a continuous surge in the short term, it is completely normal to see a pullback, a high-level consolidation, and even a retest.
So going forward, what I care about most is:
Holding above 2668 → then targeting 2749 → breaking through 2800
If there is a clear high-and-reversal near above 2700, first watch whether 2668 can hold. As long as the daily structure does not break back down below 2600, there is really a good chance of continuing to push toward 2800.
1
2.5k
·
--
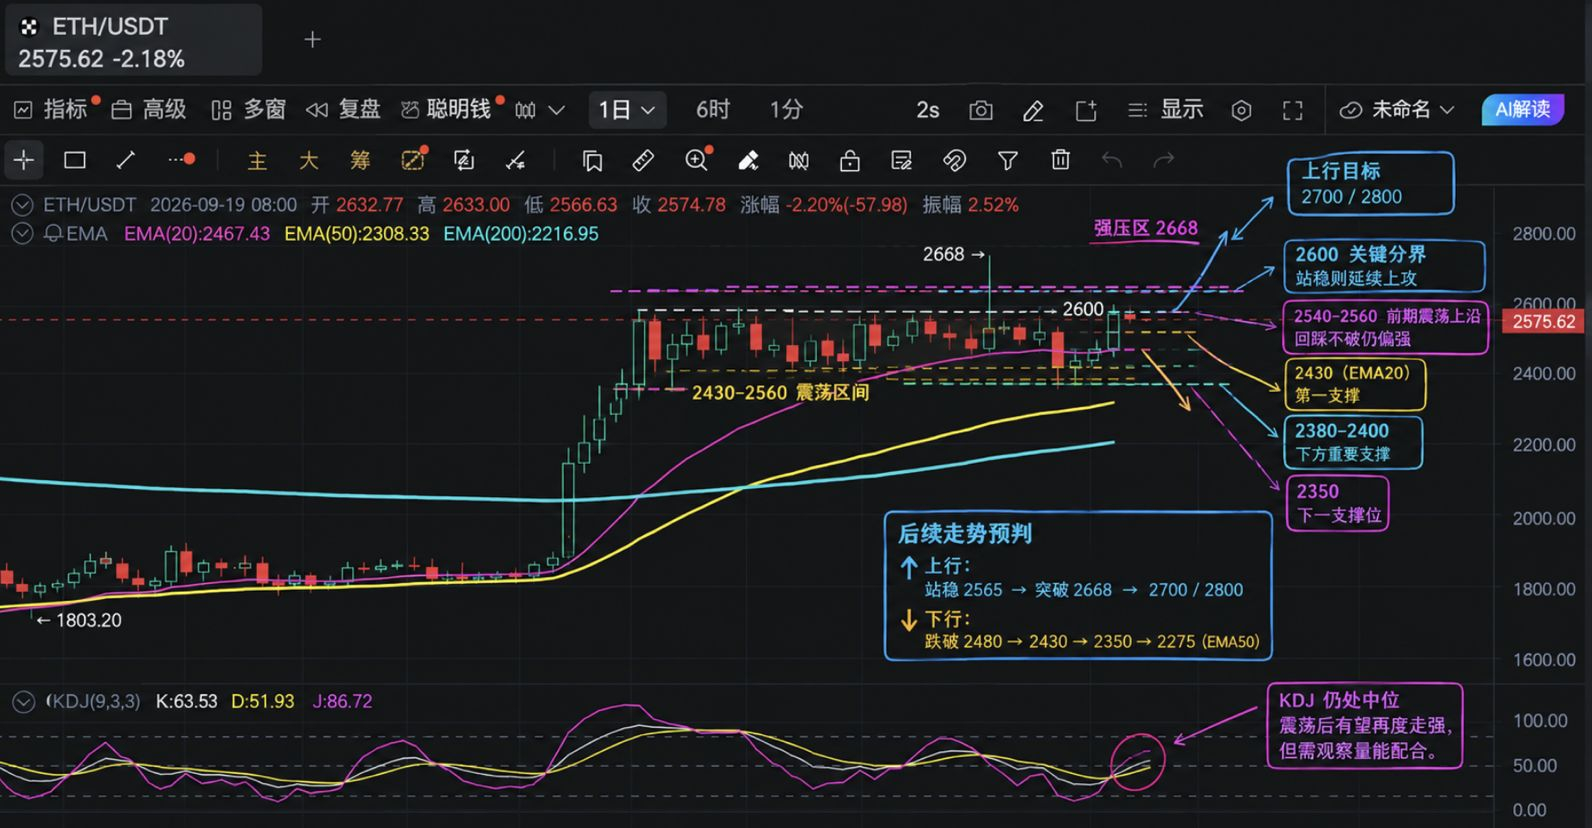
After ETH broke above 2600 yesterday, there was a pullback today. It is now hovering around 2580.
I don’t think this surge-and-retrace is unusual. As long as the price continues to hold above 2500, the daily structure will still be relatively bullish.
What you need to watch for now is a break below 2480, which is also around the 20-day EMA. If it fails here, it would mean this breakout will need a longer period to digest.
After ETH broke above 2600 yesterday, there was a pullback today. It is now hovering around 2580.
I don’t think this surge-and-retrace is unusual. As long as the price continues to hold above 2500, the daily structure will still be relatively bullish.
What you need to watch for now is a break below 2480, which is also around the 20-day EMA. If it fails here, it would mean this breakout will need a longer period to digest.
I don’t think this surge-and-retrace is unusual. As long as the price continues to hold above 2500, the daily structure will still be relatively bullish.
What you need to watch for now is a break below 2480, which is also around the 20-day EMA. If it fails here, it would mean this breakout will need a longer period to digest.
1
1.1k
·
--
2026.9.19 ETH intraday market
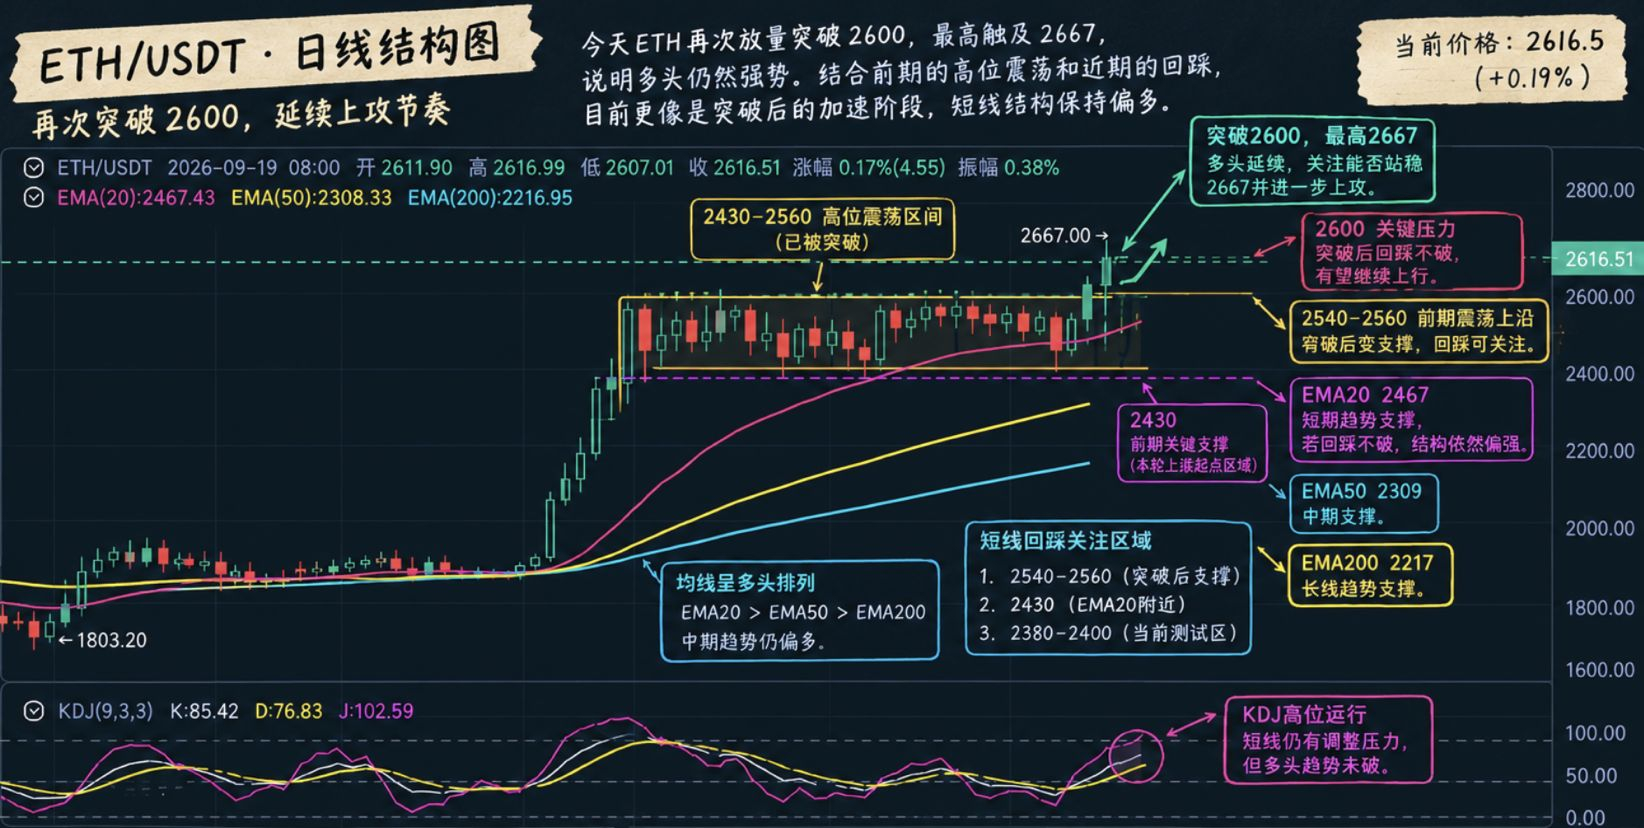
ETH today has once again broken above 2600, with a high reaching 2667. This clearly echoes the breakout on the 11th. From the daily chart, the prior ranging zone of 2430–2560 has already broken upward. In addition, EMA20, EMA50, and EMA200 are continuing to stay in a bullish alignment, indicating that the overall structure is still strong.
At the moment, it looks more like the second push higher after the earlier breakout. 2600 has gradually shifted from a resistance level into a key boundary level. The next focus is whether pullbacks can hold.
If, after breaking 2667, a retest of 2540–2560 is able to hold and absorb, then the earlier resistance may turn into support. The market structure could open further, and the next steps would be to watch 2700, and then 2800.
If price spikes higher and then falls back below 2540, it would suggest that this breakout still needs to digest. In that case, pay further attention to the 2430 area.
2026.9.19 ETH intraday market
ETH today has once again broken above 2600, with a high reaching 2667. This clearly echoes the breakout on the 11th. From the daily chart, the prior ranging zone of 2430–2560 has already broken upward. In addition, EMA20, EMA50, and EMA200 are continuing to stay in a bullish alignment, indicating that the overall structure is still strong.
At the moment, it looks more like the second push higher after the earlier breakout. 2600 has gradually shifted from a resistance level into a key boundary level. The next focus is whether pullbacks can hold.
If, after breaking 2667, a retest of 2540–2560 is able to hold and absorb, then the earlier resistance may turn into support. The market structure could open further, and the next steps would be to watch 2700, and then 2800.
If price spikes higher and then falls back below 2540, it would suggest that this breakout still needs to digest. In that case, pay further attention to the 2430 area.
ETH today has once again broken above 2600, with a high reaching 2667. This clearly echoes the breakout on the 11th. From the daily chart, the prior ranging zone of 2430–2560 has already broken upward. In addition, EMA20, EMA50, and EMA200 are continuing to stay in a bullish alignment, indicating that the overall structure is still strong.
At the moment, it looks more like the second push higher after the earlier breakout. 2600 has gradually shifted from a resistance level into a key boundary level. The next focus is whether pullbacks can hold.
If, after breaking 2667, a retest of 2540–2560 is able to hold and absorb, then the earlier resistance may turn into support. The market structure could open further, and the next steps would be to watch 2700, and then 2800.
If price spikes higher and then falls back below 2540, it would suggest that this breakout still needs to digest. In that case, pay further attention to the 2430 area.
2
1.7k
·
--
2026.9.11 ETH intraday market
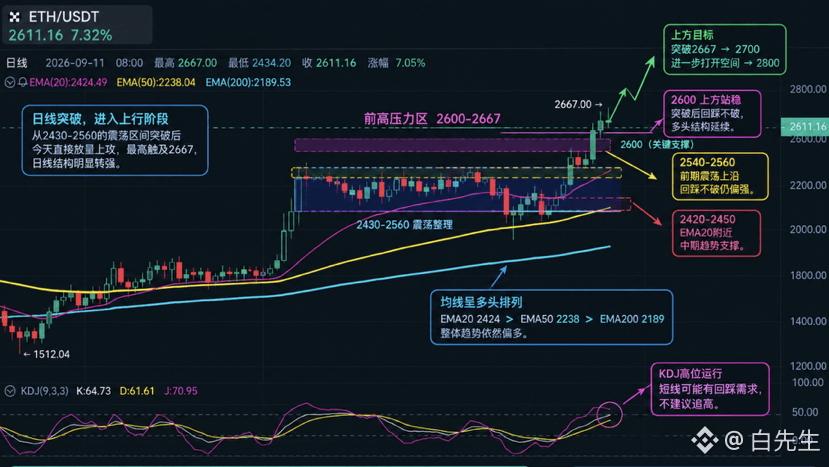
Just after an hour line continued to break through, the hourly chart has moved from a consolidation phase into an official new round of upward attack.
From the daily structure, after the earlier 2430–2560 range-bound consolidation, today saw a volume expansion breakout directly above 2600, with the high reaching 2667—this is a fairly clear breakout at the upper edge of the range.
Although the bullish alignment trend is already confirmed, I don’t chase it directly. A truly healthy move is to hold steady above 2600, then pull back to confirm before continuing higher. So even if you want to buy, you can wait for the pullback!
Because the breakout is happening too quickly, I’m more inclined to expect short-term consolidation. It may pull back to around 2540–2560. Once it holds, it should continue breaking through 2700, and then we’ll look toward 2800!
2026.9.11 ETH intraday market
Just after an hour line continued to break through, the hourly chart has moved from a consolidation phase into an official new round of upward attack.
From the daily structure, after the earlier 2430–2560 range-bound consolidation, today saw a volume expansion breakout directly above 2600, with the high reaching 2667—this is a fairly clear breakout at the upper edge of the range.
Although the bullish alignment trend is already confirmed, I don’t chase it directly. A truly healthy move is to hold steady above 2600, then pull back to confirm before continuing higher. So even if you want to buy, you can wait for the pullback!
Because the breakout is happening too quickly, I’m more inclined to expect short-term consolidation. It may pull back to around 2540–2560. Once it holds, it should continue breaking through 2700, and then we’ll look toward 2800!
Just after an hour line continued to break through, the hourly chart has moved from a consolidation phase into an official new round of upward attack.
From the daily structure, after the earlier 2430–2560 range-bound consolidation, today saw a volume expansion breakout directly above 2600, with the high reaching 2667—this is a fairly clear breakout at the upper edge of the range.
Although the bullish alignment trend is already confirmed, I don’t chase it directly. A truly healthy move is to hold steady above 2600, then pull back to confirm before continuing higher. So even if you want to buy, you can wait for the pullback!
Because the breakout is happening too quickly, I’m more inclined to expect short-term consolidation. It may pull back to around 2540–2560. Once it holds, it should continue breaking through 2700, and then we’ll look toward 2800!
733
Log in to explore more content
Join global crypto users on Binance Square
⚡️ Get latest and useful information about crypto.
💬 Trusted by the world’s largest crypto exchange.
👍 Discover real insights from verified creators.
Email / Phone number
Trending Topics
HotCPIDecemberHikePriced
177,802 views
1,896 Discussing
CPI Market Watch | US CPI Rises 0.4% in October, Hotter Than 0.3% Forecast
Binance News
·30 Likes
·42.4k views
StrategyFaces$2.8BSelloffRiskFromMSCIRemoval
2,830 views
37 Discussing
AnthropicRejectsIPODelayValuationinQuestion
279,370 views
2,358 Discussing