2Bo_Omar

قل ان الامر كله لله
44 Following
21 Followers
102 Liked
Posts
Portfolio
·
--
$BTC Bitcoin was viewed as a safe-haven asset far from the traditional system. The entry of the ETFs tied a noose around “Wall Street”; if technology stocks in the S&P 500 index fall, Bitcoin funds will automatically collapse as large investment portfolios are liquidated to cover their losses (Margin Calls)
$BTC

Bitcoin was viewed as a safe-haven asset far from the traditional system. The entry of the ETFs tied a noose around “Wall Street”; if technology stocks in the S&P 500 index fall, Bitcoin funds will automatically collapse as large investment portfolios are liquidated to cover their losses (Margin Calls)
$BTC Governments and authorities realized that a complete ban (as China did previously) did not work. The stronger alternative was "taming the beast". When traditional institutions and ETF funds control the largest share of liquidity and stored assets, they become the ones that set the direction of the market and the rules of the game, without needing to issue prohibition laws that spark outrage
$BTC

Governments and authorities realized that a complete ban (as China did previously) did not work. The stronger alternative was "taming the beast".

When traditional institutions and ETF funds control the largest share of liquidity and stored assets, they become the ones that set the direction of the market and the rules of the game, without needing to issue prohibition laws that spark outrage
$BTC Daily reports on ETF fund flows (inflows and outflows) have become the new RSI indicator. If negative flows continue for several consecutive days, this means an inevitable selling pressure in the spot market, and vice versa.
$BTC

Daily reports on ETF fund flows (inflows and outflows) have become the new RSI indicator. If negative flows continue for several consecutive days, this means an inevitable selling pressure in the spot market, and vice versa.
$BTC Traditional tools for technical analysis no longer perform with the same efficiency because the "liquidity identity" itself has changed.. When retail money was the main driver of crypto, human emotions (fear and absolute greed) were the fuel, and "Fibonacci" analysis and momentum indicators like the EMA translated this psychology brilliantly. Today, however, we face cold algorithms and hedge funds managed with billions of dollars that know no emotion—they move according to portfolio-balancing equations and institutional risk management.
$BTC

Traditional tools for technical analysis no longer perform with the same efficiency because the "liquidity identity" itself has changed..

When retail money was the main driver of crypto, human emotions (fear and absolute greed) were the fuel, and "Fibonacci" analysis and momentum indicators like the EMA translated this psychology brilliantly.

Today, however, we face cold algorithms and hedge funds managed with billions of dollars that know no emotion—they move according to portfolio-balancing equations and institutional risk management.
$BTC {spot}(BTCUSDT) Because of the impact of institutional flows and ETFs on traditional trading strategies; I don’t think tools like "Fibonacci levels" or moving averages (EMA) can still predict bottoms and tops in the "Wall Street" era. We need to completely reinvent analytical tools What laws and regulations failed to achieve was accomplished by massive liquidity. Through these funds, Bitcoin has transformed from a "revolutionary tool empowering individuals financially outside the system" into a "high-risk financial asset traded on the stock exchange under the supervision of the Securities and Exchange Commission (SEC)" The funds won’t deliberately drive Bitcoin into collapse, but they’ve made its volatility more confusing and tied it to the madness of the global economy, stripping it of its revolutionary shine as a rebel tool.
$BTC
Because of the impact of institutional flows and ETFs on traditional trading strategies; I don’t think tools like "Fibonacci levels" or moving averages (EMA) can still predict bottoms and tops in the "Wall Street" era. We need to completely reinvent analytical tools

What laws and regulations failed to achieve was accomplished by massive liquidity. Through these funds, Bitcoin has transformed from a "revolutionary tool empowering individuals financially outside the system" into a "high-risk financial asset traded on the stock exchange under the supervision of the Securities and Exchange Commission (SEC)"

The funds won’t deliberately drive Bitcoin into collapse, but they’ve made its volatility more confusing and tied it to the madness of the global economy, stripping it of its revolutionary shine as a rebel tool.
$SOL I expect it to break all of Solana’s resistance levels if Bitcoin recovers 😍
$SOL
I expect it to break all of Solana’s resistance levels if Bitcoin recovers 😍
$BTC June closing will be positive (just optimism)
$BTC
June closing will be positive (just optimism)
met3b
·
--
$DASH

Theoretically, DASH could bounce back to its previous peak around $96, but not in the near term given the current data.

If we calculate from the current price of about $40, reaching $96 means an additional climb of roughly 140%.

What needs to happen to hit $96?

1. Break through $42 and hold above it.
2. Surpass $55 (a strong historical resistance).
3. Break through $68–70 (the weekly super trend and a crucial barrier).
4. The overall crypto market continues on an upward trajectory.

Current likely scenarios

* $45–55: A solid chance if the current momentum persists.
* $68–70: A bit tougher but achievable during a strong bullish cycle.
* $90–100: Typically requires a broad market rally, not just a DASH-specific surge.

Key point

Even if the ultimate target is $96, it’s rare for the coin to move in a straight line. You’ll often see strong corrections at:

* $42
* $50–55
* $68–70

So if you’re a mid-term investor, it’s crucial to monitor these levels instead of fixating directly on $96.

From my current technical perspective:

* Reaching $55 in the coming months looks more realistic than jumping straight to $96.
* For $96, we need additional confirmations, the most important being a breach of the $68–70 zone later on.

$BTC {spot}(BTCUSDT) The price is sitting at a critical pivot zone.. The bullish trading outlook hinges on holding the support level at $59,130 without breaking it; if this level holds along with the current positive MACD crossover, it could push the price to test nearby resistance levels at $63,059 and then $64,272 as a corrective bounce.. On the flip side, any full daily close below the $59,130 level would invalidate the temporary bounce scenario and open the door for further drops towards lower structural and psychological support levels.
$BTC
The price is sitting at a critical pivot zone..

The bullish trading outlook hinges on holding the support level at $59,130 without breaking it; if this level holds along with the current positive MACD crossover, it could push the price to test nearby resistance levels at $63,059 and then $64,272 as a corrective bounce..

On the flip side, any full daily close below the $59,130 level would invalidate the temporary bounce scenario and open the door for further drops towards lower structural and psychological support levels.
$OPG Here lies the crucial point: Positive: * The team has laid out vesting schedules that stretch over years for some allocations, which reduces the immediate market shock. Negative: * As new funds enter the market, the potential sell pressure increases. * Many investors are looking at the difference between the current market cap and FDV to gauge future dilution. Thirdly: What do I like and what concerns me? What I like: * The AI sector is still one of the strongest narratives. * The market cap is still relatively small. * Trading volume is solid compared to the market cap. What concerns me: * The coin is very new. * It hasn't tested a full market cycle yet. * The circulating supply is low compared to the total supply. * It previously reached around $0.48 and then dropped over 60%. My personal estimation: * $0.30 – $0.50: A realistic target if the momentum returns to AI-related coins. * $1: Possible, but it requires the market cap to multiply several times as the project continues to grow. * More than $1 by a lot: Depends on the project's actual success in attracting real use, not just speculation. If you're thinking about trading or investing, the key question now isn't 'Will it reach a dollar?' but rather: When will the next locked quantities be released? Because unlocking schedules often impact the price more than the max supply itself.
$OPG

Here lies the crucial point:

Positive:

* The team has laid out vesting schedules that stretch over years for some allocations, which reduces the immediate market shock.

Negative:

* As new funds enter the market, the potential sell pressure increases.
* Many investors are looking at the difference between the current market cap and FDV to gauge future dilution.

Thirdly: What do I like and what concerns me?

What I like:

* The AI sector is still one of the strongest narratives.
* The market cap is still relatively small.
* Trading volume is solid compared to the market cap.

What concerns me:

* The coin is very new.
* It hasn't tested a full market cycle yet.
* The circulating supply is low compared to the total supply.
* It previously reached around $0.48 and then dropped over 60%.

My personal estimation:

* $0.30 – $0.50: A realistic target if the momentum returns to AI-related coins.
* $1: Possible, but it requires the market cap to multiply several times as the project continues to grow.
* More than $1 by a lot: Depends on the project's actual success in attracting real use, not just speculation.

If you're thinking about trading or investing, the key question now isn't 'Will it reach a dollar?' but rather: When will the next locked quantities be released? Because unlocking schedules often impact the price more than the max supply itself.
$OPG This project revolves around the decentralized AI infrastructure and the verification of AI model execution on the network. It belongs to the "AI Crypto" sector, which tends to attract liquidity when the hype waves for AI return. First: Can it reach $1? Mathematically, yes, but it's not a walk in the park. From the chart: * Current price ≈ $0.165 * Circulating supply ≈ 197 million * Max supply = 1 billion OPG * Current market cap ≈ $32 million * FDV (Fully Diluted Valuation) ≈ $165 million If the coin hits $1: * The market cap for the current supply will be ≈ $197 million * However, if the full billion trades, the market cap will be ≈ $1 billion. This isn't impossible in the crypto space, but it requires: 1. Continued strength in the AI narrative. 2. Actual growth in network usage. 3. Influx of significant liquidity into the project. 4. No strong sell pressure from unlocks. Second: My take on the max supply (1 billion) The figure of 1 billion isn't bad in itself. What's more important is: * How much is trading now? * And how is the rest being released? Currently, only about 19% is circulating of the total supply, meaning over 80% hasn't hit the market yet.
$OPG

This project revolves around the decentralized AI infrastructure and the verification of AI model execution on the network. It belongs to the "AI Crypto" sector, which tends to attract liquidity when the hype waves for AI return.

First: Can it reach $1?

Mathematically, yes, but it's not a walk in the park.

From the chart:

* Current price ≈ $0.165
* Circulating supply ≈ 197 million
* Max supply = 1 billion OPG
* Current market cap ≈ $32 million
* FDV (Fully Diluted Valuation) ≈ $165 million

If the coin hits $1:

* The market cap for the current supply will be ≈ $197 million
* However, if the full billion trades, the market cap will be ≈ $1 billion.

This isn't impossible in the crypto space, but it requires:

1. Continued strength in the AI narrative.
2. Actual growth in network usage.
3. Influx of significant liquidity into the project.
4. No strong sell pressure from unlocks.

Second: My take on the max supply (1 billion)

The figure of 1 billion isn't bad in itself.

What's more important is:

* How much is trading now?
* And how is the rest being released?

Currently, only about 19% is circulating of the total supply, meaning over 80% hasn't hit the market yet.
$BTC Areas directly below the 60,000 mark are prime real estate for gathering stop loss orders for longs, alongside reactive sell stops. A sharp drop below this level is often a tactical move by market makers to liquidate these positions, absorb the supply, and then a quick rebound to close the door behind retail traders.
$BTC

Areas directly below the 60,000 mark are prime real estate for gathering stop loss orders for longs, alongside reactive sell stops. A sharp drop below this level is often a tactical move by market makers to liquidate these positions, absorb the supply, and then a quick rebound to close the door behind retail traders.
$BTC {spot}(BTCUSDT) The $61,775 level is currently the key pivot point. Holding this level prevents the price from slipping to test deeper support or the potential double bottom at $59,100.
$BTC
The $61,775 level is currently the key pivot point. Holding this level prevents the price from slipping to test deeper support or the potential double bottom at $59,100.
$BTC {spot}(BTCUSDT) The price is facing repeated selling pressure as it approaches the $64,500 levels, and a solid breakout above this is the key condition to target the upper range ceiling at $67,500.
$BTC
The price is facing repeated selling pressure as it approaches the $64,500 levels, and a solid breakout above this is the key condition to target the upper range ceiling at $67,500.
$BTC If it fails to break out and starts making lower highs, it's likely to retest lower support zones before any new attempt. Keep an eye on the time closure (especially 1H and 4H).
$BTC

If it fails to break out and starts making lower highs, it's likely to retest lower support zones before any new attempt. Keep an eye on the time closure (especially 1H and 4H).
$RE Since the exclusive activity of the Re project is commercial reinsurance, and since the profits distributed through the ⁠reUSD⁠ token are entirely derived from the premiums of this prohibited insurance; investing in this protocol or providing liquidity to it is not compliant with Islamic law, as it directly engages in the system of excessive uncertainty (gharar) and clear usury (riba).
$RE

Since the exclusive activity of the Re project is commercial reinsurance, and since the profits distributed through the ⁠reUSD⁠ token are entirely derived from the premiums of this prohibited insurance; investing in this protocol or providing liquidity to it is not compliant with Islamic law, as it directly engages in the system of excessive uncertainty (gharar) and clear usury (riba).
Closer to reality and more credible $BTC {spot}(BTCUSDT)
Closer to reality and more credible
$BTC
Mohamed Alamin777
·
--
Bullish
$BTC
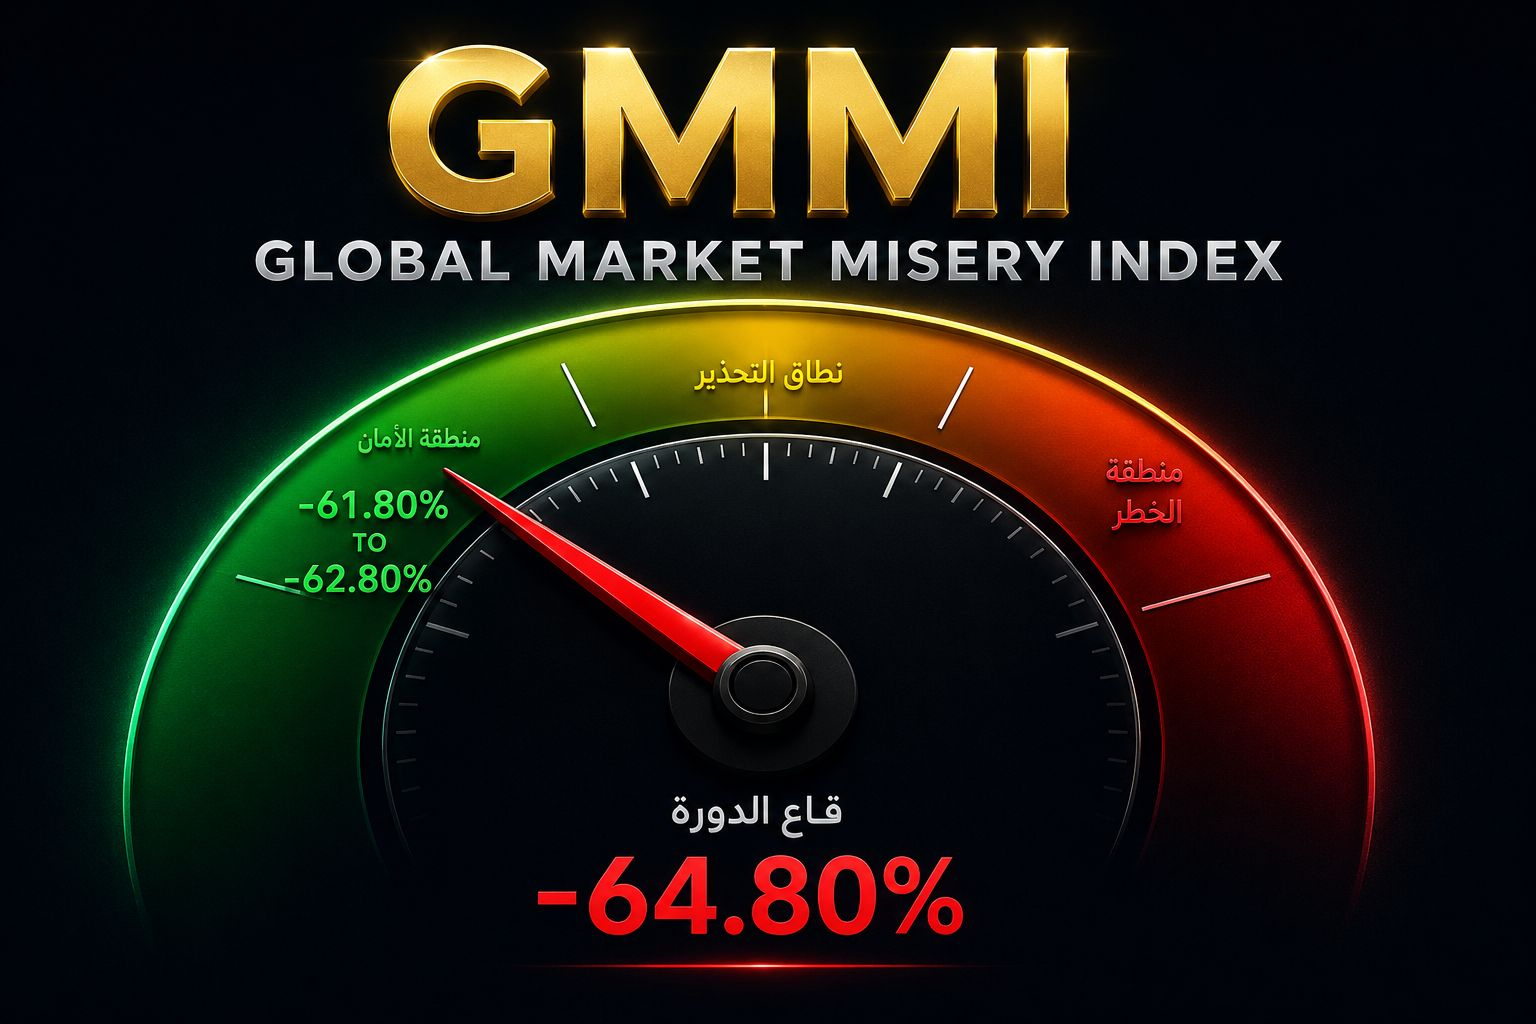
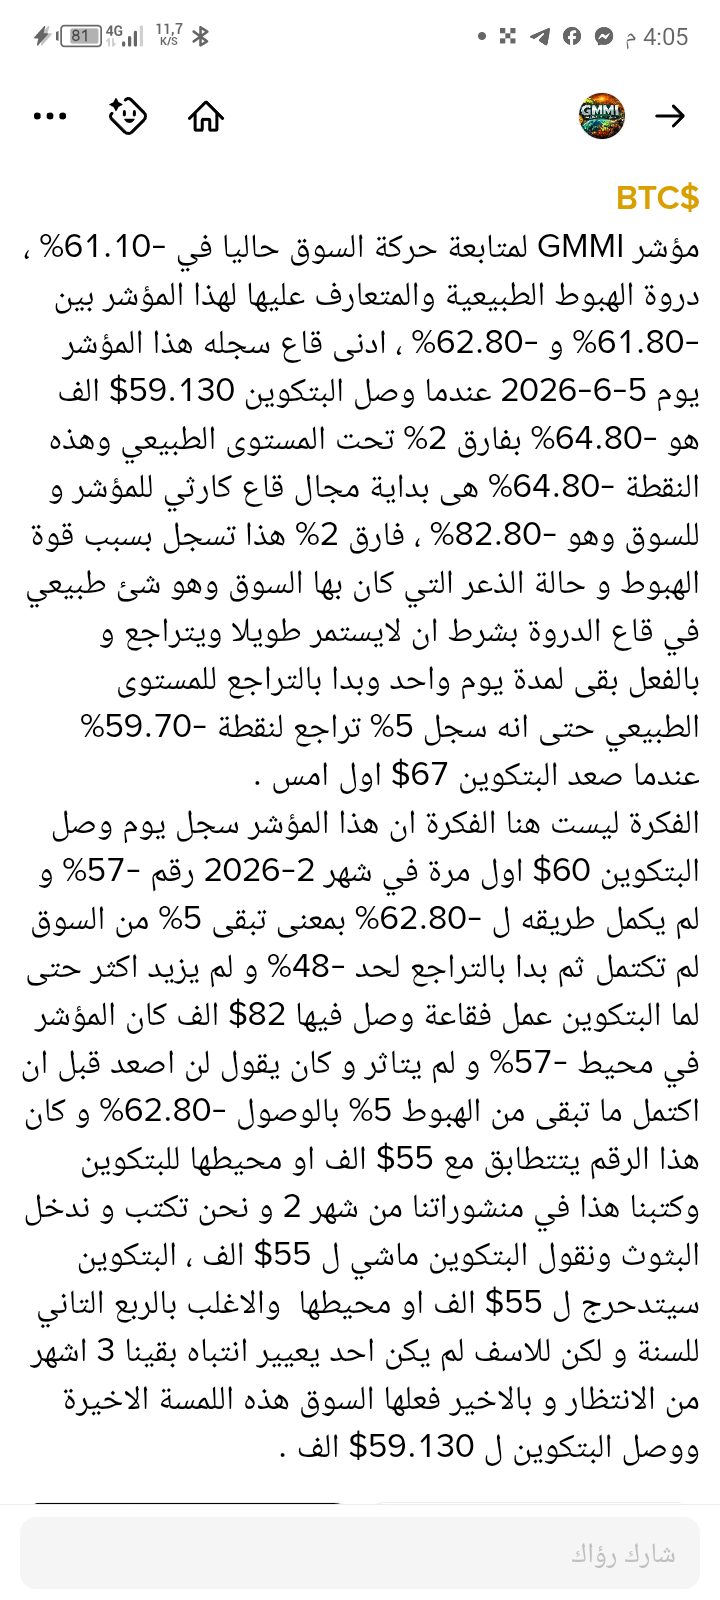
Now every time we hop into streams and chat with analysts, they say the market has completed its drop to -61.80% to -62.80%, which is typical. The total market downtrend will officially end on 5-6-2026, as soon as Bitcoin hits $59k. Once the market index hits -64.80%, just 2% below the level, we can announce the beginning of the upward wave from the start. We say Bitcoin, after the market downturn, should close above $75 in Q2 and then $87, as the market is set to bounce back 22%, followed by a 13% drop. No one should pay attention, with all due respect to the analysts, whether in streams or outside, to their opinions, which mostly suggest that the market is still bearish and will break below $59 to both near and far points unless it bounces back and breaks key resistance levels around $82 and $85. Only then can we confirm the bullish trend, but by that time, those who got in early are already in, and those who hesitated will have missed out. Levels above $80 are considered prime for corrective bounces in a sideways fashion. Therefore, we reiterate that the market has largely completed its drop and is starting to pull back. New bearish scenarios to break below $59, whether to near or far points, are very weak scenarios, even though it's a possibility since a drop within the bottom range of up to 5% is allowed, and we've done 2%. However, it's considered unlikely to repeat twice entering a new bottoming range.
Good luck to everyone
$BTC
$DASH
$DASH
met3b
·
--
$DASH

Theoretically, DASH could bounce back to its previous peak around $96, but not in the near term given the current data.

If we calculate from the current price of about $40, reaching $96 means an additional climb of roughly 140%.

What needs to happen to hit $96?

1. Break through $42 and hold above it.
2. Surpass $55 (a strong historical resistance).
3. Break through $68–70 (the weekly super trend and a crucial barrier).
4. The overall crypto market continues on an upward trajectory.

Current likely scenarios

* $45–55: A solid chance if the current momentum persists.
* $68–70: A bit tougher but achievable during a strong bullish cycle.
* $90–100: Typically requires a broad market rally, not just a DASH-specific surge.

Key point

Even if the ultimate target is $96, it’s rare for the coin to move in a straight line. You’ll often see strong corrections at:

* $42
* $50–55
* $68–70

So if you’re a mid-term investor, it’s crucial to monitor these levels instead of fixating directly on $96.

From my current technical perspective:

* Reaching $55 in the coming months looks more realistic than jumping straight to $96.
* For $96, we need additional confirmations, the most important being a breach of the $68–70 zone later on.
$BTC {spot}(BTCUSDT) Where do I watch for the reversal? I don't just consider hitting the zone a buy signal. I'm looking for: * A clear break of the low. * A long lower wick. * A sudden spike in volume. * Quick reclaim of the broken level. * Formation of a Bullish Market Structure Shift (MSS). Only then is it a signal that liquidity has already been gathered.
$BTC
Where do I watch for the reversal?

I don't just consider hitting the zone a buy signal.

I'm looking for:

* A clear break of the low.
* A long lower wick.
* A sudden spike in volume.
* Quick reclaim of the broken level.
* Formation of a Bullish Market Structure Shift (MSS).

Only then is it a signal that liquidity has already been gathered.
$BTC The nearest visible sell liquidity pool is at 63,100, then 61,400. The biggest liquidity reservoir on the current chart is just below 60,755, which is the level that algorithms might target if they want to execute a wide liquidation before a stronger bullish wave. {spot}(BTCUSDT)
$BTC
The nearest visible sell liquidity pool is at 63,100, then 61,400. The biggest liquidity reservoir on the current chart is just below 60,755, which is the level that algorithms might target if they want to execute a wide liquidation before a stronger bullish wave.
Log in to explore more content
Join global crypto users on Binance Square
⚡️ Get latest and useful information about crypto.
💬 Trusted by the world’s largest crypto exchange.
👍 Discover real insights from verified creators.
Email / Phone number
Sitemap
Cookie Preferences
Platform T&Cs