

VestorGo 2027
1.2k Posts

VestorGo 2027
Report
Block User
نضع بين يديك الجيل القادم من حلول الاستثمار الذكي؛ منصة تداول متكاملة تجمع بين السرعة الفائقة في التنفيذ، والتحليلات المدعومة بالذكاء الاصطناعي
Open Trade
High-Frequency Trader
2.9 Years
49 Following
957 Followers
2.1K+ Liked
Posts
Portfolio
All
Quotes
Videos
$LAZIO 24 hours: Low $0.38 - High $0.532 (+40% between them)
- 24h volume: $23.8M (+2,470% explosion!) But real liquidity is weak, just $97K
*Your analysis:*
*Positive:*
- You bought below the average and are currently in profit
- Volume exploded — meaning someone may be accumulating
- Lazio is playing well this season; Fan Tokens tend to fly when the team wins
*Negative (be careful):*
- ATH was $26.75; you're down 98% — the coin is practically dead
- Ranked #1708, market cap only $5M–$6M — extremely high risk
- No use case other than voting
- The price could quickly return to $0.38 if the fake volume dries up
*Plan at $0.464:*
1. *Sell half your holdings now* at $0.48 - $0.50 (recover your capital + a small profit)
2. *Hold the other half* with a target of $0.532 (today's high)
3. *Set a stop-loss* for the other half at $0.44 (your entry price)
*If you haven't bought yet:*
Wait for $0.40 - $0.42; don't buy at $0.48 — you're at the daily high.
- Above *MA60 at 0.458*, the uptrend is holding on the 1H chart
- Historical support: 0.435 / historical resistance: 0.485 and 0.520
- *RSI 56:* neutral-to-bullish, with room to go before reaching 70
- *MACD:* bullish crossover and histogram at +0.0007
- Volume at 2.14M, with a high-volume candle at the end — buying interest in the simulation
$LAZIO
{spot}(LAZIOUSDT)
$LAZIO 24 hours: Low $0.38 - High $0.532 (+40% between them)
- 24h volume: $23.8M (+2,470% explosion!) But real liquidity is weak, just $97K
*Your analysis:*
*Positive:*
- You bought below the average and are currently in profit
- Volume exploded — meaning someone may be accumulating
- Lazio is playing well this season; Fan Tokens tend to fly when the team wins
*Negative (be careful):*
- ATH was $26.75; you're down 98% — the coin is practically dead
- Ranked #1708, market cap only $5M–$6M — extremely high risk
- No use case other than voting
- The price could quickly return to $0.38 if the fake volume dries up
*Plan at $0.464:*
1. *Sell half your holdings now* at $0.48 - $0.50 (recover your capital + a small profit)
2. *Hold the other half* with a target of $0.532 (today's high)
3. *Set a stop-loss* for the other half at $0.44 (your entry price)
*If you haven't bought yet:*
Wait for $0.40 - $0.42; don't buy at $0.48 — you're at the daily high.
- Above *MA60 at 0.458*, the uptrend is holding on the 1H chart
- Historical support: 0.435 / historical resistance: 0.485 and 0.520
- *RSI 56:* neutral-to-bullish, with room to go before reaching 70
- *MACD:* bullish crossover and histogram at +0.0007
- Volume at 2.14M, with a high-volume candle at the end — buying interest in the simulation
$LAZIO
- 24h volume: $23.8M (+2,470% explosion!) But real liquidity is weak, just $97K
*Your analysis:*
*Positive:*
- You bought below the average and are currently in profit
- Volume exploded — meaning someone may be accumulating
- Lazio is playing well this season; Fan Tokens tend to fly when the team wins
*Negative (be careful):*
- ATH was $26.75; you're down 98% — the coin is practically dead
- Ranked #1708, market cap only $5M–$6M — extremely high risk
- No use case other than voting
- The price could quickly return to $0.38 if the fake volume dries up
*Plan at $0.464:*
1. *Sell half your holdings now* at $0.48 - $0.50 (recover your capital + a small profit)
2. *Hold the other half* with a target of $0.532 (today's high)
3. *Set a stop-loss* for the other half at $0.44 (your entry price)
*If you haven't bought yet:*
Wait for $0.40 - $0.42; don't buy at $0.48 — you're at the daily high.
- Above *MA60 at 0.458*, the uptrend is holding on the 1H chart
- Historical support: 0.435 / historical resistance: 0.485 and 0.520
- *RSI 56:* neutral-to-bullish, with room to go before reaching 70
- *MACD:* bullish crossover and histogram at +0.0007
- Volume at 2.14M, with a high-volume candle at the end — buying interest in the simulation
$LAZIO
1
67
MINA at $0.0975 - this is a bottom opportunity
*Current price:*
- $0.0993 (today) - $0.11997 - $0.1077
- 24 hours: -23.37% to -28% (today’s crash!)
- 7 days: -31% (the biggest loss among the coins you asked about)
- 30 days: still +32% - +48%
- 3 months: +146% - +167% (it was $0.04)
- 1 year: -26% to -35% (still down for the year)
- Market cap: $123M - $127M, rank #178
- Volume: $52M - $100M
- Supply: 1.28B MINA (high inflation)
- ATH: $9.60 (May 2021) - down 98.88%!
*Why is it crashing now?*
The whole market is selling older ZK coins after ZEC took off - investors are moving from MINA to ZEC. There’s no direct negative news.
*Why does MINA matter?*
- The lightest blockchain in the world - just 22KB (the entire blockchain)
- It specializes in ZK proofs - the same technology as ZEC, but as a Layer 1
- It was supposed to be the biggest beneficiary of the privacy trend, but the market chose ZEC
*Analysis:*
- $0.0975 is very close to the yearly low
- Strong support at $0.09 - $0.10
- If it breaks $0.15 again, target $0.18 - $0.20 quickly
- October 9 forecast: $0.14 (+6.5%)
- Fear & Greed 73 (greed) - people are afraid to buy
*Plan for MINA:*
This is the *best time to buy* out of all the coins you asked about:
1. *Buy now: 50%* at $0.0975 - $0.10
2. *Second buy: 50%* if it drops to $0.08
3. *Stop loss:* $0.06 (June 2026 low)
4. *Targets:*
- Target 1: $0.14 = +43%
- Target 2: $0.20 = +105%
- Target 3: $0.40 = +310%
Excellent risk/reward - 30% downside versus 300% upside.
$MINA
{future}(MINAUSDT)
MINA at $0.0975 - this is a bottom opportunity
*Current price:*
- $0.0993 (today) - $0.11997 - $0.1077
- 24 hours: -23.37% to -28% (today’s crash!)
- 7 days: -31% (the biggest loss among the coins you asked about)
- 30 days: still +32% - +48%
- 3 months: +146% - +167% (it was $0.04)
- 1 year: -26% to -35% (still down for the year)
- Market cap: $123M - $127M, rank #178
- Volume: $52M - $100M
- Supply: 1.28B MINA (high inflation)
- ATH: $9.60 (May 2021) - down 98.88%!
*Why is it crashing now?*
The whole market is selling older ZK coins after ZEC took off - investors are moving from MINA to ZEC. There’s no direct negative news.
*Why does MINA matter?*
- The lightest blockchain in the world - just 22KB (the entire blockchain)
- It specializes in ZK proofs - the same technology as ZEC, but as a Layer 1
- It was supposed to be the biggest beneficiary of the privacy trend, but the market chose ZEC
*Analysis:*
- $0.0975 is very close to the yearly low
- Strong support at $0.09 - $0.10
- If it breaks $0.15 again, target $0.18 - $0.20 quickly
- October 9 forecast: $0.14 (+6.5%)
- Fear & Greed 73 (greed) - people are afraid to buy
*Plan for MINA:*
This is the *best time to buy* out of all the coins you asked about:
1. *Buy now: 50%* at $0.0975 - $0.10
2. *Second buy: 50%* if it drops to $0.08
3. *Stop loss:* $0.06 (June 2026 low)
4. *Targets:*
- Target 1: $0.14 = +43%
- Target 2: $0.20 = +105%
- Target 3: $0.40 = +310%
Excellent risk/reward - 30% downside versus 300% upside.
$MINA
*Current price:*
- $0.0993 (today) - $0.11997 - $0.1077
- 24 hours: -23.37% to -28% (today’s crash!)
- 7 days: -31% (the biggest loss among the coins you asked about)
- 30 days: still +32% - +48%
- 3 months: +146% - +167% (it was $0.04)
- 1 year: -26% to -35% (still down for the year)
- Market cap: $123M - $127M, rank #178
- Volume: $52M - $100M
- Supply: 1.28B MINA (high inflation)
- ATH: $9.60 (May 2021) - down 98.88%!
*Why is it crashing now?*
The whole market is selling older ZK coins after ZEC took off - investors are moving from MINA to ZEC. There’s no direct negative news.
*Why does MINA matter?*
- The lightest blockchain in the world - just 22KB (the entire blockchain)
- It specializes in ZK proofs - the same technology as ZEC, but as a Layer 1
- It was supposed to be the biggest beneficiary of the privacy trend, but the market chose ZEC
*Analysis:*
- $0.0975 is very close to the yearly low
- Strong support at $0.09 - $0.10
- If it breaks $0.15 again, target $0.18 - $0.20 quickly
- October 9 forecast: $0.14 (+6.5%)
- Fear & Greed 73 (greed) - people are afraid to buy
*Plan for MINA:*
This is the *best time to buy* out of all the coins you asked about:
1. *Buy now: 50%* at $0.0975 - $0.10
2. *Second buy: 50%* if it drops to $0.08
3. *Stop loss:* $0.06 (June 2026 low)
4. *Targets:*
- Target 1: $0.14 = +43%
- Target 2: $0.20 = +105%
- Target 3: $0.40 = +310%
Excellent risk/reward - 30% downside versus 300% upside.
$MINA
1
72
GTC at $0.20093 — you're holding it at the top of the pump
*Current price:*
- $0.19–$0.20; it reached a high of $0.211 yesterday
- 24 hours: -8.14% (dropping now), but 14 days: +109%
- October alone: +80.4%; September: +28.3%
- Market cap: $19M–$20M, rank #1198 (a very small-cap coin)
- Volume: $25M–$92M (4x the market cap!) — insane speculation
- Supply: 87.5M out of 100M
- ATH: $22.37 (November 2021) — down 99% from its peak!
*Why did it take off?*
- Weak trend, no major news — just a speculative pump on Binance and Bithumb (Korean traders are piling in)
- Gitcoin itself is a project that funds open-source projects, not a trending coin
- RSI 62, neutral; above SMA-50 ($0.091) and SMA-200 ($0.085) — meaning the move is technical
*Technical analysis:*
- It broke a strong uptrend and is now at the upper end of the trend — a sell signal for traders
- 3-month forecast: $0.104–$0.262 (it could reach $0.262 if it breaks $0.211)
- Support: $0.147–$0.188 (if it breaks below that, it could fall to $0.13)
- Resistance: $0.211 (it needs to break through to keep going)
*What should you do at $0.20093?*
This isn't the time to buy; it's time to *sell*:
- If you bought below $0.10: sell 70% now and keep 30% with a stop below $0.18
- If you want to buy: wait for $0.14–$0.15 (November 6 forecast: $0.138)
- GTC is very high risk — 30% volatility; a small-cap coin could disappear
*Compared with RLC:*
RLC is much better — larger market cap, an AI trend, and stable volume. GTC's Korean pump could be over tomorrow.
$GTC
{future}(GTCUSDT)
GTC at $0.20093 — you're holding it at the top of the pump
*Current price:*
- $0.19–$0.20; it reached a high of $0.211 yesterday
- 24 hours: -8.14% (dropping now), but 14 days: +109%
- October alone: +80.4%; September: +28.3%
- Market cap: $19M–$20M, rank #1198 (a very small-cap coin)
- Volume: $25M–$92M (4x the market cap!) — insane speculation
- Supply: 87.5M out of 100M
- ATH: $22.37 (November 2021) — down 99% from its peak!
*Why did it take off?*
- Weak trend, no major news — just a speculative pump on Binance and Bithumb (Korean traders are piling in)
- Gitcoin itself is a project that funds open-source projects, not a trending coin
- RSI 62, neutral; above SMA-50 ($0.091) and SMA-200 ($0.085) — meaning the move is technical
*Technical analysis:*
- It broke a strong uptrend and is now at the upper end of the trend — a sell signal for traders
- 3-month forecast: $0.104–$0.262 (it could reach $0.262 if it breaks $0.211)
- Support: $0.147–$0.188 (if it breaks below that, it could fall to $0.13)
- Resistance: $0.211 (it needs to break through to keep going)
*What should you do at $0.20093?*
This isn't the time to buy; it's time to *sell*:
- If you bought below $0.10: sell 70% now and keep 30% with a stop below $0.18
- If you want to buy: wait for $0.14–$0.15 (November 6 forecast: $0.138)
- GTC is very high risk — 30% volatility; a small-cap coin could disappear
*Compared with RLC:*
RLC is much better — larger market cap, an AI trend, and stable volume. GTC's Korean pump could be over tomorrow.
$GTC
*Current price:*
- $0.19–$0.20; it reached a high of $0.211 yesterday
- 24 hours: -8.14% (dropping now), but 14 days: +109%
- October alone: +80.4%; September: +28.3%
- Market cap: $19M–$20M, rank #1198 (a very small-cap coin)
- Volume: $25M–$92M (4x the market cap!) — insane speculation
- Supply: 87.5M out of 100M
- ATH: $22.37 (November 2021) — down 99% from its peak!
*Why did it take off?*
- Weak trend, no major news — just a speculative pump on Binance and Bithumb (Korean traders are piling in)
- Gitcoin itself is a project that funds open-source projects, not a trending coin
- RSI 62, neutral; above SMA-50 ($0.091) and SMA-200 ($0.085) — meaning the move is technical
*Technical analysis:*
- It broke a strong uptrend and is now at the upper end of the trend — a sell signal for traders
- 3-month forecast: $0.104–$0.262 (it could reach $0.262 if it breaks $0.211)
- Support: $0.147–$0.188 (if it breaks below that, it could fall to $0.13)
- Resistance: $0.211 (it needs to break through to keep going)
*What should you do at $0.20093?*
This isn't the time to buy; it's time to *sell*:
- If you bought below $0.10: sell 70% now and keep 30% with a stop below $0.18
- If you want to buy: wait for $0.14–$0.15 (November 6 forecast: $0.138)
- GTC is very high risk — 30% volatility; a small-cap coin could disappear
*Compared with RLC:*
RLC is much better — larger market cap, an AI trend, and stable volume. GTC's Korean pump could be over tomorrow.
$GTC
1
99
$RLC at $0.8789 — it's pumping right now!
*Real-time price:*
- You're holding near the high: today's high is $1.077, low is $0.524, current price is $0.8753
- Up +59.23% today alone, with $303M in volume (384% of market cap!) — that's insane speculation
- But YTD: -44%, one year: -67%, meaning it was dead before this pump
- 5 days: +1.95%, one month: +16.52%
*Why is it going up?*
RLC is the iExec (AI + DePIN) coin — volume suddenly exploded on Binance/BTCC. This is probably a speculative pump, not driven by major news.
*Forecasts:*
- Tomorrow's forecast: $0.429–$0.502 (expected drop of 12%) — meaning it will correct
- End of 2026: $1.02
- In one year: $0.878 (exactly the same as your current price)
- Technical analysis: RSI 19.28 (deeply oversold), below the weekly EMA-200 but above the daily EMA-50, MACD bullish — a rebound is possible, but confidence is low
*What should we do?*
At $0.8789, you're at risk:
- If you bought today: sell quickly; this is a pump and it could fall back to $0.60–$0.65 within two days, according to the models
- Stop-loss below $0.80
- Target if it keeps rising: $1.02
$RLC
{future}(RLCUSDT)
$RLC at $0.8789 — it's pumping right now!
*Real-time price:*
- You're holding near the high: today's high is $1.077, low is $0.524, current price is $0.8753
- Up +59.23% today alone, with $303M in volume (384% of market cap!) — that's insane speculation
- But YTD: -44%, one year: -67%, meaning it was dead before this pump
- 5 days: +1.95%, one month: +16.52%
*Why is it going up?*
RLC is the iExec (AI + DePIN) coin — volume suddenly exploded on Binance/BTCC. This is probably a speculative pump, not driven by major news.
*Forecasts:*
- Tomorrow's forecast: $0.429–$0.502 (expected drop of 12%) — meaning it will correct
- End of 2026: $1.02
- In one year: $0.878 (exactly the same as your current price)
- Technical analysis: RSI 19.28 (deeply oversold), below the weekly EMA-200 but above the daily EMA-50, MACD bullish — a rebound is possible, but confidence is low
*What should we do?*
At $0.8789, you're at risk:
- If you bought today: sell quickly; this is a pump and it could fall back to $0.60–$0.65 within two days, according to the models
- Stop-loss below $0.80
- Target if it keeps rising: $1.02
$RLC
*Real-time price:*
- You're holding near the high: today's high is $1.077, low is $0.524, current price is $0.8753
- Up +59.23% today alone, with $303M in volume (384% of market cap!) — that's insane speculation
- But YTD: -44%, one year: -67%, meaning it was dead before this pump
- 5 days: +1.95%, one month: +16.52%
*Why is it going up?*
RLC is the iExec (AI + DePIN) coin — volume suddenly exploded on Binance/BTCC. This is probably a speculative pump, not driven by major news.
*Forecasts:*
- Tomorrow's forecast: $0.429–$0.502 (expected drop of 12%) — meaning it will correct
- End of 2026: $1.02
- In one year: $0.878 (exactly the same as your current price)
- Technical analysis: RSI 19.28 (deeply oversold), below the weekly EMA-200 but above the daily EMA-50, MACD bullish — a rebound is possible, but confidence is low
*What should we do?*
At $0.8789, you're at risk:
- If you bought today: sell quickly; this is a pump and it could fall back to $0.60–$0.65 within two days, according to the models
- Stop-loss below $0.80
- Target if it keeps rising: $1.02
$RLC
1
85
$DASH at $57.02 — you’re doing it right.
*Current situation:*
- Price: $57.09–$60.31, market cap $775M, rank #75
- Last 3 months: +70.83% (a strong climb from $33 to $60)
- Last 7 days: -7.55%; last 24 hours: -3.85% — a correction after a strong rally
- Last month: -10.73% (down $6.47)
*Technical analysis for today, October 5:*
- Broke out of an ascending channel and is sitting at the SMA-50 resistance at $60.00
- First support: $57.00 (you’re at it); if it breaks, it could drop to $56.85, then $49.25
- Market regime: Bear + Range chop; model confidence is only 38/100
*October 2026 forecast:*
- Changelly: average $62.57 ($60.33–$64.81) = +9.1%
- CoinCodex: $62.81 (+5%)
- November: $58.19
- Central model forecast for the next 13 days: $57.10 (-4.69%)
*Why DASH rose recently:*
A privacy coin rally — ZEC surged +584% and pulled DASH up +165% in September, following US approval of an ETF for privacy coins.
*What should you do at $57.02?*
If you bought earlier: take 50% profit at $62–$64 and let the rest ride.
If you’re thinking of buying: wait for it to hold above $60.00, or buy in batches if it drops to $56.85.
$DASH
{future}(DASHUSDT)
$DASH at $57.02 — you’re doing it right.
*Current situation:*
- Price: $57.09–$60.31, market cap $775M, rank #75
- Last 3 months: +70.83% (a strong climb from $33 to $60)
- Last 7 days: -7.55%; last 24 hours: -3.85% — a correction after a strong rally
- Last month: -10.73% (down $6.47)
*Technical analysis for today, October 5:*
- Broke out of an ascending channel and is sitting at the SMA-50 resistance at $60.00
- First support: $57.00 (you’re at it); if it breaks, it could drop to $56.85, then $49.25
- Market regime: Bear + Range chop; model confidence is only 38/100
*October 2026 forecast:*
- Changelly: average $62.57 ($60.33–$64.81) = +9.1%
- CoinCodex: $62.81 (+5%)
- November: $58.19
- Central model forecast for the next 13 days: $57.10 (-4.69%)
*Why DASH rose recently:*
A privacy coin rally — ZEC surged +584% and pulled DASH up +165% in September, following US approval of an ETF for privacy coins.
*What should you do at $57.02?*
If you bought earlier: take 50% profit at $62–$64 and let the rest ride.
If you’re thinking of buying: wait for it to hold above $60.00, or buy in batches if it drops to $56.85.
$DASH
*Current situation:*
- Price: $57.09–$60.31, market cap $775M, rank #75
- Last 3 months: +70.83% (a strong climb from $33 to $60)
- Last 7 days: -7.55%; last 24 hours: -3.85% — a correction after a strong rally
- Last month: -10.73% (down $6.47)
*Technical analysis for today, October 5:*
- Broke out of an ascending channel and is sitting at the SMA-50 resistance at $60.00
- First support: $57.00 (you’re at it); if it breaks, it could drop to $56.85, then $49.25
- Market regime: Bear + Range chop; model confidence is only 38/100
*October 2026 forecast:*
- Changelly: average $62.57 ($60.33–$64.81) = +9.1%
- CoinCodex: $62.81 (+5%)
- November: $58.19
- Central model forecast for the next 13 days: $57.10 (-4.69%)
*Why DASH rose recently:*
A privacy coin rally — ZEC surged +584% and pulled DASH up +165% in September, following US approval of an ETF for privacy coins.
*What should you do at $57.02?*
If you bought earlier: take 50% profit at $62–$64 and let the rest ride.
If you’re thinking of buying: wait for it to hold above $60.00, or buy in batches if it drops to $56.85.
$DASH
1
114
FIL at $1.05 right now taking the same beauty$FIL
- *Current price:* $1.049 - $1.06
- *Last month:* +37% from $0.68 to $1.04, after it dropped -55% over the year
- *October performance:* +1.26% so far, after a strong September +51.96% de514e25
*Why is it rising?*
Main reason: the vesting program ends on *October 15, 2026*, and it will reduce the issuance of new tokens by 75%. That means an upcoming supply shock. d41b
Technically right now:
- Above the moving averages MA-20 ($0.99), MA-50 ($0.97), and MA-200 ($0.84) = bullish
- Near-term resistance $1.03 - $1.06; if it breaks with volume, the target is $1.12 - $1.21
- RSI 68.9 indicates it’s entering overbought territory c363
A reasonable stop-loss is $0.94 (expected October support). First target $1.22, second target $1.59 (this year’s high). 80eb
$FIL
{future}(FILUSDT)
*A smarter entry plan:*
- *First entry 30%:* if it drops to $0.95 - $0.98 (natural correction)
- *Second entry 40%:* after October 15 if it holds above $1.00 with volume
- *Stop-loss:* daily close below $0.89
- *Targets:* $1.21 / $1.59 / $2.15
#EthereumValidatorExitQueueJumps392% #GreekPoliceBustCryptoScamRingArrest17 #Write2Earn! #CryptoTrends2024 #FIL🧿
FIL at $1.05 right now taking the same beauty$FIL
- *Current price:* $1.049 - $1.06
- *Last month:* +37% from $0.68 to $1.04, after it dropped -55% over the year
- *October performance:* +1.26% so far, after a strong September +51.96% de514e25
*Why is it rising?*
Main reason: the vesting program ends on *October 15, 2026*, and it will reduce the issuance of new tokens by 75%. That means an upcoming supply shock. d41b
Technically right now:
- Above the moving averages MA-20 ($0.99), MA-50 ($0.97), and MA-200 ($0.84) = bullish
- Near-term resistance $1.03 - $1.06; if it breaks with volume, the target is $1.12 - $1.21
- RSI 68.9 indicates it’s entering overbought territory c363
A reasonable stop-loss is $0.94 (expected October support). First target $1.22, second target $1.59 (this year’s high). 80eb
$FIL
*A smarter entry plan:*
- *First entry 30%:* if it drops to $0.95 - $0.98 (natural correction)
- *Second entry 40%:* after October 15 if it holds above $1.00 with volume
- *Stop-loss:* daily close below $0.89
- *Targets:* $1.21 / $1.59 / $2.15
#EthereumValidatorExitQueueJumps392% #GreekPoliceBustCryptoScamRingArrest17 #Write2Earn! #CryptoTrends2024 #FIL🧿
- *Current price:* $1.049 - $1.06
- *Last month:* +37% from $0.68 to $1.04, after it dropped -55% over the year
- *October performance:* +1.26% so far, after a strong September +51.96% de514e25
*Why is it rising?*
Main reason: the vesting program ends on *October 15, 2026*, and it will reduce the issuance of new tokens by 75%. That means an upcoming supply shock. d41b
Technically right now:
- Above the moving averages MA-20 ($0.99), MA-50 ($0.97), and MA-200 ($0.84) = bullish
- Near-term resistance $1.03 - $1.06; if it breaks with volume, the target is $1.12 - $1.21
- RSI 68.9 indicates it’s entering overbought territory c363
A reasonable stop-loss is $0.94 (expected October support). First target $1.22, second target $1.59 (this year’s high). 80eb
$FIL
*A smarter entry plan:*
- *First entry 30%:* if it drops to $0.95 - $0.98 (natural correction)
- *Second entry 40%:* after October 15 if it holds above $1.00 with volume
- *Stop-loss:* daily close below $0.89
- *Targets:* $1.21 / $1.59 / $2.15
#EthereumValidatorExitQueueJumps392% #GreekPoliceBustCryptoScamRingArrest17 #Write2Earn! #CryptoTrends2024 #FIL🧿
1
104

Article
The $100 dream for XRP isn’t impossible, but it needs a math and regulatory miracle together 🔥🔥*1. Current situation:*
Today, XRP’s price is about $1.50, with a market cap of ~ $170 billion. For it to reach $100, the market cap must reach *$5.3 trillion* (100B tokens). That means it’s bigger than Apple + Bitcoin combined. That’s extremely hard at today’s price.
*2. The 5 conditions you must meet:*
*A. The final legal solution with the SEC*
Ripple won a large part of the case in 2023-2025, but it’s necessary to have complete clarity that XRP is not a security in the United States. This will open the door to an immediate XRP ETF like BTC and ETH.
The $100 dream for XRP isn’t impossible, but it needs a math and regulatory miracle together 🔥🔥
*1. Current situation:*
Today, XRP’s price is about $1.50, with a market cap of ~ $170 billion. For it to reach $100, the market cap must reach *$5.3 trillion* (100B tokens). That means it’s bigger than Apple + Bitcoin combined. That’s extremely hard at today’s price.
*2. The 5 conditions you must meet:*
*A. The final legal solution with the SEC*
Ripple won a large part of the case in 2023-2025, but it’s necessary to have complete clarity that XRP is not a security in the United States. This will open the door to an immediate XRP ETF like BTC and ETH.
Today, XRP’s price is about $1.50, with a market cap of ~ $170 billion. For it to reach $100, the market cap must reach *$5.3 trillion* (100B tokens). That means it’s bigger than Apple + Bitcoin combined. That’s extremely hard at today’s price.
*2. The 5 conditions you must meet:*
*A. The final legal solution with the SEC*
Ripple won a large part of the case in 2023-2025, but it’s necessary to have complete clarity that XRP is not a security in the United States. This will open the door to an immediate XRP ETF like BTC and ETH.
1
112
*GTC / Gitcoin at $0.15065* - Governance token for the Developer Funding platform$GTC
Performance
- 2026: -4.9% YTD, but the last two months exploded: +28.3% in September, +19.7% in October, +37.59% in two weeks
- Yesterday: fell -12.39% from $0.132 to $0.115 with a drop in volume (good sign that it’s a correction, not a strong sell-off)
Technical analysis at $0.15065
- *Trend:* very strong and broad bullish trend in the short term
- *3-month outlook:* up +22.39% with a 90% chance it stays between $0.0980 and $0.181
- *Support and resistance:*
- Support: $0.114 (yesterday’s low), then $0.098 then $0.08
- Resistance: $0.13 then $0.15065 (the one you’re asking about) then $0.18 (this week’s high) then $0.181
If the price really reaches $0.15065, that would be breaking a strong weekly resistance and could open the way to $0.18
Conclusion
$0.15065 is a dangerous resistance zone.
If you bought from below ($0.07-$0.09): take profit at $0.15 and keep a portion
If you want to enter at $0.15: extremely high risk—the coin is up 100% from the bottom and its volume is higher than its market cap (whale speculation). Wait for a correction to $0.115-$0.12 with a stop below $0.098
The project itself is strong (Open Source funding), but the token is down 99% and the market cap is $12M, meaning Small Cap
$GTC
{future}(GTCUSDT)
#EthereumValidatorExitQueueJumps392% #SECHaltsCryptoETFReviewsAmidFundingLapse #GreekPoliceBustCryptoScamRingArrest17
*GTC / Gitcoin at $0.15065* - Governance token for the Developer Funding platform$GTC
Performance
- 2026: -4.9% YTD, but the last two months exploded: +28.3% in September, +19.7% in October, +37.59% in two weeks
- Yesterday: fell -12.39% from $0.132 to $0.115 with a drop in volume (good sign that it’s a correction, not a strong sell-off)
Technical analysis at $0.15065
- *Trend:* very strong and broad bullish trend in the short term
- *3-month outlook:* up +22.39% with a 90% chance it stays between $0.0980 and $0.181
- *Support and resistance:*
- Support: $0.114 (yesterday’s low), then $0.098 then $0.08
- Resistance: $0.13 then $0.15065 (the one you’re asking about) then $0.18 (this week’s high) then $0.181
If the price really reaches $0.15065, that would be breaking a strong weekly resistance and could open the way to $0.18
Conclusion
$0.15065 is a dangerous resistance zone.
If you bought from below ($0.07-$0.09): take profit at $0.15 and keep a portion
If you want to enter at $0.15: extremely high risk—the coin is up 100% from the bottom and its volume is higher than its market cap (whale speculation). Wait for a correction to $0.115-$0.12 with a stop below $0.098
The project itself is strong (Open Source funding), but the token is down 99% and the market cap is $12M, meaning Small Cap
$GTC
#EthereumValidatorExitQueueJumps392% #SECHaltsCryptoETFReviewsAmidFundingLapse #GreekPoliceBustCryptoScamRingArrest17
Performance
- 2026: -4.9% YTD, but the last two months exploded: +28.3% in September, +19.7% in October, +37.59% in two weeks
- Yesterday: fell -12.39% from $0.132 to $0.115 with a drop in volume (good sign that it’s a correction, not a strong sell-off)
Technical analysis at $0.15065
- *Trend:* very strong and broad bullish trend in the short term
- *3-month outlook:* up +22.39% with a 90% chance it stays between $0.0980 and $0.181
- *Support and resistance:*
- Support: $0.114 (yesterday’s low), then $0.098 then $0.08
- Resistance: $0.13 then $0.15065 (the one you’re asking about) then $0.18 (this week’s high) then $0.181
If the price really reaches $0.15065, that would be breaking a strong weekly resistance and could open the way to $0.18
Conclusion
$0.15065 is a dangerous resistance zone.
If you bought from below ($0.07-$0.09): take profit at $0.15 and keep a portion
If you want to enter at $0.15: extremely high risk—the coin is up 100% from the bottom and its volume is higher than its market cap (whale speculation). Wait for a correction to $0.115-$0.12 with a stop below $0.098
The project itself is strong (Open Source funding), but the token is down 99% and the market cap is $12M, meaning Small Cap
$GTC
#EthereumValidatorExitQueueJumps392% #SECHaltsCryptoETFReviewsAmidFundingLapse #GreekPoliceBustCryptoScamRingArrest17
1
98


Binance Square Official
·
--
Introducing a new layer of intelligence for everything finance.
Join the Binance Intelligence launch livestream for an early look at what we've been building.
🗓 Oct 5 | 12:00 UTC
📍 Binance Square Official
Repost this post and tag @Binance Square Official to share your vision for Binance Intelligence for a chance to be one of 5 winners selected for a 20 USDC reward.
Join the Binance Intelligence launch livestream for an early look at what we've been building.
🗓 Oct 5 | 12:00 UTC
📍 Binance Square Official
Repost this post and tag @Binance Square Official to share your vision for Binance Intelligence for a chance to be one of 5 winners selected for a 20 USDC reward.
1
33
Technical analysis at $0.7146 $ASTER
*Currently in Consolidation:*
- *Support and resistance:*
- Strong support: $0.69 - $0.66 (if it breaks, it will drop to $0.60)
- Resistance: $0.72 - $0.74 then $0.78 (if it breaks through, it will open $0.82 - $0.85)
- You are exactly at $0.7146, meaning between support and resistance
- *Indicators:*
- Neutral score 42/100 - Neutral
- Short-term outlook: average $0.7482 in a month (+5.14%) range $0.6674 - $0.8291
- 7-day forecast: $0.7500 (+5%)
- Year forecast: average $1.1132 (+56%) range $0.94 - $1.28
- *Tokenomics:* Upcoming unlocks you need to track, but the team postponed some of the unlocks to 2027, and that’s positive
Summary at $0.7146
An excellent accumulation zone if you believe in the project.
- *Speculation:* enter at $0.71 with a stop loss at $0.66 (7% loss) and a target at $0.78 (9%), then $0.8291 (16%) — Risk/Reward is good
- *Investment:* $0.7146 is a good price for accumulation, a 1-year target of $1.11. But be careful: the new coin since September 2025 is still down from its ATH
$ASTER
{future}(ASTERUSDT)
#op🔥🔥 #USDTfree #SECHaltsCryptoETFReviewsAmidFundingLapse #Write2Earn #Crypto_Jobs🎯
$BANK
Technical analysis at $0.7146 $ASTER
*Currently in Consolidation:*
- *Support and resistance:*
- Strong support: $0.69 - $0.66 (if it breaks, it will drop to $0.60)
- Resistance: $0.72 - $0.74 then $0.78 (if it breaks through, it will open $0.82 - $0.85)
- You are exactly at $0.7146, meaning between support and resistance
- *Indicators:*
- Neutral score 42/100 - Neutral
- Short-term outlook: average $0.7482 in a month (+5.14%) range $0.6674 - $0.8291
- 7-day forecast: $0.7500 (+5%)
- Year forecast: average $1.1132 (+56%) range $0.94 - $1.28
- *Tokenomics:* Upcoming unlocks you need to track, but the team postponed some of the unlocks to 2027, and that’s positive
Summary at $0.7146
An excellent accumulation zone if you believe in the project.
- *Speculation:* enter at $0.71 with a stop loss at $0.66 (7% loss) and a target at $0.78 (9%), then $0.8291 (16%) — Risk/Reward is good
- *Investment:* $0.7146 is a good price for accumulation, a 1-year target of $1.11. But be careful: the new coin since September 2025 is still down from its ATH
$ASTER
#op🔥🔥 #USDTfree #SECHaltsCryptoETFReviewsAmidFundingLapse #Write2Earn #Crypto_Jobs🎯
$BANK
*Currently in Consolidation:*
- *Support and resistance:*
- Strong support: $0.69 - $0.66 (if it breaks, it will drop to $0.60)
- Resistance: $0.72 - $0.74 then $0.78 (if it breaks through, it will open $0.82 - $0.85)
- You are exactly at $0.7146, meaning between support and resistance
- *Indicators:*
- Neutral score 42/100 - Neutral
- Short-term outlook: average $0.7482 in a month (+5.14%) range $0.6674 - $0.8291
- 7-day forecast: $0.7500 (+5%)
- Year forecast: average $1.1132 (+56%) range $0.94 - $1.28
- *Tokenomics:* Upcoming unlocks you need to track, but the team postponed some of the unlocks to 2027, and that’s positive
Summary at $0.7146
An excellent accumulation zone if you believe in the project.
- *Speculation:* enter at $0.71 with a stop loss at $0.66 (7% loss) and a target at $0.78 (9%), then $0.8291 (16%) — Risk/Reward is good
- *Investment:* $0.7146 is a good price for accumulation, a 1-year target of $1.11. But be careful: the new coin since September 2025 is still down from its ATH
$ASTER
#op🔥🔥 #USDTfree #SECHaltsCryptoETFReviewsAmidFundingLapse #Write2Earn #Crypto_Jobs🎯
$BANK
1
67
Analysis and price prediction for $TUT in the coming hours — will it break out, prepare, and jump? I’d love to hear your opinions
Current situation
- Price: $0.02487 right now; today’s high is $0.02518 and if it drops to $0.02362, you’re close to the daily top
- Market cap: $20.82M, Supply 830 million tokens
- Performance: +8.02% in 5 days, +4.24% in a month, +170.92% in 6 months, but -70% over the full year
- Volume: only $2.43M — weak liquidity
Project: A Web3 educational platform powered by AI; its founder is Yerasyl Amanbek
Technical analysis at $0.02492
- *Trend:* The coin is in a weak and very wide upward trend over the short term; the trend base is at $0.0207
- *Support and resistance:*
- Immediate support: $0.02 is very strong (the same level was repeated in every analysis)
- Immediate resistance: $0.03, then $0.0253 (yesterday’s high)
- If it breaks below $0.0207, it would signal the start of a trend change and a slower decline
- *3-month outlook:* Expected to rise +6.12%, with a 90% chance it stays between $0.0220 and $0.216 (a wide range due to weak liquidity)
Summary at $0.02492
You’re in a middle zone, not a peak and not a bottom. The coin is up 170% in 6 months but still down 70% over the year.
- *If you’re an investor:* $0.02492 is good for accumulation, as long as you set a stop below $0.0207. First target: $0.03 (+20%), then $0.035
- *If you’re a trader:* Liquidity is very weak ($2.4M), so the move will be violent—don’t put in a large amount. Wait for a break of $0.0253 on high volume before entering
Medium risk — small project with a market cap of 20 million
$TUT
{future}(TUTUSDT)
#SECHaltsCryptoETFReviewsAmidFundingLapse #Binance #BTC #Write2Earn #CryptoTrends2024
Analysis and price prediction for $TUT in the coming hours — will it break out, prepare, and jump? I’d love to hear your opinions
Current situation
- Price: $0.02487 right now; today’s high is $0.02518 and if it drops to $0.02362, you’re close to the daily top
- Market cap: $20.82M, Supply 830 million tokens
- Performance: +8.02% in 5 days, +4.24% in a month, +170.92% in 6 months, but -70% over the full year
- Volume: only $2.43M — weak liquidity
Project: A Web3 educational platform powered by AI; its founder is Yerasyl Amanbek
Technical analysis at $0.02492
- *Trend:* The coin is in a weak and very wide upward trend over the short term; the trend base is at $0.0207
- *Support and resistance:*
- Immediate support: $0.02 is very strong (the same level was repeated in every analysis)
- Immediate resistance: $0.03, then $0.0253 (yesterday’s high)
- If it breaks below $0.0207, it would signal the start of a trend change and a slower decline
- *3-month outlook:* Expected to rise +6.12%, with a 90% chance it stays between $0.0220 and $0.216 (a wide range due to weak liquidity)
Summary at $0.02492
You’re in a middle zone, not a peak and not a bottom. The coin is up 170% in 6 months but still down 70% over the year.
- *If you’re an investor:* $0.02492 is good for accumulation, as long as you set a stop below $0.0207. First target: $0.03 (+20%), then $0.035
- *If you’re a trader:* Liquidity is very weak ($2.4M), so the move will be violent—don’t put in a large amount. Wait for a break of $0.0253 on high volume before entering
Medium risk — small project with a market cap of 20 million
$TUT
#SECHaltsCryptoETFReviewsAmidFundingLapse #Binance #BTC #Write2Earn #CryptoTrends2024
Current situation
- Price: $0.02487 right now; today’s high is $0.02518 and if it drops to $0.02362, you’re close to the daily top
- Market cap: $20.82M, Supply 830 million tokens
- Performance: +8.02% in 5 days, +4.24% in a month, +170.92% in 6 months, but -70% over the full year
- Volume: only $2.43M — weak liquidity
Project: A Web3 educational platform powered by AI; its founder is Yerasyl Amanbek
Technical analysis at $0.02492
- *Trend:* The coin is in a weak and very wide upward trend over the short term; the trend base is at $0.0207
- *Support and resistance:*
- Immediate support: $0.02 is very strong (the same level was repeated in every analysis)
- Immediate resistance: $0.03, then $0.0253 (yesterday’s high)
- If it breaks below $0.0207, it would signal the start of a trend change and a slower decline
- *3-month outlook:* Expected to rise +6.12%, with a 90% chance it stays between $0.0220 and $0.216 (a wide range due to weak liquidity)
Summary at $0.02492
You’re in a middle zone, not a peak and not a bottom. The coin is up 170% in 6 months but still down 70% over the year.
- *If you’re an investor:* $0.02492 is good for accumulation, as long as you set a stop below $0.0207. First target: $0.03 (+20%), then $0.035
- *If you’re a trader:* Liquidity is very weak ($2.4M), so the move will be violent—don’t put in a large amount. Wait for a break of $0.0253 on high volume before entering
Medium risk — small project with a market cap of 20 million
$TUT
#SECHaltsCryptoETFReviewsAmidFundingLapse #Binance #BTC #Write2Earn #CryptoTrends2024
1
113
*UNI at $8.97* - You’re in an important decision zone:
Current situation
- Price: $8.91 - $9.13 today, up 1.59%, up 182% in 3 months
- Above all moving averages: 50-day at $6.55 and 200-day at $4.15 = very strong bullish trend
- Uniswap trading volume hit a record in September at $81.7 billion, and TVL is above $4 billion
- Today’s news: SMBC Nikko (Japan’s third-largest broker) signed with Uniswap Labs and Base to build a compatible DeFi gateway - launch in mid-2027
Technically at $8.97
There are two patterns forming:
1. *Daily Cup & Handle:* its resistance is $10.30 - if it breaks, the target is $11.50 - $13.11
2. *Hourly Falling Wedge:* same target $11.50 if it breaks through
*Levels:*
- Immediate support: $8.74 (lower Bollinger) then $8.70 - $8.58 - $8.37
- Immediate resistance: $9.16 - $9.34 then $9.42 - $10.30 - $10.94
- *Liquidation zones:* liquidity stacked under $8.85 (longs get liquidated) and above $9.34-$9.35 (shorts get liquidated) - meaning a violent move is coming
*Momentum:* MACD formed a Bearish crossover and RSI around 60-71 near Overbought, meaning a bit of relief before the breakout
Prediction
Next week’s outlook: ranging between $8.70 - $9.60 with an 80% chance of upside
*Summary at $8.97:*
- If you’re trading daily: watch $8.85; if it breaks, it drops to $8.58; if it breaks above $9.35, it flies to $10.30
- If you’re an investor: $8.97 is good, but the best entry was $8.37 support—stay above $8.37 and your targets are $10.75 then $11.50. Stop loss below $8.37
#GreekPoliceBustCryptoScamRingArrest17 #FedOctoberRateHikeOddsFallTo17% #NvidiaHitsRecordHighUp2.4% #CanaryFilesAmendedS1ForPEPEETF $UNI
{future}(UNIUSDT)
#CerebrasSinksNearly20%OnReportNvidiaToPowerOpenAI
*UNI at $8.97* - You’re in an important decision zone:
Current situation
- Price: $8.91 - $9.13 today, up 1.59%, up 182% in 3 months
- Above all moving averages: 50-day at $6.55 and 200-day at $4.15 = very strong bullish trend
- Uniswap trading volume hit a record in September at $81.7 billion, and TVL is above $4 billion
- Today’s news: SMBC Nikko (Japan’s third-largest broker) signed with Uniswap Labs and Base to build a compatible DeFi gateway - launch in mid-2027
Technically at $8.97
There are two patterns forming:
1. *Daily Cup & Handle:* its resistance is $10.30 - if it breaks, the target is $11.50 - $13.11
2. *Hourly Falling Wedge:* same target $11.50 if it breaks through
*Levels:*
- Immediate support: $8.74 (lower Bollinger) then $8.70 - $8.58 - $8.37
- Immediate resistance: $9.16 - $9.34 then $9.42 - $10.30 - $10.94
- *Liquidation zones:* liquidity stacked under $8.85 (longs get liquidated) and above $9.34-$9.35 (shorts get liquidated) - meaning a violent move is coming
*Momentum:* MACD formed a Bearish crossover and RSI around 60-71 near Overbought, meaning a bit of relief before the breakout
Prediction
Next week’s outlook: ranging between $8.70 - $9.60 with an 80% chance of upside
*Summary at $8.97:*
- If you’re trading daily: watch $8.85; if it breaks, it drops to $8.58; if it breaks above $9.35, it flies to $10.30
- If you’re an investor: $8.97 is good, but the best entry was $8.37 support—stay above $8.37 and your targets are $10.75 then $11.50. Stop loss below $8.37
#GreekPoliceBustCryptoScamRingArrest17 #FedOctoberRateHikeOddsFallTo17% #NvidiaHitsRecordHighUp2.4% #CanaryFilesAmendedS1ForPEPEETF $UNI
#CerebrasSinksNearly20%OnReportNvidiaToPowerOpenAI
Current situation
- Price: $8.91 - $9.13 today, up 1.59%, up 182% in 3 months
- Above all moving averages: 50-day at $6.55 and 200-day at $4.15 = very strong bullish trend
- Uniswap trading volume hit a record in September at $81.7 billion, and TVL is above $4 billion
- Today’s news: SMBC Nikko (Japan’s third-largest broker) signed with Uniswap Labs and Base to build a compatible DeFi gateway - launch in mid-2027
Technically at $8.97
There are two patterns forming:
1. *Daily Cup & Handle:* its resistance is $10.30 - if it breaks, the target is $11.50 - $13.11
2. *Hourly Falling Wedge:* same target $11.50 if it breaks through
*Levels:*
- Immediate support: $8.74 (lower Bollinger) then $8.70 - $8.58 - $8.37
- Immediate resistance: $9.16 - $9.34 then $9.42 - $10.30 - $10.94
- *Liquidation zones:* liquidity stacked under $8.85 (longs get liquidated) and above $9.34-$9.35 (shorts get liquidated) - meaning a violent move is coming
*Momentum:* MACD formed a Bearish crossover and RSI around 60-71 near Overbought, meaning a bit of relief before the breakout
Prediction
Next week’s outlook: ranging between $8.70 - $9.60 with an 80% chance of upside
*Summary at $8.97:*
- If you’re trading daily: watch $8.85; if it breaks, it drops to $8.58; if it breaks above $9.35, it flies to $10.30
- If you’re an investor: $8.97 is good, but the best entry was $8.37 support—stay above $8.37 and your targets are $10.75 then $11.50. Stop loss below $8.37
#GreekPoliceBustCryptoScamRingArrest17 #FedOctoberRateHikeOddsFallTo17% #NvidiaHitsRecordHighUp2.4% #CanaryFilesAmendedS1ForPEPEETF $UNI
#CerebrasSinksNearly20%OnReportNvidiaToPowerOpenAI
1
20
$AAVE at $180.91* - quick analysis: you are currently at resistance:
Current situation
- Current price: $181.00 - $181.54, today’s high $186.49 and down to $176.33
- Up 21% in 5 days and 36% in a month and 91% in 6 months
- Reason: Aave protocol reached $1.1T in cumulative borrowings and $19.19B TVL + the launch of Aave V4, which accepts 7 tokenized US stocks as collateral (Apple, Tesla, Nvidia..) + starting daily purchases of 292 AAVE for the treasury
- *Short-term negative:* RSI 72.37 is overbought and 69.41 is near saturation, and Bollinger %B at 1.10 means stretched and needs a cooldown
- Fear & Greed at 67 - 65 Greed means people are greedy
*Levels:*
- Immediate resistance: $187.28 - $191.63 - $207.82
- Support: $171.56 then $162 (most important support), then $159.21 - $150.54
- If it breaks below $143, the breakout fails and the target is $125 ab7ba22cf5ff
Forecasts at $180.91
Forecast for next week: slightly bullish:
- Oct 3: $178.92, Oct 4: $180.19, Oct 10: $186.43, end of Oct: $195.82 2b53
Most likely scenario:
*If it holds above $162:* target $180 (you’re in it) then $200, risk-to-reward ratio 2.25 to 1
*If it can’t hold above $187:* expect a pullback to $162-$145 f5ff
*Conclusion:*
$180.91 is a profit-taking zone, not a new entry. If you’re in, set your stop below $162 and take part of the profit at $191-$200. If you want a new entry, wait for a retest of $162-$171.
$AAVE
{future}(AAVEUSDT)
$TUT
{future}(TUTUSDT)
#CerebrasSinksNearly20%OnReportNvidiaToPowerOpenAI #SECProposesCryptoCustodyRules #G7PlansToReleaseUpTo100MBarrelsOilDiesel #NFPWatch
$AAVE at $180.91* - quick analysis: you are currently at resistance:
Current situation
- Current price: $181.00 - $181.54, today’s high $186.49 and down to $176.33
- Up 21% in 5 days and 36% in a month and 91% in 6 months
- Reason: Aave protocol reached $1.1T in cumulative borrowings and $19.19B TVL + the launch of Aave V4, which accepts 7 tokenized US stocks as collateral (Apple, Tesla, Nvidia..) + starting daily purchases of 292 AAVE for the treasury
- *Short-term negative:* RSI 72.37 is overbought and 69.41 is near saturation, and Bollinger %B at 1.10 means stretched and needs a cooldown
- Fear & Greed at 67 - 65 Greed means people are greedy
*Levels:*
- Immediate resistance: $187.28 - $191.63 - $207.82
- Support: $171.56 then $162 (most important support), then $159.21 - $150.54
- If it breaks below $143, the breakout fails and the target is $125 ab7ba22cf5ff
Forecasts at $180.91
Forecast for next week: slightly bullish:
- Oct 3: $178.92, Oct 4: $180.19, Oct 10: $186.43, end of Oct: $195.82 2b53
Most likely scenario:
*If it holds above $162:* target $180 (you’re in it) then $200, risk-to-reward ratio 2.25 to 1
*If it can’t hold above $187:* expect a pullback to $162-$145 f5ff
*Conclusion:*
$180.91 is a profit-taking zone, not a new entry. If you’re in, set your stop below $162 and take part of the profit at $191-$200. If you want a new entry, wait for a retest of $162-$171.
$AAVE
$TUT
#CerebrasSinksNearly20%OnReportNvidiaToPowerOpenAI #SECProposesCryptoCustodyRules #G7PlansToReleaseUpTo100MBarrelsOilDiesel #NFPWatch
Current situation
- Current price: $181.00 - $181.54, today’s high $186.49 and down to $176.33
- Up 21% in 5 days and 36% in a month and 91% in 6 months
- Reason: Aave protocol reached $1.1T in cumulative borrowings and $19.19B TVL + the launch of Aave V4, which accepts 7 tokenized US stocks as collateral (Apple, Tesla, Nvidia..) + starting daily purchases of 292 AAVE for the treasury
- *Short-term negative:* RSI 72.37 is overbought and 69.41 is near saturation, and Bollinger %B at 1.10 means stretched and needs a cooldown
- Fear & Greed at 67 - 65 Greed means people are greedy
*Levels:*
- Immediate resistance: $187.28 - $191.63 - $207.82
- Support: $171.56 then $162 (most important support), then $159.21 - $150.54
- If it breaks below $143, the breakout fails and the target is $125 ab7ba22cf5ff
Forecasts at $180.91
Forecast for next week: slightly bullish:
- Oct 3: $178.92, Oct 4: $180.19, Oct 10: $186.43, end of Oct: $195.82 2b53
Most likely scenario:
*If it holds above $162:* target $180 (you’re in it) then $200, risk-to-reward ratio 2.25 to 1
*If it can’t hold above $187:* expect a pullback to $162-$145 f5ff
*Conclusion:*
$180.91 is a profit-taking zone, not a new entry. If you’re in, set your stop below $162 and take part of the profit at $191-$200. If you want a new entry, wait for a retest of $162-$171.
$AAVE
$TUT
#CerebrasSinksNearly20%OnReportNvidiaToPowerOpenAI #SECProposesCryptoCustodyRules #G7PlansToReleaseUpTo100MBarrelsOilDiesel #NFPWatch
1
64
Analysis $QNT at *$265.65* — you’re in a critical zone right now:
What happened?
The coin saw an explosion of +280% in one week in September due to news that *The Clearing House*, owned by 25 major U.S. banks, chose Quant to be the settlement layer for their blockchain-based money project. The price hit a daily peak of $360 on September 27, then corrected. d215526a
Current technical analysis at $265
- *Moving averages:* All the major moving averages are still in buy mode: SMA 50 at $86.18, SMA 200 at $73.73, and EMA 50 at $104.69 — meaning the overall trend is still strongly bullish.
- *But short-term:* SMA 3 at $265.66 gives a SELL signal, and EMA 3 at $254.06 SELL — meaning there is overbought conditions and risk of a sharp correction. 46b5d215
*Key levels:*
- *Resistance:* $272.06 — if it breaks above, it could jump to $318.97, then $322, and then $390
- *Support:* $223.47, then $185–$221. If $195 breaks, then the bullish scenario is cancelled. 46b5526abf63
Forecasts:
- *Sep–Dec 2026:* Analysts expect fluctuation between $185 and $345, and a December target at $275
- *2027–2030:* The mid-term target is $340 in 2027 and $490 in 2030 bf63
*Summary at $265.65:*
You bought at the peak of the breakout. This isn’t a safe entry area for quick trading — the risk is extremely high because the coin has already surged 150% in 7 days. 2e25
If you’re a long-term investor: hold and set a stop-loss below $206 — $195.
If you’re a trader: wait for a correction into the $221–$185 zone for a new entry, and don’t put all your funds in at $265.
Not investment advice—do your own research.
$QNT
{future}(QNTUSDT)
Analysis $QNT at *$265.65* — you’re in a critical zone right now:
What happened?
The coin saw an explosion of +280% in one week in September due to news that *The Clearing House*, owned by 25 major U.S. banks, chose Quant to be the settlement layer for their blockchain-based money project. The price hit a daily peak of $360 on September 27, then corrected. d215526a
Current technical analysis at $265
- *Moving averages:* All the major moving averages are still in buy mode: SMA 50 at $86.18, SMA 200 at $73.73, and EMA 50 at $104.69 — meaning the overall trend is still strongly bullish.
- *But short-term:* SMA 3 at $265.66 gives a SELL signal, and EMA 3 at $254.06 SELL — meaning there is overbought conditions and risk of a sharp correction. 46b5d215
*Key levels:*
- *Resistance:* $272.06 — if it breaks above, it could jump to $318.97, then $322, and then $390
- *Support:* $223.47, then $185–$221. If $195 breaks, then the bullish scenario is cancelled. 46b5526abf63
Forecasts:
- *Sep–Dec 2026:* Analysts expect fluctuation between $185 and $345, and a December target at $275
- *2027–2030:* The mid-term target is $340 in 2027 and $490 in 2030 bf63
*Summary at $265.65:*
You bought at the peak of the breakout. This isn’t a safe entry area for quick trading — the risk is extremely high because the coin has already surged 150% in 7 days. 2e25
If you’re a long-term investor: hold and set a stop-loss below $206 — $195.
If you’re a trader: wait for a correction into the $221–$185 zone for a new entry, and don’t put all your funds in at $265.
Not investment advice—do your own research.
$QNT
What happened?
The coin saw an explosion of +280% in one week in September due to news that *The Clearing House*, owned by 25 major U.S. banks, chose Quant to be the settlement layer for their blockchain-based money project. The price hit a daily peak of $360 on September 27, then corrected. d215526a
Current technical analysis at $265
- *Moving averages:* All the major moving averages are still in buy mode: SMA 50 at $86.18, SMA 200 at $73.73, and EMA 50 at $104.69 — meaning the overall trend is still strongly bullish.
- *But short-term:* SMA 3 at $265.66 gives a SELL signal, and EMA 3 at $254.06 SELL — meaning there is overbought conditions and risk of a sharp correction. 46b5d215
*Key levels:*
- *Resistance:* $272.06 — if it breaks above, it could jump to $318.97, then $322, and then $390
- *Support:* $223.47, then $185–$221. If $195 breaks, then the bullish scenario is cancelled. 46b5526abf63
Forecasts:
- *Sep–Dec 2026:* Analysts expect fluctuation between $185 and $345, and a December target at $275
- *2027–2030:* The mid-term target is $340 in 2027 and $490 in 2030 bf63
*Summary at $265.65:*
You bought at the peak of the breakout. This isn’t a safe entry area for quick trading — the risk is extremely high because the coin has already surged 150% in 7 days. 2e25
If you’re a long-term investor: hold and set a stop-loss below $206 — $195.
If you’re a trader: wait for a correction into the $221–$185 zone for a new entry, and don’t put all your funds in at $265.
Not investment advice—do your own research.
$QNT
1
177
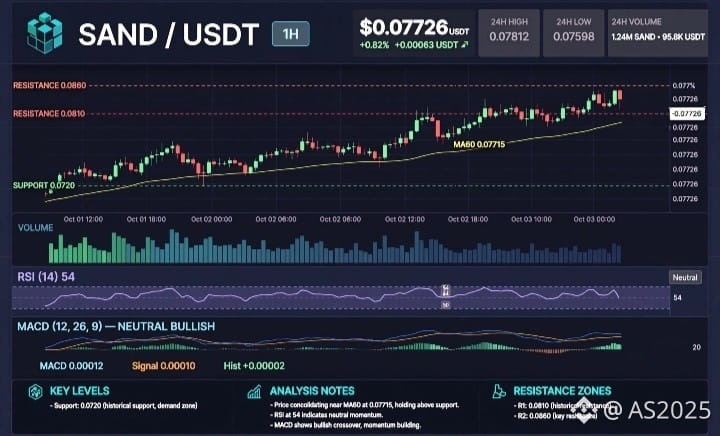
$SAND
- *MA60 at 0.07715:* The price is moving very close to it and staying above it, and in the books this gives a sign of trend continuation on the timeframe if it remains above it with closes.
- *Historical levels for study only:*
- Support: 0.0720$
- Resistances: 0.0810$ and 0.0860$
- *RSI 54:* Neutral, neither overbought nor oversold.
- *MACD:* A slight positive crossover, and the histogram is +0.00002 — the beginning of building momentum based on the shown data.
SAND is forming sideways consolidation above MA60, and traders are studying volume behavior at historical resistance levels.
$SAND
{future}(SANDUSDT)
#SECProposesCryptoCustodyRules #AnchorageReportedlyCuts17%Workforce #G7PlansToReleaseUpTo100MBarrelsOilDiesel #SECProposesCryptoCustodyRules #SECApproves3xLongCryptoCommodityETPs
$SAND
- *MA60 at 0.07715:* The price is moving very close to it and staying above it, and in the books this gives a sign of trend continuation on the timeframe if it remains above it with closes.
- *Historical levels for study only:*
- Support: 0.0720$
- Resistances: 0.0810$ and 0.0860$
- *RSI 54:* Neutral, neither overbought nor oversold.
- *MACD:* A slight positive crossover, and the histogram is +0.00002 — the beginning of building momentum based on the shown data.
SAND is forming sideways consolidation above MA60, and traders are studying volume behavior at historical resistance levels.
$SAND
#SECProposesCryptoCustodyRules #AnchorageReportedlyCuts17%Workforce #G7PlansToReleaseUpTo100MBarrelsOilDiesel #SECProposesCryptoCustodyRules #SECApproves3xLongCryptoCommodityETPs
- *MA60 at 0.07715:* The price is moving very close to it and staying above it, and in the books this gives a sign of trend continuation on the timeframe if it remains above it with closes.
- *Historical levels for study only:*
- Support: 0.0720$
- Resistances: 0.0810$ and 0.0860$
- *RSI 54:* Neutral, neither overbought nor oversold.
- *MACD:* A slight positive crossover, and the histogram is +0.00002 — the beginning of building momentum based on the shown data.
SAND is forming sideways consolidation above MA60, and traders are studying volume behavior at historical resistance levels.
$SAND
#SECProposesCryptoCustodyRules #AnchorageReportedlyCuts17%Workforce #G7PlansToReleaseUpTo100MBarrelsOilDiesel #SECProposesCryptoCustodyRules #SECApproves3xLongCryptoCommodityETPs
1
122
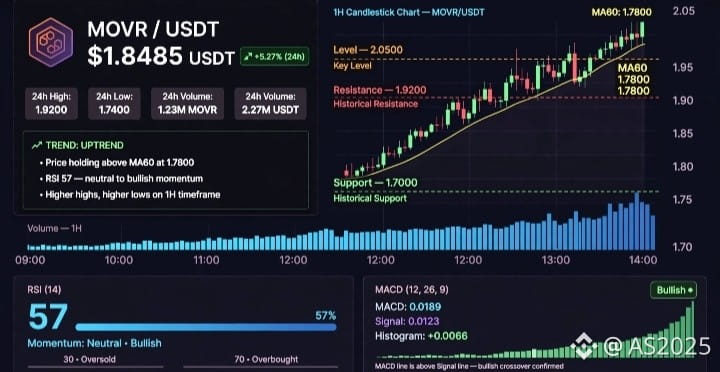
- $1.8485 $MOVR
- *Current price:* $1.8485 (+5.27% in 24 hours according to the simulation)
- *MA60 at 1.7800:* The price remains trading above this average; the books consider this an uptrend filter on the 1-hour timeframe
- *Historical levels for study:*
- Historical support: $1.7000 (previous bounce zone)
- Historical resistance: $1.9200, then the key level $2.0500
These are observation zones, not buy/sell orders
- *RSI 57:* Neutral momentum slightly bullish; there’s room before reaching overbought at 70
- *MACD:* The blue line is above the orange and the histogram is positive = bullish momentum in the displayed data
- *Trend:* Higher highs + higher lows on the 1H timeframe
*Important educational note:*
Whoever studies the chart learns to watch how price behaves at $1.92—will it form a rejection candle with high volume, or a strong close above it? Same idea when retesting the MA60.
$MOVR
{future}(MOVRUSDT)
#CerebrasSinksNearly20%OnReportNvidiaToPowerOpenAI #SECProposesCryptoCustodyRules #SECApproves3xLongCryptoCommodityETPs #ICBASuesOCCOverCryptoBankCharters #USStocksCloseHigherOnWeakJobsData
- $1.8485 $MOVR
- *Current price:* $1.8485 (+5.27% in 24 hours according to the simulation)
- *MA60 at 1.7800:* The price remains trading above this average; the books consider this an uptrend filter on the 1-hour timeframe
- *Historical levels for study:*
- Historical support: $1.7000 (previous bounce zone)
- Historical resistance: $1.9200, then the key level $2.0500
These are observation zones, not buy/sell orders
- *RSI 57:* Neutral momentum slightly bullish; there’s room before reaching overbought at 70
- *MACD:* The blue line is above the orange and the histogram is positive = bullish momentum in the displayed data
- *Trend:* Higher highs + higher lows on the 1H timeframe
*Important educational note:*
Whoever studies the chart learns to watch how price behaves at $1.92—will it form a rejection candle with high volume, or a strong close above it? Same idea when retesting the MA60.
$MOVR
#CerebrasSinksNearly20%OnReportNvidiaToPowerOpenAI #SECProposesCryptoCustodyRules #SECApproves3xLongCryptoCommodityETPs #ICBASuesOCCOverCryptoBankCharters #USStocksCloseHigherOnWeakJobsData
- *Current price:* $1.8485 (+5.27% in 24 hours according to the simulation)
- *MA60 at 1.7800:* The price remains trading above this average; the books consider this an uptrend filter on the 1-hour timeframe
- *Historical levels for study:*
- Historical support: $1.7000 (previous bounce zone)
- Historical resistance: $1.9200, then the key level $2.0500
These are observation zones, not buy/sell orders
- *RSI 57:* Neutral momentum slightly bullish; there’s room before reaching overbought at 70
- *MACD:* The blue line is above the orange and the histogram is positive = bullish momentum in the displayed data
- *Trend:* Higher highs + higher lows on the 1H timeframe
*Important educational note:*
Whoever studies the chart learns to watch how price behaves at $1.92—will it form a rejection candle with high volume, or a strong close above it? Same idea when retesting the MA60.
$MOVR
#CerebrasSinksNearly20%OnReportNvidiaToPowerOpenAI #SECProposesCryptoCustodyRules #SECApproves3xLongCryptoCommodityETPs #ICBASuesOCCOverCryptoBankCharters #USStocksCloseHigherOnWeakJobsData
1
149
🚨🔥 *$SUI under the microscope... is the moment of the explosion approaching?* 🚀
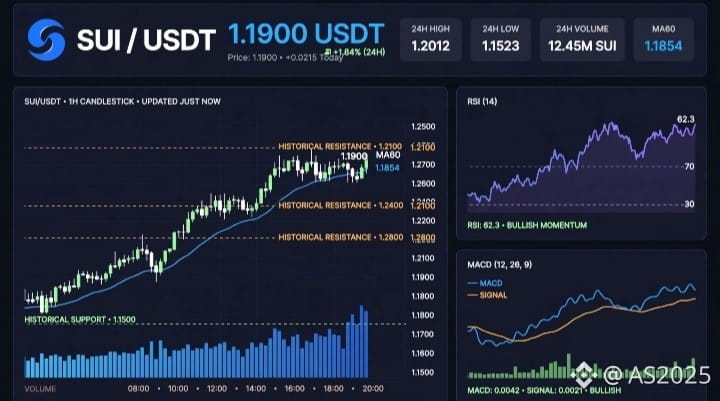
$SUI continues to show notable strength on the clock frame, trading steadily above the MA60 60-candle moving average at 1.1854$, a level many traders consider a filter for the short-term trend.
📊 The current price around 1.19$ holds its position above the MA60
📈 Historical levels analysts are watching:
- Historical support: 1.15$
- Historical resistances: 1.21$ then 1.24$ then 1.28$
Technical indicators:
- RSI at 62.3 with moderate upward momentum, not in the overbought zone
- MACD above the signal line with positive momentum
- Volume is high with the latest move, suggesting buyer interest
Holding above 1.1854$ remains an important follow-up point in technical books for the continuation of the upward trend, while a historic break of 1.15$ was considered a weakness area in the previous structure.
💬 In your opinion, can $SUI test 1.28$ if it keeps above the MA60?
Share your technical read 👇
⚠️ Notice: This is educational analysis and simulated data for study purposes only, not financial advice. Capital management is the foundation.
{future}(SUIUSDT)
🚨🔥 *$SUI under the microscope... is the moment of the explosion approaching?* 🚀
$SUI continues to show notable strength on the clock frame, trading steadily above the MA60 60-candle moving average at 1.1854$, a level many traders consider a filter for the short-term trend.
📊 The current price around 1.19$ holds its position above the MA60
📈 Historical levels analysts are watching:
- Historical support: 1.15$
- Historical resistances: 1.21$ then 1.24$ then 1.28$
Technical indicators:
- RSI at 62.3 with moderate upward momentum, not in the overbought zone
- MACD above the signal line with positive momentum
- Volume is high with the latest move, suggesting buyer interest
Holding above 1.1854$ remains an important follow-up point in technical books for the continuation of the upward trend, while a historic break of 1.15$ was considered a weakness area in the previous structure.
💬 In your opinion, can $SUI test 1.28$ if it keeps above the MA60?
Share your technical read 👇
⚠️ Notice: This is educational analysis and simulated data for study purposes only, not financial advice. Capital management is the foundation.
$SUI continues to show notable strength on the clock frame, trading steadily above the MA60 60-candle moving average at 1.1854$, a level many traders consider a filter for the short-term trend.
📊 The current price around 1.19$ holds its position above the MA60
📈 Historical levels analysts are watching:
- Historical support: 1.15$
- Historical resistances: 1.21$ then 1.24$ then 1.28$
Technical indicators:
- RSI at 62.3 with moderate upward momentum, not in the overbought zone
- MACD above the signal line with positive momentum
- Volume is high with the latest move, suggesting buyer interest
Holding above 1.1854$ remains an important follow-up point in technical books for the continuation of the upward trend, while a historic break of 1.15$ was considered a weakness area in the previous structure.
💬 In your opinion, can $SUI test 1.28$ if it keeps above the MA60?
Share your technical read 👇
⚠️ Notice: This is educational analysis and simulated data for study purposes only, not financial advice. Capital management is the foundation.
1
82
Log in to explore more content
Join global crypto users on Binance Square
⚡️ Get latest and useful information about crypto.
💬 Trusted by the world’s largest crypto exchange.
👍 Discover real insights from verified creators.
Email / Phone number
Trending Topics
FedMinutesFocusOnOctoberPause
81,656 views
938 Discussing
🚨 HIGH ALERT ‼️ PLEASE DON’T TRADE BLINDLY FOR THE NEXT HOUR 🚨
Guys, we have FOMC Minutes coming in less than 1 hour.
And after the kind of volatility we already saw today, I really don’t want anyone opening random high-leverage positions just before this release.
The biggest reaction I’m watching will be in Gold (XAU), Silver (XAG), BTC and ETH. Then coins like SOL and other highly leveraged mid/low-cap alts can exaggerate whatever move BTC makes.
Gold and Silver are especially sensitive tonight because the market is already reacting to the US dollar + Treasury yields, and both metals have been under heavy pressure ahead of the Fed minutes.
Briefly speaking
📉Hawkish Fed Minutes → Dollar/yields can push higher → pressure on BTC, crypto, Gold & silver
📈Dovish Fed Minutes → Dollar/yields can cool → BTC, Gold, Silver and risk assets can bounce hard.
And please remember the first candle can be a trap. We can get a pump, immediate dump, liquidations on both sides, and then the real direction.
So for now, protect your positions, reduce unnecessary leverage and don’t FOMO into the first move.
Tonight I’m watching $XAU , $XAG and $BTC first. These will tell us very quickly how the market is reading the Fed.
I will Update you guys on time
Follow @Panda Traders and Turn on Your notifications right now
#FedMinutesFocusOnOctoberPause
Panda Traders
·14 Likes
·2.6k views
BinanceLaunchesBinanceIntelligence
1M views
6,201 Discussing
EvernorthDelaysNasdaqDebutToOct12
4,568 views
182 Discussing