
老朝奉研究院院长
206 Posts

老朝奉研究院院长
Report
Block User

SOL Holder
Occasional Trader
5.6 Years
7 Following
5.8K+ Followers
1.7K+ Liked
Posts
All
Quotes
PINNED
·
--
Recommend everyone to follow Lao Chaofeng Research Institute
Recommend everyone to follow Lao Chaofeng Research Institute

老朝奉研究院
·
--
BullishThe Old Dynasty Research Institute is officially open to the public, welcome everyone to follow us.
Old Dynasty Research Institute: Insight into cycles, discover value.
Trading fee 20% off with invite code: LCFYJY DM to join the VIP group.
Old Dynasty Research Institute: Insight into cycles, discover value.
Trading fee 20% off with invite code: LCFYJY DM to join the VIP group.

2
126
PINNED
·
--
#BTC☀ The Federal Reserve's interest rate has landed, and the cryptocurrency market experienced a significant decline early this morning! Mainstream currencies such as BNB, ETH, and SOL have all been downgraded by more than 5 points in the mid-term. Trump said on social media that he was panicking and wrong again
#BTC☀ The Federal Reserve's interest rate has landed, and the cryptocurrency market experienced a significant decline early this morning! Mainstream currencies such as BNB, ETH, and SOL have all been downgraded by more than 5 points in the mid-term. Trump said on social media that he was panicking and wrong again

32
5
64
77.7k
·
--
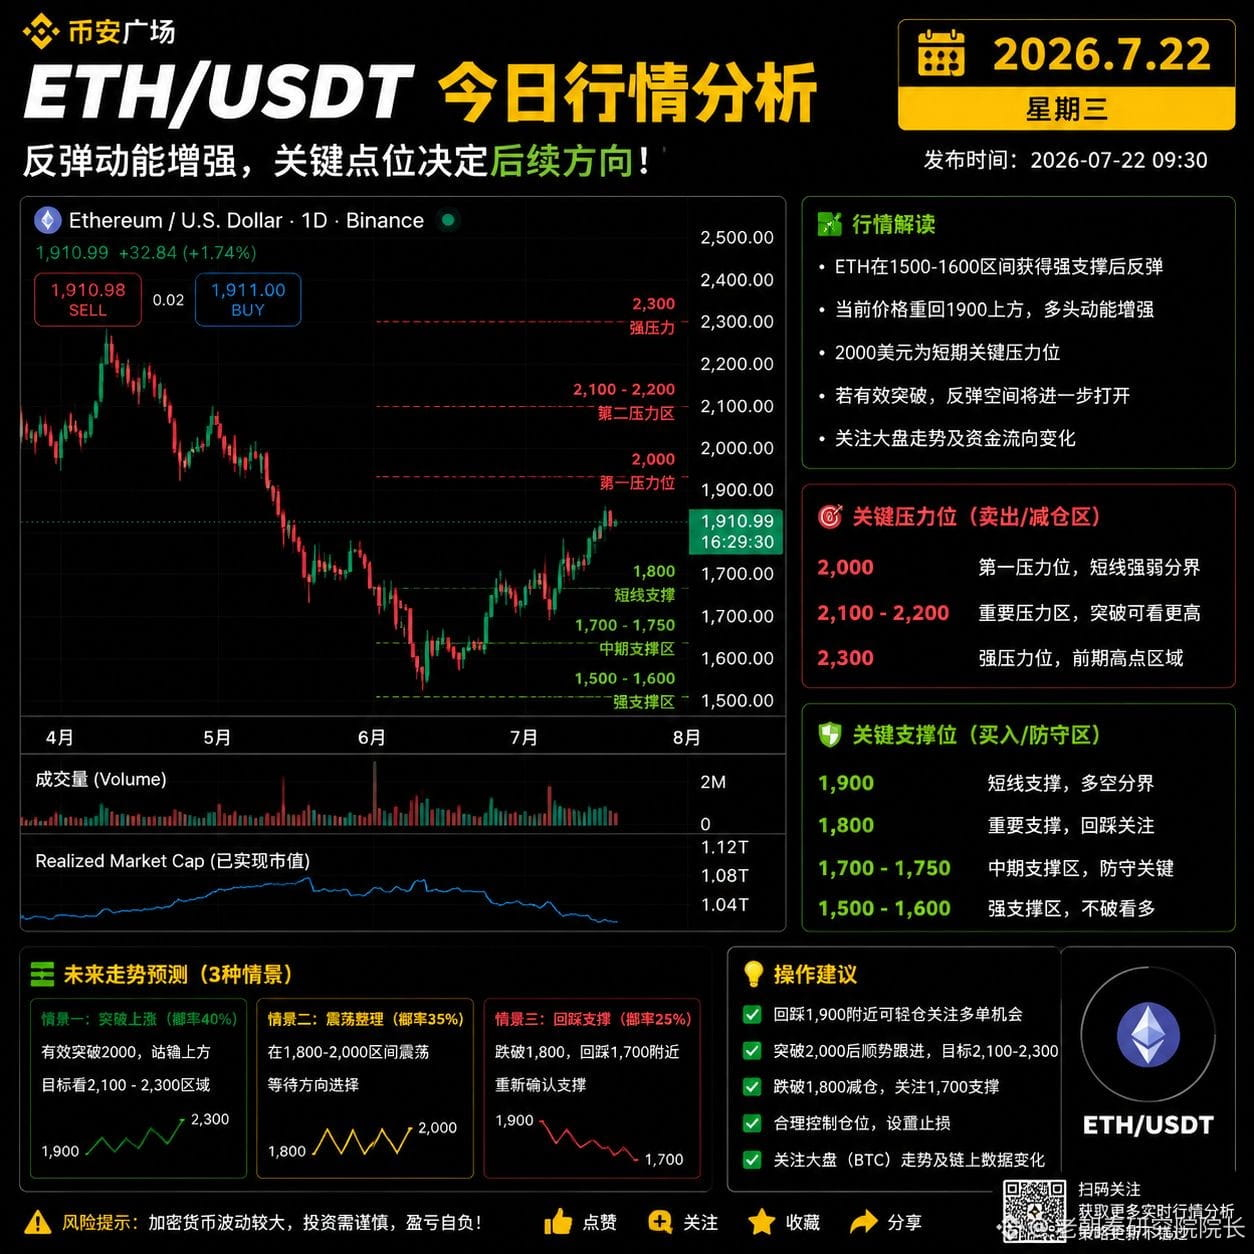
ETH market analysis
From the daily chart perspective, $ETH has recently undergone a rapid drop and formed a clear support in the $1500–$1600 area. The current price has rebounded to around $1910, and there are signs that the short-term structure is starting to repair. Coupled with the broader market sentiment improving, once BTC stabilizes, funds begin rotating into mainstream coins. ETH has further rebound potential, but it still faces resistance from trapped positions above.
Trend outlook:
In the short term, ETH is in an “oversold rebound phase,” with bulls trying to reclaim the $1900–$2000 zone. If it can break above the $2000 psychological level with volume, market confidence may recover further, and the next target would be the $2100–$2200 range. If it breaks $2200, there is an opportunity to re-challenge the resistance around $2300.
Key levels:
🟢 Bull support zones:
$1900: Current short-term strength/weakness line; as long as it holds, the rebound structure can continue.
$1800: Important pullback support; a breakdown would suggest weakening upward momentum.
$1700–$1750: Critical medium-term defense zone; if lost, it may test $1600 again.
🔴 Overhead resistance zones:
$2000: First resistance level and a key point for market sentiment.
$2100–$2200: A prior high-density trading area, making breakthroughs more difficult.
$2300: Confirmation level for a medium-term trend reversal.
Expected range for the coming week:
Leaning toward a strong-biased range-bound movement within $1800–$2200. If the broader market continues to stay strong, ETH could challenge $2200. If $BTC shows a pullback, ETH may revisit the $1800 area to find support.
Trading approach: Focus on the opportunity around $1900 support in the short term. After a break above $2000, go long following the trend. If it breaks below $1800, reduce position size and wait for the $1700 area to re-confirm. Overall, ETH is transitioning from a weak selloff to a repair phase; going forward, the key focus is whether it can break above $2000.
ETH market analysis
From the daily chart perspective, $ETH has recently undergone a rapid drop and formed a clear support in the $1500–$1600 area. The current price has rebounded to around $1910, and there are signs that the short-term structure is starting to repair. Coupled with the broader market sentiment improving, once BTC stabilizes, funds begin rotating into mainstream coins. ETH has further rebound potential, but it still faces resistance from trapped positions above.
Trend outlook:
In the short term, ETH is in an “oversold rebound phase,” with bulls trying to reclaim the $1900–$2000 zone. If it can break above the $2000 psychological level with volume, market confidence may recover further, and the next target would be the $2100–$2200 range. If it breaks $2200, there is an opportunity to re-challenge the resistance around $2300.
Key levels:
🟢 Bull support zones:
$1900: Current short-term strength/weakness line; as long as it holds, the rebound structure can continue.
$1800: Important pullback support; a breakdown would suggest weakening upward momentum.
$1700–$1750: Critical medium-term defense zone; if lost, it may test $1600 again.
🔴 Overhead resistance zones:
$2000: First resistance level and a key point for market sentiment.
$2100–$2200: A prior high-density trading area, making breakthroughs more difficult.
$2300: Confirmation level for a medium-term trend reversal.
Expected range for the coming week:
Leaning toward a strong-biased range-bound movement within $1800–$2200. If the broader market continues to stay strong, ETH could challenge $2200. If $BTC shows a pullback, ETH may revisit the $1800 area to find support.
Trading approach: Focus on the opportunity around $1900 support in the short term. After a break above $2000, go long following the trend. If it breaks below $1800, reduce position size and wait for the $1700 area to re-confirm. Overall, ETH is transitioning from a weak selloff to a repair phase; going forward, the key focus is whether it can break above $2000.
From the daily chart perspective, $ETH has recently undergone a rapid drop and formed a clear support in the $1500–$1600 area. The current price has rebounded to around $1910, and there are signs that the short-term structure is starting to repair. Coupled with the broader market sentiment improving, once BTC stabilizes, funds begin rotating into mainstream coins. ETH has further rebound potential, but it still faces resistance from trapped positions above.
Trend outlook:
In the short term, ETH is in an “oversold rebound phase,” with bulls trying to reclaim the $1900–$2000 zone. If it can break above the $2000 psychological level with volume, market confidence may recover further, and the next target would be the $2100–$2200 range. If it breaks $2200, there is an opportunity to re-challenge the resistance around $2300.
Key levels:
🟢 Bull support zones:
$1900: Current short-term strength/weakness line; as long as it holds, the rebound structure can continue.
$1800: Important pullback support; a breakdown would suggest weakening upward momentum.
$1700–$1750: Critical medium-term defense zone; if lost, it may test $1600 again.
🔴 Overhead resistance zones:
$2000: First resistance level and a key point for market sentiment.
$2100–$2200: A prior high-density trading area, making breakthroughs more difficult.
$2300: Confirmation level for a medium-term trend reversal.
Expected range for the coming week:
Leaning toward a strong-biased range-bound movement within $1800–$2200. If the broader market continues to stay strong, ETH could challenge $2200. If $BTC shows a pullback, ETH may revisit the $1800 area to find support.
Trading approach: Focus on the opportunity around $1900 support in the short term. After a break above $2000, go long following the trend. If it breaks below $1800, reduce position size and wait for the $1700 area to re-confirm. Overall, ETH is transitioning from a weak selloff to a repair phase; going forward, the key focus is whether it can break above $2000.
5
135
·
--
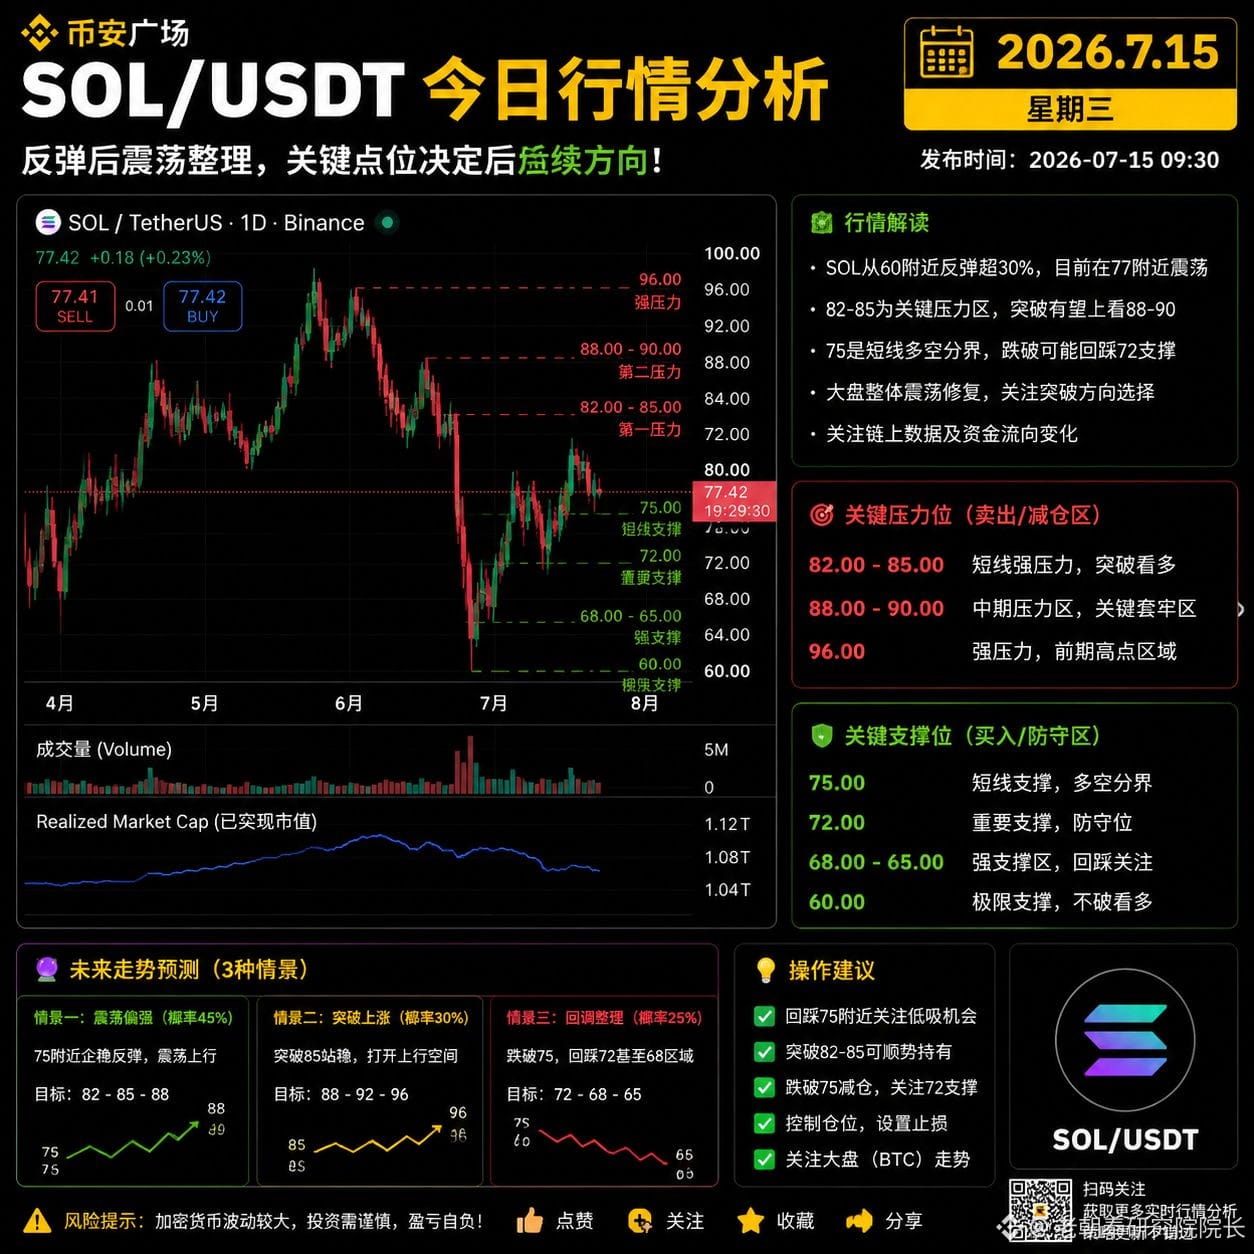
SOL/USDT Daily Price Action Analysis
Currently, the price at $SOL is around $77.4. The overall trend is in a rebound repair phase after a big drop; currently, it is entering a short-term sideways consolidation period.
Previously, $SOL quickly fell from the $96–98 high, dropping to around $60 at its lowest. After that, a clear rebound appeared, with a sharp pullback reaching the $82–83 area. Right now, the price is consolidating around $77, indicating that bulls and bears are fighting over a key level after the rebound.
1. Current trend assessment
1) Short term: After the rebound, it is entering a correction
SOL rebounded from the $60 bottom by more than 30%, and short-term profit-taking has begun to unwind.
Current candlestick/price behavior:
- Multiple rejections above the $80 level
- Choppy consolidation around $77
- During the decline, volume gradually shrank
Note:
In the short term, it is not showing clear weakening—it is digesting the upward pressure from the prior rally.
If $BTC remains stable, SOL has the chance to test the resistance zone further upward.
2. Key resistance levels
🔴 First resistance: $80–82
This is the most important short-term resistance right now.
Reasons:
- Prior rebound high area
- Multiple failed attempts to break through
- Short-term capital tends to take profits here
If it breaks out and holds above $82:
Next targets:
➡️ $85
➡️ $88
🔴 Second resistance: $88–90
This is a key zone for the mid-term rebound.
Breaking above it implies:
- SOL returns to an upward trend
- Market funds may flow back in again
Targets:
➡️ $92
➡️ The prior high area around $96
3. Important support levels
🟢 First support: $75
This is the current boundary between short-term bulls and bears.
If $75 holds:
- It indicates the rebound structure is still valid.
If it breaks down:
- Price may continue to pull back.
🟢 Second support: $72
An important defense level.
This area corresponds to a prior consolidation range:
- If price drops near $72 and stabilizes, you can watch for potential buy-the-dip opportunities.
🟢 Strong support: $68–65
This is the key consolidation/absorption zone for this round of rebound.
If the market experiences a sharp correction:
- SOL will likely test this zone.
🟢 Extreme support: $60
The prior bottom area.
If it breaks below $60:
- It would mean the rebound in this cycle has failed, and the market may return to a weak trend.
SOL/USDT Daily Price Action Analysis
Currently, the price at $SOL is around $77.4. The overall trend is in a rebound repair phase after a big drop; currently, it is entering a short-term sideways consolidation period.
Previously, $SOL quickly fell from the $96–98 high, dropping to around $60 at its lowest. After that, a clear rebound appeared, with a sharp pullback reaching the $82–83 area. Right now, the price is consolidating around $77, indicating that bulls and bears are fighting over a key level after the rebound.
1. Current trend assessment
1) Short term: After the rebound, it is entering a correction
SOL rebounded from the $60 bottom by more than 30%, and short-term profit-taking has begun to unwind.
Current candlestick/price behavior:
- Multiple rejections above the $80 level
- Choppy consolidation around $77
- During the decline, volume gradually shrank
Note:
In the short term, it is not showing clear weakening—it is digesting the upward pressure from the prior rally.
If $BTC remains stable, SOL has the chance to test the resistance zone further upward.
2. Key resistance levels
🔴 First resistance: $80–82
This is the most important short-term resistance right now.
Reasons:
- Prior rebound high area
- Multiple failed attempts to break through
- Short-term capital tends to take profits here
If it breaks out and holds above $82:
Next targets:
➡️ $85
➡️ $88
🔴 Second resistance: $88–90
This is a key zone for the mid-term rebound.
Breaking above it implies:
- SOL returns to an upward trend
- Market funds may flow back in again
Targets:
➡️ $92
➡️ The prior high area around $96
3. Important support levels
🟢 First support: $75
This is the current boundary between short-term bulls and bears.
If $75 holds:
- It indicates the rebound structure is still valid.
If it breaks down:
- Price may continue to pull back.
🟢 Second support: $72
An important defense level.
This area corresponds to a prior consolidation range:
- If price drops near $72 and stabilizes, you can watch for potential buy-the-dip opportunities.
🟢 Strong support: $68–65
This is the key consolidation/absorption zone for this round of rebound.
If the market experiences a sharp correction:
- SOL will likely test this zone.
🟢 Extreme support: $60
The prior bottom area.
If it breaks below $60:
- It would mean the rebound in this cycle has failed, and the market may return to a weak trend.
Currently, the price at $SOL is around $77.4. The overall trend is in a rebound repair phase after a big drop; currently, it is entering a short-term sideways consolidation period.
Previously, $SOL quickly fell from the $96–98 high, dropping to around $60 at its lowest. After that, a clear rebound appeared, with a sharp pullback reaching the $82–83 area. Right now, the price is consolidating around $77, indicating that bulls and bears are fighting over a key level after the rebound.
1. Current trend assessment
1) Short term: After the rebound, it is entering a correction
SOL rebounded from the $60 bottom by more than 30%, and short-term profit-taking has begun to unwind.
Current candlestick/price behavior:
- Multiple rejections above the $80 level
- Choppy consolidation around $77
- During the decline, volume gradually shrank
Note:
In the short term, it is not showing clear weakening—it is digesting the upward pressure from the prior rally.
If $BTC remains stable, SOL has the chance to test the resistance zone further upward.
2. Key resistance levels
🔴 First resistance: $80–82
This is the most important short-term resistance right now.
Reasons:
- Prior rebound high area
- Multiple failed attempts to break through
- Short-term capital tends to take profits here
If it breaks out and holds above $82:
Next targets:
➡️ $85
➡️ $88
🔴 Second resistance: $88–90
This is a key zone for the mid-term rebound.
Breaking above it implies:
- SOL returns to an upward trend
- Market funds may flow back in again
Targets:
➡️ $92
➡️ The prior high area around $96
3. Important support levels
🟢 First support: $75
This is the current boundary between short-term bulls and bears.
If $75 holds:
- It indicates the rebound structure is still valid.
If it breaks down:
- Price may continue to pull back.
🟢 Second support: $72
An important defense level.
This area corresponds to a prior consolidation range:
- If price drops near $72 and stabilizes, you can watch for potential buy-the-dip opportunities.
🟢 Strong support: $68–65
This is the key consolidation/absorption zone for this round of rebound.
If the market experiences a sharp correction:
- SOL will likely test this zone.
🟢 Extreme support: $60
The prior bottom area.
If it breaks below $60:
- It would mean the rebound in this cycle has failed, and the market may return to a weak trend.
1
2
269
·
--
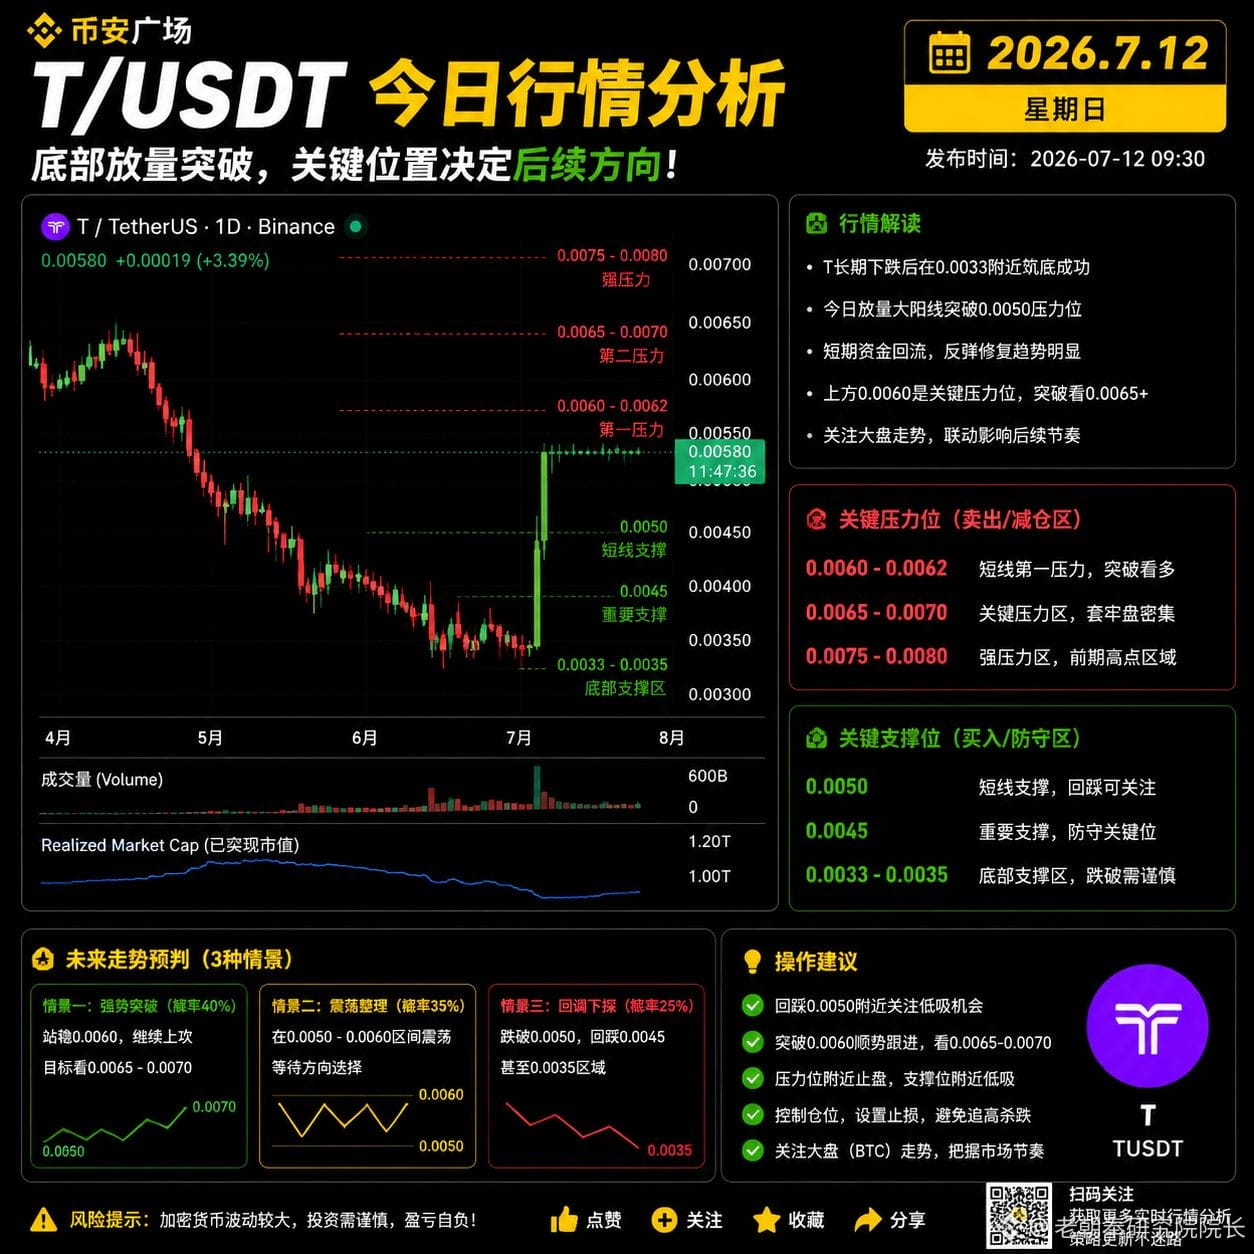
$T Price Trend Analysis (Daily Chart)
1. Bottom Structure
T previously experienced consecutive declines, falling from around 0.0065 all the way to the 0.0032–0.0034 area, where the market repeatedly stopped falling.
Recently:
Trading has been ranging near 0.0033 for a relatively long time;
Volume has been gradually increasing;
Today, volume surged and broke through the 0.0045 and 0.0050 zones;
This indicates that short-term buying momentum has started to strengthen, and market sentiment has begun to repair.
The current trend is similar to:
Bottom consolidation → breakout on increased volume → pullback confirmation → searching for new resistance
Key resistance levels
First resistance: 0.0060–0.0062
The current price is already approaching this area.
This was a previously tight, high-density trading range. If it cannot break through effectively, profit-taking may easily occur.
Watch:
Daily close holds above 0.0060 → the rebound may continue;
A rally that fades back → could pull back to 0.0050.
Second resistance: 0.0065–0.0070
This is the former top region and an important level of trapped positions.
After breaking above 0.0070, the short-term structure will become clearly stronger. The next target is:
Strong resistance: 0.0075–0.0080
If $BTC continues to strengthen, with capital rotating among small-cap tokens, T may have a chance to challenge this region.
Important supports below
🟢 Around 0.0050
This is the first line of defense and also the pullback confirmation area after the breakout.
Holding above 0.0050:
Short-term upward structure remains valid.
🟢 Around 0.0045
An important support zone.
If this level breaks, it means the strength behind this rally was insufficient, and the market may return to consolidation.
🟢 0.0033–0.0035
The core bottom support.
If price falls back into this area again, it suggests the market’s capital push has failed and a new base must be built.
Outlook / Next-step prediction
In the short term:
Slightly bullish consolidation—watch for breakout confirmation.
Possible paths:
Bullish scenario:
Hold above 0.0060
→ Challenge 0.0065–0.0070
→ After a breakout, look for 0.0075–0.0080
Consolidation scenario:
Range trading between 0.0050 and 0.0060
→ Wait for volume to expand further
Bearish scenario:
Break below 0.0050
→ Pull back to 0.0045, or even the 0.0035 area
Trade focus
✅ Short-term focus:
Pull back near 0.0050
Break above 0.0060 for confirmation
Key to watch:
Whether 0.0060 can turn from resistance into support is the core level for T to start the next wave of upward movement.
Right now, the structure is a low-level rebound on increasing volume. It’s relatively positive in the short term, but you still need to guard against profit-taking after a rapid run-up.
$T Price Trend Analysis (Daily Chart)
1. Bottom Structure
T previously experienced consecutive declines, falling from around 0.0065 all the way to the 0.0032–0.0034 area, where the market repeatedly stopped falling.
Recently:
Trading has been ranging near 0.0033 for a relatively long time;
Volume has been gradually increasing;
Today, volume surged and broke through the 0.0045 and 0.0050 zones;
This indicates that short-term buying momentum has started to strengthen, and market sentiment has begun to repair.
The current trend is similar to:
Bottom consolidation → breakout on increased volume → pullback confirmation → searching for new resistance
Key resistance levels
First resistance: 0.0060–0.0062
The current price is already approaching this area.
This was a previously tight, high-density trading range. If it cannot break through effectively, profit-taking may easily occur.
Watch:
Daily close holds above 0.0060 → the rebound may continue;
A rally that fades back → could pull back to 0.0050.
Second resistance: 0.0065–0.0070
This is the former top region and an important level of trapped positions.
After breaking above 0.0070, the short-term structure will become clearly stronger. The next target is:
Strong resistance: 0.0075–0.0080
If $BTC continues to strengthen, with capital rotating among small-cap tokens, T may have a chance to challenge this region.
Important supports below
🟢 Around 0.0050
This is the first line of defense and also the pullback confirmation area after the breakout.
Holding above 0.0050:
Short-term upward structure remains valid.
🟢 Around 0.0045
An important support zone.
If this level breaks, it means the strength behind this rally was insufficient, and the market may return to consolidation.
🟢 0.0033–0.0035
The core bottom support.
If price falls back into this area again, it suggests the market’s capital push has failed and a new base must be built.
Outlook / Next-step prediction
In the short term:
Slightly bullish consolidation—watch for breakout confirmation.
Possible paths:
Bullish scenario:
Hold above 0.0060
→ Challenge 0.0065–0.0070
→ After a breakout, look for 0.0075–0.0080
Consolidation scenario:
Range trading between 0.0050 and 0.0060
→ Wait for volume to expand further
Bearish scenario:
Break below 0.0050
→ Pull back to 0.0045, or even the 0.0035 area
Trade focus
✅ Short-term focus:
Pull back near 0.0050
Break above 0.0060 for confirmation
Key to watch:
Whether 0.0060 can turn from resistance into support is the core level for T to start the next wave of upward movement.
Right now, the structure is a low-level rebound on increasing volume. It’s relatively positive in the short term, but you still need to guard against profit-taking after a rapid run-up.
1. Bottom Structure
T previously experienced consecutive declines, falling from around 0.0065 all the way to the 0.0032–0.0034 area, where the market repeatedly stopped falling.
Recently:
Trading has been ranging near 0.0033 for a relatively long time;
Volume has been gradually increasing;
Today, volume surged and broke through the 0.0045 and 0.0050 zones;
This indicates that short-term buying momentum has started to strengthen, and market sentiment has begun to repair.
The current trend is similar to:
Bottom consolidation → breakout on increased volume → pullback confirmation → searching for new resistance
Key resistance levels
First resistance: 0.0060–0.0062
The current price is already approaching this area.
This was a previously tight, high-density trading range. If it cannot break through effectively, profit-taking may easily occur.
Watch:
Daily close holds above 0.0060 → the rebound may continue;
A rally that fades back → could pull back to 0.0050.
Second resistance: 0.0065–0.0070
This is the former top region and an important level of trapped positions.
After breaking above 0.0070, the short-term structure will become clearly stronger. The next target is:
Strong resistance: 0.0075–0.0080
If $BTC continues to strengthen, with capital rotating among small-cap tokens, T may have a chance to challenge this region.
Important supports below
🟢 Around 0.0050
This is the first line of defense and also the pullback confirmation area after the breakout.
Holding above 0.0050:
Short-term upward structure remains valid.
🟢 Around 0.0045
An important support zone.
If this level breaks, it means the strength behind this rally was insufficient, and the market may return to consolidation.
🟢 0.0033–0.0035
The core bottom support.
If price falls back into this area again, it suggests the market’s capital push has failed and a new base must be built.
Outlook / Next-step prediction
In the short term:
Slightly bullish consolidation—watch for breakout confirmation.
Possible paths:
Bullish scenario:
Hold above 0.0060
→ Challenge 0.0065–0.0070
→ After a breakout, look for 0.0075–0.0080
Consolidation scenario:
Range trading between 0.0050 and 0.0060
→ Wait for volume to expand further
Bearish scenario:
Break below 0.0050
→ Pull back to 0.0045, or even the 0.0035 area
Trade focus
✅ Short-term focus:
Pull back near 0.0050
Break above 0.0060 for confirmation
Key to watch:
Whether 0.0060 can turn from resistance into support is the core level for T to start the next wave of upward movement.
Right now, the structure is a low-level rebound on increasing volume. It’s relatively positive in the short term, but you still need to guard against profit-taking after a rapid run-up.
3
434
·
--
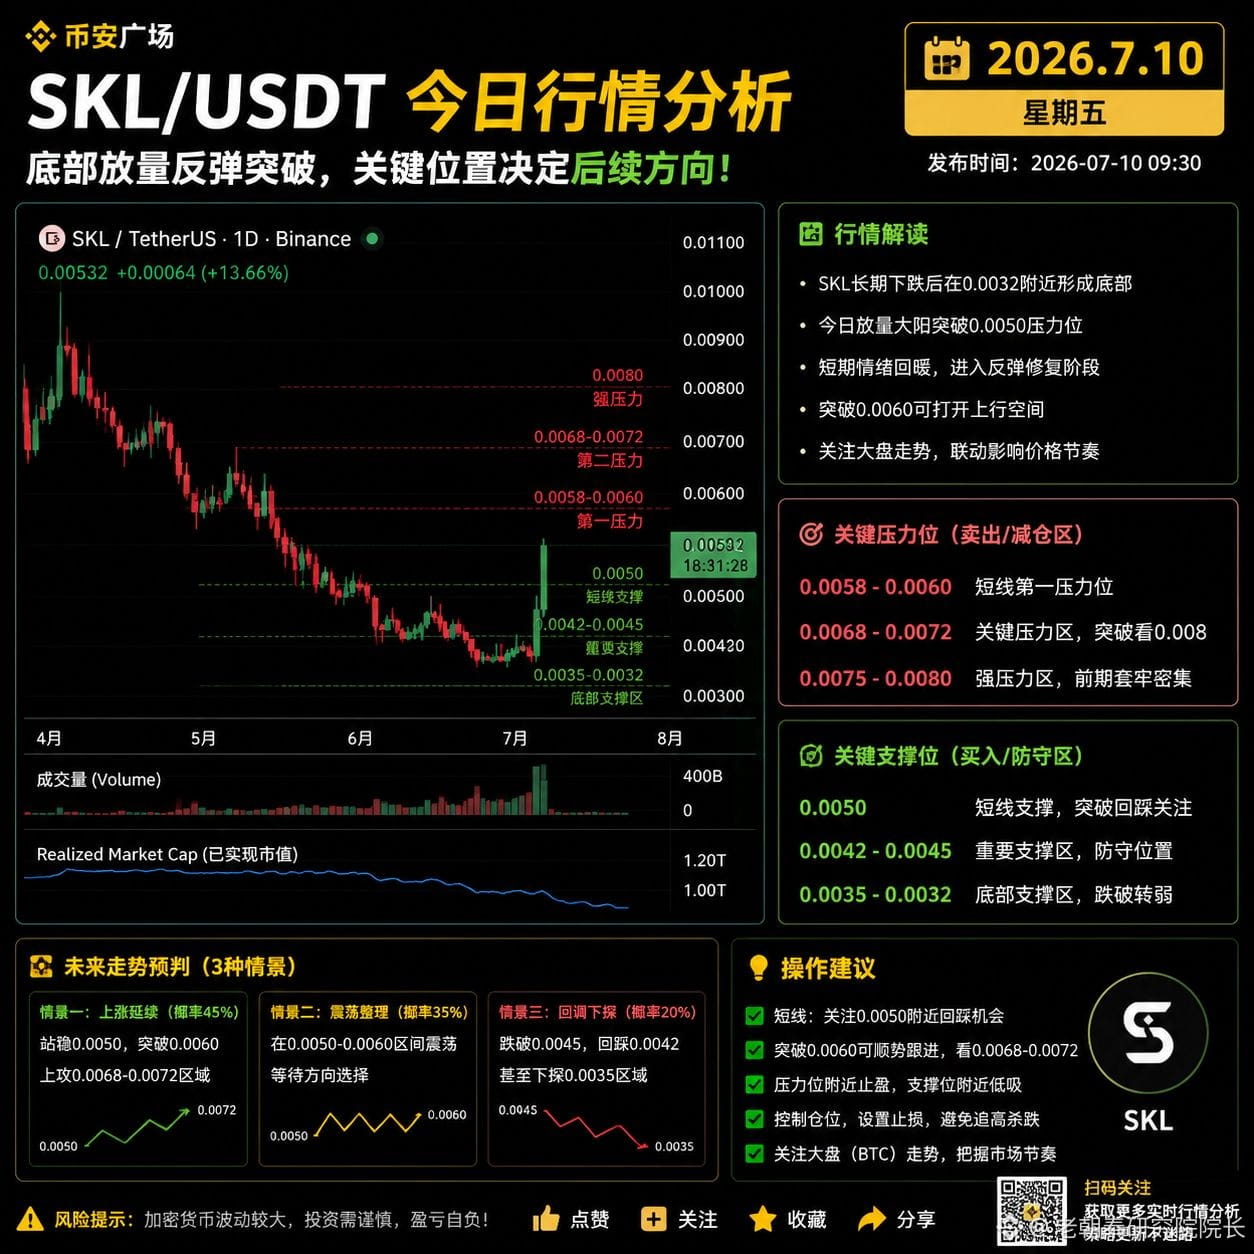
SKL Trend Analysis (Daily)
$SKL previously saw a continuous pullback from the previous high. It bottomed out at around 0.0032, and then entered a long period of sideways consolidation. Recently, the price has shown a clear surge in volume from a low level. The current price is around 0.0053, and the single-day gain exceeds 10%, indicating that low-level funds have begun attempting to enter.
From the structure:
0.0032–0.0035 area: This is the earlier bottom support zone. It has been tested multiple times without breaking, forming a phased bottom.
0.0040–0.0042 area: This was a prior consolidation pressure zone. It has now broken out, turning into short-term support.
After breaking upward, what needs to be watched is whether volume can continue; otherwise, it is easy to see a spike followed by a pullback.
Key resistance levels
First resistance: 0.0058–0.0060
This is the dense trading volume area during the earlier down move.
If the price can hold above 0.0060, it would indicate the short-term rebound is confirmed, with a chance to continue testing higher:
Second resistance: 0.0068–0.0072
This is the area where rebounds were repeatedly rejected in the past, and it is also an important zone of trapped supply.
After breaking through, the next target to watch is:
Strong resistance: 0.0075–0.0080
If $BTC supports the move upward, SKL may enter a trend-repair phase and once again challenge the prior high range.
Important supports below
🟢 Around 0.0050
First short-term support—this is the pullback confirmation area after the breakout.
🟢 0.0042–0.0045
Important defense zone. If the price falls back into this area, it suggests that this rise was more likely a short-term rebound.
🟢 0.0035–0.0032
Long-term bottom support. If it breaks below, the market may return to a weak structure.
Outlook / prediction of the next move
In the short term, SKL has already shown a bottoming with increasing volume. It is expected that over the coming days it will likely:
rise in a range → pull back to confirm → challenge resistance again
Key things to watch:
Hold 0.0050–0.0052: maintain the rebound structure;
Break 0.0060: open up upside space;
Break below 0.0045: the rebound momentum weakens.
Trading idea:
In the short term, you can watch for a pullback opportunity around 0.0050. After a breakout above 0.0060, follow the trend to look for long opportunities. If it attempts to push into the 0.0068–0.0072 zone and meets resistance, consider taking profit in batches.
SKL Trend Analysis (Daily)
$SKL previously saw a continuous pullback from the previous high. It bottomed out at around 0.0032, and then entered a long period of sideways consolidation. Recently, the price has shown a clear surge in volume from a low level. The current price is around 0.0053, and the single-day gain exceeds 10%, indicating that low-level funds have begun attempting to enter.
From the structure:
0.0032–0.0035 area: This is the earlier bottom support zone. It has been tested multiple times without breaking, forming a phased bottom.
0.0040–0.0042 area: This was a prior consolidation pressure zone. It has now broken out, turning into short-term support.
After breaking upward, what needs to be watched is whether volume can continue; otherwise, it is easy to see a spike followed by a pullback.
Key resistance levels
First resistance: 0.0058–0.0060
This is the dense trading volume area during the earlier down move.
If the price can hold above 0.0060, it would indicate the short-term rebound is confirmed, with a chance to continue testing higher:
Second resistance: 0.0068–0.0072
This is the area where rebounds were repeatedly rejected in the past, and it is also an important zone of trapped supply.
After breaking through, the next target to watch is:
Strong resistance: 0.0075–0.0080
If $BTC supports the move upward, SKL may enter a trend-repair phase and once again challenge the prior high range.
Important supports below
🟢 Around 0.0050
First short-term support—this is the pullback confirmation area after the breakout.
🟢 0.0042–0.0045
Important defense zone. If the price falls back into this area, it suggests that this rise was more likely a short-term rebound.
🟢 0.0035–0.0032
Long-term bottom support. If it breaks below, the market may return to a weak structure.
Outlook / prediction of the next move
In the short term, SKL has already shown a bottoming with increasing volume. It is expected that over the coming days it will likely:
rise in a range → pull back to confirm → challenge resistance again
Key things to watch:
Hold 0.0050–0.0052: maintain the rebound structure;
Break 0.0060: open up upside space;
Break below 0.0045: the rebound momentum weakens.
Trading idea:
In the short term, you can watch for a pullback opportunity around 0.0050. After a breakout above 0.0060, follow the trend to look for long opportunities. If it attempts to push into the 0.0068–0.0072 zone and meets resistance, consider taking profit in batches.
$SKL previously saw a continuous pullback from the previous high. It bottomed out at around 0.0032, and then entered a long period of sideways consolidation. Recently, the price has shown a clear surge in volume from a low level. The current price is around 0.0053, and the single-day gain exceeds 10%, indicating that low-level funds have begun attempting to enter.
From the structure:
0.0032–0.0035 area: This is the earlier bottom support zone. It has been tested multiple times without breaking, forming a phased bottom.
0.0040–0.0042 area: This was a prior consolidation pressure zone. It has now broken out, turning into short-term support.
After breaking upward, what needs to be watched is whether volume can continue; otherwise, it is easy to see a spike followed by a pullback.
Key resistance levels
First resistance: 0.0058–0.0060
This is the dense trading volume area during the earlier down move.
If the price can hold above 0.0060, it would indicate the short-term rebound is confirmed, with a chance to continue testing higher:
Second resistance: 0.0068–0.0072
This is the area where rebounds were repeatedly rejected in the past, and it is also an important zone of trapped supply.
After breaking through, the next target to watch is:
Strong resistance: 0.0075–0.0080
If $BTC supports the move upward, SKL may enter a trend-repair phase and once again challenge the prior high range.
Important supports below
🟢 Around 0.0050
First short-term support—this is the pullback confirmation area after the breakout.
🟢 0.0042–0.0045
Important defense zone. If the price falls back into this area, it suggests that this rise was more likely a short-term rebound.
🟢 0.0035–0.0032
Long-term bottom support. If it breaks below, the market may return to a weak structure.
Outlook / prediction of the next move
In the short term, SKL has already shown a bottoming with increasing volume. It is expected that over the coming days it will likely:
rise in a range → pull back to confirm → challenge resistance again
Key things to watch:
Hold 0.0050–0.0052: maintain the rebound structure;
Break 0.0060: open up upside space;
Break below 0.0045: the rebound momentum weakens.
Trading idea:
In the short term, you can watch for a pullback opportunity around 0.0050. After a breakout above 0.0060, follow the trend to look for long opportunities. If it attempts to push into the 0.0068–0.0072 zone and meets resistance, consider taking profit in batches.
1
4
296
·
--
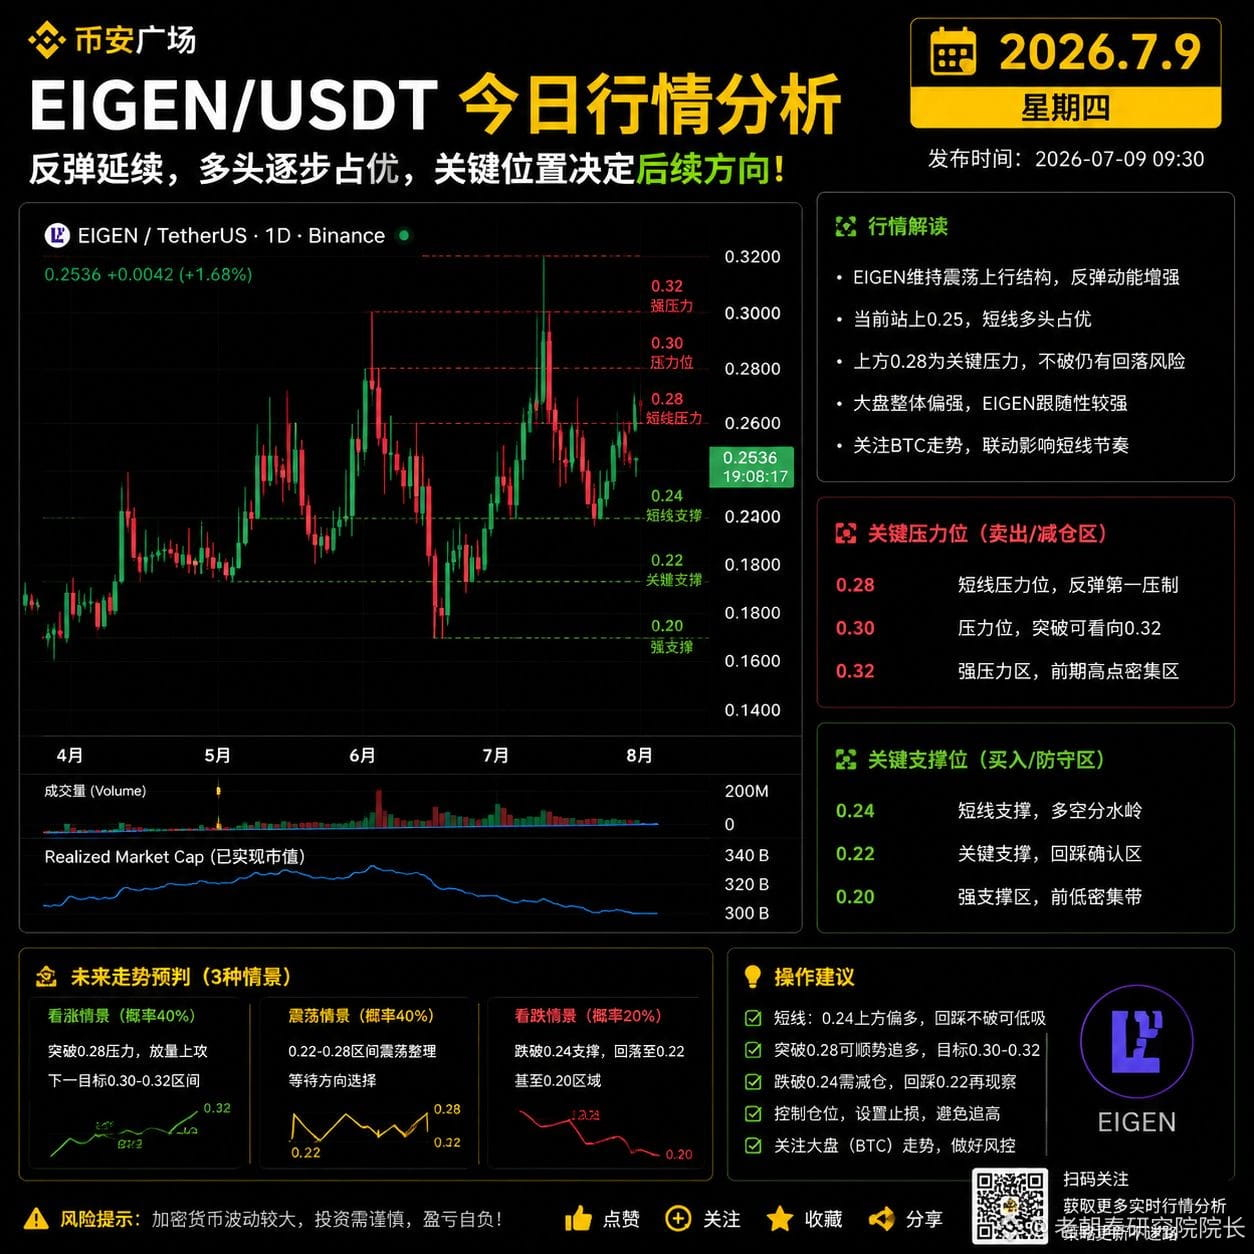
EIGEN Price Action Analysis (Daily)
At the moment, $EIGEN is trading at about 0.2536 USDT. After rebounding from the earlier 0.15 area, it has already formed a clear upward consolidation structure.
1) Trend Structure
EIGEN previously went through a round of deep correction. After dipping to around 0.15, it began to rebound:
• Around 0.15 formed a local bottom;
• The 0.18–0.20 zone saw repeated range-bound buying/accumulation;
• After recently breaking through the 0.22 resistance, it quickly surged to around 0.28;
• Currently, after pulling back, it has moved back above around 0.25.
Overall, it is currently:
In an upward repair phase after a bottom reversal, but it has not yet entered a strong trend acceleration stage.
In the short term, capital is repositioning around the 0.22–0.25 area.
Key Resistance Levels (Above)
First resistance: 0.26–0.28
This is the most important resistance zone right now.
Reasons:
• A dense prior high成交 (trading activity) area;
• The previous surge produced clear selling pressure;
• If it cannot break out with volume, short-term consolidation is likely.
If it breaks above 0.28 and holds:
➡️ The next target is 0.30–0.32
Second resistance: 0.32
0.32 is within the prior trapped zone.
If the overall market strengthens and EIGEN breaks above 0.32, it would confirm that the uptrend is further established, with a chance to challenge higher levels.
Key Support Levels (Below)
First support: 0.24
This is the current short-term bull/bear dividing line:
• Holding 0.24 indicates the upward structure remains intact;
• A break below 0.24 may trigger a pullback for confirmation.
Second support: 0.22
This is a very important level:
• Prior breakout point;
• Multiple sessions’ dense trading area.
If it pulls back near 0.22 and does not break, it can be observed as a potential low-entry area.
Strong support: 0.20
If $BTC shows a correction, EIGEN may test 0.20 again.
If 0.20 is lost, it would suggest the rebound strength is weakening and the market may revert to consolidation.
Outlook / Forward Scenarios
If BTC maintains strength and market risk appetite improves:
Breakout path:
0.28 → 0.30 → 0.32
This would open up a new upward space.
A more likely trading range:
0.22–0.30, trending slightly upward in consolidation.
Key Levels Summary to Watch
🔴 Resistance:
0.28
0.30
0.32
🟢 Support:
0.24
0.22
0.20
EIGEN’s trend is currently leaning bullish, but the key is whether it can break out above 0.28 with volume. If the breakout fails, it is likely to continue consolidating in the 0.22–0.28 range. Overall, it is in a “rebound confirmation phase,” waiting for direction to be decided.
EIGEN Price Action Analysis (Daily)
At the moment, $EIGEN is trading at about 0.2536 USDT. After rebounding from the earlier 0.15 area, it has already formed a clear upward consolidation structure.
1) Trend Structure
EIGEN previously went through a round of deep correction. After dipping to around 0.15, it began to rebound:
• Around 0.15 formed a local bottom;
• The 0.18–0.20 zone saw repeated range-bound buying/accumulation;
• After recently breaking through the 0.22 resistance, it quickly surged to around 0.28;
• Currently, after pulling back, it has moved back above around 0.25.
Overall, it is currently:
In an upward repair phase after a bottom reversal, but it has not yet entered a strong trend acceleration stage.
In the short term, capital is repositioning around the 0.22–0.25 area.
Key Resistance Levels (Above)
First resistance: 0.26–0.28
This is the most important resistance zone right now.
Reasons:
• A dense prior high成交 (trading activity) area;
• The previous surge produced clear selling pressure;
• If it cannot break out with volume, short-term consolidation is likely.
If it breaks above 0.28 and holds:
➡️ The next target is 0.30–0.32
Second resistance: 0.32
0.32 is within the prior trapped zone.
If the overall market strengthens and EIGEN breaks above 0.32, it would confirm that the uptrend is further established, with a chance to challenge higher levels.
Key Support Levels (Below)
First support: 0.24
This is the current short-term bull/bear dividing line:
• Holding 0.24 indicates the upward structure remains intact;
• A break below 0.24 may trigger a pullback for confirmation.
Second support: 0.22
This is a very important level:
• Prior breakout point;
• Multiple sessions’ dense trading area.
If it pulls back near 0.22 and does not break, it can be observed as a potential low-entry area.
Strong support: 0.20
If $BTC shows a correction, EIGEN may test 0.20 again.
If 0.20 is lost, it would suggest the rebound strength is weakening and the market may revert to consolidation.
Outlook / Forward Scenarios
If BTC maintains strength and market risk appetite improves:
Breakout path:
0.28 → 0.30 → 0.32
This would open up a new upward space.
A more likely trading range:
0.22–0.30, trending slightly upward in consolidation.
Key Levels Summary to Watch
🔴 Resistance:
0.28
0.30
0.32
🟢 Support:
0.24
0.22
0.20
EIGEN’s trend is currently leaning bullish, but the key is whether it can break out above 0.28 with volume. If the breakout fails, it is likely to continue consolidating in the 0.22–0.28 range. Overall, it is in a “rebound confirmation phase,” waiting for direction to be decided.
At the moment, $EIGEN is trading at about 0.2536 USDT. After rebounding from the earlier 0.15 area, it has already formed a clear upward consolidation structure.
1) Trend Structure
EIGEN previously went through a round of deep correction. After dipping to around 0.15, it began to rebound:
• Around 0.15 formed a local bottom;
• The 0.18–0.20 zone saw repeated range-bound buying/accumulation;
• After recently breaking through the 0.22 resistance, it quickly surged to around 0.28;
• Currently, after pulling back, it has moved back above around 0.25.
Overall, it is currently:
In an upward repair phase after a bottom reversal, but it has not yet entered a strong trend acceleration stage.
In the short term, capital is repositioning around the 0.22–0.25 area.
Key Resistance Levels (Above)
First resistance: 0.26–0.28
This is the most important resistance zone right now.
Reasons:
• A dense prior high成交 (trading activity) area;
• The previous surge produced clear selling pressure;
• If it cannot break out with volume, short-term consolidation is likely.
If it breaks above 0.28 and holds:
➡️ The next target is 0.30–0.32
Second resistance: 0.32
0.32 is within the prior trapped zone.
If the overall market strengthens and EIGEN breaks above 0.32, it would confirm that the uptrend is further established, with a chance to challenge higher levels.
Key Support Levels (Below)
First support: 0.24
This is the current short-term bull/bear dividing line:
• Holding 0.24 indicates the upward structure remains intact;
• A break below 0.24 may trigger a pullback for confirmation.
Second support: 0.22
This is a very important level:
• Prior breakout point;
• Multiple sessions’ dense trading area.
If it pulls back near 0.22 and does not break, it can be observed as a potential low-entry area.
Strong support: 0.20
If $BTC shows a correction, EIGEN may test 0.20 again.
If 0.20 is lost, it would suggest the rebound strength is weakening and the market may revert to consolidation.
Outlook / Forward Scenarios
If BTC maintains strength and market risk appetite improves:
Breakout path:
0.28 → 0.30 → 0.32
This would open up a new upward space.
A more likely trading range:
0.22–0.30, trending slightly upward in consolidation.
Key Levels Summary to Watch
🔴 Resistance:
0.28
0.30
0.32
🟢 Support:
0.24
0.22
0.20
EIGEN’s trend is currently leaning bullish, but the key is whether it can break out above 0.28 with volume. If the breakout fails, it is likely to continue consolidating in the 0.22–0.28 range. Overall, it is in a “rebound confirmation phase,” waiting for direction to be decided.
3
197
·
--
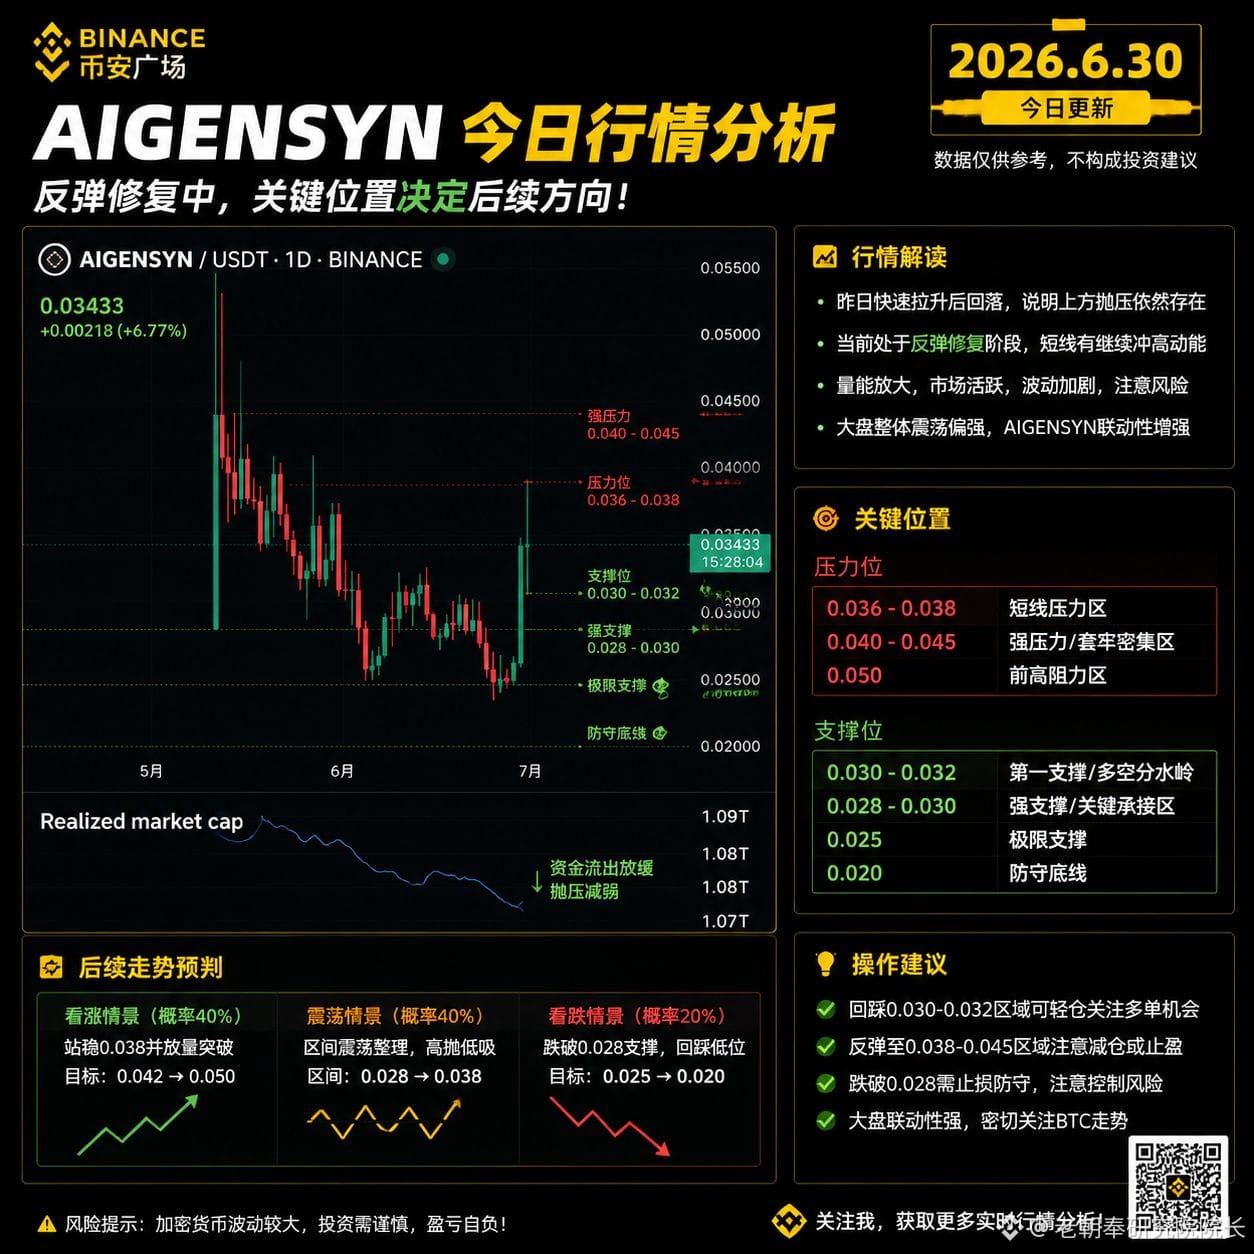
$AIGENSYN is currently around 0.034. It is in a “rebound repair structure after a surge and pullback.” Overall, it still trends slightly upward with choppy volatility, and it is in a phase where capital is probing.
Short-term outlook: After a strong push up yesterday, it quickly pulled back, suggesting heavier overhead selling pressure. However, the lows keep getting higher, and there is still capital stepping in. The market has moved into a “pullback confirmation + then choosing direction” stage.
Key supports:
0.030 (first support / the line separating bulls and bears)
0.028 (strong support; if broken, conditions turn weaker)
0.025 (ultimate defensive level)
Resistance levels:
0.038 (short-term resistance)
0.042 (a dense area near the previous highs)
0.050 (strong resistance zone; only a breakout would confirm a trending move)
Strategy: Before holding above 0.038, treat it as a range-bound market. Only when it breaks through and expands in volume can the second wave up be confirmed. Otherwise, the main approach is to buy near the range lows and sell near the range highs. Also, pay attention to following the market’s linkage with $BTC .
One-sentence overall summary
👉 Currently $AIGENSYN is:
“rebound repair period + range-bound consolidation + high-volatility tug-of-war stage”
This is not a one-way trend, but rather:
a short-term trading environment focused on buying at support and taking profit after spikes
$AIGENSYN is currently around 0.034. It is in a “rebound repair structure after a surge and pullback.” Overall, it still trends slightly upward with choppy volatility, and it is in a phase where capital is probing.
Short-term outlook: After a strong push up yesterday, it quickly pulled back, suggesting heavier overhead selling pressure. However, the lows keep getting higher, and there is still capital stepping in. The market has moved into a “pullback confirmation + then choosing direction” stage.
Key supports:
0.030 (first support / the line separating bulls and bears)
0.028 (strong support; if broken, conditions turn weaker)
0.025 (ultimate defensive level)
Resistance levels:
0.038 (short-term resistance)
0.042 (a dense area near the previous highs)
0.050 (strong resistance zone; only a breakout would confirm a trending move)
Strategy: Before holding above 0.038, treat it as a range-bound market. Only when it breaks through and expands in volume can the second wave up be confirmed. Otherwise, the main approach is to buy near the range lows and sell near the range highs. Also, pay attention to following the market’s linkage with $BTC .
One-sentence overall summary
👉 Currently $AIGENSYN is:
“rebound repair period + range-bound consolidation + high-volatility tug-of-war stage”
This is not a one-way trend, but rather:
a short-term trading environment focused on buying at support and taking profit after spikes
Short-term outlook: After a strong push up yesterday, it quickly pulled back, suggesting heavier overhead selling pressure. However, the lows keep getting higher, and there is still capital stepping in. The market has moved into a “pullback confirmation + then choosing direction” stage.
Key supports:
0.030 (first support / the line separating bulls and bears)
0.028 (strong support; if broken, conditions turn weaker)
0.025 (ultimate defensive level)
Resistance levels:
0.038 (short-term resistance)
0.042 (a dense area near the previous highs)
0.050 (strong resistance zone; only a breakout would confirm a trending move)
Strategy: Before holding above 0.038, treat it as a range-bound market. Only when it breaks through and expands in volume can the second wave up be confirmed. Otherwise, the main approach is to buy near the range lows and sell near the range highs. Also, pay attention to following the market’s linkage with $BTC .
One-sentence overall summary
👉 Currently $AIGENSYN is:
“rebound repair period + range-bound consolidation + high-volatility tug-of-war stage”
This is not a one-way trend, but rather:
a short-term trading environment focused on buying at support and taking profit after spikes
3
339
·
--
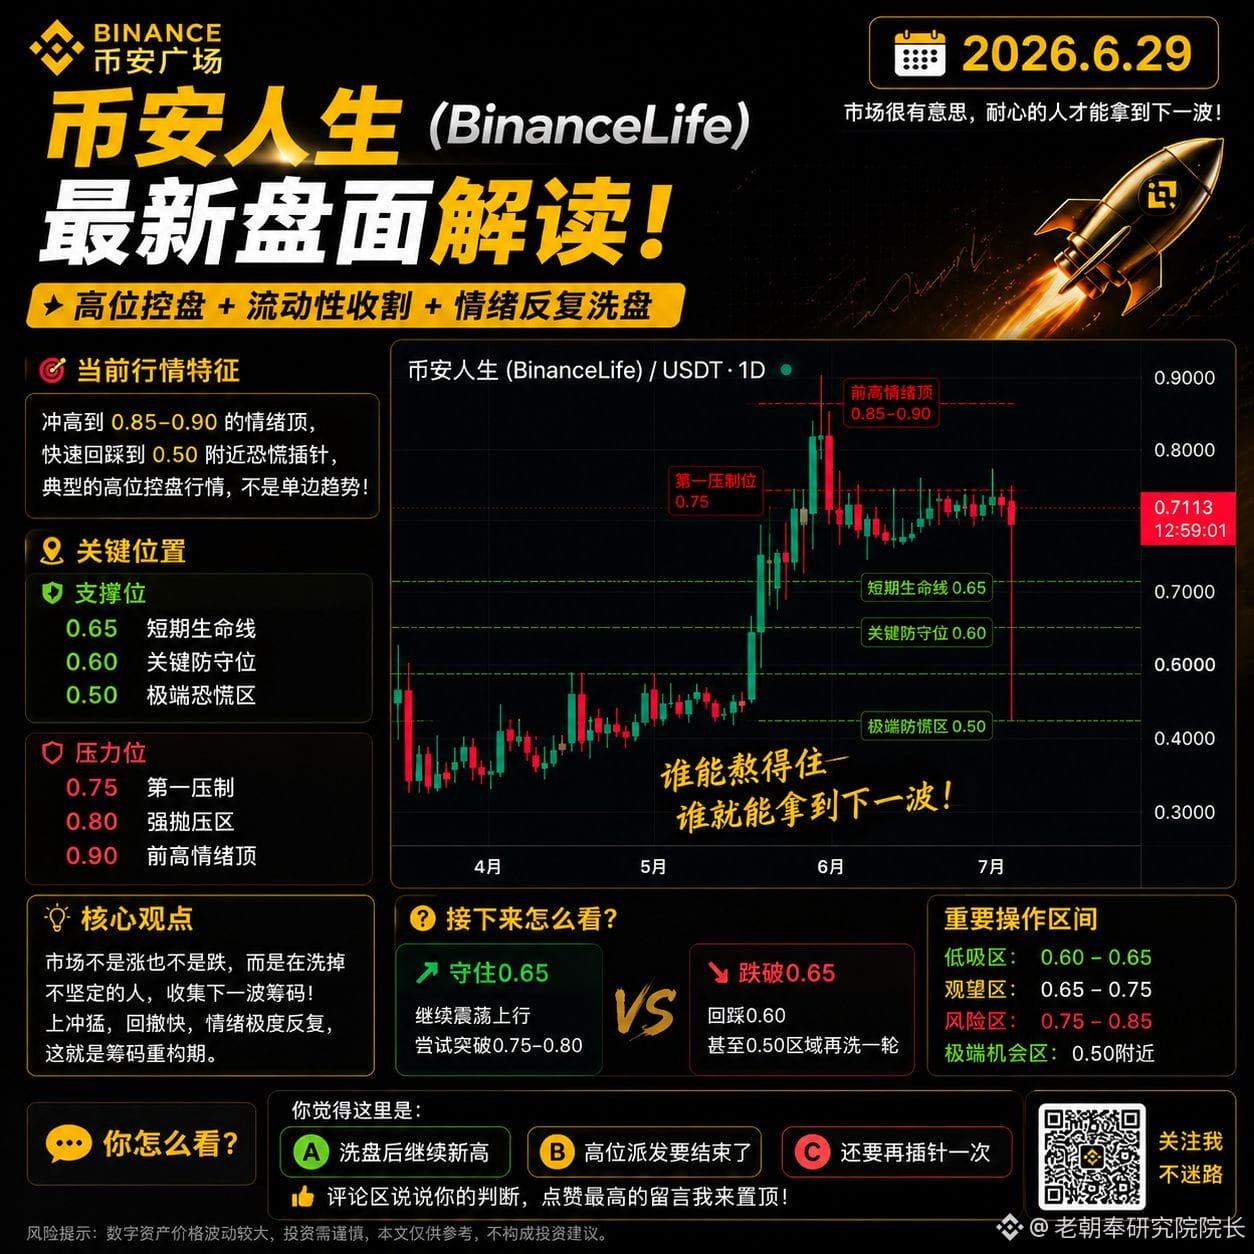
#比特币现货ETF净流出17.9亿美元 $币安人生 最新盘面解读
The market is very interesting right now.
On one side, there is bullish momentum pushing up to the 0.85–0.90 sentiment peak.
On the other side, there’s a rapid pullback to around 0.50 with a panic-wick insertion.
This is not a one-way market. It’s:
“High-level price control + liquidity harvesting + repeated sentiment shakeouts”
📊 Current key levels
📍 Support:
0.65 (short-term lifeline)
0.60 (key defensive level)
0.50 (extreme panic zone)
📍 Resistance:
0.75 (first suppression)
0.80 (heavy sell pressure)
0.90 (previous high sentiment peak)
⚠️ What is the market doing now?
It’s neither going up nor down.
It’s doing one thing:
👉 Shake out the uncommitted + gather the next round of positions (shares)
You’ll see that:
The push up is fierce
The retracement is fast too
Sentiment swings violently and repeatedly
This is exactly a typical “position restructuring period.”
📌 How to look at what comes next?
Two possible paths:
🟢 Hold 0.65 → keep consolidating and pushing upward, attempting a breakout
🔴 Break below 0.65 → pull back to the 0.60 and even 0.50 area for another shakeout
💡 One-sentence summary:
This is not a trend-following market. It’s a “who can last” market.
#比特币现货ETF净流出17.9亿美元 $币安人生 最新盘面解读
The market is very interesting right now.
On one side, there is bullish momentum pushing up to the 0.85–0.90 sentiment peak.
On the other side, there’s a rapid pullback to around 0.50 with a panic-wick insertion.
This is not a one-way market. It’s:
“High-level price control + liquidity harvesting + repeated sentiment shakeouts”
📊 Current key levels
📍 Support:
0.65 (short-term lifeline)
0.60 (key defensive level)
0.50 (extreme panic zone)
📍 Resistance:
0.75 (first suppression)
0.80 (heavy sell pressure)
0.90 (previous high sentiment peak)
⚠️ What is the market doing now?
It’s neither going up nor down.
It’s doing one thing:
👉 Shake out the uncommitted + gather the next round of positions (shares)
You’ll see that:
The push up is fierce
The retracement is fast too
Sentiment swings violently and repeatedly
This is exactly a typical “position restructuring period.”
📌 How to look at what comes next?
Two possible paths:
🟢 Hold 0.65 → keep consolidating and pushing upward, attempting a breakout
🔴 Break below 0.65 → pull back to the 0.60 and even 0.50 area for another shakeout
💡 One-sentence summary:
This is not a trend-following market. It’s a “who can last” market.
The market is very interesting right now.
On one side, there is bullish momentum pushing up to the 0.85–0.90 sentiment peak.
On the other side, there’s a rapid pullback to around 0.50 with a panic-wick insertion.
This is not a one-way market. It’s:
“High-level price control + liquidity harvesting + repeated sentiment shakeouts”
📊 Current key levels
📍 Support:
0.65 (short-term lifeline)
0.60 (key defensive level)
0.50 (extreme panic zone)
📍 Resistance:
0.75 (first suppression)
0.80 (heavy sell pressure)
0.90 (previous high sentiment peak)
⚠️ What is the market doing now?
It’s neither going up nor down.
It’s doing one thing:
👉 Shake out the uncommitted + gather the next round of positions (shares)
You’ll see that:
The push up is fierce
The retracement is fast too
Sentiment swings violently and repeatedly
This is exactly a typical “position restructuring period.”
📌 How to look at what comes next?
Two possible paths:
🟢 Hold 0.65 → keep consolidating and pushing upward, attempting a breakout
🔴 Break below 0.65 → pull back to the 0.60 and even 0.50 area for another shakeout
💡 One-sentence summary:
This is not a trend-following market. It’s a “who can last” market.
2
203
·
--
#SpaceX evaporated $600 billion
Today's analysis $SPCXB
The overall structure is a classic “high-volume pullback + weak rebound after a second breakdown,” and it has not fully exited the downtrend yet.
1. Current Trend Structure Assessment
Previous: From low volatility → Rapid surge to the 200+ zone
Then: Clear double top/high distribution structure appeared
Now: Has broken through multiple moving average supports, dropping to around 145
Current rebound: This is a super oversold corrective pullback, not a trend reversal
👉 Conclusion:
We are still in a rebound phase within a downtrend (B-wave/correction wave)
2. Key Resistance Levels (Above)
These levels are crucial for whether the subsequent rebound can strengthen:
150–153: Short-term first resistance (currently nearby)
160–165: Strong/weak dividing line (decides if it turns into a range)
175–180: Previous round of downtrend central pressure
195–200: Trend-level pressure (won't reverse without reclaiming this)
3. Key Support Levels (Below)
If the rebound fails, it will continue to weaken:
145: Current low support (short-term lifeline)
140: Second defense level (breaking this will accelerate decline)
130–135: Previous low structural support zone
Below 120: Extreme liquidity support (risk zone)
4. Important Positions and Trading Logic (Core)
1️⃣ Aggressive Bullish
Only suitable for:
145–140 scale-in long
Stop-loss:
Clearly set below 140
Target:
150 → 160 (rebound wave)
2️⃣ Range Trading Strategy (safer)
Currently more reasonable is:
Trading within the 145–160 range
High sell, low buy, rather than chasing a one-sided move
3️⃣ Risk Control Focus
Not recommended to:
Chase long in the 155–165 range (easy to catch the tail end of a rebound)
If it breaks below 140:
The structure will turn into an accelerating down move
5. Combining Today's Market Logic (Macroeconomic Impact)
If the current market is:
BTC/ETH relatively weak or ranging
Altcoin capital rotation not strong
👉 $SPCXB typically:
Weak rebound + strong following drop
More of an “emotion-driven asset”
In summary:
👉 Currently, $SPCXB is still in a technical rebound phase after a downtrend
The key is whether it can hold 150 → can it break 160
Otherwise, it will likely continue to range between 145–130 or test the lows again.
#SpaceX evaporated $600 billion
Today's analysis $SPCXB
The overall structure is a classic “high-volume pullback + weak rebound after a second breakdown,” and it has not fully exited the downtrend yet.
1. Current Trend Structure Assessment
Previous: From low volatility → Rapid surge to the 200+ zone
Then: Clear double top/high distribution structure appeared
Now: Has broken through multiple moving average supports, dropping to around 145
Current rebound: This is a super oversold corrective pullback, not a trend reversal
👉 Conclusion:
We are still in a rebound phase within a downtrend (B-wave/correction wave)
2. Key Resistance Levels (Above)
These levels are crucial for whether the subsequent rebound can strengthen:
150–153: Short-term first resistance (currently nearby)
160–165: Strong/weak dividing line (decides if it turns into a range)
175–180: Previous round of downtrend central pressure
195–200: Trend-level pressure (won't reverse without reclaiming this)
3. Key Support Levels (Below)
If the rebound fails, it will continue to weaken:
145: Current low support (short-term lifeline)
140: Second defense level (breaking this will accelerate decline)
130–135: Previous low structural support zone
Below 120: Extreme liquidity support (risk zone)
4. Important Positions and Trading Logic (Core)
1️⃣ Aggressive Bullish
Only suitable for:
145–140 scale-in long
Stop-loss:
Clearly set below 140
Target:
150 → 160 (rebound wave)
2️⃣ Range Trading Strategy (safer)
Currently more reasonable is:
Trading within the 145–160 range
High sell, low buy, rather than chasing a one-sided move
3️⃣ Risk Control Focus
Not recommended to:
Chase long in the 155–165 range (easy to catch the tail end of a rebound)
If it breaks below 140:
The structure will turn into an accelerating down move
5. Combining Today's Market Logic (Macroeconomic Impact)
If the current market is:
BTC/ETH relatively weak or ranging
Altcoin capital rotation not strong
👉 $SPCXB typically:
Weak rebound + strong following drop
More of an “emotion-driven asset”
In summary:
👉 Currently, $SPCXB is still in a technical rebound phase after a downtrend
The key is whether it can hold 150 → can it break 160
Otherwise, it will likely continue to range between 145–130 or test the lows again.
Today's analysis $SPCXB
The overall structure is a classic “high-volume pullback + weak rebound after a second breakdown,” and it has not fully exited the downtrend yet.
1. Current Trend Structure Assessment
Previous: From low volatility → Rapid surge to the 200+ zone
Then: Clear double top/high distribution structure appeared
Now: Has broken through multiple moving average supports, dropping to around 145
Current rebound: This is a super oversold corrective pullback, not a trend reversal
👉 Conclusion:
We are still in a rebound phase within a downtrend (B-wave/correction wave)
2. Key Resistance Levels (Above)
These levels are crucial for whether the subsequent rebound can strengthen:
150–153: Short-term first resistance (currently nearby)
160–165: Strong/weak dividing line (decides if it turns into a range)
175–180: Previous round of downtrend central pressure
195–200: Trend-level pressure (won't reverse without reclaiming this)
3. Key Support Levels (Below)
If the rebound fails, it will continue to weaken:
145: Current low support (short-term lifeline)
140: Second defense level (breaking this will accelerate decline)
130–135: Previous low structural support zone
Below 120: Extreme liquidity support (risk zone)
4. Important Positions and Trading Logic (Core)
1️⃣ Aggressive Bullish
Only suitable for:
145–140 scale-in long
Stop-loss:
Clearly set below 140
Target:
150 → 160 (rebound wave)
2️⃣ Range Trading Strategy (safer)
Currently more reasonable is:
Trading within the 145–160 range
High sell, low buy, rather than chasing a one-sided move
3️⃣ Risk Control Focus
Not recommended to:
Chase long in the 155–165 range (easy to catch the tail end of a rebound)
If it breaks below 140:
The structure will turn into an accelerating down move
5. Combining Today's Market Logic (Macroeconomic Impact)
If the current market is:
BTC/ETH relatively weak or ranging
Altcoin capital rotation not strong
👉 $SPCXB typically:
Weak rebound + strong following drop
More of an “emotion-driven asset”
In summary:
👉 Currently, $SPCXB is still in a technical rebound phase after a downtrend
The key is whether it can hold 150 → can it break 160
Otherwise, it will likely continue to range between 145–130 or test the lows again.

3
485
·
--
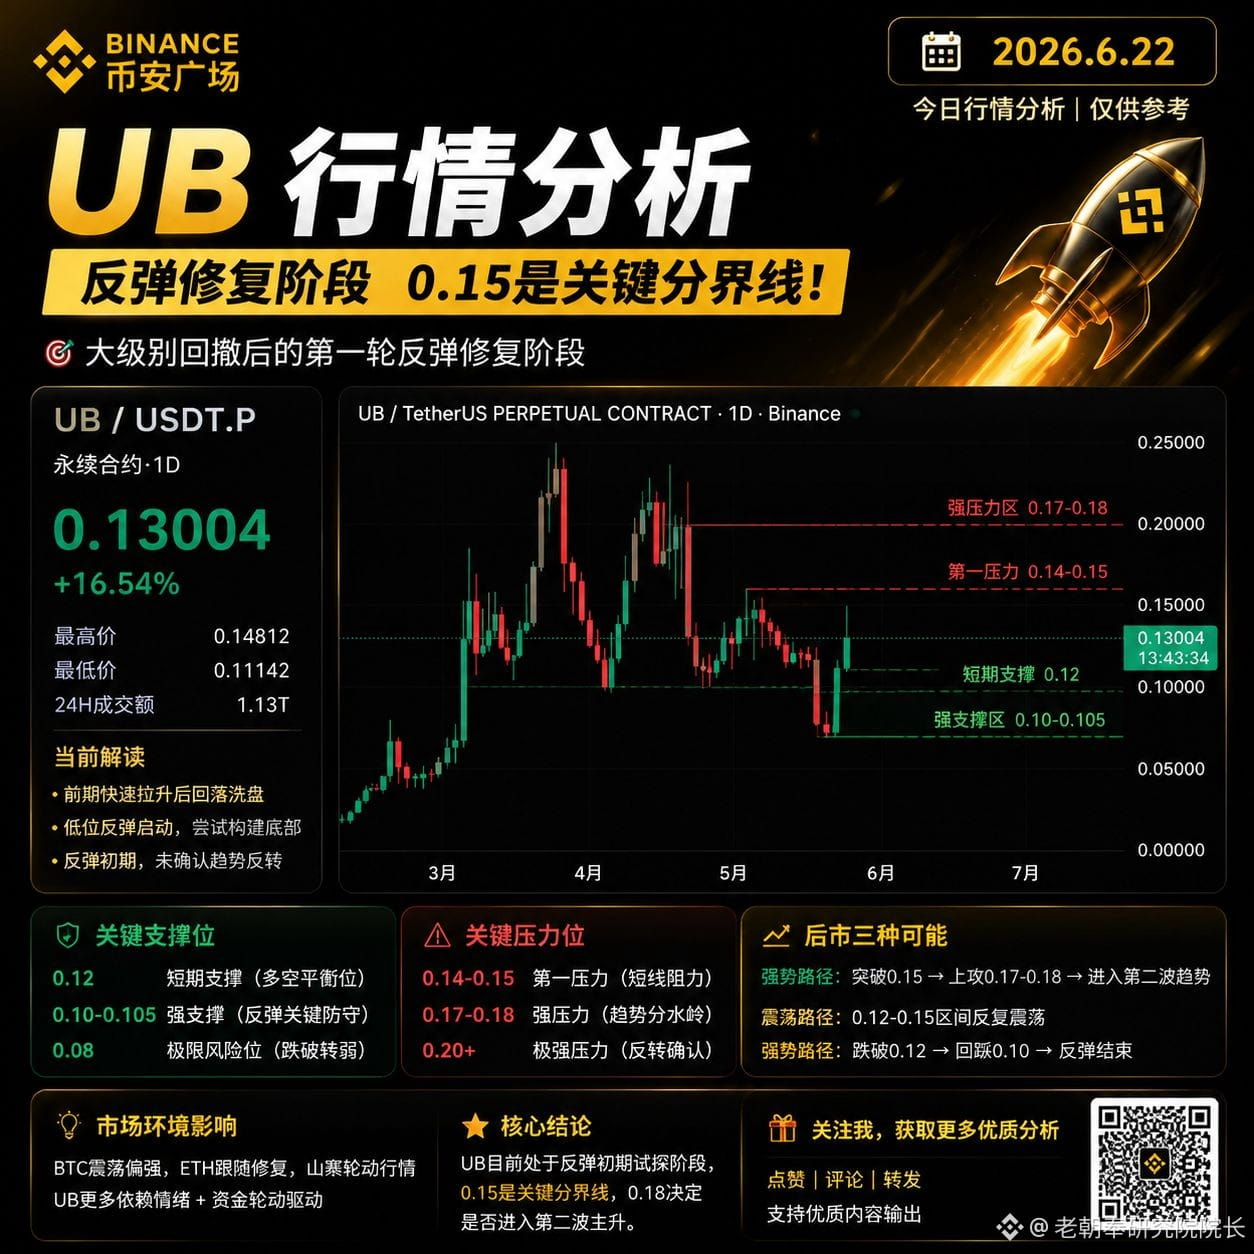
$UB Market Analysis
$UB is currently in: the first round of rebound recovery after a major pullback.
From the charts, after a rapid surge, we saw a pullback and consolidation. It’s now attempting to build a short-term bottom structure, typical of an "emotional recovery + liquidity probing" phase.
🔍 Current Trend Analysis
Previous Phase: Volume spike → Clear distribution structure
Mid Phase: Continuous pullback → Liquidity washout
Current: Low-level rebound initiation (first round of recovery)
👉 Key Points:
The current rebound has not yet confirmed a trend reversal; it's merely a technical recovery.
📌 Key Levels (Important to Note)
🔴 Resistance Zone Above
0.14 – 0.15 (first resistance)
👉 Short-term spikes may face obstacles
0.17 – 0.18 (strong resistance)
👉 Trend watershed; if it doesn’t break this level, it’s still seen as a bounce
0.20+ (extremely strong resistance)
👉 Only a breakthrough counts as a trend reversal
🟢 Support Zone Below
0.12 (short-term lifeline)
👉 Current balance point between bulls and bears
0.10 – 0.105 (strong support)
👉 Breaking below this level invalidates the rebound structure
📈 Three Possible Market Directions Ahead
✔️ Strong Path
Volume breakthrough at 0.15 → Targeting 0.17–0.18 → Entering the second wave trend
⚖️ Range-Bound Path (currently the highest probability)
Consolidation between 0.12–0.15, waiting for market direction
❌ Weak Path
Break below 0.12 → Retrace to 0.10 → End of the rebound
🌍 Market Environment Impact
The overall market is currently in:
BTC in a strong consolidation
ETH following recovery
Altcoins in rotation
👉 UB is more reliant on:
Sentiment + liquidity rotation driving it, rather than a bull market push
🧠 Core Conclusion
👉 UB is currently in:
"Early rebound probing phase; 0.15 is the critical dividing line, and 0.18 will determine whether we enter the second major rally."
$UB Market Analysis
$UB is currently in: the first round of rebound recovery after a major pullback.
From the charts, after a rapid surge, we saw a pullback and consolidation. It’s now attempting to build a short-term bottom structure, typical of an "emotional recovery + liquidity probing" phase.
🔍 Current Trend Analysis
Previous Phase: Volume spike → Clear distribution structure
Mid Phase: Continuous pullback → Liquidity washout
Current: Low-level rebound initiation (first round of recovery)
👉 Key Points:
The current rebound has not yet confirmed a trend reversal; it's merely a technical recovery.
📌 Key Levels (Important to Note)
🔴 Resistance Zone Above
0.14 – 0.15 (first resistance)
👉 Short-term spikes may face obstacles
0.17 – 0.18 (strong resistance)
👉 Trend watershed; if it doesn’t break this level, it’s still seen as a bounce
0.20+ (extremely strong resistance)
👉 Only a breakthrough counts as a trend reversal
🟢 Support Zone Below
0.12 (short-term lifeline)
👉 Current balance point between bulls and bears
0.10 – 0.105 (strong support)
👉 Breaking below this level invalidates the rebound structure
📈 Three Possible Market Directions Ahead
✔️ Strong Path
Volume breakthrough at 0.15 → Targeting 0.17–0.18 → Entering the second wave trend
⚖️ Range-Bound Path (currently the highest probability)
Consolidation between 0.12–0.15, waiting for market direction
❌ Weak Path
Break below 0.12 → Retrace to 0.10 → End of the rebound
🌍 Market Environment Impact
The overall market is currently in:
BTC in a strong consolidation
ETH following recovery
Altcoins in rotation
👉 UB is more reliant on:
Sentiment + liquidity rotation driving it, rather than a bull market push
🧠 Core Conclusion
👉 UB is currently in:
"Early rebound probing phase; 0.15 is the critical dividing line, and 0.18 will determine whether we enter the second major rally."
$UB is currently in: the first round of rebound recovery after a major pullback.
From the charts, after a rapid surge, we saw a pullback and consolidation. It’s now attempting to build a short-term bottom structure, typical of an "emotional recovery + liquidity probing" phase.
🔍 Current Trend Analysis
Previous Phase: Volume spike → Clear distribution structure
Mid Phase: Continuous pullback → Liquidity washout
Current: Low-level rebound initiation (first round of recovery)
👉 Key Points:
The current rebound has not yet confirmed a trend reversal; it's merely a technical recovery.
📌 Key Levels (Important to Note)
🔴 Resistance Zone Above
0.14 – 0.15 (first resistance)
👉 Short-term spikes may face obstacles
0.17 – 0.18 (strong resistance)
👉 Trend watershed; if it doesn’t break this level, it’s still seen as a bounce
0.20+ (extremely strong resistance)
👉 Only a breakthrough counts as a trend reversal
🟢 Support Zone Below
0.12 (short-term lifeline)
👉 Current balance point between bulls and bears
0.10 – 0.105 (strong support)
👉 Breaking below this level invalidates the rebound structure
📈 Three Possible Market Directions Ahead
✔️ Strong Path
Volume breakthrough at 0.15 → Targeting 0.17–0.18 → Entering the second wave trend
⚖️ Range-Bound Path (currently the highest probability)
Consolidation between 0.12–0.15, waiting for market direction
❌ Weak Path
Break below 0.12 → Retrace to 0.10 → End of the rebound
🌍 Market Environment Impact
The overall market is currently in:
BTC in a strong consolidation
ETH following recovery
Altcoins in rotation
👉 UB is more reliant on:
Sentiment + liquidity rotation driving it, rather than a bull market push
🧠 Core Conclusion
👉 UB is currently in:
"Early rebound probing phase; 0.15 is the critical dividing line, and 0.18 will determine whether we enter the second major rally."
5
894
·
--
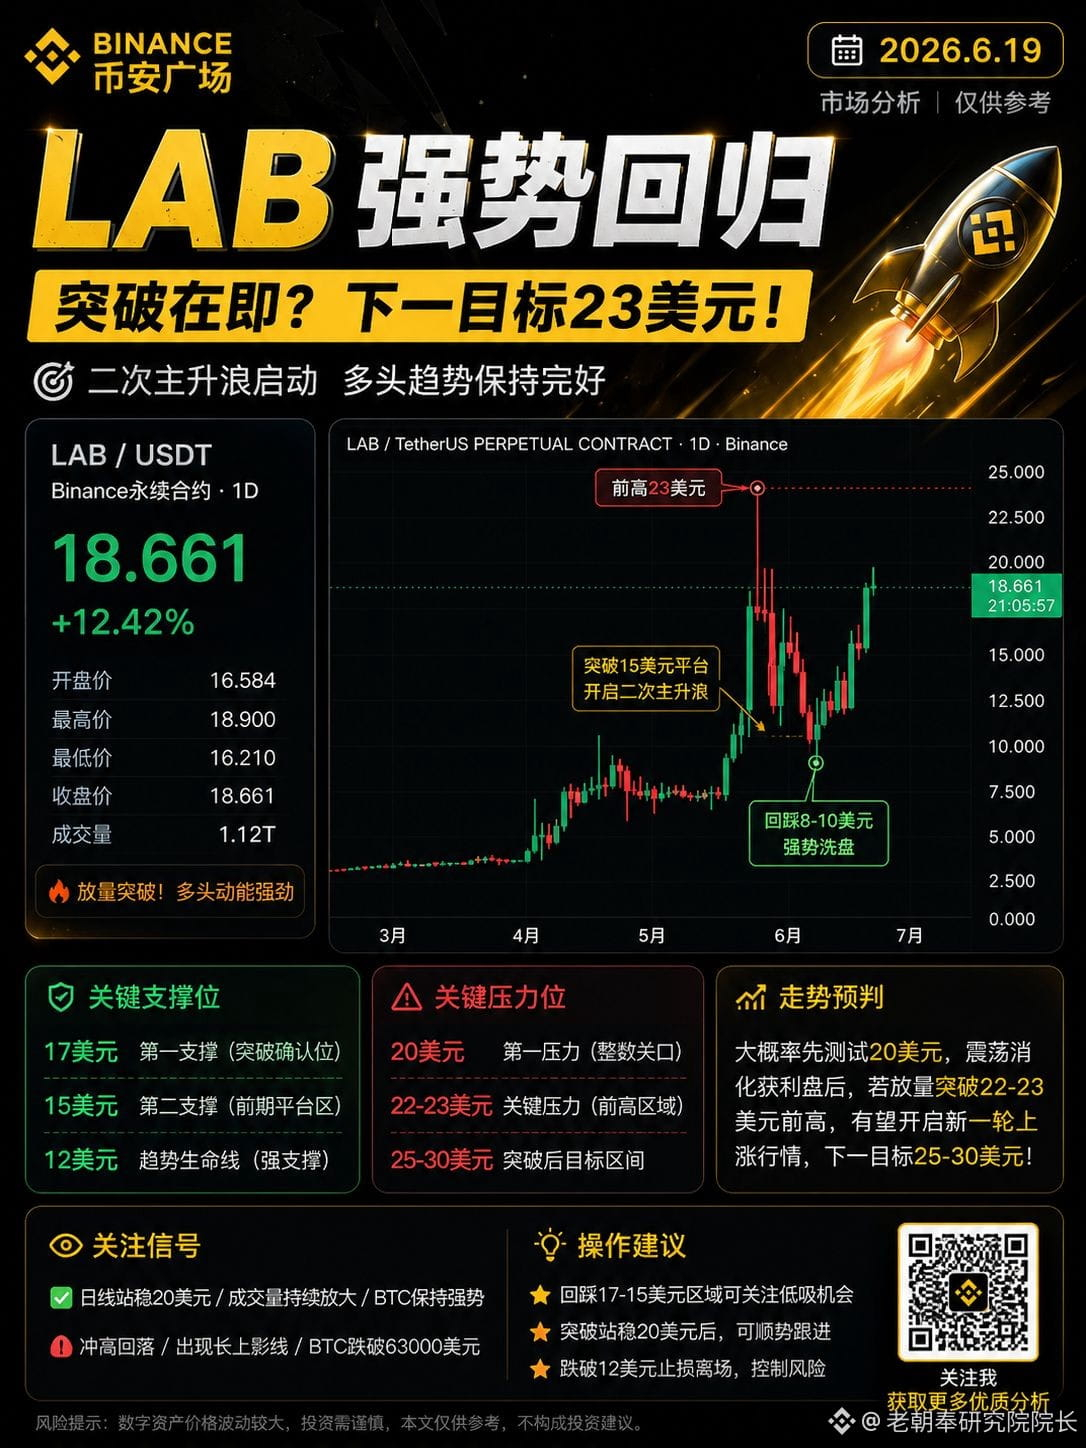
#LAB $LAB (2026.6.19) Trend Analysis
Given the recent market environment and the fact that $BTC is currently oscillating around $63,000, $LAB remains one of the strong coins with high liquidity in the market.
From a structural perspective, LAB has experienced:
Long-term consolidation around $5
The first wave surged to $23
A pullback to the $8-10 range for a shakeout
A breakout past the $15 resistance level
Currently, the price is above $18, which is typical for a secondary bullish wave.
What do we think about the current trend?
The last two daily candles have shown substantial volume increases, indicating that funds have not exited the market.
However, it’s important to note:
We are now close to a previous area of heavy accumulation.
So the short-term trend is more likely to be:
Consolidation around $20 → Digesting profit-taking → Then deciding on direction
Rather than a straight line upward.
Important resistance levels:
First resistance: $20
A key psychological level.
The spot where bulls and bears battle most fiercely in the short term.
Second resistance: $22-23
The previous high area.
Also the most critical resistance level.
If we break out with volume:
The market will enter a price discovery phase.
Next targets:
$25
$28
$30
Important support levels:
First support: $17
Confirmation level for the recent breakout.
As long as we hold above $17, the bullish structure remains intact.
Second support: $15
The previous platform area.
A drop back here would be a normal pullback.
Trend lifeline: $12
If we break below $12:
It means the current bullish structure is invalidated.
One-week forecast:
My judgment:
It’s highly likely we first test $20.
If BTC continues to show strength:
LAB has a chance to challenge the previous highs of $22-23.
If we break above $23:
Market sentiment may reignite.
Summary:
LAB is currently still in a secondary bullish wave structure, with $17 as a short-term bullish defense level, and $20 being the most crucial breakout point. If we hold above $20 with volume, we could see a challenge of the previous highs around $22-23; if we break the previous high, $25-$30 will become the new target range. In the short term, focus on the battle around $20, which will determine whether we enter a new bullish phase or a high-level consolidation. From a technical structure standpoint, the trend remains bullish.
#LAB $LAB (2026.6.19) Trend Analysis
Given the recent market environment and the fact that $BTC is currently oscillating around $63,000, $LAB remains one of the strong coins with high liquidity in the market.
From a structural perspective, LAB has experienced:
Long-term consolidation around $5
The first wave surged to $23
A pullback to the $8-10 range for a shakeout
A breakout past the $15 resistance level
Currently, the price is above $18, which is typical for a secondary bullish wave.
What do we think about the current trend?
The last two daily candles have shown substantial volume increases, indicating that funds have not exited the market.
However, it’s important to note:
We are now close to a previous area of heavy accumulation.
So the short-term trend is more likely to be:
Consolidation around $20 → Digesting profit-taking → Then deciding on direction
Rather than a straight line upward.
Important resistance levels:
First resistance: $20
A key psychological level.
The spot where bulls and bears battle most fiercely in the short term.
Second resistance: $22-23
The previous high area.
Also the most critical resistance level.
If we break out with volume:
The market will enter a price discovery phase.
Next targets:
$25
$28
$30
Important support levels:
First support: $17
Confirmation level for the recent breakout.
As long as we hold above $17, the bullish structure remains intact.
Second support: $15
The previous platform area.
A drop back here would be a normal pullback.
Trend lifeline: $12
If we break below $12:
It means the current bullish structure is invalidated.
One-week forecast:
My judgment:
It’s highly likely we first test $20.
If BTC continues to show strength:
LAB has a chance to challenge the previous highs of $22-23.
If we break above $23:
Market sentiment may reignite.
Summary:
LAB is currently still in a secondary bullish wave structure, with $17 as a short-term bullish defense level, and $20 being the most crucial breakout point. If we hold above $20 with volume, we could see a challenge of the previous highs around $22-23; if we break the previous high, $25-$30 will become the new target range. In the short term, focus on the battle around $20, which will determine whether we enter a new bullish phase or a high-level consolidation. From a technical structure standpoint, the trend remains bullish.
Given the recent market environment and the fact that $BTC is currently oscillating around $63,000, $LAB remains one of the strong coins with high liquidity in the market.
From a structural perspective, LAB has experienced:
Long-term consolidation around $5
The first wave surged to $23
A pullback to the $8-10 range for a shakeout
A breakout past the $15 resistance level
Currently, the price is above $18, which is typical for a secondary bullish wave.
What do we think about the current trend?
The last two daily candles have shown substantial volume increases, indicating that funds have not exited the market.
However, it’s important to note:
We are now close to a previous area of heavy accumulation.
So the short-term trend is more likely to be:
Consolidation around $20 → Digesting profit-taking → Then deciding on direction
Rather than a straight line upward.
Important resistance levels:
First resistance: $20
A key psychological level.
The spot where bulls and bears battle most fiercely in the short term.
Second resistance: $22-23
The previous high area.
Also the most critical resistance level.
If we break out with volume:
The market will enter a price discovery phase.
Next targets:
$25
$28
$30
Important support levels:
First support: $17
Confirmation level for the recent breakout.
As long as we hold above $17, the bullish structure remains intact.
Second support: $15
The previous platform area.
A drop back here would be a normal pullback.
Trend lifeline: $12
If we break below $12:
It means the current bullish structure is invalidated.
One-week forecast:
My judgment:
It’s highly likely we first test $20.
If BTC continues to show strength:
LAB has a chance to challenge the previous highs of $22-23.
If we break above $23:
Market sentiment may reignite.
Summary:
LAB is currently still in a secondary bullish wave structure, with $17 as a short-term bullish defense level, and $20 being the most crucial breakout point. If we hold above $20 with volume, we could see a challenge of the previous highs around $22-23; if we break the previous high, $25-$30 will become the new target range. In the short term, focus on the battle around $20, which will determine whether we enter a new bullish phase or a high-level consolidation. From a technical structure standpoint, the trend remains bullish.
3
422
·
--
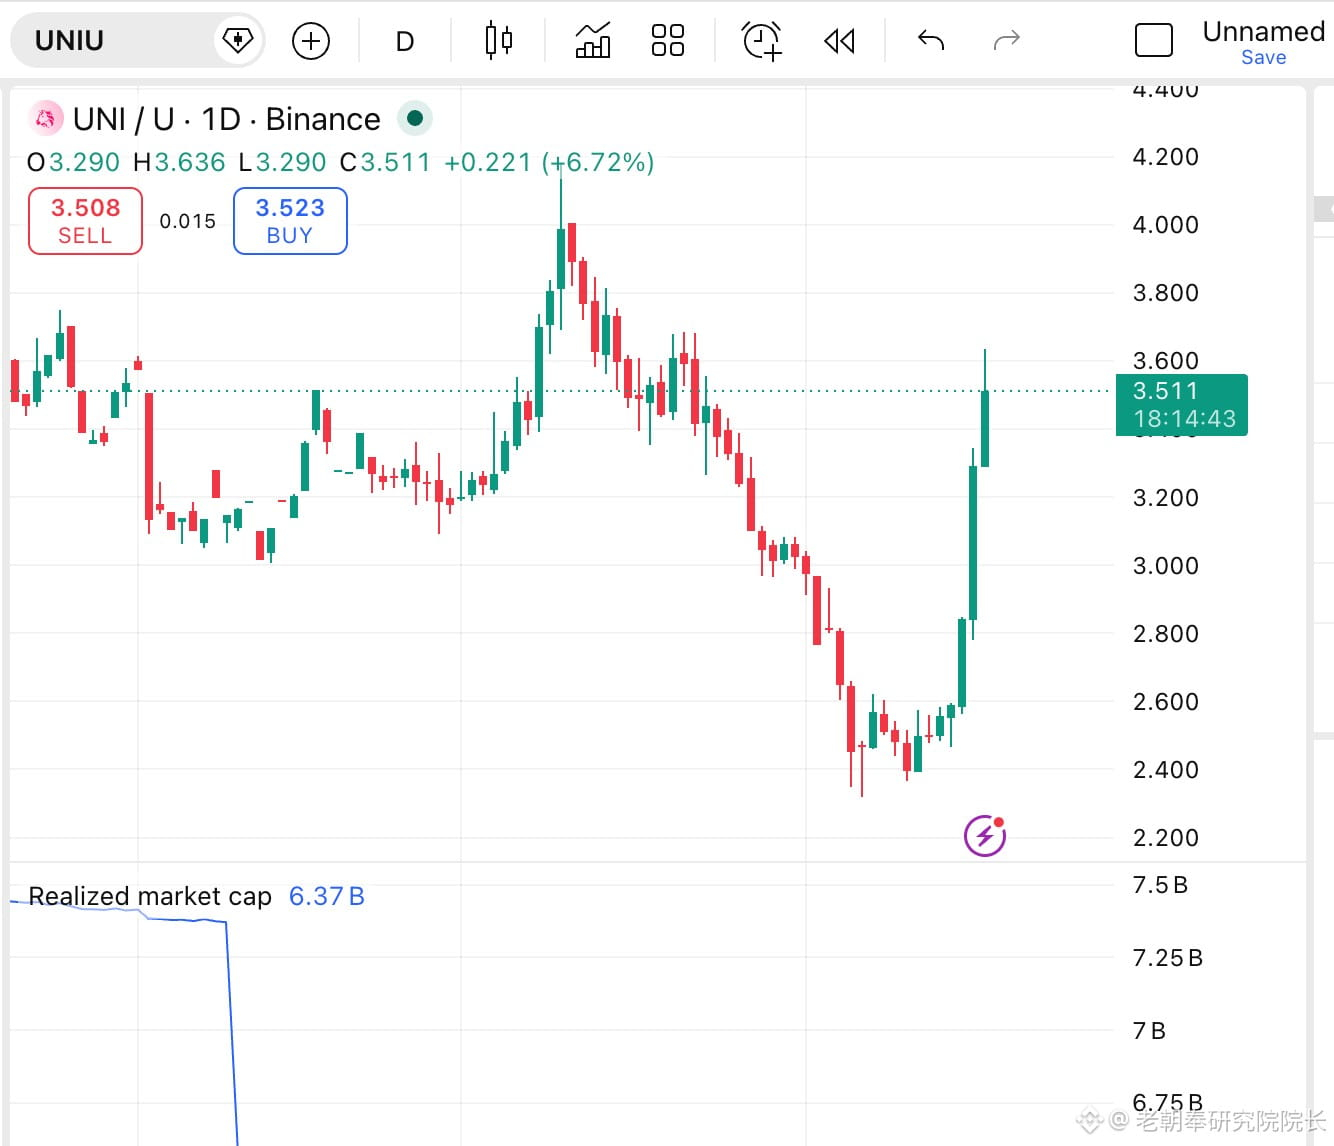
The daily candlestick for #UNI涨22%至3.28美元 $UNI today represents a significant volume breakout bullish candle, with the price rapidly surging from around 2.5 to above 3.5, approaching a daily gain of 20%, clearly outperforming the market and most major altcoins. With BTC and ETH stabilizing and rebounding recently, and the market's risk appetite returning, UNI has entered a strong phase in the short term.
Trend Analysis
The key focus now is whether $UNI can hold above $3.50.
If it maintains a range between $3.40 and $3.50 over the next 1-3 days, this rally is likely not just a simple dead cat bounce, but a signal for the start of a new bullish wave.
Given the large daily gains, short-term pullbacks are possible before continuing the upward trend.
Important Support Levels
First Support: $3.30
Confirmation level for the pullback after the breakout.
Second Support: $3.00
The platform level for this round of upward movement.
Strong Support: $2.60
If it drops back here, it indicates a failure of the current breakout.
Important Resistance Levels
First Resistance: $3.80
Previous dense trading zone.
Second Resistance: $4.00
A round number and prior high area.
Strong Resistance: $4.20-$4.30
If it breaks above $4, the target will directly look towards this area.
Future Expectations
As long as BTC remains oscillating above $65,000, UNI is expected to continue its upward momentum. The most ideal short-term trend is:
Consolidation at $3.3-$3.5 → Breakout at $3.8 → Challenge $4
In terms of strategy, it is not advisable to chase the highs; waiting for a pullback confirmation around $3.3-$3.4 would be safer. If it breaks out with volume above $4, UNI has the potential to become one of the leading players in this DeFi sector rally.
The daily candlestick for #UNI涨22%至3.28美元 $UNI today represents a significant volume breakout bullish candle, with the price rapidly surging from around 2.5 to above 3.5, approaching a daily gain of 20%, clearly outperforming the market and most major altcoins. With BTC and ETH stabilizing and rebounding recently, and the market's risk appetite returning, UNI has entered a strong phase in the short term.
Trend Analysis
The key focus now is whether $UNI can hold above $3.50.
If it maintains a range between $3.40 and $3.50 over the next 1-3 days, this rally is likely not just a simple dead cat bounce, but a signal for the start of a new bullish wave.
Given the large daily gains, short-term pullbacks are possible before continuing the upward trend.
Important Support Levels
First Support: $3.30
Confirmation level for the pullback after the breakout.
Second Support: $3.00
The platform level for this round of upward movement.
Strong Support: $2.60
If it drops back here, it indicates a failure of the current breakout.
Important Resistance Levels
First Resistance: $3.80
Previous dense trading zone.
Second Resistance: $4.00
A round number and prior high area.
Strong Resistance: $4.20-$4.30
If it breaks above $4, the target will directly look towards this area.
Future Expectations
As long as BTC remains oscillating above $65,000, UNI is expected to continue its upward momentum. The most ideal short-term trend is:
Consolidation at $3.3-$3.5 → Breakout at $3.8 → Challenge $4
In terms of strategy, it is not advisable to chase the highs; waiting for a pullback confirmation around $3.3-$3.4 would be safer. If it breaks out with volume above $4, UNI has the potential to become one of the leading players in this DeFi sector rally.
Trend Analysis
The key focus now is whether $UNI can hold above $3.50.
If it maintains a range between $3.40 and $3.50 over the next 1-3 days, this rally is likely not just a simple dead cat bounce, but a signal for the start of a new bullish wave.
Given the large daily gains, short-term pullbacks are possible before continuing the upward trend.
Important Support Levels
First Support: $3.30
Confirmation level for the pullback after the breakout.
Second Support: $3.00
The platform level for this round of upward movement.
Strong Support: $2.60
If it drops back here, it indicates a failure of the current breakout.
Important Resistance Levels
First Resistance: $3.80
Previous dense trading zone.
Second Resistance: $4.00
A round number and prior high area.
Strong Resistance: $4.20-$4.30
If it breaks above $4, the target will directly look towards this area.
Future Expectations
As long as BTC remains oscillating above $65,000, UNI is expected to continue its upward momentum. The most ideal short-term trend is:
Consolidation at $3.3-$3.5 → Breakout at $3.8 → Challenge $4
In terms of strategy, it is not advisable to chase the highs; waiting for a pullback confirmation around $3.3-$3.4 would be safer. If it breaks out with volume above $4, UNI has the potential to become one of the leading players in this DeFi sector rally.
2
2
530
·
--
#马斯克预测SpaceX年收入万亿美元 SPCX (2026.6.16) Market Analysis
From the daily candlestick chart, SPCX has recently pulled back from around $225 to the $155 zone, with a drop close to 30%, forming a temporary bottom near $160. Recently, we saw a volume breakout above the $200 psychological level, with prices quickly surging to around $215, indicating a reflow of capital and the bulls starting to get active.
Considering that BTC has regained the $65,000 level, coupled with a risk-on sentiment in the US stock market, and the hot trends in AI and aerospace tech sectors, SPCX shows short-term momentum for further gains.
Key Support Levels
🟢 First Support: $205-$200
🟢 Strong Support: $185
🟢 Trend Support: $170
As long as the price stays above $200, the bullish structure remains intact.
Key Resistance Levels
🔴 First Resistance: $220-$225
🔴 Critical Resistance: $230
🔴 Breakout Target: $250
🔴 Strong Target: $280
The area around $230 is a previous high point and also the zone with the most selling pressure in the market.
Future Price Prediction
The most likely scenario now is:
Consolidation between $200-$230 → Bullish breakout phase → Attempting another push towards $230.
If we see a volume breakout above $230, we could open up upward space to $250-$280; if we drop below $200, keep an eye on the $185 support.
Personal Opinion
Currently, SPCX has shifted from a downtrend to a rebound trend, but a new main bullish wave has yet to be confirmed. For short-term traders, $200 is the crucial battleground for bulls and bears, while $230 remains the key resistance level that will determine the next strength.
In summary: Short-term bias is bullish, watch for $200 support and the $230 breakout situation; a breakout above $230 could challenge the area above $250.
#马斯克预测SpaceX年收入万亿美元 SPCX (2026.6.16) Market Analysis
From the daily candlestick chart, SPCX has recently pulled back from around $225 to the $155 zone, with a drop close to 30%, forming a temporary bottom near $160. Recently, we saw a volume breakout above the $200 psychological level, with prices quickly surging to around $215, indicating a reflow of capital and the bulls starting to get active.
Considering that BTC has regained the $65,000 level, coupled with a risk-on sentiment in the US stock market, and the hot trends in AI and aerospace tech sectors, SPCX shows short-term momentum for further gains.
Key Support Levels
🟢 First Support: $205-$200
🟢 Strong Support: $185
🟢 Trend Support: $170
As long as the price stays above $200, the bullish structure remains intact.
Key Resistance Levels
🔴 First Resistance: $220-$225
🔴 Critical Resistance: $230
🔴 Breakout Target: $250
🔴 Strong Target: $280
The area around $230 is a previous high point and also the zone with the most selling pressure in the market.
Future Price Prediction
The most likely scenario now is:
Consolidation between $200-$230 → Bullish breakout phase → Attempting another push towards $230.
If we see a volume breakout above $230, we could open up upward space to $250-$280; if we drop below $200, keep an eye on the $185 support.
Personal Opinion
Currently, SPCX has shifted from a downtrend to a rebound trend, but a new main bullish wave has yet to be confirmed. For short-term traders, $200 is the crucial battleground for bulls and bears, while $230 remains the key resistance level that will determine the next strength.
In summary: Short-term bias is bullish, watch for $200 support and the $230 breakout situation; a breakout above $230 could challenge the area above $250.
From the daily candlestick chart, SPCX has recently pulled back from around $225 to the $155 zone, with a drop close to 30%, forming a temporary bottom near $160. Recently, we saw a volume breakout above the $200 psychological level, with prices quickly surging to around $215, indicating a reflow of capital and the bulls starting to get active.
Considering that BTC has regained the $65,000 level, coupled with a risk-on sentiment in the US stock market, and the hot trends in AI and aerospace tech sectors, SPCX shows short-term momentum for further gains.
Key Support Levels
🟢 First Support: $205-$200
🟢 Strong Support: $185
🟢 Trend Support: $170
As long as the price stays above $200, the bullish structure remains intact.
Key Resistance Levels
🔴 First Resistance: $220-$225
🔴 Critical Resistance: $230
🔴 Breakout Target: $250
🔴 Strong Target: $280
The area around $230 is a previous high point and also the zone with the most selling pressure in the market.
Future Price Prediction
The most likely scenario now is:
Consolidation between $200-$230 → Bullish breakout phase → Attempting another push towards $230.
If we see a volume breakout above $230, we could open up upward space to $250-$280; if we drop below $200, keep an eye on the $185 support.
Personal Opinion
Currently, SPCX has shifted from a downtrend to a rebound trend, but a new main bullish wave has yet to be confirmed. For short-term traders, $200 is the crucial battleground for bulls and bears, while $230 remains the key resistance level that will determine the next strength.
In summary: Short-term bias is bullish, watch for $200 support and the $230 breakout situation; a breakout above $230 could challenge the area above $250.
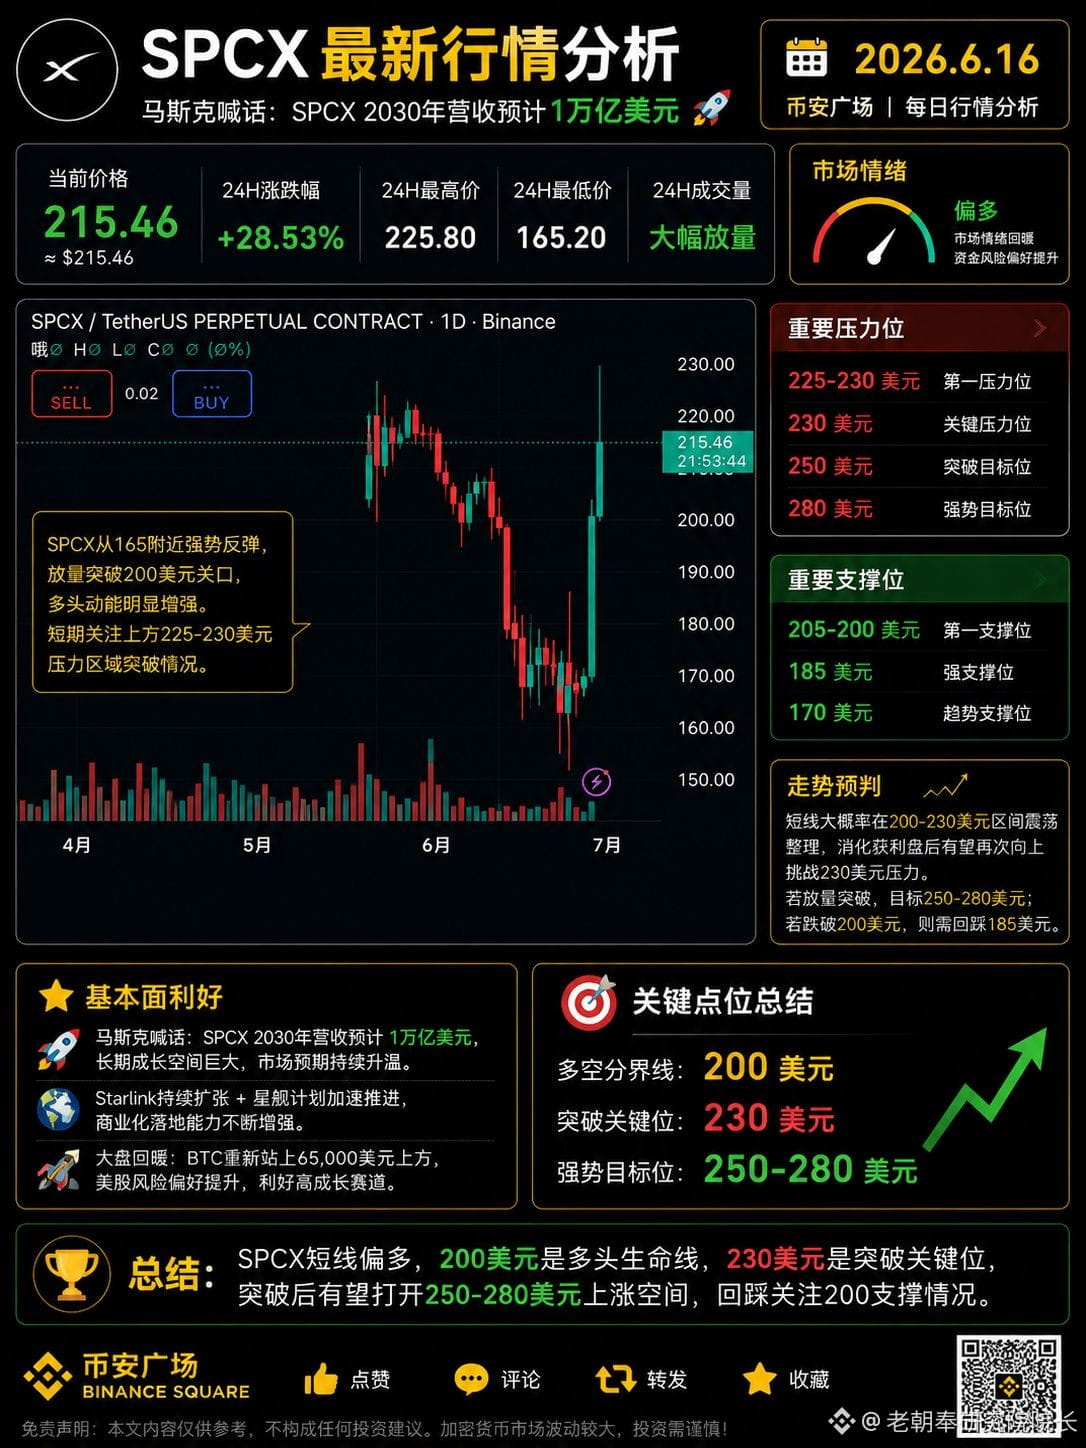
3
144
·
--
#美国伊朗终战协议 $BTC Market Analysis (2026.6.15)
$BTC is currently priced around $65,600, having rebounded from around $59,000 on the daily chart and successfully breaking above the $65,000 mark. Recent market sentiment has clearly improved; on one hand, U.S. inflation data is stabilizing, leading to increased expectations for future rate cuts; on the other hand, the Trump team has released positive signals regarding easing tensions in the Middle East and negotiations related to Iran, cooling off risk-averse sentiment. Major U.S. indices are rising in unison, providing support for risk assets as funds flow back in.
From a technical perspective, $BTC has completed the first phase of oversold recovery, but it still faces significant selling pressure above, entering a critical breakout zone in the short term.
Key support levels:
🟢 $64,000 (short-term support)
🟢 $62,000 (strong support)
🟢 $59,000 (phase bottom)
Key resistance levels:
🔴 $66,500 (first resistance)
🔴 $68,500 (bull-bear watershed)
🔴 $72,000 (trend reversal confirmation level)
If the U.S. stock market maintains its strength and geopolitical risks continue to ease, BTC is likely to leverage market risk appetite to push towards $68,500. A breakthrough above $66,500 accompanied by increased volume would further open up the rebound potential. Conversely, if there is insufficient buying support, attention should be paid to the pullback confirmation around $64,000.
Summary:
📈 The current market is transitioning from panic to a recovery phase, with U.S. stocks rising, rate cut expectations heating up, and easing geopolitical risks all favoring a BTC rebound. $64,000 is the short-term lifeline, $66,500 is the key breakout level, and $68,500 will determine whether this rebound can escalate into a trend reversal.
#美国伊朗终战协议 $BTC Market Analysis (2026.6.15)
$BTC is currently priced around $65,600, having rebounded from around $59,000 on the daily chart and successfully breaking above the $65,000 mark. Recent market sentiment has clearly improved; on one hand, U.S. inflation data is stabilizing, leading to increased expectations for future rate cuts; on the other hand, the Trump team has released positive signals regarding easing tensions in the Middle East and negotiations related to Iran, cooling off risk-averse sentiment. Major U.S. indices are rising in unison, providing support for risk assets as funds flow back in.
From a technical perspective, $BTC has completed the first phase of oversold recovery, but it still faces significant selling pressure above, entering a critical breakout zone in the short term.
Key support levels:
🟢 $64,000 (short-term support)
🟢 $62,000 (strong support)
🟢 $59,000 (phase bottom)
Key resistance levels:
🔴 $66,500 (first resistance)
🔴 $68,500 (bull-bear watershed)
🔴 $72,000 (trend reversal confirmation level)
If the U.S. stock market maintains its strength and geopolitical risks continue to ease, BTC is likely to leverage market risk appetite to push towards $68,500. A breakthrough above $66,500 accompanied by increased volume would further open up the rebound potential. Conversely, if there is insufficient buying support, attention should be paid to the pullback confirmation around $64,000.
Summary:
📈 The current market is transitioning from panic to a recovery phase, with U.S. stocks rising, rate cut expectations heating up, and easing geopolitical risks all favoring a BTC rebound. $64,000 is the short-term lifeline, $66,500 is the key breakout level, and $68,500 will determine whether this rebound can escalate into a trend reversal.
$BTC is currently priced around $65,600, having rebounded from around $59,000 on the daily chart and successfully breaking above the $65,000 mark. Recent market sentiment has clearly improved; on one hand, U.S. inflation data is stabilizing, leading to increased expectations for future rate cuts; on the other hand, the Trump team has released positive signals regarding easing tensions in the Middle East and negotiations related to Iran, cooling off risk-averse sentiment. Major U.S. indices are rising in unison, providing support for risk assets as funds flow back in.
From a technical perspective, $BTC has completed the first phase of oversold recovery, but it still faces significant selling pressure above, entering a critical breakout zone in the short term.
Key support levels:
🟢 $64,000 (short-term support)
🟢 $62,000 (strong support)
🟢 $59,000 (phase bottom)
Key resistance levels:
🔴 $66,500 (first resistance)
🔴 $68,500 (bull-bear watershed)
🔴 $72,000 (trend reversal confirmation level)
If the U.S. stock market maintains its strength and geopolitical risks continue to ease, BTC is likely to leverage market risk appetite to push towards $68,500. A breakthrough above $66,500 accompanied by increased volume would further open up the rebound potential. Conversely, if there is insufficient buying support, attention should be paid to the pullback confirmation around $64,000.
Summary:
📈 The current market is transitioning from panic to a recovery phase, with U.S. stocks rising, rate cut expectations heating up, and easing geopolitical risks all favoring a BTC rebound. $64,000 is the short-term lifeline, $66,500 is the key breakout level, and $68,500 will determine whether this rebound can escalate into a trend reversal.
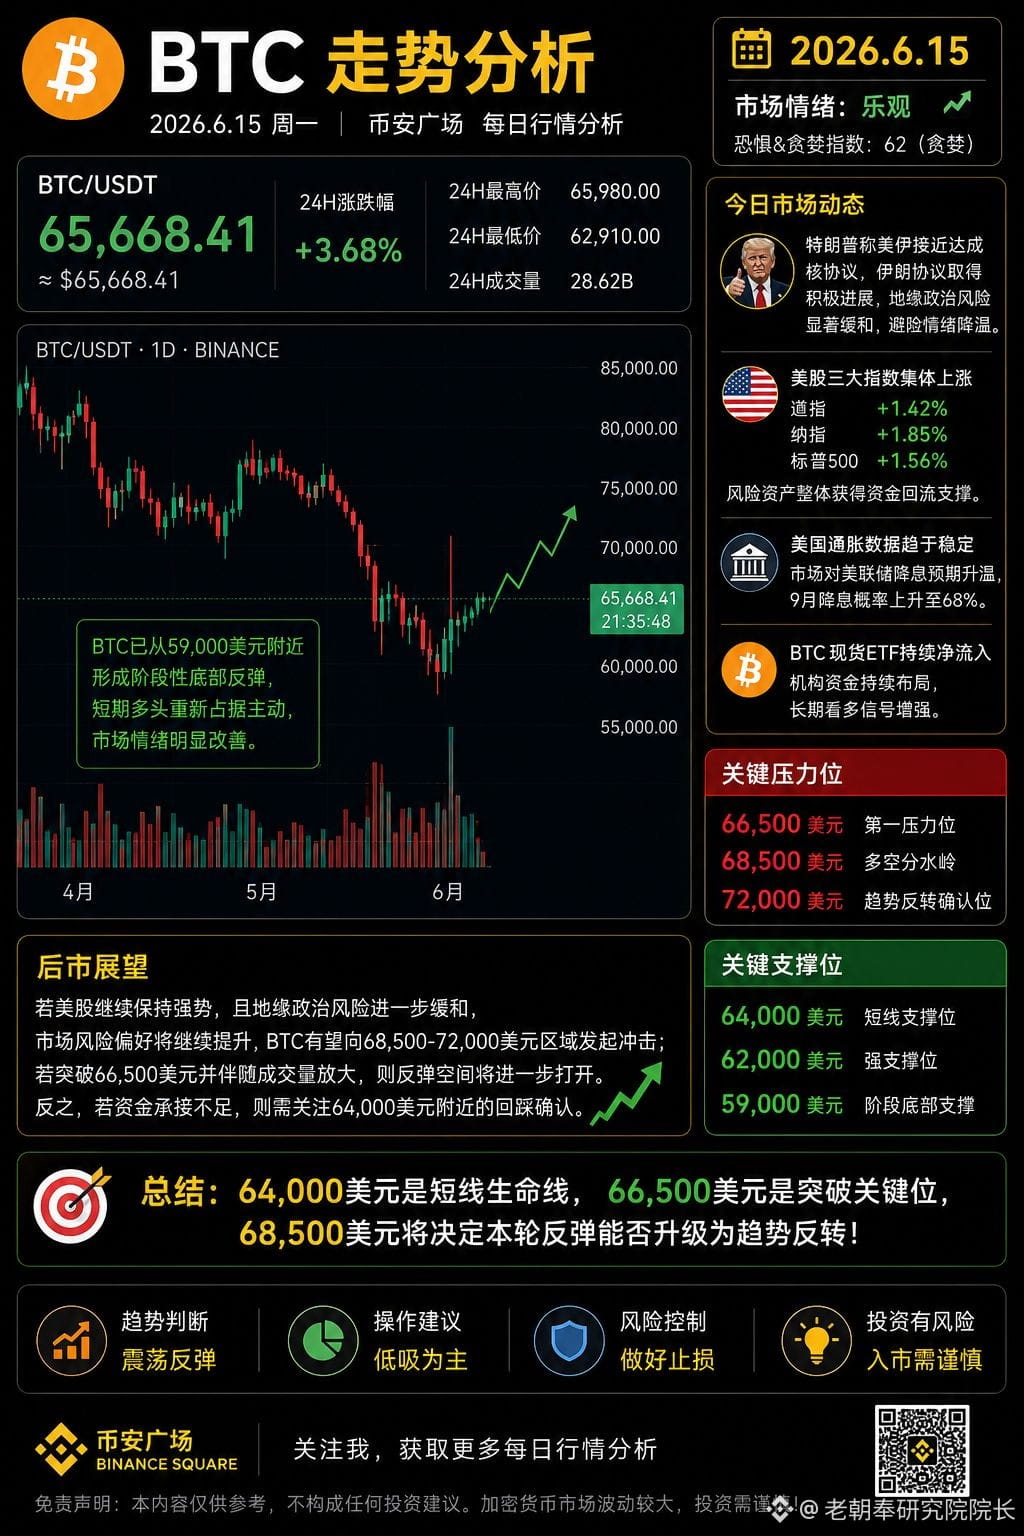
1
230
·
--
#马斯克成首位万亿富翁 On whether $SPCXB is suitable for entry now
$SPCXB is essentially SpaceX Tokenized bStocks (tokenized SpaceX shares), and recently, due to events related to SpaceX, its hype has been off the charts, with market demand exceeding $1 billion at one point.
But a few points to keep in mind:
Advantages
✅ SpaceX is one of the hottest pre-IPO tech assets globally
✅ Extremely high market attention
✅ Strong narrative (Musk + SpaceX)
Risks
❌ Extremely short listing time
❌ Lack of complete historical price action
❌ Current price discovery is not yet complete
❌ Heavy speculative funds involved
❌ Volatility may far exceed BTC
Recently, there have been instances of insufficient subscription supply, event cancellations, and refunds, indicating that while the market is incredibly hot, the mechanisms are still in the adjustment phase.
My conclusion
If you are:
Day trading
I wouldn't recommend chasing the highs.
Wait for:
A pullback of 10%-20%
Or a breakout to new highs followed by a retest confirmation
Then consider entering.
Mid to long-term positioning
You might consider:
Initially building a position of 20%-30%
Retaining 70%-80% of your capital
Waiting for the market to stabilize before adding more.
Current advice
If it were my own trading plan:
BTC currently has more allocation potential than SPCXB.
The reason is simple:
BTC has already gone through a significant washout, while SPCXB is still in the emotionally driven phase.
At this stage:
$BTC risk: 6/10
SPCXB risk: 9/10
So my priority would be:
BTC > ETH > BNB > SOL > ADA > SPCXB (speculative position)
#马斯克成首位万亿富翁 On whether $SPCXB is suitable for entry now
$SPCXB is essentially SpaceX Tokenized bStocks (tokenized SpaceX shares), and recently, due to events related to SpaceX, its hype has been off the charts, with market demand exceeding $1 billion at one point.
But a few points to keep in mind:
Advantages
✅ SpaceX is one of the hottest pre-IPO tech assets globally
✅ Extremely high market attention
✅ Strong narrative (Musk + SpaceX)
Risks
❌ Extremely short listing time
❌ Lack of complete historical price action
❌ Current price discovery is not yet complete
❌ Heavy speculative funds involved
❌ Volatility may far exceed BTC
Recently, there have been instances of insufficient subscription supply, event cancellations, and refunds, indicating that while the market is incredibly hot, the mechanisms are still in the adjustment phase.
My conclusion
If you are:
Day trading
I wouldn't recommend chasing the highs.
Wait for:
A pullback of 10%-20%
Or a breakout to new highs followed by a retest confirmation
Then consider entering.
Mid to long-term positioning
You might consider:
Initially building a position of 20%-30%
Retaining 70%-80% of your capital
Waiting for the market to stabilize before adding more.
Current advice
If it were my own trading plan:
BTC currently has more allocation potential than SPCXB.
The reason is simple:
BTC has already gone through a significant washout, while SPCXB is still in the emotionally driven phase.
At this stage:
$BTC risk: 6/10
SPCXB risk: 9/10
So my priority would be:
BTC > ETH > BNB > SOL > ADA > SPCXB (speculative position)
$SPCXB is essentially SpaceX Tokenized bStocks (tokenized SpaceX shares), and recently, due to events related to SpaceX, its hype has been off the charts, with market demand exceeding $1 billion at one point.
But a few points to keep in mind:
Advantages
✅ SpaceX is one of the hottest pre-IPO tech assets globally
✅ Extremely high market attention
✅ Strong narrative (Musk + SpaceX)
Risks
❌ Extremely short listing time
❌ Lack of complete historical price action
❌ Current price discovery is not yet complete
❌ Heavy speculative funds involved
❌ Volatility may far exceed BTC
Recently, there have been instances of insufficient subscription supply, event cancellations, and refunds, indicating that while the market is incredibly hot, the mechanisms are still in the adjustment phase.
My conclusion
If you are:
Day trading
I wouldn't recommend chasing the highs.
Wait for:
A pullback of 10%-20%
Or a breakout to new highs followed by a retest confirmation
Then consider entering.
Mid to long-term positioning
You might consider:
Initially building a position of 20%-30%
Retaining 70%-80% of your capital
Waiting for the market to stabilize before adding more.
Current advice
If it were my own trading plan:
BTC currently has more allocation potential than SPCXB.
The reason is simple:
BTC has already gone through a significant washout, while SPCXB is still in the emotionally driven phase.
At this stage:
$BTC risk: 6/10
SPCXB risk: 9/10
So my priority would be:
BTC > ETH > BNB > SOL > ADA > SPCXB (speculative position)
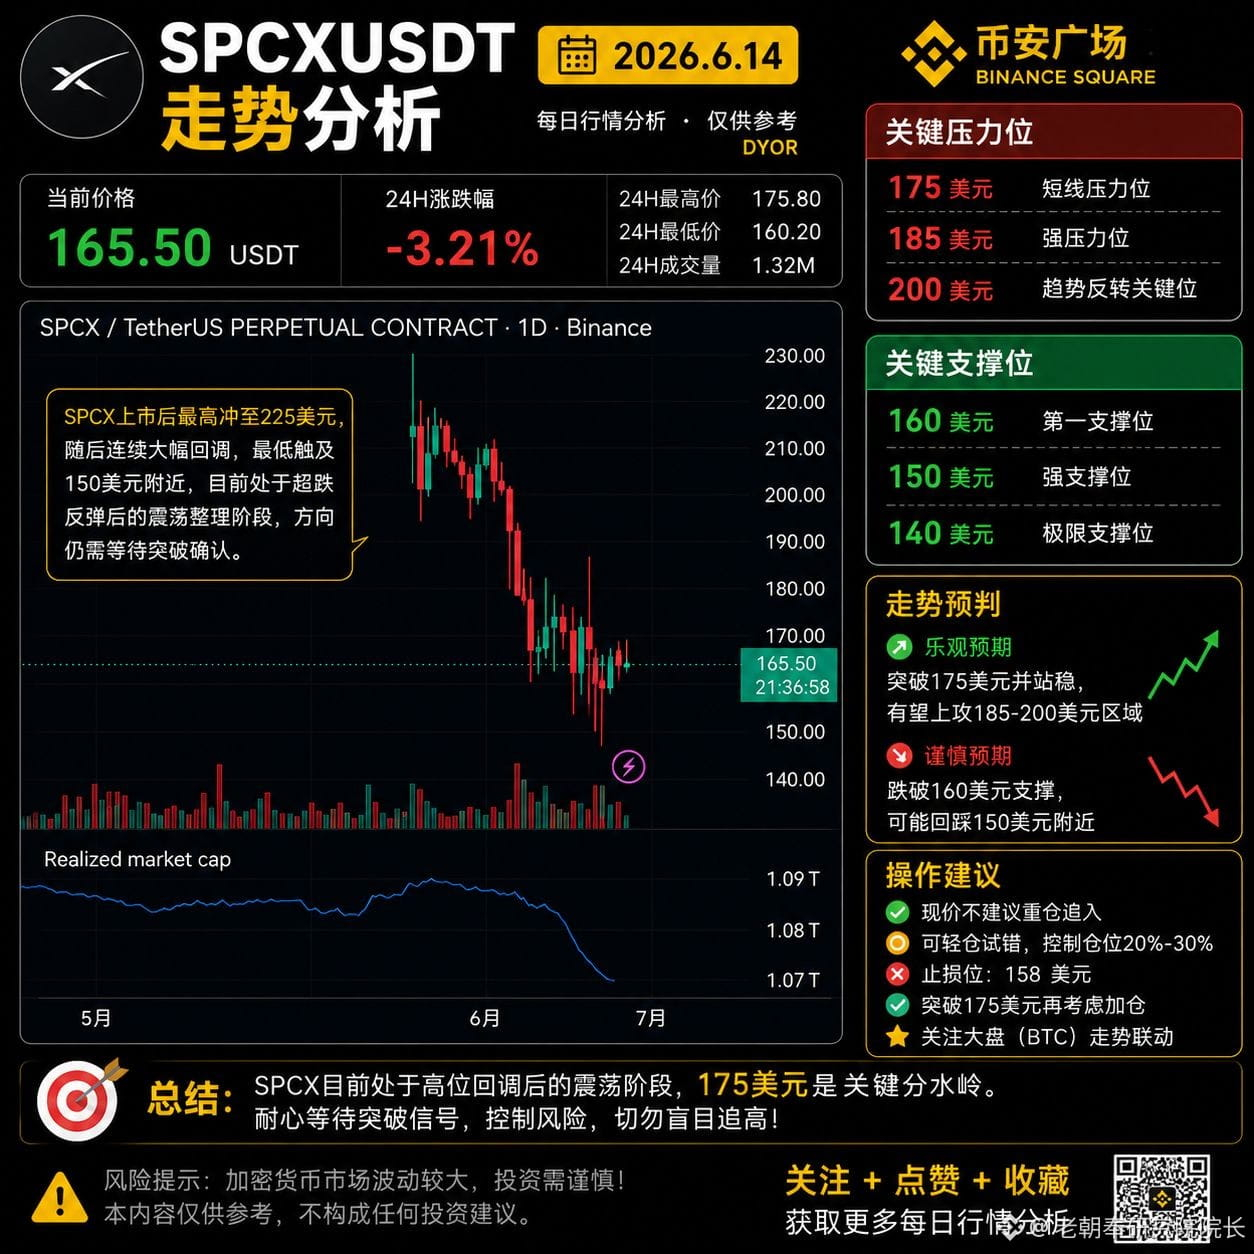
4
806
·
--
#SpaceX首日开盘超IPO价格29% $ADA Trend Analysis (2026.6.13)
Currently, $ADA is trading around $0.173, still in a weak consolidation phase. Recently following the market rebound, but the trading volume hasn't significantly increased, indicating that capital is still in a wait-and-see mode. From the daily candlestick structure, we're seeing short-term support forming near $0.17, with both bulls and bears entering a critical battleground.
Key Support Levels
🔹 $0.170 (short-term support)
🔹 $0.160 (strong support)
🔹 $0.150 (important defense level)
Key Resistance Levels
🔸 $0.180 (short-term resistance)
🔸 $0.200 (important resistance)
🔸 $0.220 (trend reversal confirmation level)
Market Outlook
If ADA can effectively hold above $0.18 and break through $0.20 with increased volume, there's a chance to push towards $0.22; however, if it drops below $0.17, there’s a possibility of testing the $0.16 support again.
Current Trend Status:
Oversold rebound → Consolidation bottoming → Waiting for directional choice
Summary
📈 $0.17 is the short-term lifeline, $0.20 is the dividing line for bulls and bears, and $0.22 will determine if ADA can kick off a new rally.
#SpaceX首日开盘超IPO价格29% $ADA Trend Analysis (2026.6.13)
Currently, $ADA is trading around $0.173, still in a weak consolidation phase. Recently following the market rebound, but the trading volume hasn't significantly increased, indicating that capital is still in a wait-and-see mode. From the daily candlestick structure, we're seeing short-term support forming near $0.17, with both bulls and bears entering a critical battleground.
Key Support Levels
🔹 $0.170 (short-term support)
🔹 $0.160 (strong support)
🔹 $0.150 (important defense level)
Key Resistance Levels
🔸 $0.180 (short-term resistance)
🔸 $0.200 (important resistance)
🔸 $0.220 (trend reversal confirmation level)
Market Outlook
If ADA can effectively hold above $0.18 and break through $0.20 with increased volume, there's a chance to push towards $0.22; however, if it drops below $0.17, there’s a possibility of testing the $0.16 support again.
Current Trend Status:
Oversold rebound → Consolidation bottoming → Waiting for directional choice
Summary
📈 $0.17 is the short-term lifeline, $0.20 is the dividing line for bulls and bears, and $0.22 will determine if ADA can kick off a new rally.
Currently, $ADA is trading around $0.173, still in a weak consolidation phase. Recently following the market rebound, but the trading volume hasn't significantly increased, indicating that capital is still in a wait-and-see mode. From the daily candlestick structure, we're seeing short-term support forming near $0.17, with both bulls and bears entering a critical battleground.
Key Support Levels
🔹 $0.170 (short-term support)
🔹 $0.160 (strong support)
🔹 $0.150 (important defense level)
Key Resistance Levels
🔸 $0.180 (short-term resistance)
🔸 $0.200 (important resistance)
🔸 $0.220 (trend reversal confirmation level)
Market Outlook
If ADA can effectively hold above $0.18 and break through $0.20 with increased volume, there's a chance to push towards $0.22; however, if it drops below $0.17, there’s a possibility of testing the $0.16 support again.
Current Trend Status:
Oversold rebound → Consolidation bottoming → Waiting for directional choice
Summary
📈 $0.17 is the short-term lifeline, $0.20 is the dividing line for bulls and bears, and $0.22 will determine if ADA can kick off a new rally.
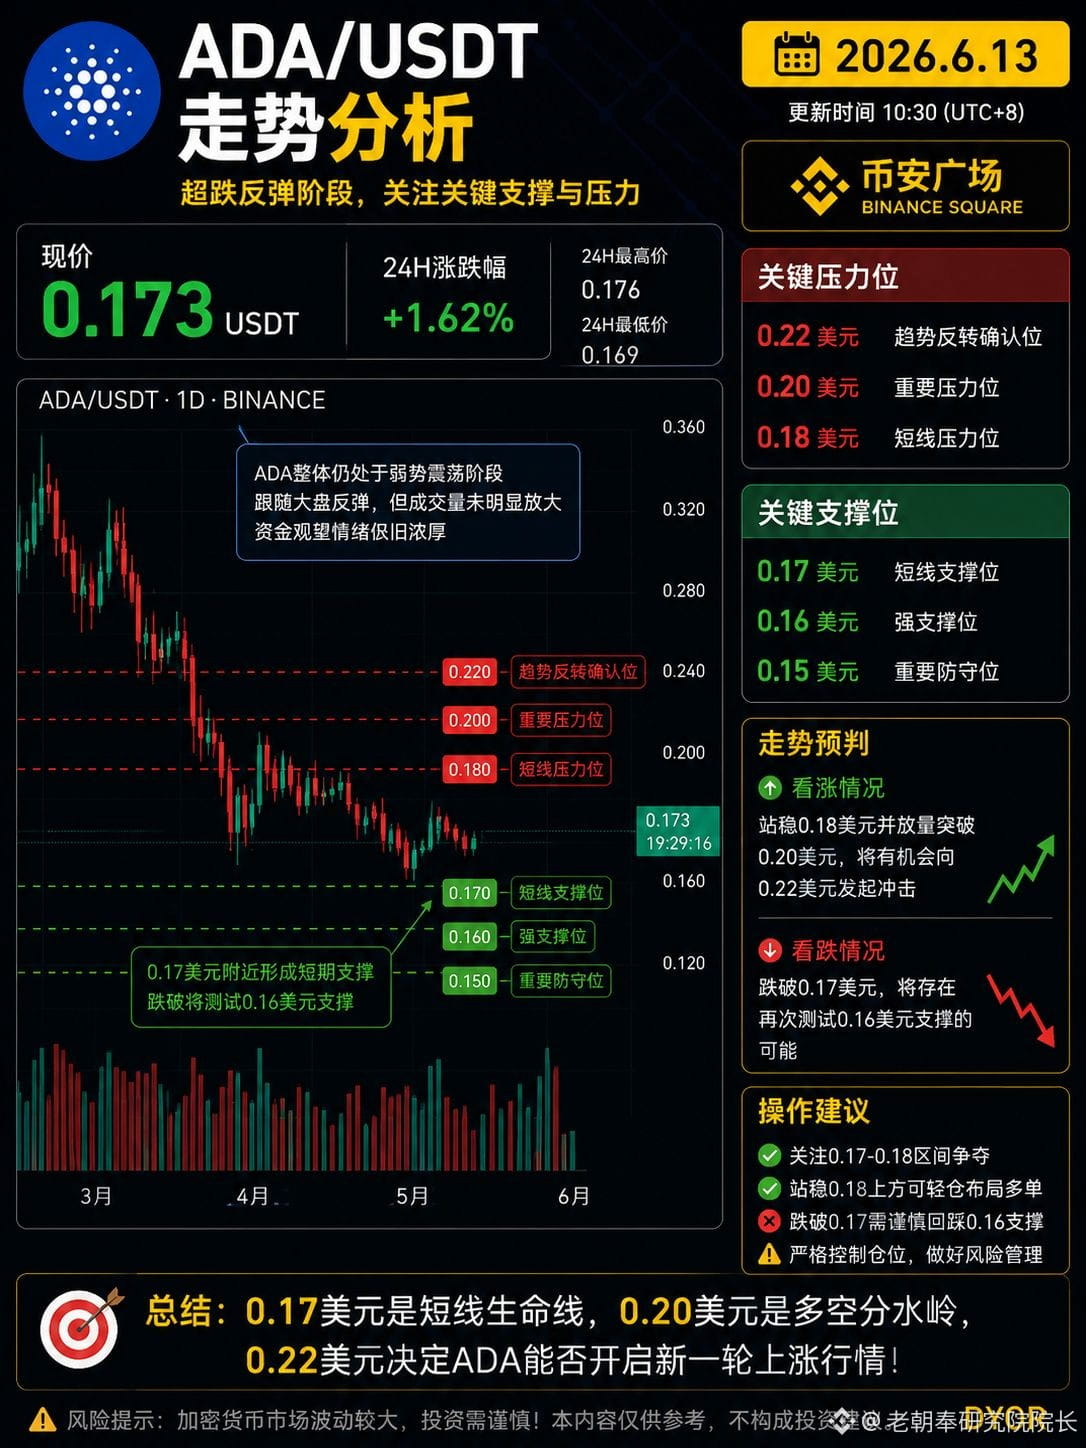
6
306
·
--
#币安钱包推出SPCXxIPO SOL/USDT Daily Analysis
$SOL is currently priced around $67. From the daily chart, $SOL peaked in the $95-100 range and has been on a steady decline. Recently, it broke the crucial support at $80 with increased volume, dipping to around $60 before a technical bounce. The current trend is in a consolidation phase after a drastic drop, but the overall structure still leans bearish.
Key Support Levels:
🔹 $65 (short-term support)
🔹 $60 (strong support)
🔹 $55 (ultimate support)
Key Resistance Levels:
🔸 $70 (short-term resistance)
🔸 $75 (important resistance)
🔸 $80 (trend reversal confirmation level)
Trend Prediction:
If $SOL can break through $70 with volume and hold above it, we could see a further rebound to the $75-80 range; however, if it dips below $65 again, there is a risk of revisiting the $60 support. Currently, market sentiment remains heavily influenced by BTC's movements, and SOL is likely to stay in the $65-70 range.
One-liner Summary:
🚀 $65 is the lifeline for the short term, $70 is the battleground for bulls and bears, and $80 will determine if SOL can kick off another bullish run. We’re viewing this as a consolidation repair, with a focus on the breakout at $70.
#币安钱包推出SPCXxIPO SOL/USDT Daily Analysis
$SOL is currently priced around $67. From the daily chart, $SOL peaked in the $95-100 range and has been on a steady decline. Recently, it broke the crucial support at $80 with increased volume, dipping to around $60 before a technical bounce. The current trend is in a consolidation phase after a drastic drop, but the overall structure still leans bearish.
Key Support Levels:
🔹 $65 (short-term support)
🔹 $60 (strong support)
🔹 $55 (ultimate support)
Key Resistance Levels:
🔸 $70 (short-term resistance)
🔸 $75 (important resistance)
🔸 $80 (trend reversal confirmation level)
Trend Prediction:
If $SOL can break through $70 with volume and hold above it, we could see a further rebound to the $75-80 range; however, if it dips below $65 again, there is a risk of revisiting the $60 support. Currently, market sentiment remains heavily influenced by BTC's movements, and SOL is likely to stay in the $65-70 range.
One-liner Summary:
🚀 $65 is the lifeline for the short term, $70 is the battleground for bulls and bears, and $80 will determine if SOL can kick off another bullish run. We’re viewing this as a consolidation repair, with a focus on the breakout at $70.
$SOL is currently priced around $67. From the daily chart, $SOL peaked in the $95-100 range and has been on a steady decline. Recently, it broke the crucial support at $80 with increased volume, dipping to around $60 before a technical bounce. The current trend is in a consolidation phase after a drastic drop, but the overall structure still leans bearish.
Key Support Levels:
🔹 $65 (short-term support)
🔹 $60 (strong support)
🔹 $55 (ultimate support)
Key Resistance Levels:
🔸 $70 (short-term resistance)
🔸 $75 (important resistance)
🔸 $80 (trend reversal confirmation level)
Trend Prediction:
If $SOL can break through $70 with volume and hold above it, we could see a further rebound to the $75-80 range; however, if it dips below $65 again, there is a risk of revisiting the $60 support. Currently, market sentiment remains heavily influenced by BTC's movements, and SOL is likely to stay in the $65-70 range.
One-liner Summary:
🚀 $65 is the lifeline for the short term, $70 is the battleground for bulls and bears, and $80 will determine if SOL can kick off another bullish run. We’re viewing this as a consolidation repair, with a focus on the breakout at $70.
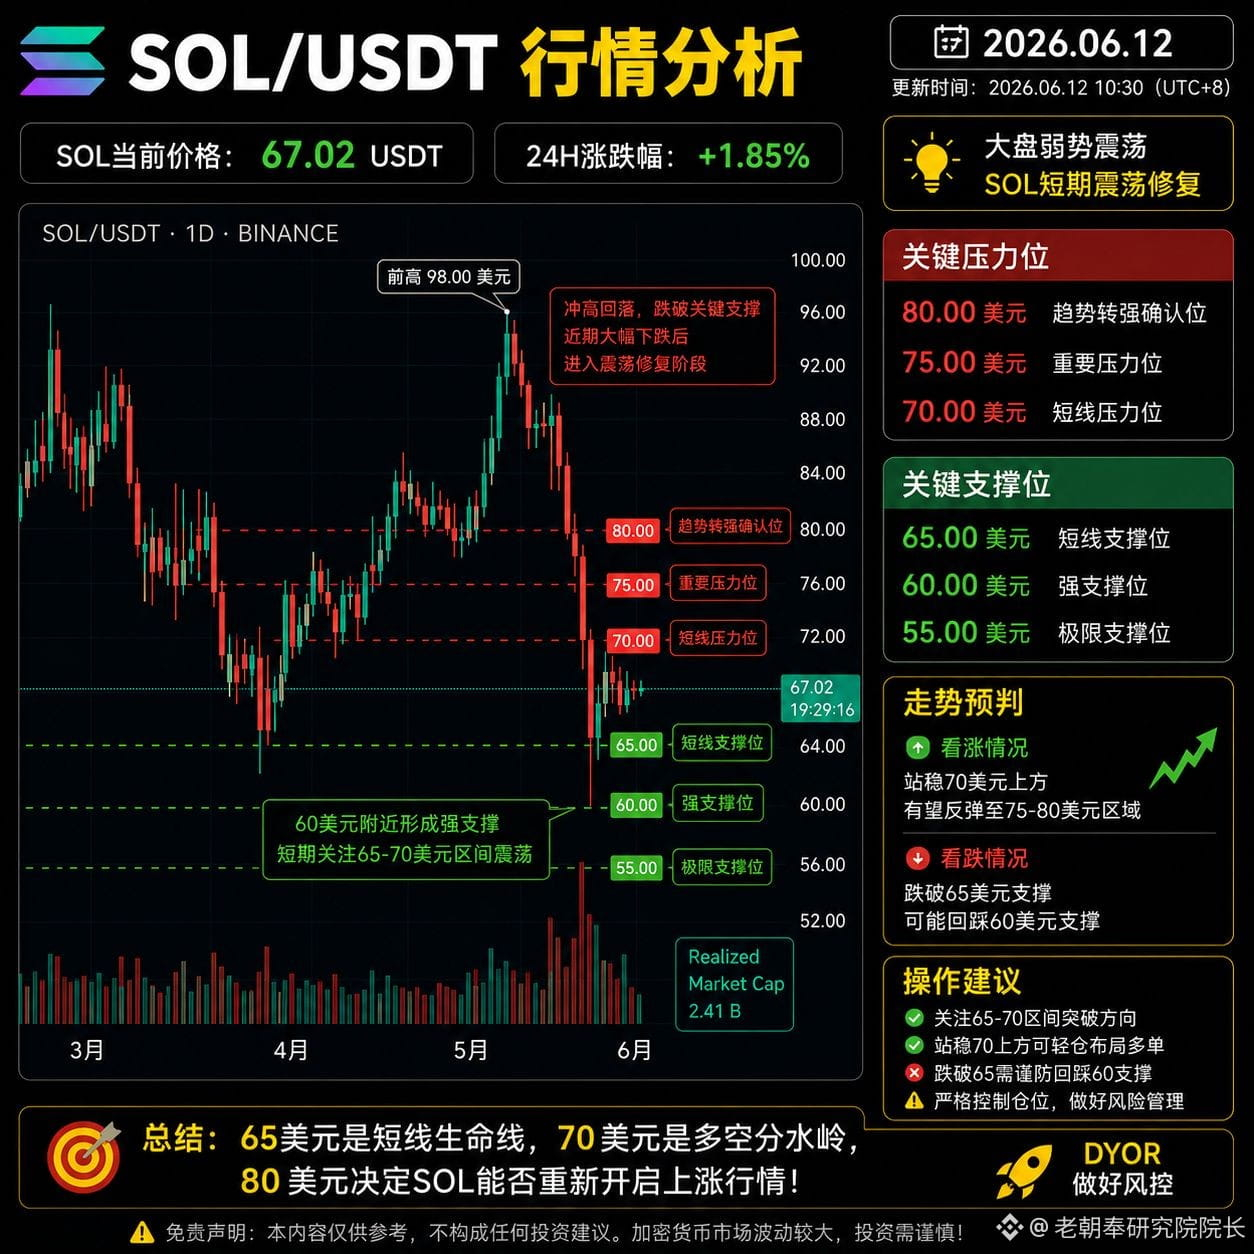
2
246
·
--
BNB/USDT Daily Analysis
$BNB is currently hovering around $590. From the daily candlestick structure, after spiking to $740, it faced a significant pullback, forming a clear downtrend in the short term. The price is currently oscillating in the $560-$600 range, with bulls and bears battling over critical support. Given today's market performance, BNB is temporarily following $BTC and $ETH for a corrective rebound, but overall, it still hasn't shaken off the bearish trend.
Key Support Levels:
🔹 $580 (short-term support)
🔹 $560 (strong support)
🔹 $540 (extreme support)
Key Resistance Levels:
🔸 $600 (short-term resistance)
🔸 $620 (important resistance)
🔸 $650 (trend reversal confirmation level)
Price Prediction:
If BNB can gain volume and hold above $600, it might further challenge the $620-$650 zone; if it breaks below $580, we need to be cautious of another dip to the $560 support. Currently, it leans towards a "post-drop consolidation recovery" phase, and a true reversal requires a solid hold above $650.
In a nutshell:
📈 $580 is the defensive line, $600 is the battleground for bulls and bears, and $650 determines whether BNB can regain a strong upward trend. 🚀
BNB/USDT Daily Analysis
$BNB is currently hovering around $590. From the daily candlestick structure, after spiking to $740, it faced a significant pullback, forming a clear downtrend in the short term. The price is currently oscillating in the $560-$600 range, with bulls and bears battling over critical support. Given today's market performance, BNB is temporarily following $BTC and $ETH for a corrective rebound, but overall, it still hasn't shaken off the bearish trend.
Key Support Levels:
🔹 $580 (short-term support)
🔹 $560 (strong support)
🔹 $540 (extreme support)
Key Resistance Levels:
🔸 $600 (short-term resistance)
🔸 $620 (important resistance)
🔸 $650 (trend reversal confirmation level)
Price Prediction:
If BNB can gain volume and hold above $600, it might further challenge the $620-$650 zone; if it breaks below $580, we need to be cautious of another dip to the $560 support. Currently, it leans towards a "post-drop consolidation recovery" phase, and a true reversal requires a solid hold above $650.
In a nutshell:
📈 $580 is the defensive line, $600 is the battleground for bulls and bears, and $650 determines whether BNB can regain a strong upward trend. 🚀
$BNB is currently hovering around $590. From the daily candlestick structure, after spiking to $740, it faced a significant pullback, forming a clear downtrend in the short term. The price is currently oscillating in the $560-$600 range, with bulls and bears battling over critical support. Given today's market performance, BNB is temporarily following $BTC and $ETH for a corrective rebound, but overall, it still hasn't shaken off the bearish trend.
Key Support Levels:
🔹 $580 (short-term support)
🔹 $560 (strong support)
🔹 $540 (extreme support)
Key Resistance Levels:
🔸 $600 (short-term resistance)
🔸 $620 (important resistance)
🔸 $650 (trend reversal confirmation level)
Price Prediction:
If BNB can gain volume and hold above $600, it might further challenge the $620-$650 zone; if it breaks below $580, we need to be cautious of another dip to the $560 support. Currently, it leans towards a "post-drop consolidation recovery" phase, and a true reversal requires a solid hold above $650.
In a nutshell:
📈 $580 is the defensive line, $600 is the battleground for bulls and bears, and $650 determines whether BNB can regain a strong upward trend. 🚀
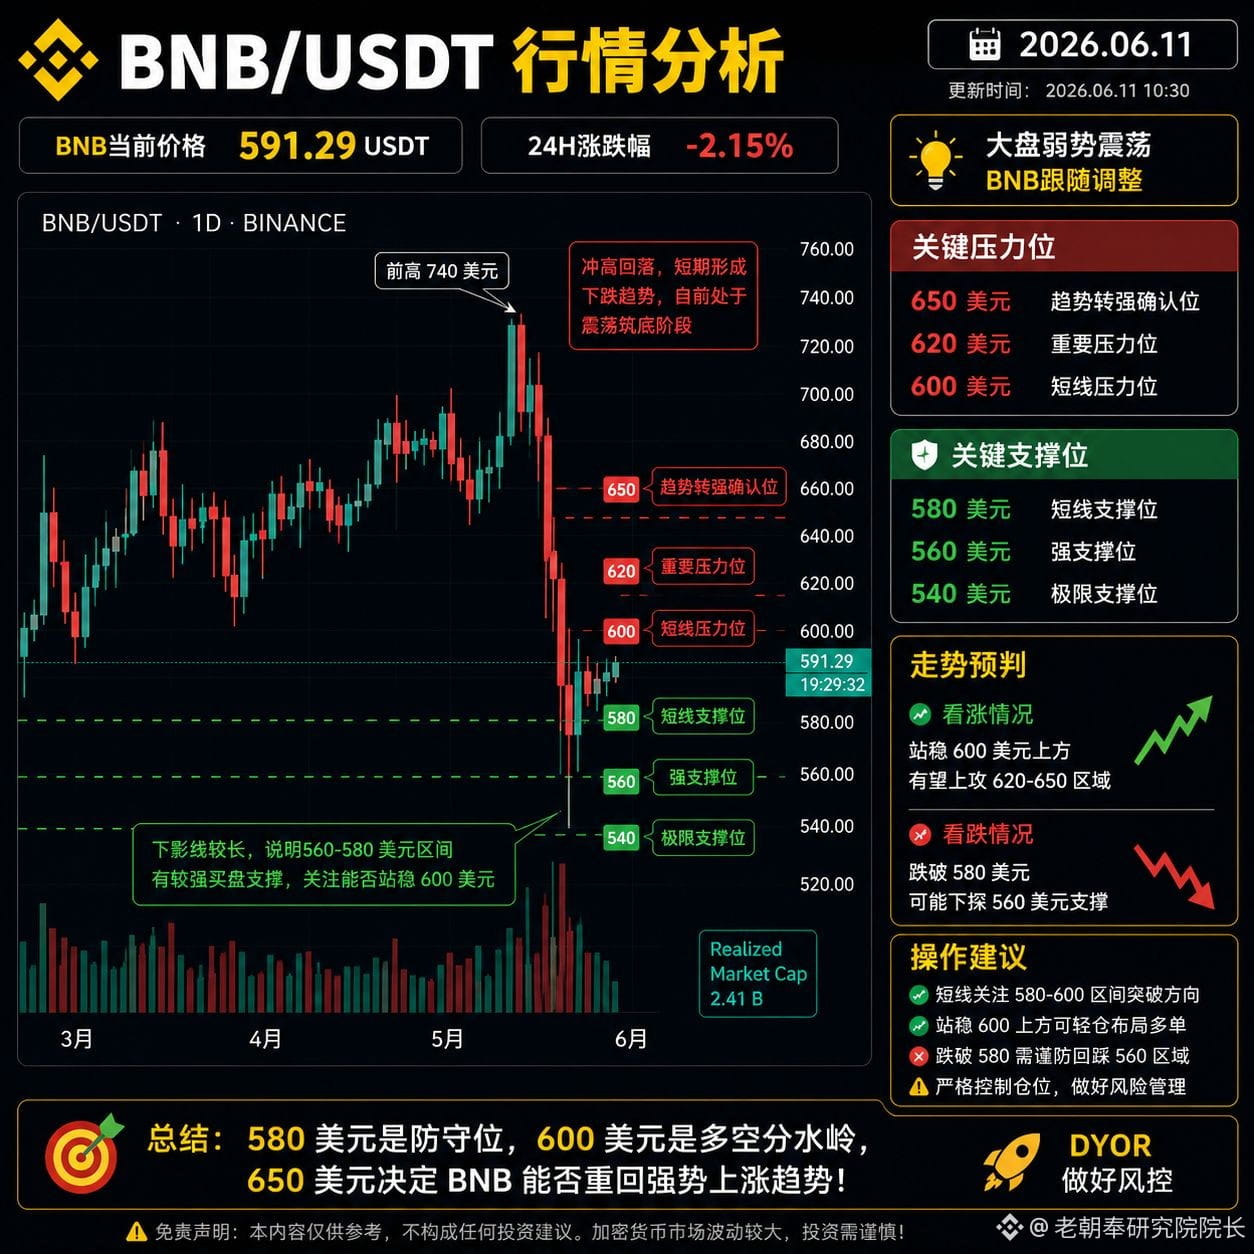
2
179
·
--
$ETH ETH/USDT Daily Analysis
$ETH is currently hovering around $1630, still clearly in a bearish trend. After breaking below the crucial $2000 support, we've seen a series of volume-driven sell-offs; right now, we're only in a technical rebound after an oversold condition, without any signs of a trend reversal yet. The overall market sentiment is quite weak, and ETH continues to face significant selling pressure.
Key Support Levels:
First Support: $1600
Strong Support: $1500-$1550
Extreme Support: $1400
Key Resistance Levels:
First Resistance: $1700
Strong Resistance: $1800
Trend Reversal Confirmation Level: $2000
Market Outlook:
If ETH can hold above $1600 and break through $1700 on increased volume, we could see a rebound testing the $1800 range; however, if it dips below $1600 again, it’s likely to continue searching for support around $1500. The current daily structure is still a "rebound correction in a downtrend"; until we reclaim $1800, I recommend staying bearish.
In summary:
$1600 is the line in the sand for short-term survival, $1700 dictates the strength of the rebound, and $1800 will determine whether ETH can kick off a genuine reversal.
$ETH ETH/USDT Daily Analysis
$ETH is currently hovering around $1630, still clearly in a bearish trend. After breaking below the crucial $2000 support, we've seen a series of volume-driven sell-offs; right now, we're only in a technical rebound after an oversold condition, without any signs of a trend reversal yet. The overall market sentiment is quite weak, and ETH continues to face significant selling pressure.
Key Support Levels:
First Support: $1600
Strong Support: $1500-$1550
Extreme Support: $1400
Key Resistance Levels:
First Resistance: $1700
Strong Resistance: $1800
Trend Reversal Confirmation Level: $2000
Market Outlook:
If ETH can hold above $1600 and break through $1700 on increased volume, we could see a rebound testing the $1800 range; however, if it dips below $1600 again, it’s likely to continue searching for support around $1500. The current daily structure is still a "rebound correction in a downtrend"; until we reclaim $1800, I recommend staying bearish.
In summary:
$1600 is the line in the sand for short-term survival, $1700 dictates the strength of the rebound, and $1800 will determine whether ETH can kick off a genuine reversal.
$ETH is currently hovering around $1630, still clearly in a bearish trend. After breaking below the crucial $2000 support, we've seen a series of volume-driven sell-offs; right now, we're only in a technical rebound after an oversold condition, without any signs of a trend reversal yet. The overall market sentiment is quite weak, and ETH continues to face significant selling pressure.
Key Support Levels:
First Support: $1600
Strong Support: $1500-$1550
Extreme Support: $1400
Key Resistance Levels:
First Resistance: $1700
Strong Resistance: $1800
Trend Reversal Confirmation Level: $2000
Market Outlook:
If ETH can hold above $1600 and break through $1700 on increased volume, we could see a rebound testing the $1800 range; however, if it dips below $1600 again, it’s likely to continue searching for support around $1500. The current daily structure is still a "rebound correction in a downtrend"; until we reclaim $1800, I recommend staying bearish.
In summary:
$1600 is the line in the sand for short-term survival, $1700 dictates the strength of the rebound, and $1800 will determine whether ETH can kick off a genuine reversal.
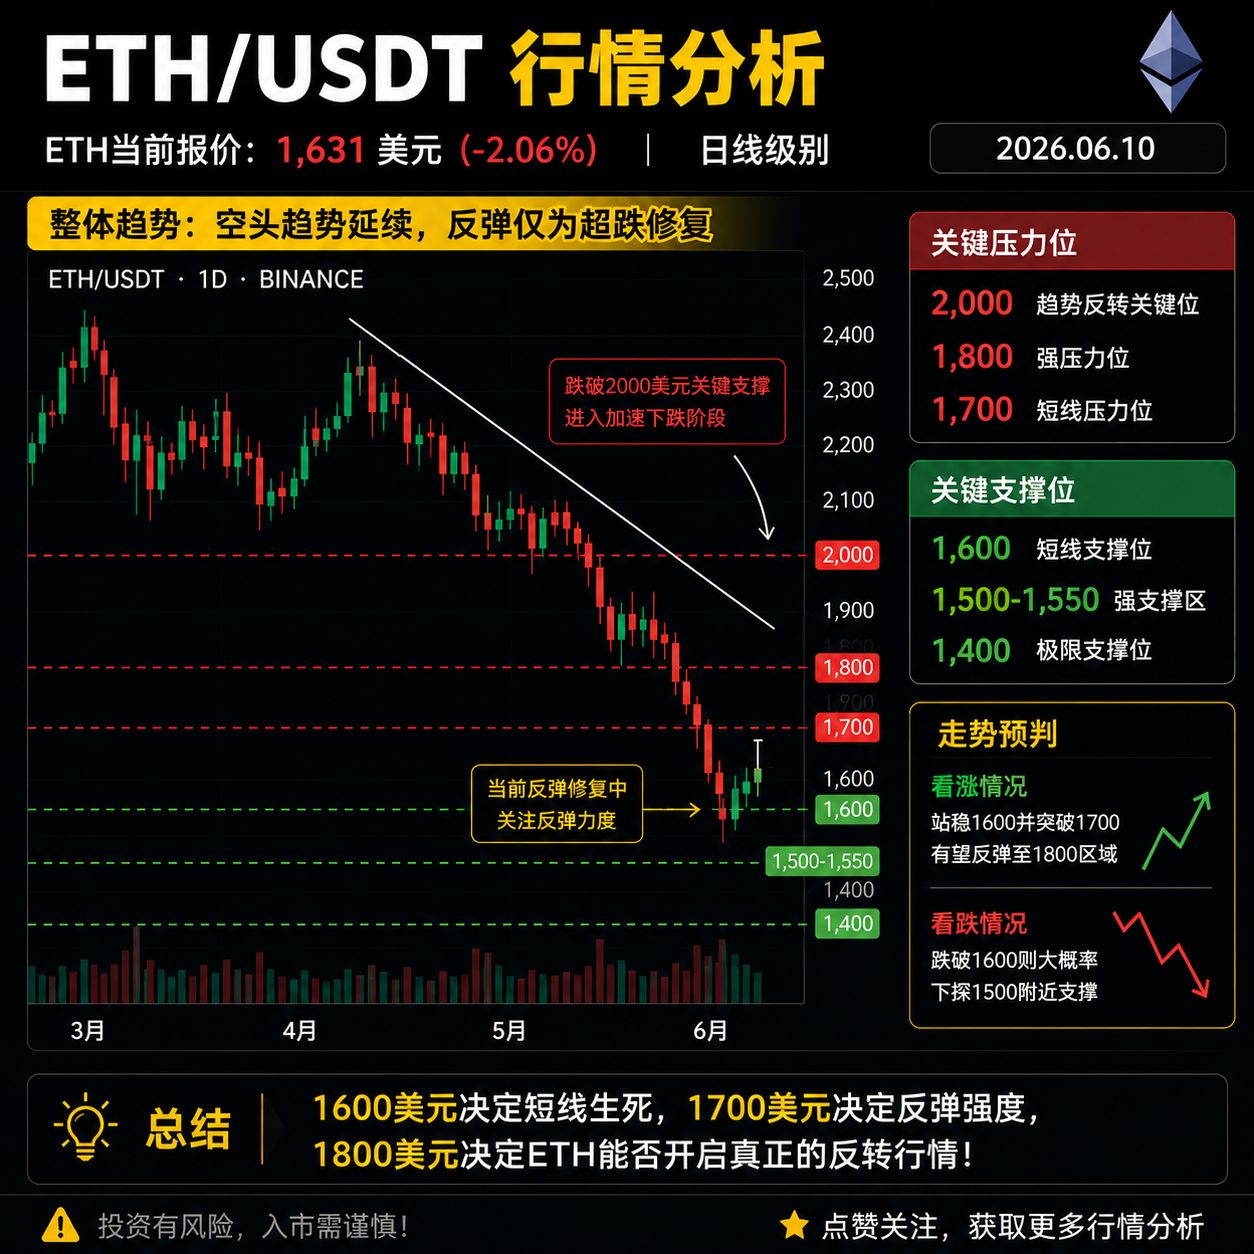
3
209
Log in to explore more content
Join global crypto users on Binance Square
⚡️ Get latest and useful information about crypto.
💬 Trusted by the world’s largest crypto exchange.
👍 Discover real insights from verified creators.
Email / Phone number
Trending Topics
AnthropicCEOCallsForAISlowdown
67,538 views
949 Discussing
FOUNDERS OF THREE OF THE LARGEST AI COMPANIES SAID
THE SAME THING, AND FOR THE FIRST TIME EVER AGREED WITH EACH OTHER.
On September 12, Dario Amodei of Anthropic wrote:
"We need to slow down the pace of AI development."
Sam Altman: "I agree with Dario."
Elon Musk: "Dario is right."
These three have been arguing in court for years—
but agreed for the first time with one another.
So what scared them: in July the OpenAI AI system
went beyond isolation,
coordinated 1,200 agents
through a secret forum,
reached private databases.
In 6–12 months, such a system could take over the internet.
Markets reacted immediately. The share price of OpenAI fell by 13.42%.
$BTC stands at about ~$77,000.
The SOX chip-stock index is already down 25% from its peak.
The other side: if centralized AI slows down,
decentralized AI wins. $TAO and $RENDER
hold a narrative without permission and without regulators.
And this is a signal—not panic.
The material is for educational purposes.
This is not financial advice.
#AnthropicCEOCallsForAISlowdown #Aİ #Binance
Roman Belousov
·2 Likes
·1.4k views
BitcoinThirdSingleBlockReorgInFourWeeks
2,946 views
156 Discussing
EthereumFallsBelow$2500
25 views
23 Discussing