
MicroChainAi
405 Posts

MicroChainAi
Report
Block User
交易员明智的选择。专注趋势交易,预判行情,复盘指导,精准抄底。🌍:微链智控
22 Following
1.5K+ Followers
128 Liked
Posts
All
Quotes
Videos
Live
·
--
FTMO Challenge | TradingView Indicator
The AB strategy really works well. Just dipping my toes in 💦
Looking forward to what's next~
#Ftmo #Tradingview
FTMO Challenge | TradingView Indicator
The AB strategy really works well. Just dipping my toes in 💦
Looking forward to what's next~
#Ftmo #Tradingview
The AB strategy really works well. Just dipping my toes in 💦
Looking forward to what's next~
#Ftmo #Tradingview

47
·
--
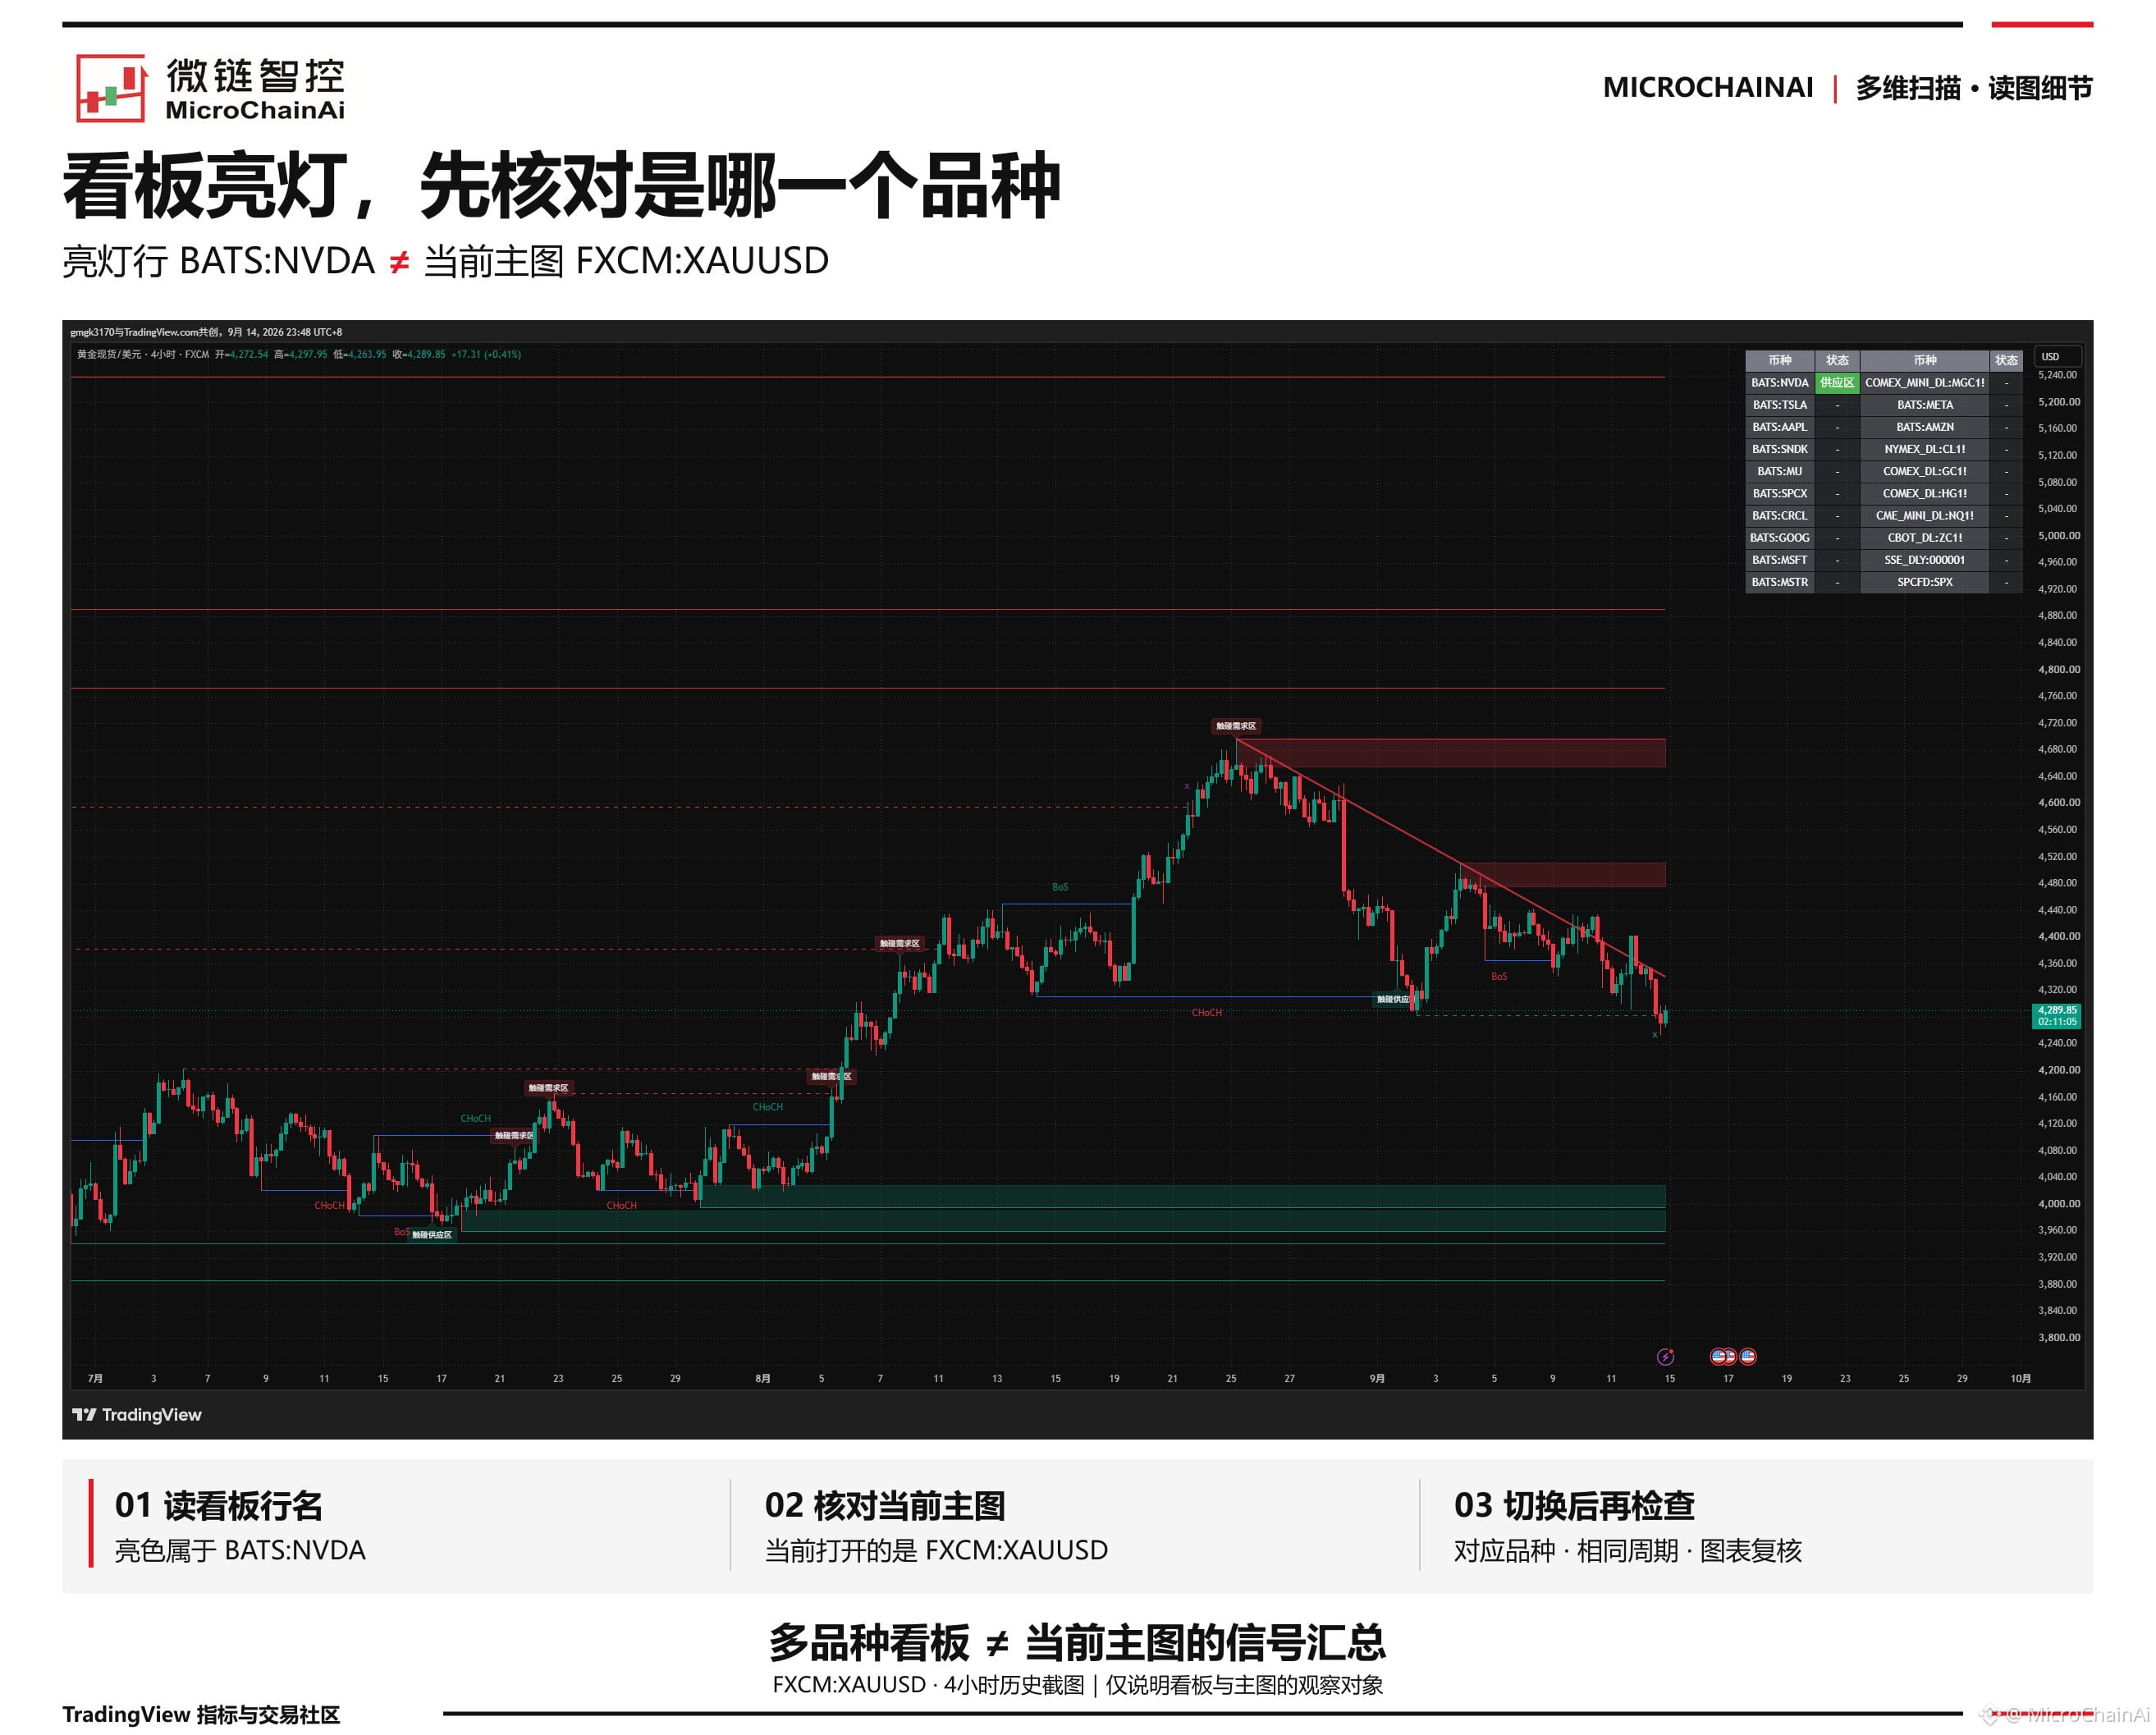
The dashboard lights up, but why can’t I find the corresponding area on the main chart?
🔍【Multi-Dimensional Scan】One table can display multiple instruments, but the main chart only shows the currently open instrument.
In this image, the green status appears on the BATS:NVDA row, while the main chart shows FXCM:XAUUSD. They are not the same instrument.
📊 When you see a highlighted status, first check the row name, then switch to the corresponding instrument and check the chart using the same timeframe. Don’t apply alerts for other instruments to the current main chart.
🧭 The dashboard tells you “which instrument to check”; to see exactly what happened, confirm it on that instrument’s chart.
#多维扫描 #TradingView
The dashboard lights up, but why can’t I find the corresponding area on the main chart?
🔍【Multi-Dimensional Scan】One table can display multiple instruments, but the main chart only shows the currently open instrument.
In this image, the green status appears on the BATS:NVDA row, while the main chart shows FXCM:XAUUSD. They are not the same instrument.
📊 When you see a highlighted status, first check the row name, then switch to the corresponding instrument and check the chart using the same timeframe. Don’t apply alerts for other instruments to the current main chart.
🧭 The dashboard tells you “which instrument to check”; to see exactly what happened, confirm it on that instrument’s chart.
#多维扫描 #TradingView
🔍【Multi-Dimensional Scan】One table can display multiple instruments, but the main chart only shows the currently open instrument.
In this image, the green status appears on the BATS:NVDA row, while the main chart shows FXCM:XAUUSD. They are not the same instrument.
📊 When you see a highlighted status, first check the row name, then switch to the corresponding instrument and check the chart using the same timeframe. Don’t apply alerts for other instruments to the current main chart.
🧭 The dashboard tells you “which instrument to check”; to see exactly what happened, confirm it on that instrument’s chart.
#多维扫描 #TradingView
125
·
--
Systems Philosophy · Trading Execution Discipline: Set Rules Calmly, Execute Without Hesitation
As the price approaches the exit line, you want to give it a little more room again. First check the basis for the change; don’t mistake your current discomfort for a failure of the rules.
#执行纪律 #交易计划 #交易心理
Systems Philosophy · Trading Execution Discipline: Set Rules Calmly, Execute Without Hesitation
As the price approaches the exit line, you want to give it a little more room again. First check the basis for the change; don’t mistake your current discomfort for a failure of the rules.
#执行纪律 #交易计划 #交易心理
As the price approaches the exit line, you want to give it a little more room again. First check the basis for the change; don’t mistake your current discomfort for a failure of the rules.
#执行纪律 #交易计划 #交易心理
61
·
--
Systems Philosophy · “Sunk-Cost Trading Psychology: Don’t Let Your Cost Basis Hijack Your Decisions”
Costs can be recorded, but they can’t dictate current decisions. If your reason for holding still stands, manage the position according to plan. If an exit signal has been triggered, don’t delay just to break even.
#沉没成本 #交易心理 #持仓管理
Systems Philosophy · “Sunk-Cost Trading Psychology: Don’t Let Your Cost Basis Hijack Your Decisions”
Costs can be recorded, but they can’t dictate current decisions. If your reason for holding still stands, manage the position according to plan. If an exit signal has been triggered, don’t delay just to break even.
#沉没成本 #交易心理 #持仓管理
Costs can be recorded, but they can’t dictate current decisions. If your reason for holding still stands, manage the position according to plan. If an exit signal has been triggered, don’t delay just to break even.
#沉没成本 #交易心理 #持仓管理
73
·
--
Systems Philosophy · “Stop-Loss Psychology: The Pain of Selling Too Early and the Risk of Going to Zero”
Don’t trade your risk limits for the thought, “I sold too soon.” Once the conditions are triggered, follow the plan; leave questions about whether the rules are sound for a thorough review.
#止损心理 #交易纪律 #风险管理
Systems Philosophy · “Stop-Loss Psychology: The Pain of Selling Too Early and the Risk of Going to Zero”
Don’t trade your risk limits for the thought, “I sold too soon.” Once the conditions are triggered, follow the plan; leave questions about whether the rules are sound for a thorough review.
#止损心理 #交易纪律 #风险管理
Don’t trade your risk limits for the thought, “I sold too soon.” Once the conditions are triggered, follow the plan; leave questions about whether the rules are sound for a thorough review.
#止损心理 #交易纪律 #风险管理
60
·
--
Systems Philosophy · “Position Management: Why Staying Alive Matters More Than Getting Rich Overnight”
See others making a profit and want to increase your position? Don’t submit just yet. If the basis for the opportunity hasn’t changed, adding to your position out of emotion only increases your real risk.
#仓位管理 #交易心理 #风险管理
Systems Philosophy · “Position Management: Why Staying Alive Matters More Than Getting Rich Overnight”
See others making a profit and want to increase your position? Don’t submit just yet. If the basis for the opportunity hasn’t changed, adding to your position out of emotion only increases your real risk.
#仓位管理 #交易心理 #风险管理
See others making a profit and want to increase your position? Don’t submit just yet. If the basis for the opportunity hasn’t changed, adding to your position out of emotion only increases your real risk.
#仓位管理 #交易心理 #风险管理
49
·
--
Systematic Philosophy · “Why Is Buying the Dip Dangerous? Confirmation on the Right Side Matters More Than Guessing the Bottom”
Cheap doesn’t mean the bottom is in. Understand the impulses behind trying to call the bottom and averaging down, and spell out your confirmation criteria, exit plan, and risks before placing an order.
#抄底心理 #交易心理 #风险管理
Systematic Philosophy · “Why Is Buying the Dip Dangerous? Confirmation on the Right Side Matters More Than Guessing the Bottom”
Cheap doesn’t mean the bottom is in. Understand the impulses behind trying to call the bottom and averaging down, and spell out your confirmation criteria, exit plan, and risks before placing an order.
#抄底心理 #交易心理 #风险管理
Cheap doesn’t mean the bottom is in. Understand the impulses behind trying to call the bottom and averaging down, and spell out your confirmation criteria, exit plan, and risks before placing an order.
#抄底心理 #交易心理 #风险管理
80
·
--
Systems Philosophy · Why Is Bottom Fishing Dangerous? Right-Side Confirmation Matters More Than Guessing the Bottom
Cheap doesn’t mean the bottom is in. Understand the impulse behind trying to call a bottom and averaging down, and write down your confirmation criteria, exit plan, and risks before placing an order.
#抄底心理 #交易心理 #风险管理
Systems Philosophy · Why Is Bottom Fishing Dangerous? Right-Side Confirmation Matters More Than Guessing the Bottom
Cheap doesn’t mean the bottom is in. Understand the impulse behind trying to call a bottom and averaging down, and write down your confirmation criteria, exit plan, and risks before placing an order.
#抄底心理 #交易心理 #风险管理
Cheap doesn’t mean the bottom is in. Understand the impulse behind trying to call a bottom and averaging down, and write down your confirmation criteria, exit plan, and risks before placing an order.
#抄底心理 #交易心理 #风险管理
35
·
--
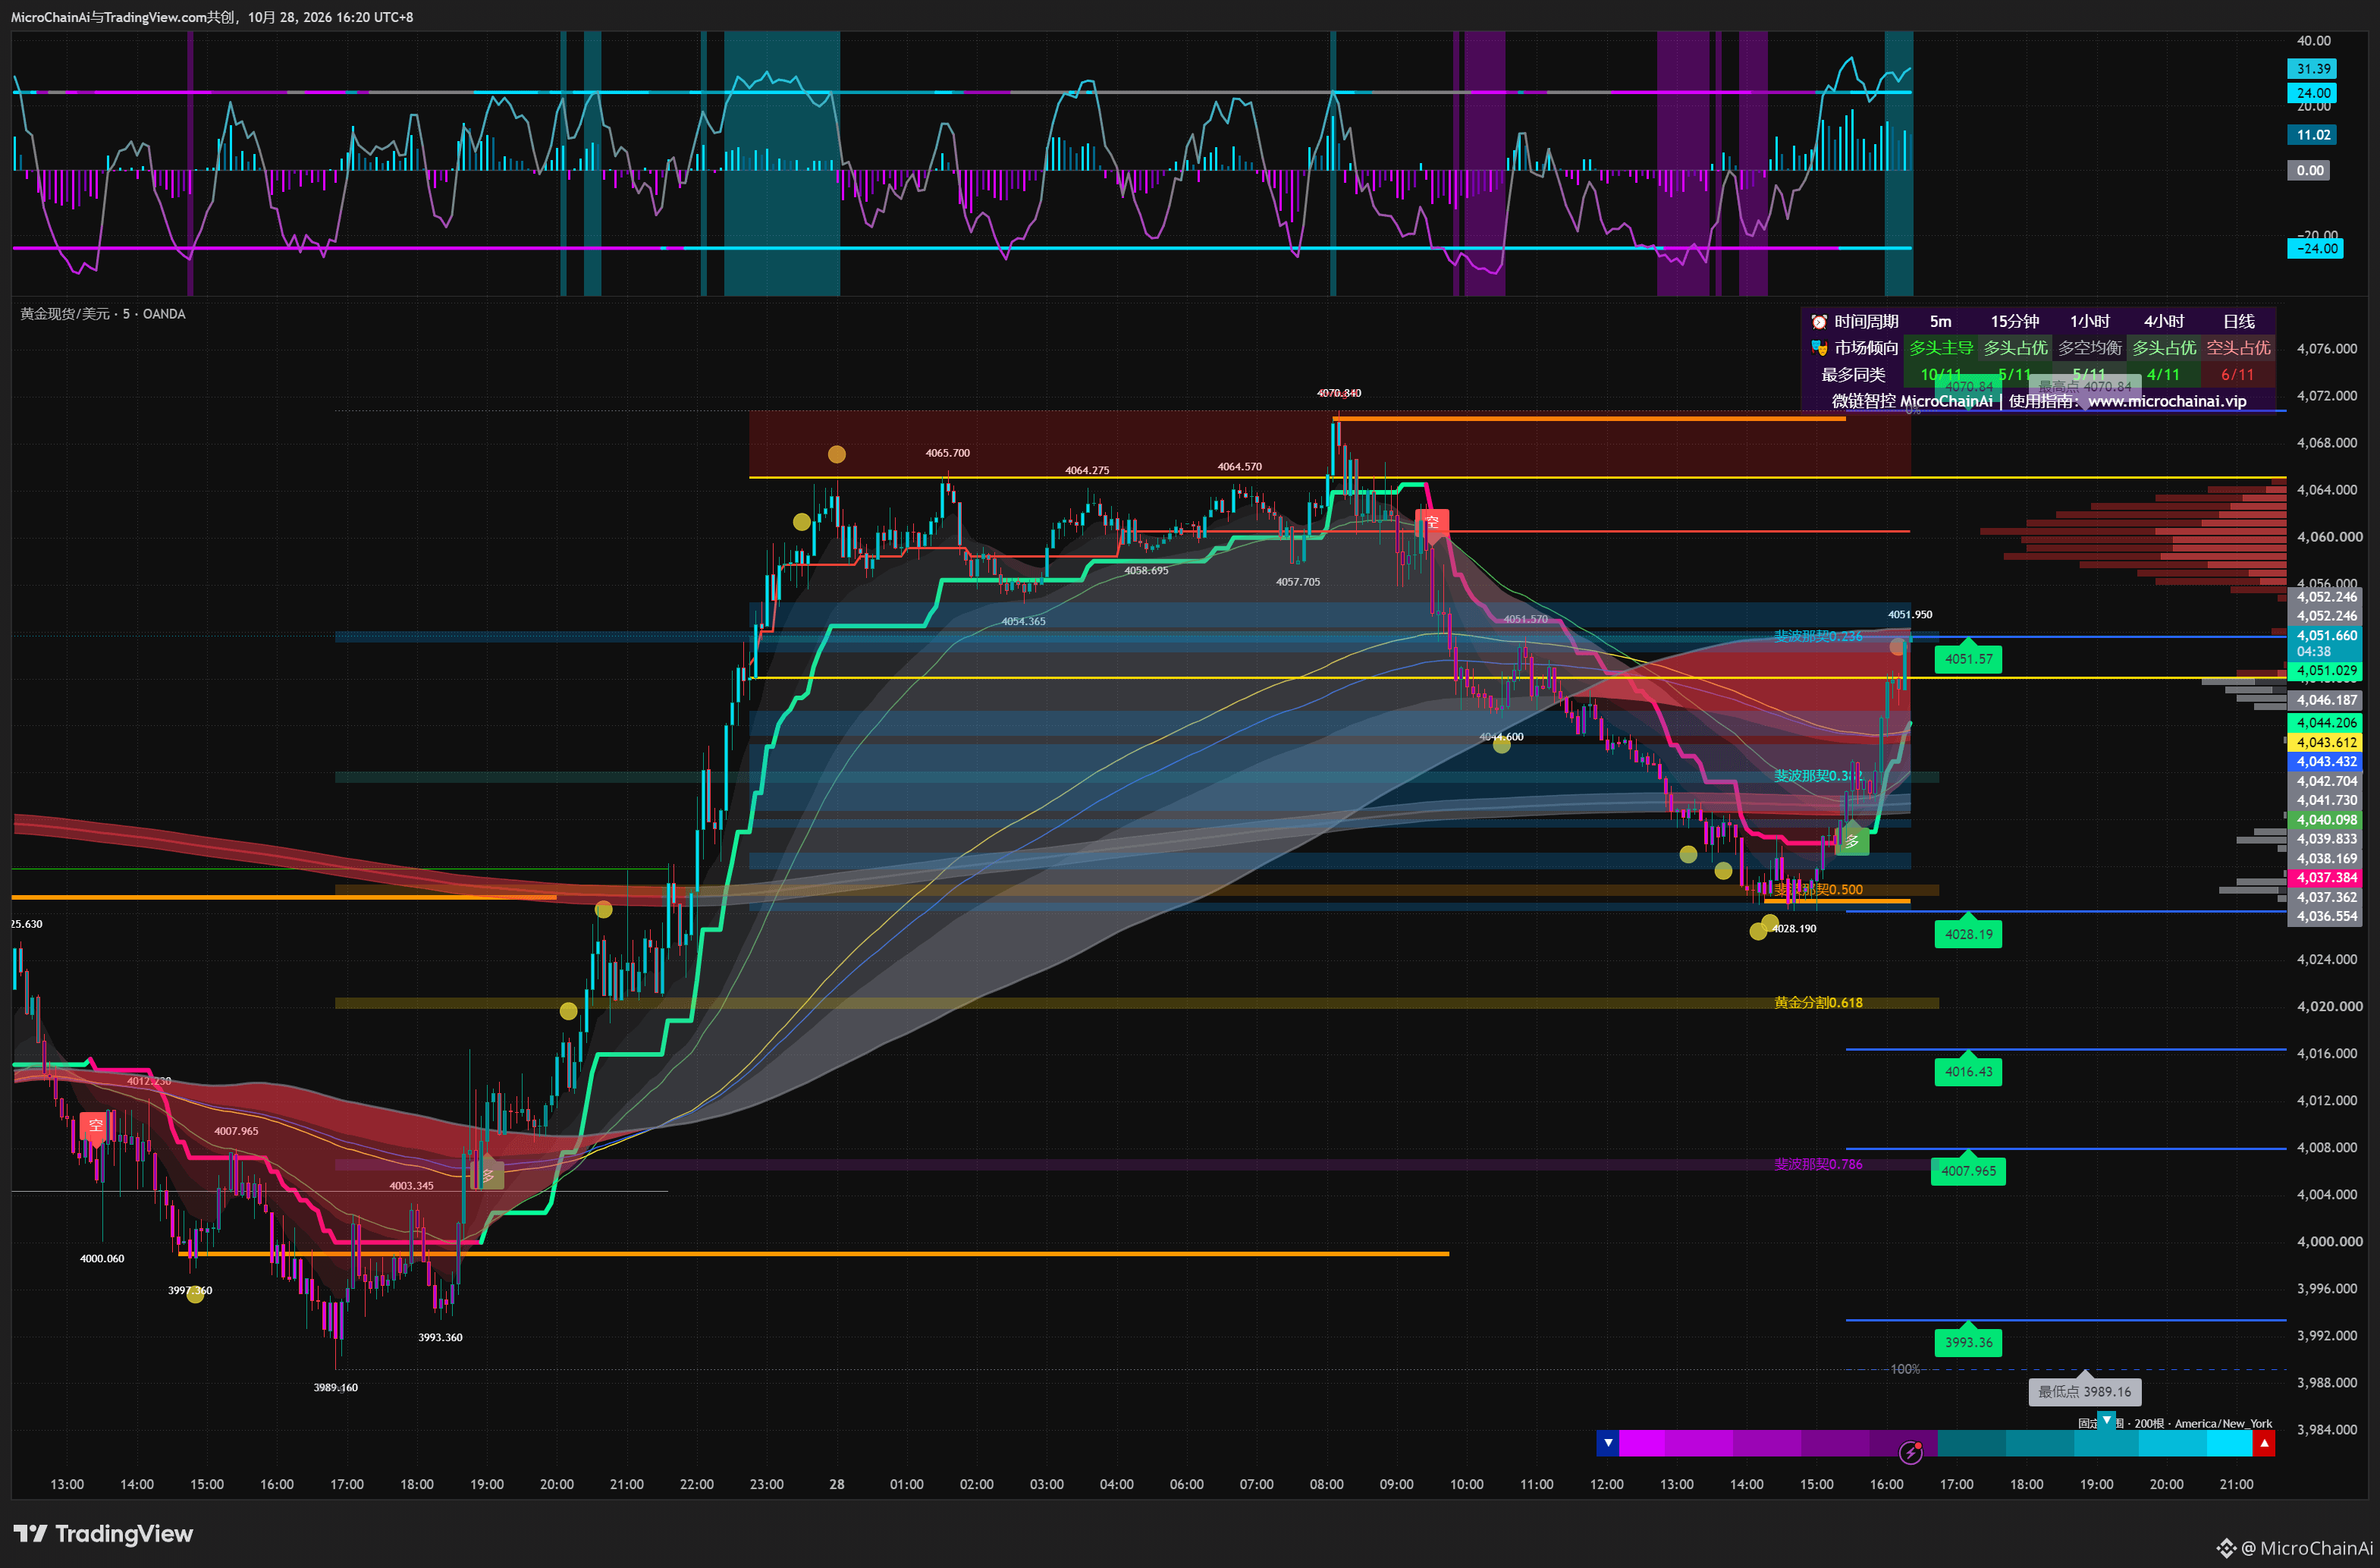
The clearest change in this rebound isn’t that the price has broken above its previous high, but that short-term momentum has strengthened first. 🔍
The price quickly recovered from 4028.19 to 4051.95, and the peak momentum reading rose to 31.39, above the +24 reference line. However, the price is still below the previous high of 4070.84. This shows that the recent rise has been rapid, but the price has yet to break through that level.
📊 Momentum indicators compare the strength of recent changes, while previous highs show the actual price level reached. They measure different things, so “momentum makes a new high while price does not” can happen at the same time.
🧭 Next, watch whether strong momentum can translate into structural progress: will the price hold around 4051 and continue advancing toward the 4064–4071 zone?
Momentum signals that strength is building; price confirms how far that strength ultimately carries it.
#黄金
The clearest change in this rebound isn’t that the price has broken above its previous high, but that short-term momentum has strengthened first. 🔍
The price quickly recovered from 4028.19 to 4051.95, and the peak momentum reading rose to 31.39, above the +24 reference line. However, the price is still below the previous high of 4070.84. This shows that the recent rise has been rapid, but the price has yet to break through that level.
📊 Momentum indicators compare the strength of recent changes, while previous highs show the actual price level reached. They measure different things, so “momentum makes a new high while price does not” can happen at the same time.
🧭 Next, watch whether strong momentum can translate into structural progress: will the price hold around 4051 and continue advancing toward the 4064–4071 zone?
Momentum signals that strength is building; price confirms how far that strength ultimately carries it.
#黄金
The price quickly recovered from 4028.19 to 4051.95, and the peak momentum reading rose to 31.39, above the +24 reference line. However, the price is still below the previous high of 4070.84. This shows that the recent rise has been rapid, but the price has yet to break through that level.
📊 Momentum indicators compare the strength of recent changes, while previous highs show the actual price level reached. They measure different things, so “momentum makes a new high while price does not” can happen at the same time.
🧭 Next, watch whether strong momentum can translate into structural progress: will the price hold around 4051 and continue advancing toward the 4064–4071 zone?
Momentum signals that strength is building; price confirms how far that strength ultimately carries it.
#黄金
118
·
--
How to interpret take-profit signals while holding a position
A complete guide to the order of observations after entering a position, from triangle signals to multiple timeframes, using the three-source oscillation filter. Any position reduction or exit should be considered alongside the original exit plan.
#持仓管理 #止盈减仓 #TradingView #三源振滤
How to interpret take-profit signals while holding a position
A complete guide to the order of observations after entering a position, from triangle signals to multiple timeframes, using the three-source oscillation filter. Any position reduction or exit should be considered alongside the original exit plan.
#持仓管理 #止盈减仓 #TradingView #三源振滤
A complete guide to the order of observations after entering a position, from triangle signals to multiple timeframes, using the three-source oscillation filter. Any position reduction or exit should be considered alongside the original exit plan.
#持仓管理 #止盈减仓 #TradingView #三源振滤
64
·
--
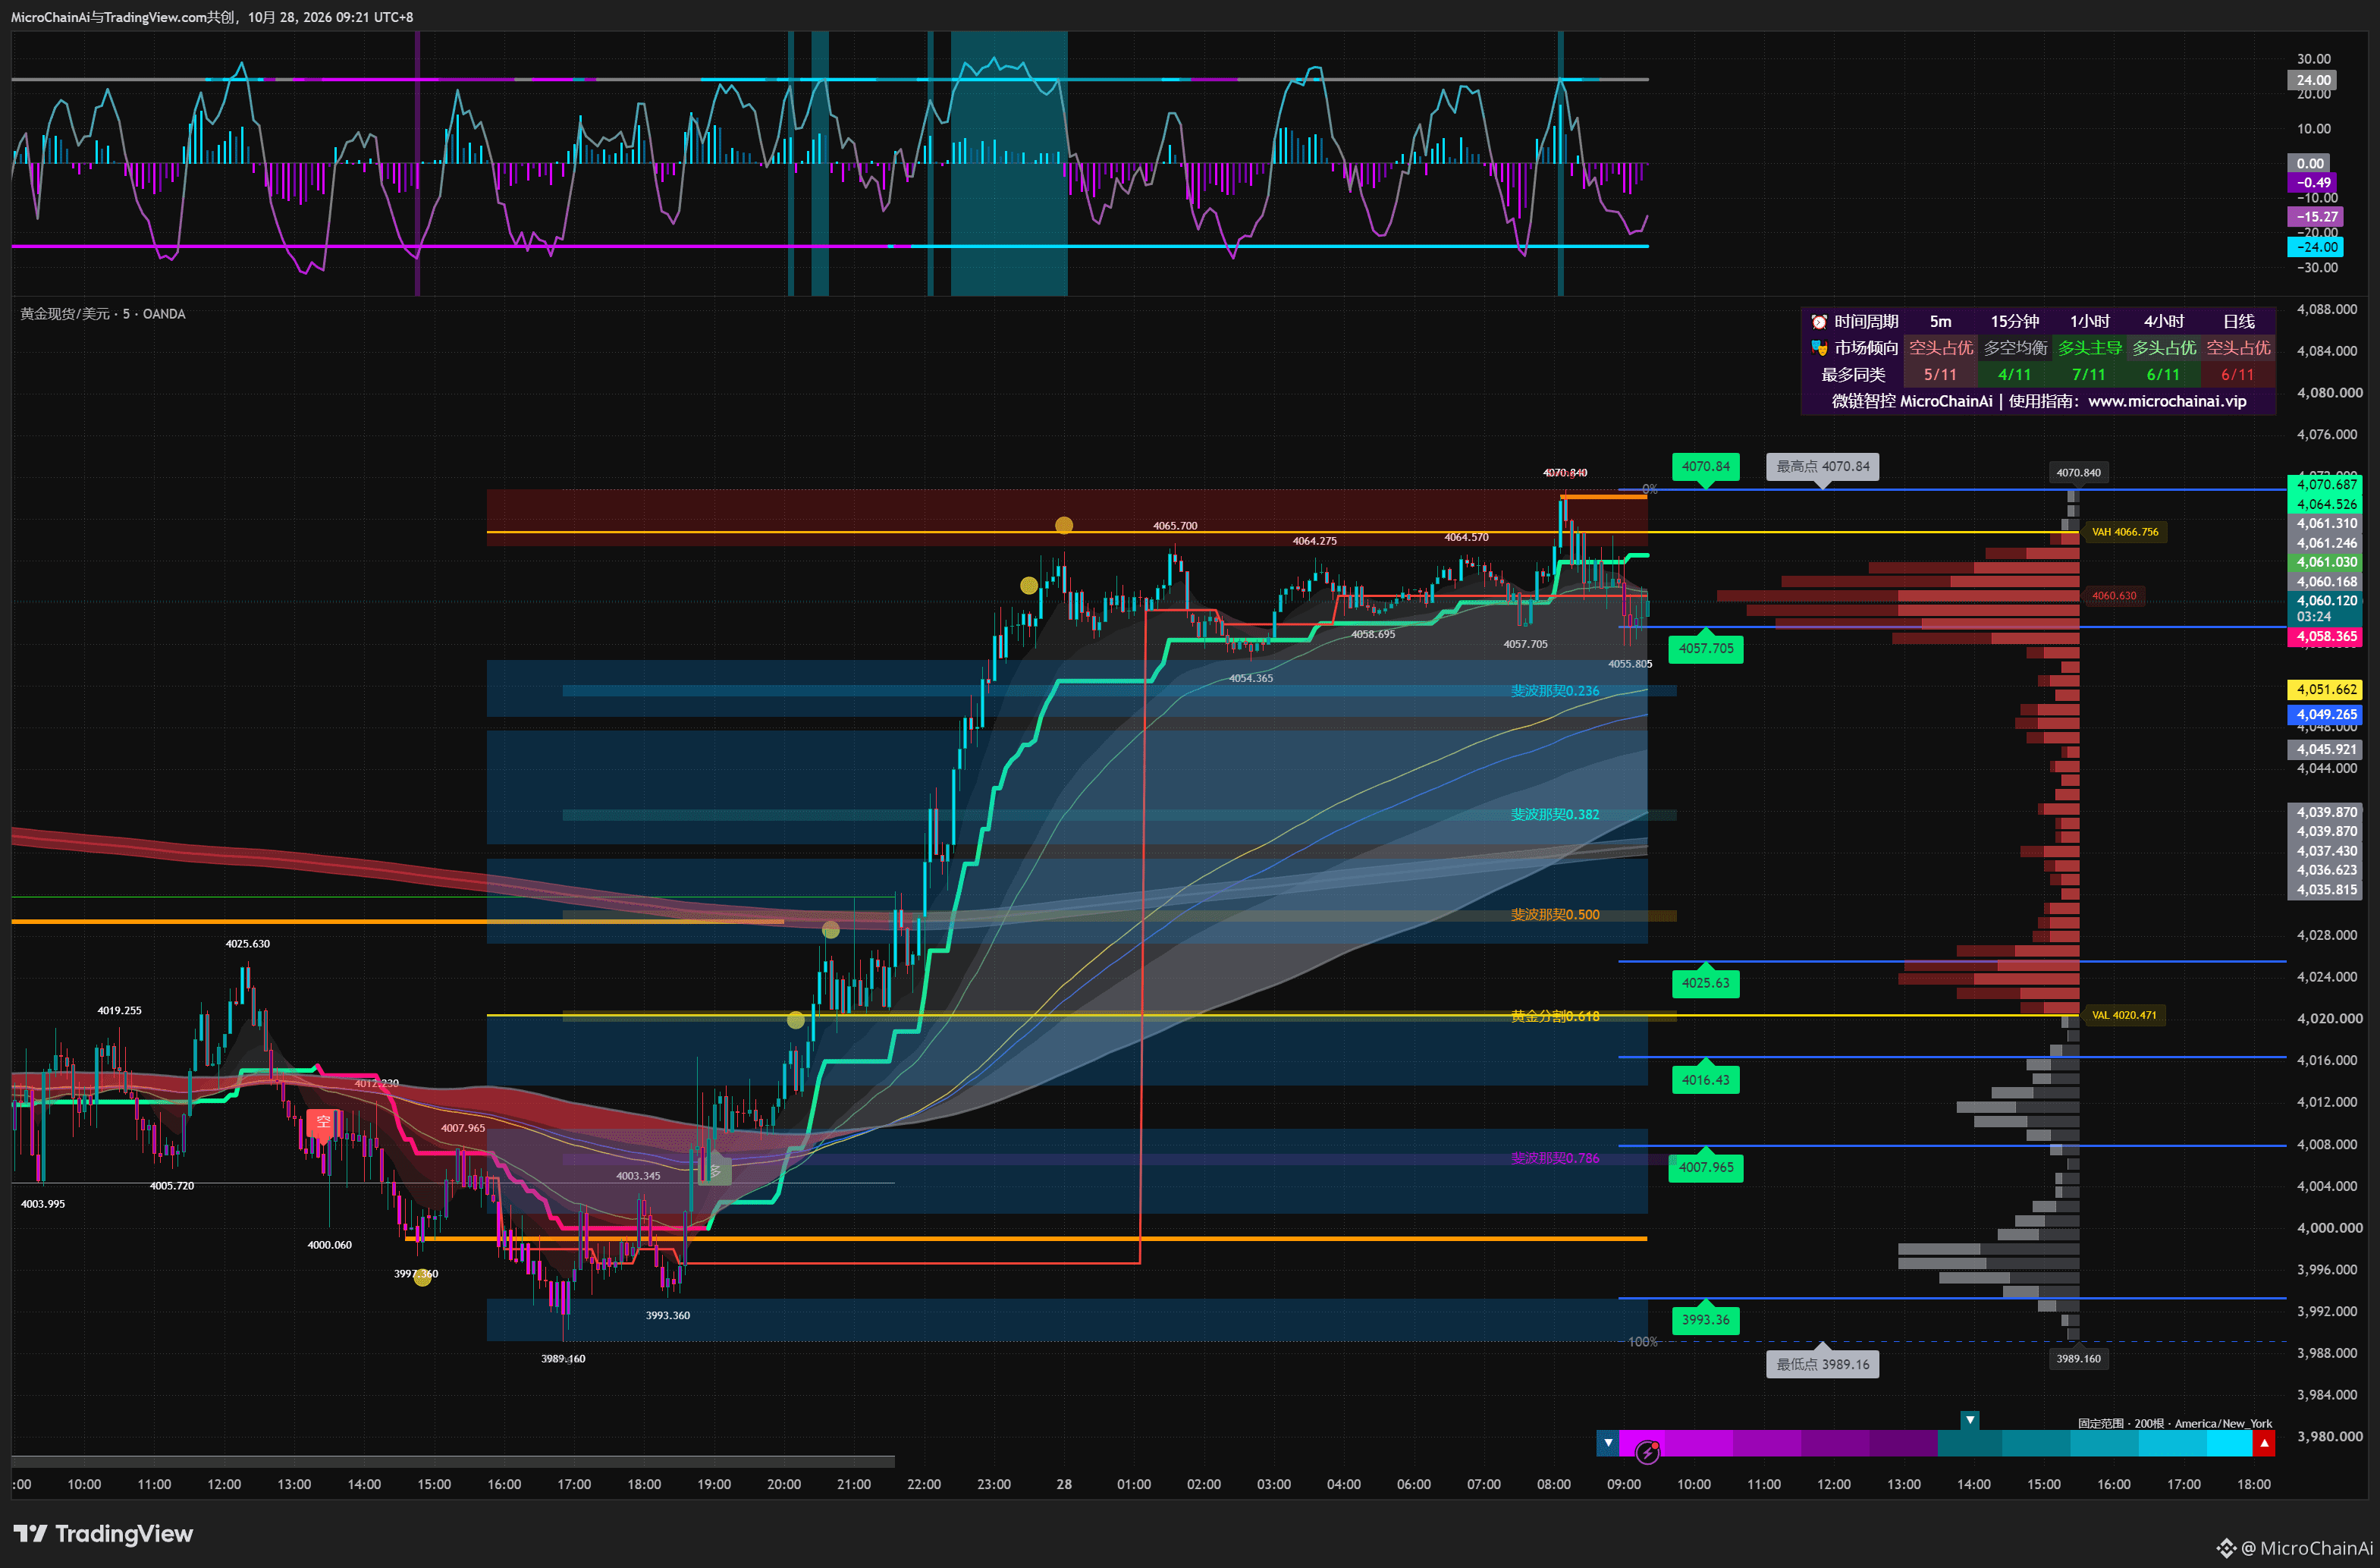
Gold climbed rapidly from 3989.16 to 4070.84, then pulled back to around 4060.🔍
📊 A pullback alone cannot be directly defined as a trend reversal. The price in the chart is still above the rising trend’s central zone, and the green step line continues to move higher. The main structure formed by the previous rise has not yet been broken; however, clear resistance appeared near 4070, showing that price has responded to the pressure above.
🧭 To assess the nature of this pullback, the key is not the number of bearish candles, but where subsequent lows form: if the pullback is followed by a higher low, the upward structure still has room to continue; if key support is broken repeatedly and lower highs form, then the structure has materially changed.
A correction describes a process; a trend change requires structural evidence.
#黄金
Gold climbed rapidly from 3989.16 to 4070.84, then pulled back to around 4060.🔍
📊 A pullback alone cannot be directly defined as a trend reversal. The price in the chart is still above the rising trend’s central zone, and the green step line continues to move higher. The main structure formed by the previous rise has not yet been broken; however, clear resistance appeared near 4070, showing that price has responded to the pressure above.
🧭 To assess the nature of this pullback, the key is not the number of bearish candles, but where subsequent lows form: if the pullback is followed by a higher low, the upward structure still has room to continue; if key support is broken repeatedly and lower highs form, then the structure has materially changed.
A correction describes a process; a trend change requires structural evidence.
#黄金
📊 A pullback alone cannot be directly defined as a trend reversal. The price in the chart is still above the rising trend’s central zone, and the green step line continues to move higher. The main structure formed by the previous rise has not yet been broken; however, clear resistance appeared near 4070, showing that price has responded to the pressure above.
🧭 To assess the nature of this pullback, the key is not the number of bearish candles, but where subsequent lows form: if the pullback is followed by a higher low, the upward structure still has room to continue; if key support is broken repeatedly and lower highs form, then the structure has materially changed.
A correction describes a process; a trend change requires structural evidence.
#黄金
178
·
--
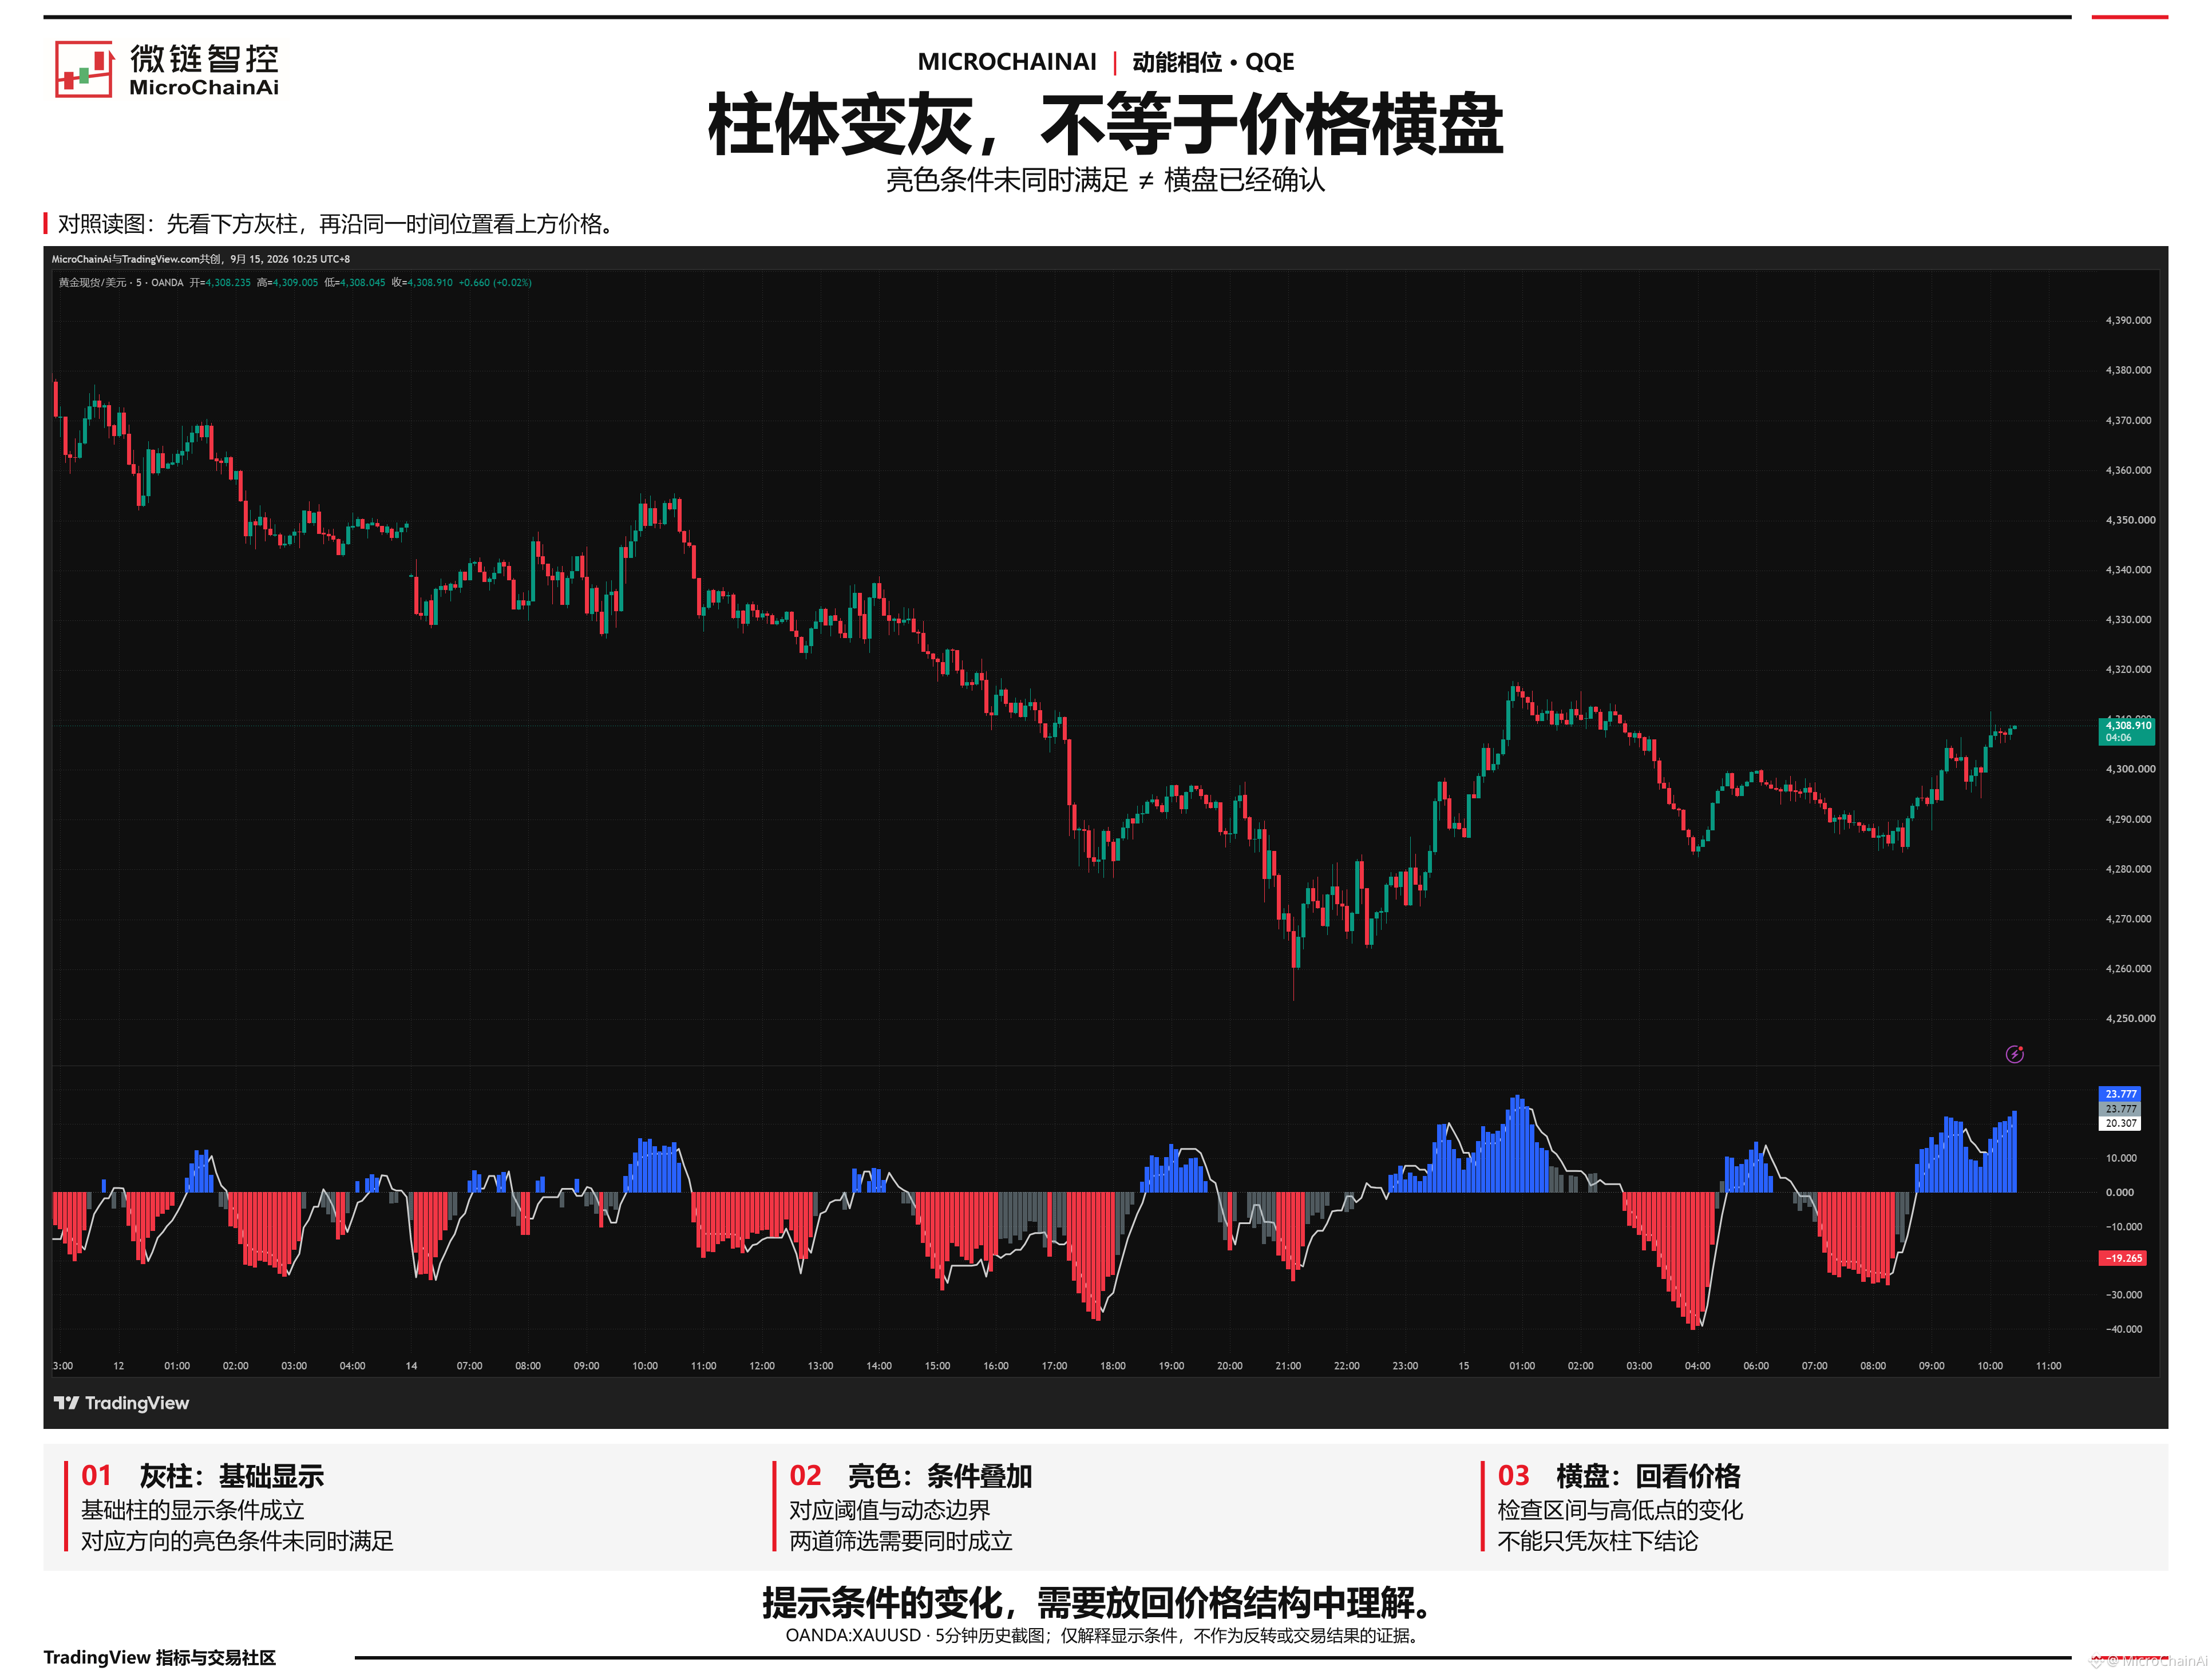
QQE has turned gray—does that mean the market has definitely entered a ranging phase?
When you see the blue or red bars disappear and gray bars appear, it’s easy to label the market: the trend is over, and now it’s going sideways.
But that conclusion goes beyond what the bars themselves tell you.
🔍 In the QQE module of 【Momentum Phase】, a bright-colored bar must pass two filters at the same time: the smoothed RSI must cross the threshold for the corresponding direction, and another smoothed RSI must also cross the dynamic boundary in that same direction. Only when both conditions are met will the corresponding blue or red bar appear.
📌 Gray bars appearing only means the conditions for displaying the basic bar are met, while the bright-color conditions for the corresponding direction are not met at the same time. It does not additionally check whether “price has entered a stable range.”
Look at the middle section of the image: when gray bars appear below, the price above still has stretches where its center of gravity is moving lower. Gray bars and falling prices can occur at the same time. When reading this kind of chart, compare the bars with the price structure at the same moment.
⚠ Gray bars do not mean a reversal is coming, and gray bars won’t necessarily appear every time there are “no bright bars.”
To determine whether the market is ranging, you also need to see whether price is repeatedly moving back and forth within a relatively stable range, and whether the highs and lows continue to advance.
The failure of one signal condition does not automatically prove that a different market state is in effect.
When you see gray bars, do you look back at the price structure, or immediately classify the market as ranging?
#动能相位 #TradingView
QQE has turned gray—does that mean the market has definitely entered a ranging phase?
When you see the blue or red bars disappear and gray bars appear, it’s easy to label the market: the trend is over, and now it’s going sideways.
But that conclusion goes beyond what the bars themselves tell you.
🔍 In the QQE module of 【Momentum Phase】, a bright-colored bar must pass two filters at the same time: the smoothed RSI must cross the threshold for the corresponding direction, and another smoothed RSI must also cross the dynamic boundary in that same direction. Only when both conditions are met will the corresponding blue or red bar appear.
📌 Gray bars appearing only means the conditions for displaying the basic bar are met, while the bright-color conditions for the corresponding direction are not met at the same time. It does not additionally check whether “price has entered a stable range.”
Look at the middle section of the image: when gray bars appear below, the price above still has stretches where its center of gravity is moving lower. Gray bars and falling prices can occur at the same time. When reading this kind of chart, compare the bars with the price structure at the same moment.
⚠ Gray bars do not mean a reversal is coming, and gray bars won’t necessarily appear every time there are “no bright bars.”
To determine whether the market is ranging, you also need to see whether price is repeatedly moving back and forth within a relatively stable range, and whether the highs and lows continue to advance.
The failure of one signal condition does not automatically prove that a different market state is in effect.
When you see gray bars, do you look back at the price structure, or immediately classify the market as ranging?
#动能相位 #TradingView
When you see the blue or red bars disappear and gray bars appear, it’s easy to label the market: the trend is over, and now it’s going sideways.
But that conclusion goes beyond what the bars themselves tell you.
🔍 In the QQE module of 【Momentum Phase】, a bright-colored bar must pass two filters at the same time: the smoothed RSI must cross the threshold for the corresponding direction, and another smoothed RSI must also cross the dynamic boundary in that same direction. Only when both conditions are met will the corresponding blue or red bar appear.
📌 Gray bars appearing only means the conditions for displaying the basic bar are met, while the bright-color conditions for the corresponding direction are not met at the same time. It does not additionally check whether “price has entered a stable range.”
Look at the middle section of the image: when gray bars appear below, the price above still has stretches where its center of gravity is moving lower. Gray bars and falling prices can occur at the same time. When reading this kind of chart, compare the bars with the price structure at the same moment.
⚠ Gray bars do not mean a reversal is coming, and gray bars won’t necessarily appear every time there are “no bright bars.”
To determine whether the market is ranging, you also need to see whether price is repeatedly moving back and forth within a relatively stable range, and whether the highs and lows continue to advance.
The failure of one signal condition does not automatically prove that a different market state is in effect.
When you see gray bars, do you look back at the price structure, or immediately classify the market as ranging?
#动能相位 #TradingView
70
·
--
How do you compare multiple timeframes?
A signal appeared on the 5-minute chart—what should you look for on the 30-minute chart? A real-chart example with the Three-Source Oscillator Filter explains how to compare across timeframes: align the timing first, then check your original position plan.
#多周期分析 #TradingView #三源振滤
How do you compare multiple timeframes?
A signal appeared on the 5-minute chart—what should you look for on the 30-minute chart? A real-chart example with the Three-Source Oscillator Filter explains how to compare across timeframes: align the timing first, then check your original position plan.
#多周期分析 #TradingView #三源振滤
A signal appeared on the 5-minute chart—what should you look for on the 30-minute chart? A real-chart example with the Three-Source Oscillator Filter explains how to compare across timeframes: align the timing first, then check your original position plan.
#多周期分析 #TradingView #三源振滤
77
·
--
Why can harmonic patterns of the same color be bullish in one case and bearish in another?
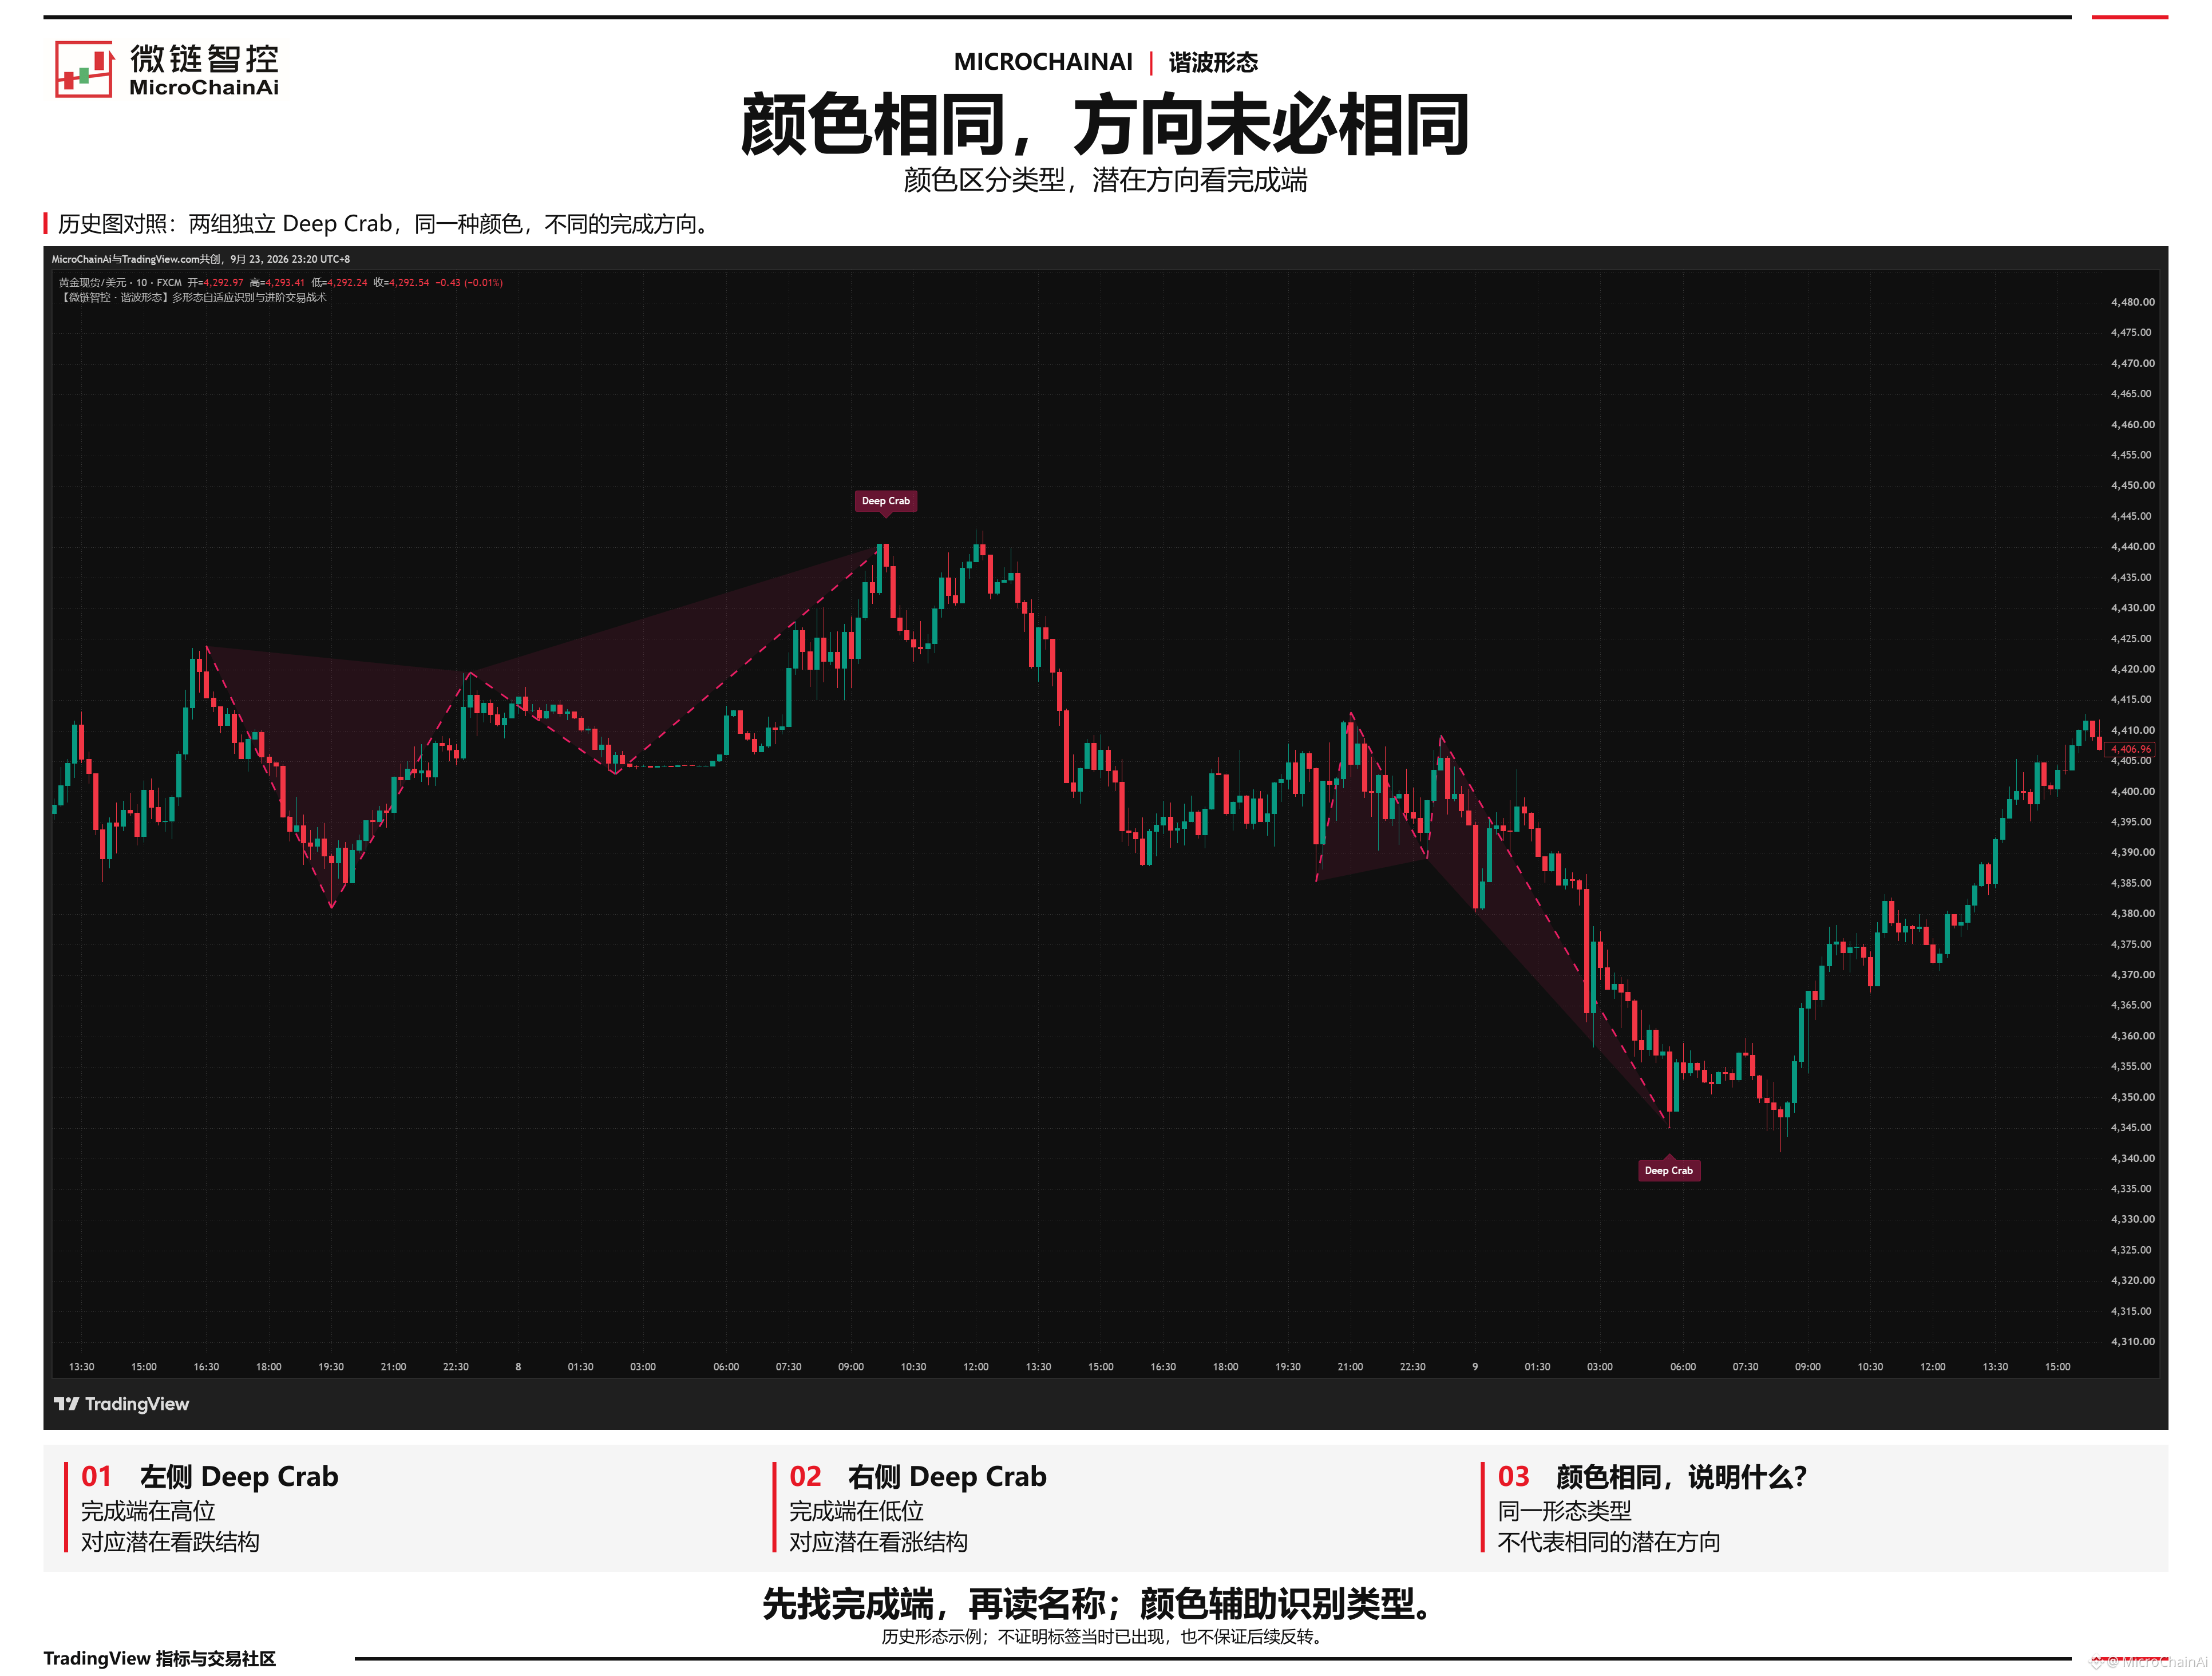
🔍 Take a look at this historical chart of 【harmonic patterns】: both the left and right patterns are labeled Deep Crab and have the same color, but the left one completes at a high and the right one at a low.
If you judge direction by color alone, it’s easy to read the two patterns as meaning the same thing.
The reason is that this indicator uses color to distinguish pattern types, not to indicate whether they’re bullish or bearish.
📌 To read the direction, find where the pattern completes: the D point.
The left pattern completes at a high, indicating a potentially bearish structure;
The right pattern completes at a low, indicating a potentially bullish structure.
The name tells you “what type of pattern it is,” while the completion point and structure orientation help you determine “which side’s potential reaction to watch.” The same pattern type can point in different directions.
⚠ “Potentially bullish/bearish” still doesn’t mean a reversal is certain. Nor does the label’s position on a historical chart prove it was already visible at the time of the turning point.
When reading harmonic patterns, find the completion point first, then read the name; color is only a visual aid for identifying the pattern type.
When you look at charts like this, what do you notice first: the color, the name, or the completion point?
Why can harmonic patterns of the same color be bullish in one case and bearish in another?
🔍 Take a look at this historical chart of 【harmonic patterns】: both the left and right patterns are labeled Deep Crab and have the same color, but the left one completes at a high and the right one at a low.
If you judge direction by color alone, it’s easy to read the two patterns as meaning the same thing.
The reason is that this indicator uses color to distinguish pattern types, not to indicate whether they’re bullish or bearish.
📌 To read the direction, find where the pattern completes: the D point.
The left pattern completes at a high, indicating a potentially bearish structure;
The right pattern completes at a low, indicating a potentially bullish structure.
The name tells you “what type of pattern it is,” while the completion point and structure orientation help you determine “which side’s potential reaction to watch.” The same pattern type can point in different directions.
⚠ “Potentially bullish/bearish” still doesn’t mean a reversal is certain. Nor does the label’s position on a historical chart prove it was already visible at the time of the turning point.
When reading harmonic patterns, find the completion point first, then read the name; color is only a visual aid for identifying the pattern type.
When you look at charts like this, what do you notice first: the color, the name, or the completion point?
🔍 Take a look at this historical chart of 【harmonic patterns】: both the left and right patterns are labeled Deep Crab and have the same color, but the left one completes at a high and the right one at a low.
If you judge direction by color alone, it’s easy to read the two patterns as meaning the same thing.
The reason is that this indicator uses color to distinguish pattern types, not to indicate whether they’re bullish or bearish.
📌 To read the direction, find where the pattern completes: the D point.
The left pattern completes at a high, indicating a potentially bearish structure;
The right pattern completes at a low, indicating a potentially bullish structure.
The name tells you “what type of pattern it is,” while the completion point and structure orientation help you determine “which side’s potential reaction to watch.” The same pattern type can point in different directions.
⚠ “Potentially bullish/bearish” still doesn’t mean a reversal is certain. Nor does the label’s position on a historical chart prove it was already visible at the time of the turning point.
When reading harmonic patterns, find the completion point first, then read the name; color is only a visual aid for identifying the pattern type.
When you look at charts like this, what do you notice first: the color, the name, or the completion point?
89
·
--
How to interpret take-profit and position-reduction signals
If you already have a position, how should you read the band-exit triangle from the Three-Source Oscillation Filter? A chart example explains what the signal means. Continue to follow your original plan when reducing or exiting your position.
#止盈减仓 #TradingView #三源振滤
How to interpret take-profit and position-reduction signals
If you already have a position, how should you read the band-exit triangle from the Three-Source Oscillation Filter? A chart example explains what the signal means. Continue to follow your original plan when reducing or exiting your position.
#止盈减仓 #TradingView #三源振滤
If you already have a position, how should you read the band-exit triangle from the Three-Source Oscillation Filter? A chart example explains what the signal means. Continue to follow your original plan when reducing or exiting your position.
#止盈减仓 #TradingView #三源振滤
83
·
--
Does RSI always reverse when it's overbought?
What does a cyan background lasting several candlesticks mean? Momentum filtering clarifies how RSI enters and exits extreme territory—don't mistake overbought for a market top.
#RSI指标 #超买超卖 #TradingView #动能滤波
Does RSI always reverse when it's overbought?
What does a cyan background lasting several candlesticks mean? Momentum filtering clarifies how RSI enters and exits extreme territory—don't mistake overbought for a market top.
#RSI指标 #超买超卖 #TradingView #动能滤波
What does a cyan background lasting several candlesticks mean? Momentum filtering clarifies how RSI enters and exits extreme territory—don't mistake overbought for a market top.
#RSI指标 #超买超卖 #TradingView #动能滤波
60
·
--
A brief pause during a decline isn't enough on its own to confirm a bottom.🔍
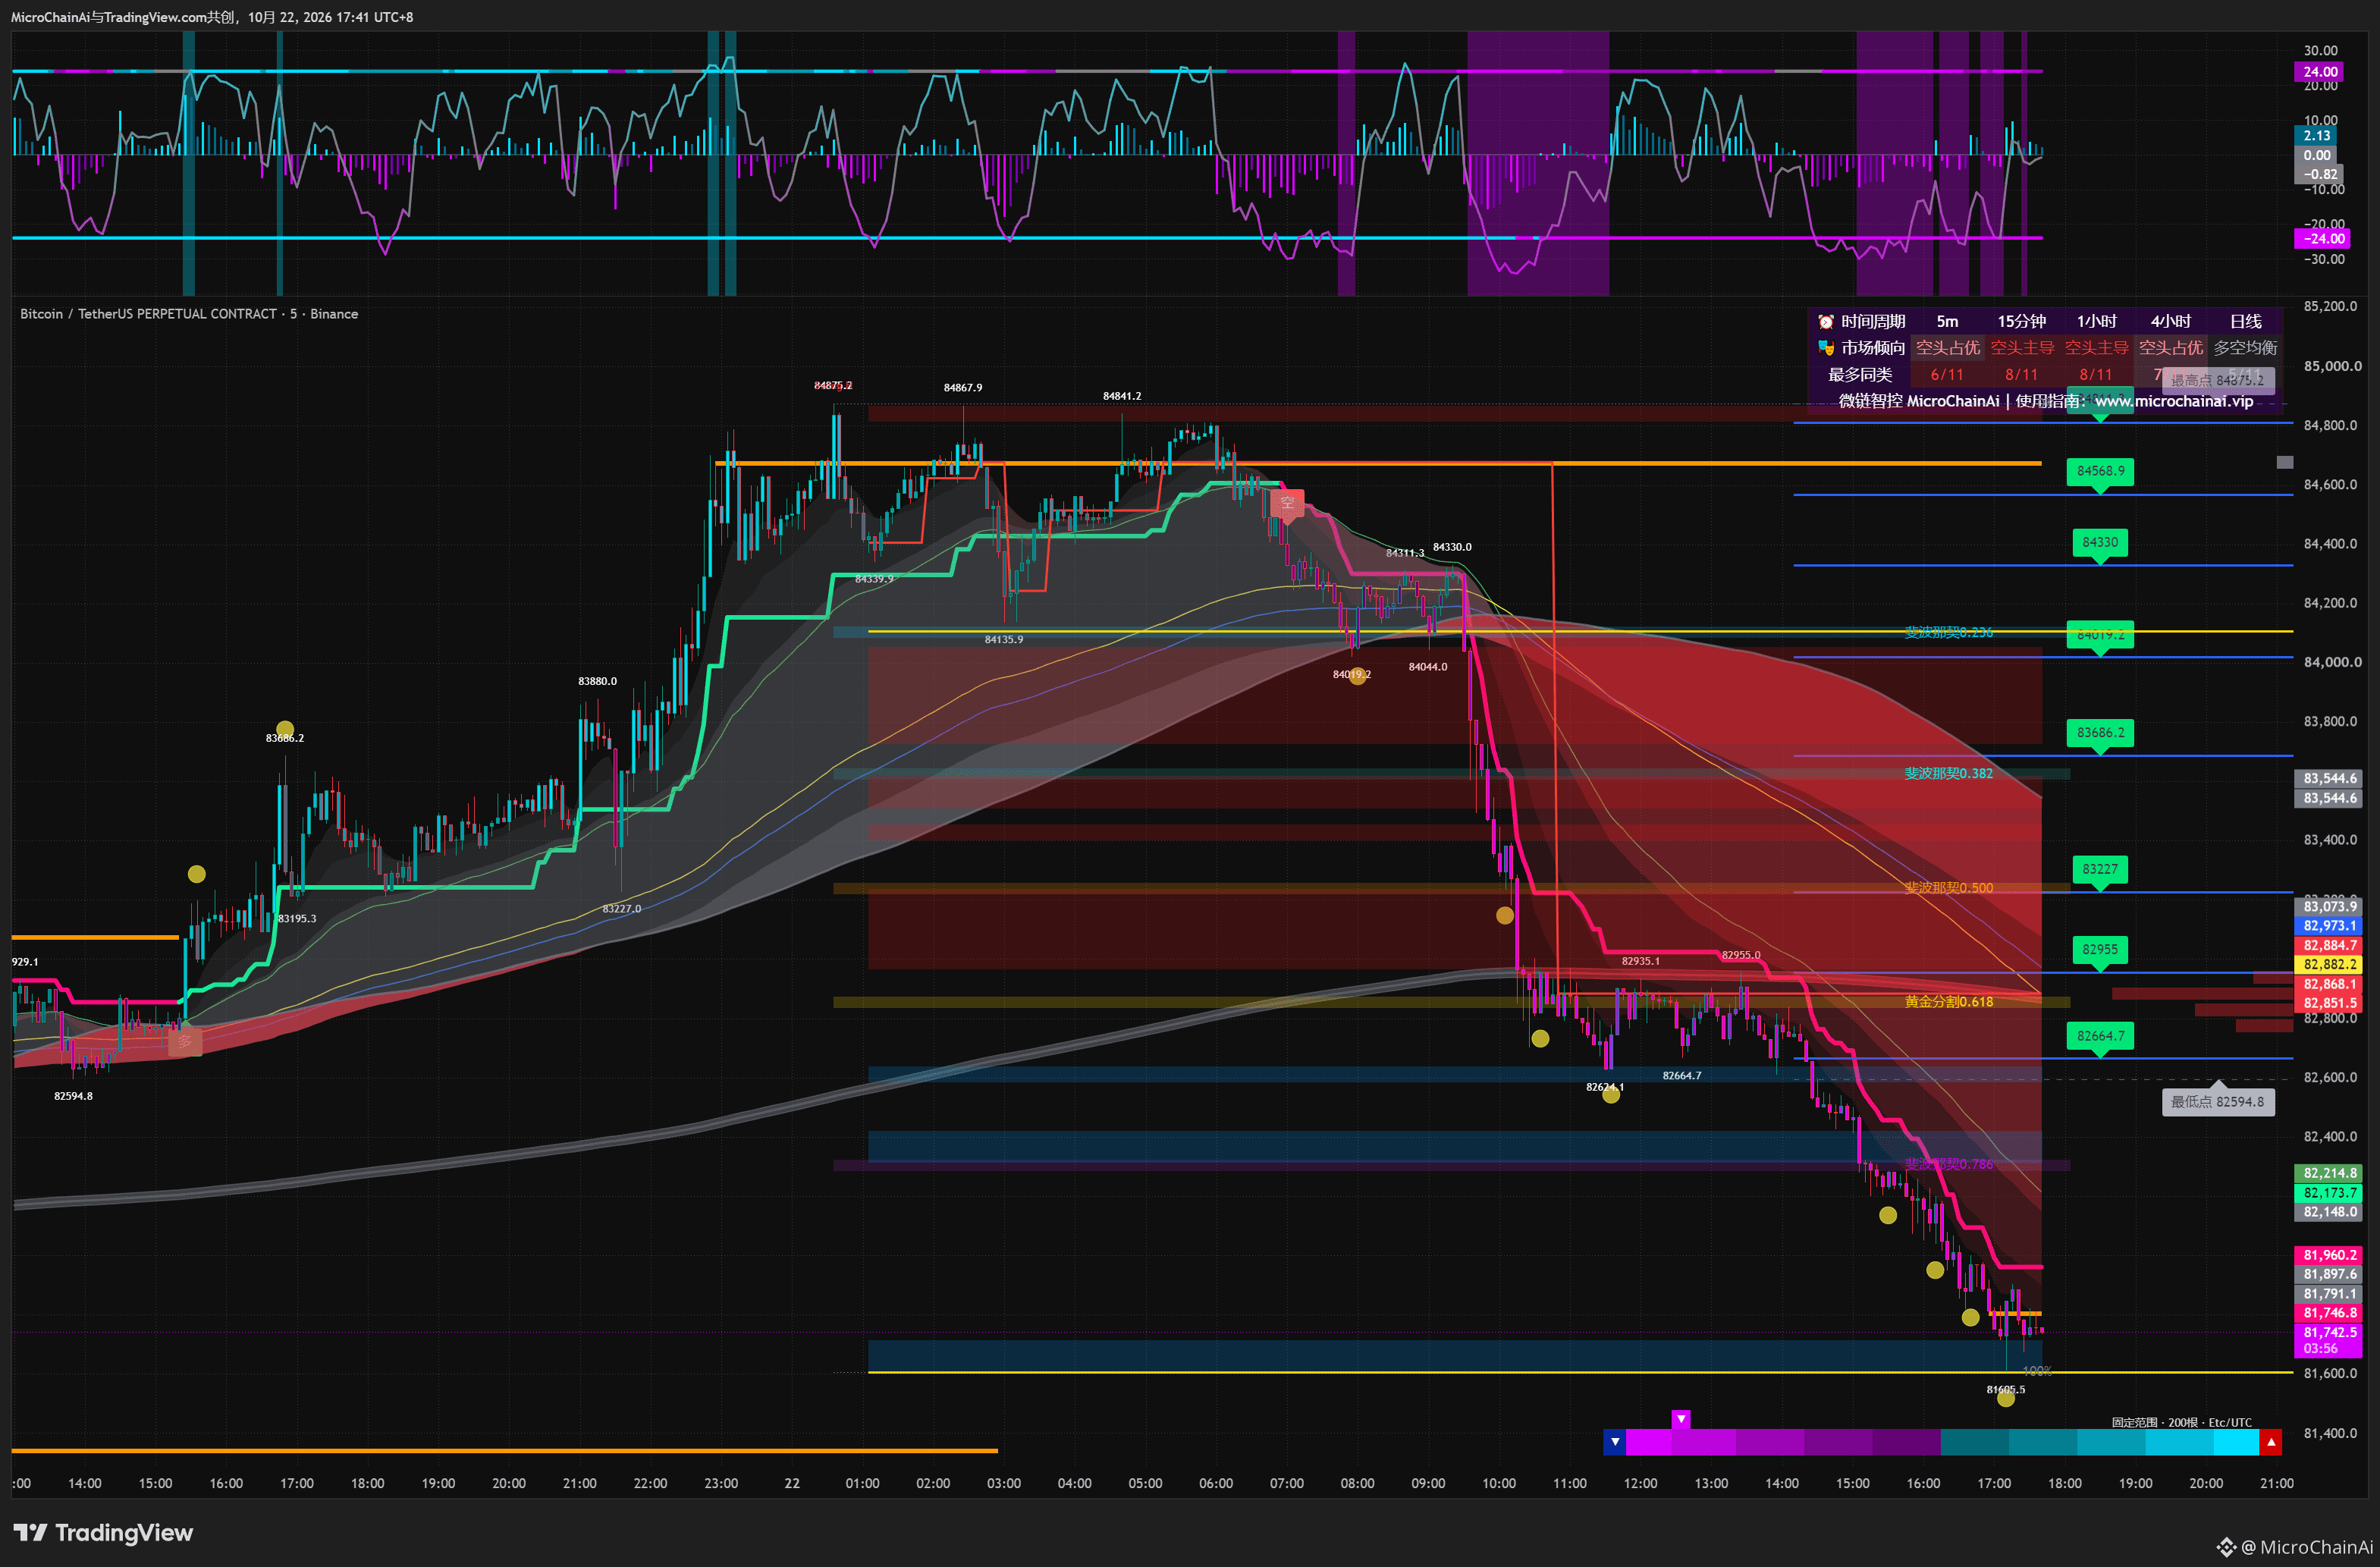
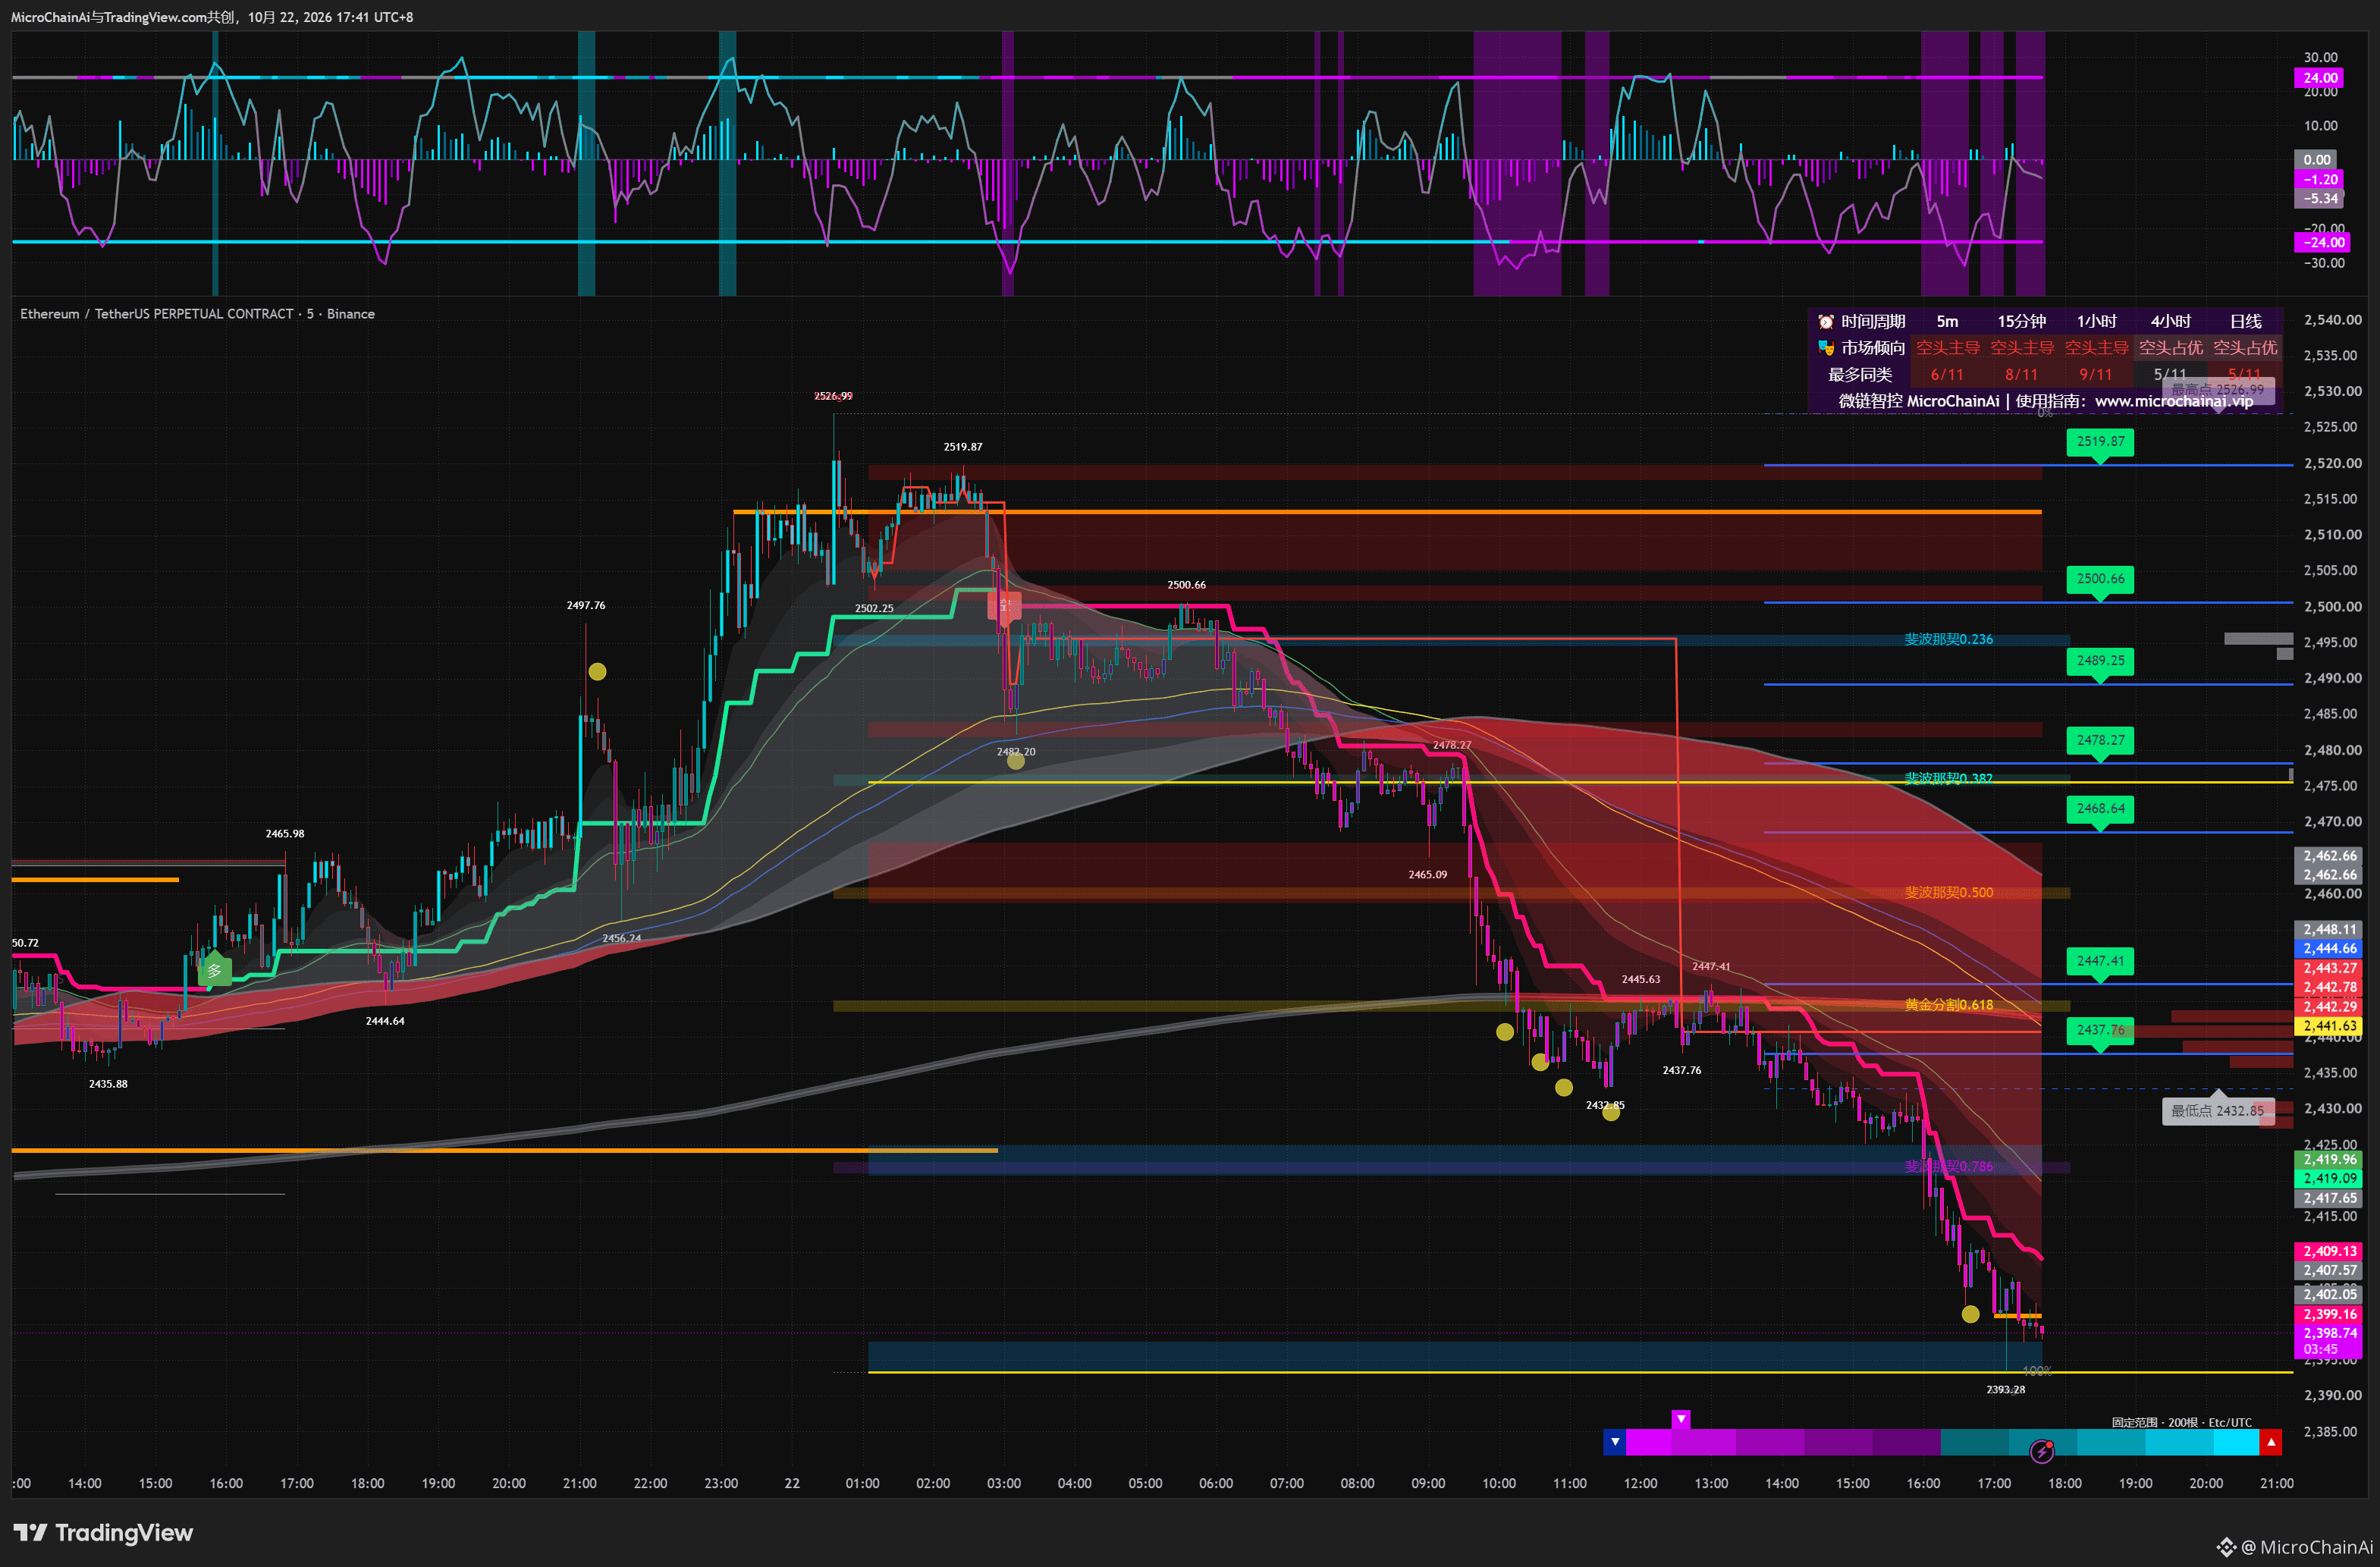
In the two 5-minute charts, BTC fluctuated around 82,800 after a sharp drop, while ETH consolidated around 2,440. Prices then moved lower again.
📊 A sideways range means price fluctuations narrowed during that period. But whether consolidation can change the trend depends on how price eventually exits the range and whether it can hold its ground afterward.
This time, price broke below the consolidation range, and the pink steps continued lower, showing that the earlier pause had not stopped the downtrend from continuing.
🧭 This doesn't mean that every sideways range after a drop will break downward. During consolidation, both an upward recovery and a continuation lower should remain possible.
A pause describes the pace of the move. The breakout and what follows provide new evidence about direction.
#BTC走势分析 #ETH
A brief pause during a decline isn't enough on its own to confirm a bottom.🔍
In the two 5-minute charts, BTC fluctuated around 82,800 after a sharp drop, while ETH consolidated around 2,440. Prices then moved lower again.
📊 A sideways range means price fluctuations narrowed during that period. But whether consolidation can change the trend depends on how price eventually exits the range and whether it can hold its ground afterward.
This time, price broke below the consolidation range, and the pink steps continued lower, showing that the earlier pause had not stopped the downtrend from continuing.
🧭 This doesn't mean that every sideways range after a drop will break downward. During consolidation, both an upward recovery and a continuation lower should remain possible.
A pause describes the pace of the move. The breakout and what follows provide new evidence about direction.
#BTC走势分析 #ETH
In the two 5-minute charts, BTC fluctuated around 82,800 after a sharp drop, while ETH consolidated around 2,440. Prices then moved lower again.
📊 A sideways range means price fluctuations narrowed during that period. But whether consolidation can change the trend depends on how price eventually exits the range and whether it can hold its ground afterward.
This time, price broke below the consolidation range, and the pink steps continued lower, showing that the earlier pause had not stopped the downtrend from continuing.
🧭 This doesn't mean that every sideways range after a drop will break downward. During consolidation, both an upward recovery and a continuation lower should remain possible.
A pause describes the pace of the move. The breakout and what follows provide new evidence about direction.
#BTC走势分析 #ETH
241
·
--
A rapid rebound should be judged both by how much ground it recovers and where it stalls. 🔍
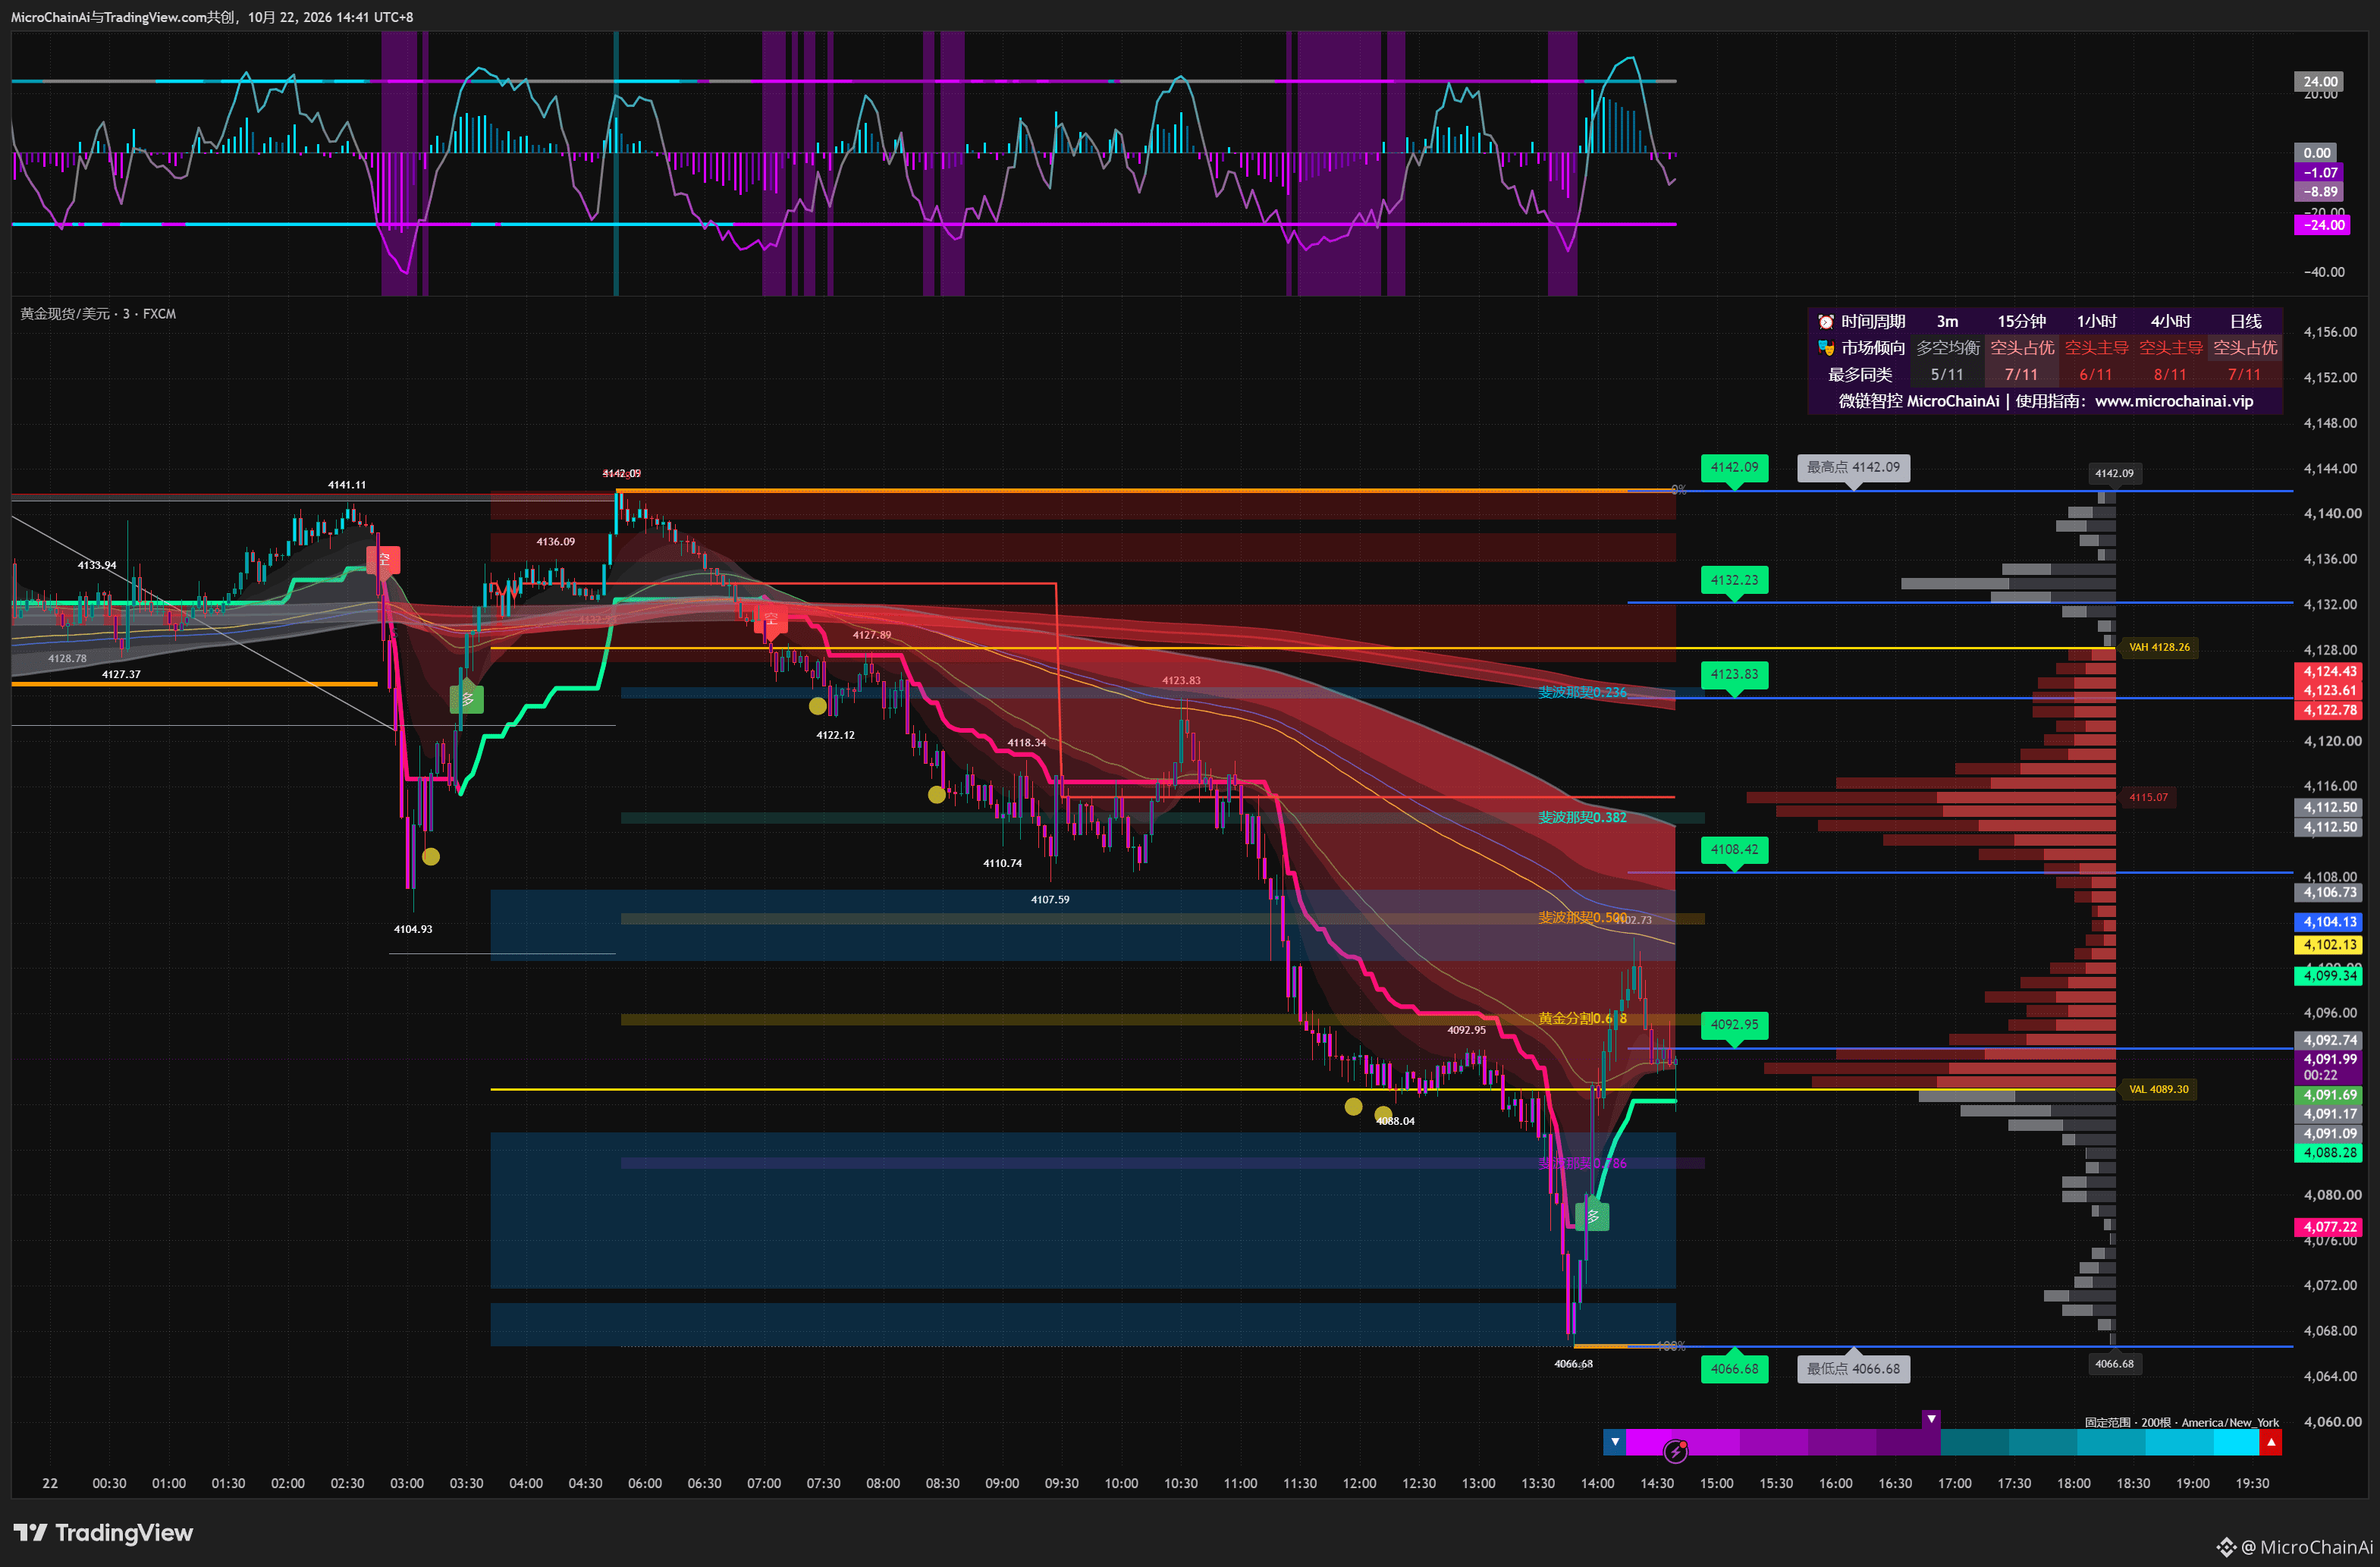
On this 3-minute gold chart, the price dipped to 4066.68, quickly rebounded to around 4102.73, and then pulled back to around 4092.
📊 A rebound from the lows has taken place, but the price remains below the downward-sloping cloud. The local highs left by the earlier decline have not all been reclaimed by this rally.
To assess how much recovery has taken place, check whether the lows are rising, whether the rebound has moved above the previous high, and whether the price can hold on to the territory it has reclaimed after pulling back.
🧭 A rapid rise shows that the price has moved significantly over a short period; by itself, it does not prove that the broader trend has reversed.
Looking at the rally together with the pullback that followed helps show how much ground the recovery has held on to.
#黄金
A rapid rebound should be judged both by how much ground it recovers and where it stalls. 🔍
On this 3-minute gold chart, the price dipped to 4066.68, quickly rebounded to around 4102.73, and then pulled back to around 4092.
📊 A rebound from the lows has taken place, but the price remains below the downward-sloping cloud. The local highs left by the earlier decline have not all been reclaimed by this rally.
To assess how much recovery has taken place, check whether the lows are rising, whether the rebound has moved above the previous high, and whether the price can hold on to the territory it has reclaimed after pulling back.
🧭 A rapid rise shows that the price has moved significantly over a short period; by itself, it does not prove that the broader trend has reversed.
Looking at the rally together with the pullback that followed helps show how much ground the recovery has held on to.
#黄金
On this 3-minute gold chart, the price dipped to 4066.68, quickly rebounded to around 4102.73, and then pulled back to around 4092.
📊 A rebound from the lows has taken place, but the price remains below the downward-sloping cloud. The local highs left by the earlier decline have not all been reclaimed by this rally.
To assess how much recovery has taken place, check whether the lows are rising, whether the rebound has moved above the previous high, and whether the price can hold on to the territory it has reclaimed after pulling back.
🧭 A rapid rise shows that the price has moved significantly over a short period; by itself, it does not prove that the broader trend has reversed.
Looking at the rally together with the pullback that followed helps show how much ground the recovery has held on to.
#黄金
187
·
--
Does a dimming ADX signal a reversal?
The same cyan color—what do brightening and dimming each indicate? Use real charts with the momentum filter to distinguish ADX trend strength from changes in direction.
#ADX指标 #趋势强度 #TradingView #动能滤波
Does a dimming ADX signal a reversal?
The same cyan color—what do brightening and dimming each indicate? Use real charts with the momentum filter to distinguish ADX trend strength from changes in direction.
#ADX指标 #趋势强度 #TradingView #动能滤波
The same cyan color—what do brightening and dimming each indicate? Use real charts with the momentum filter to distinguish ADX trend strength from changes in direction.
#ADX指标 #趋势强度 #TradingView #动能滤波
70
·
--
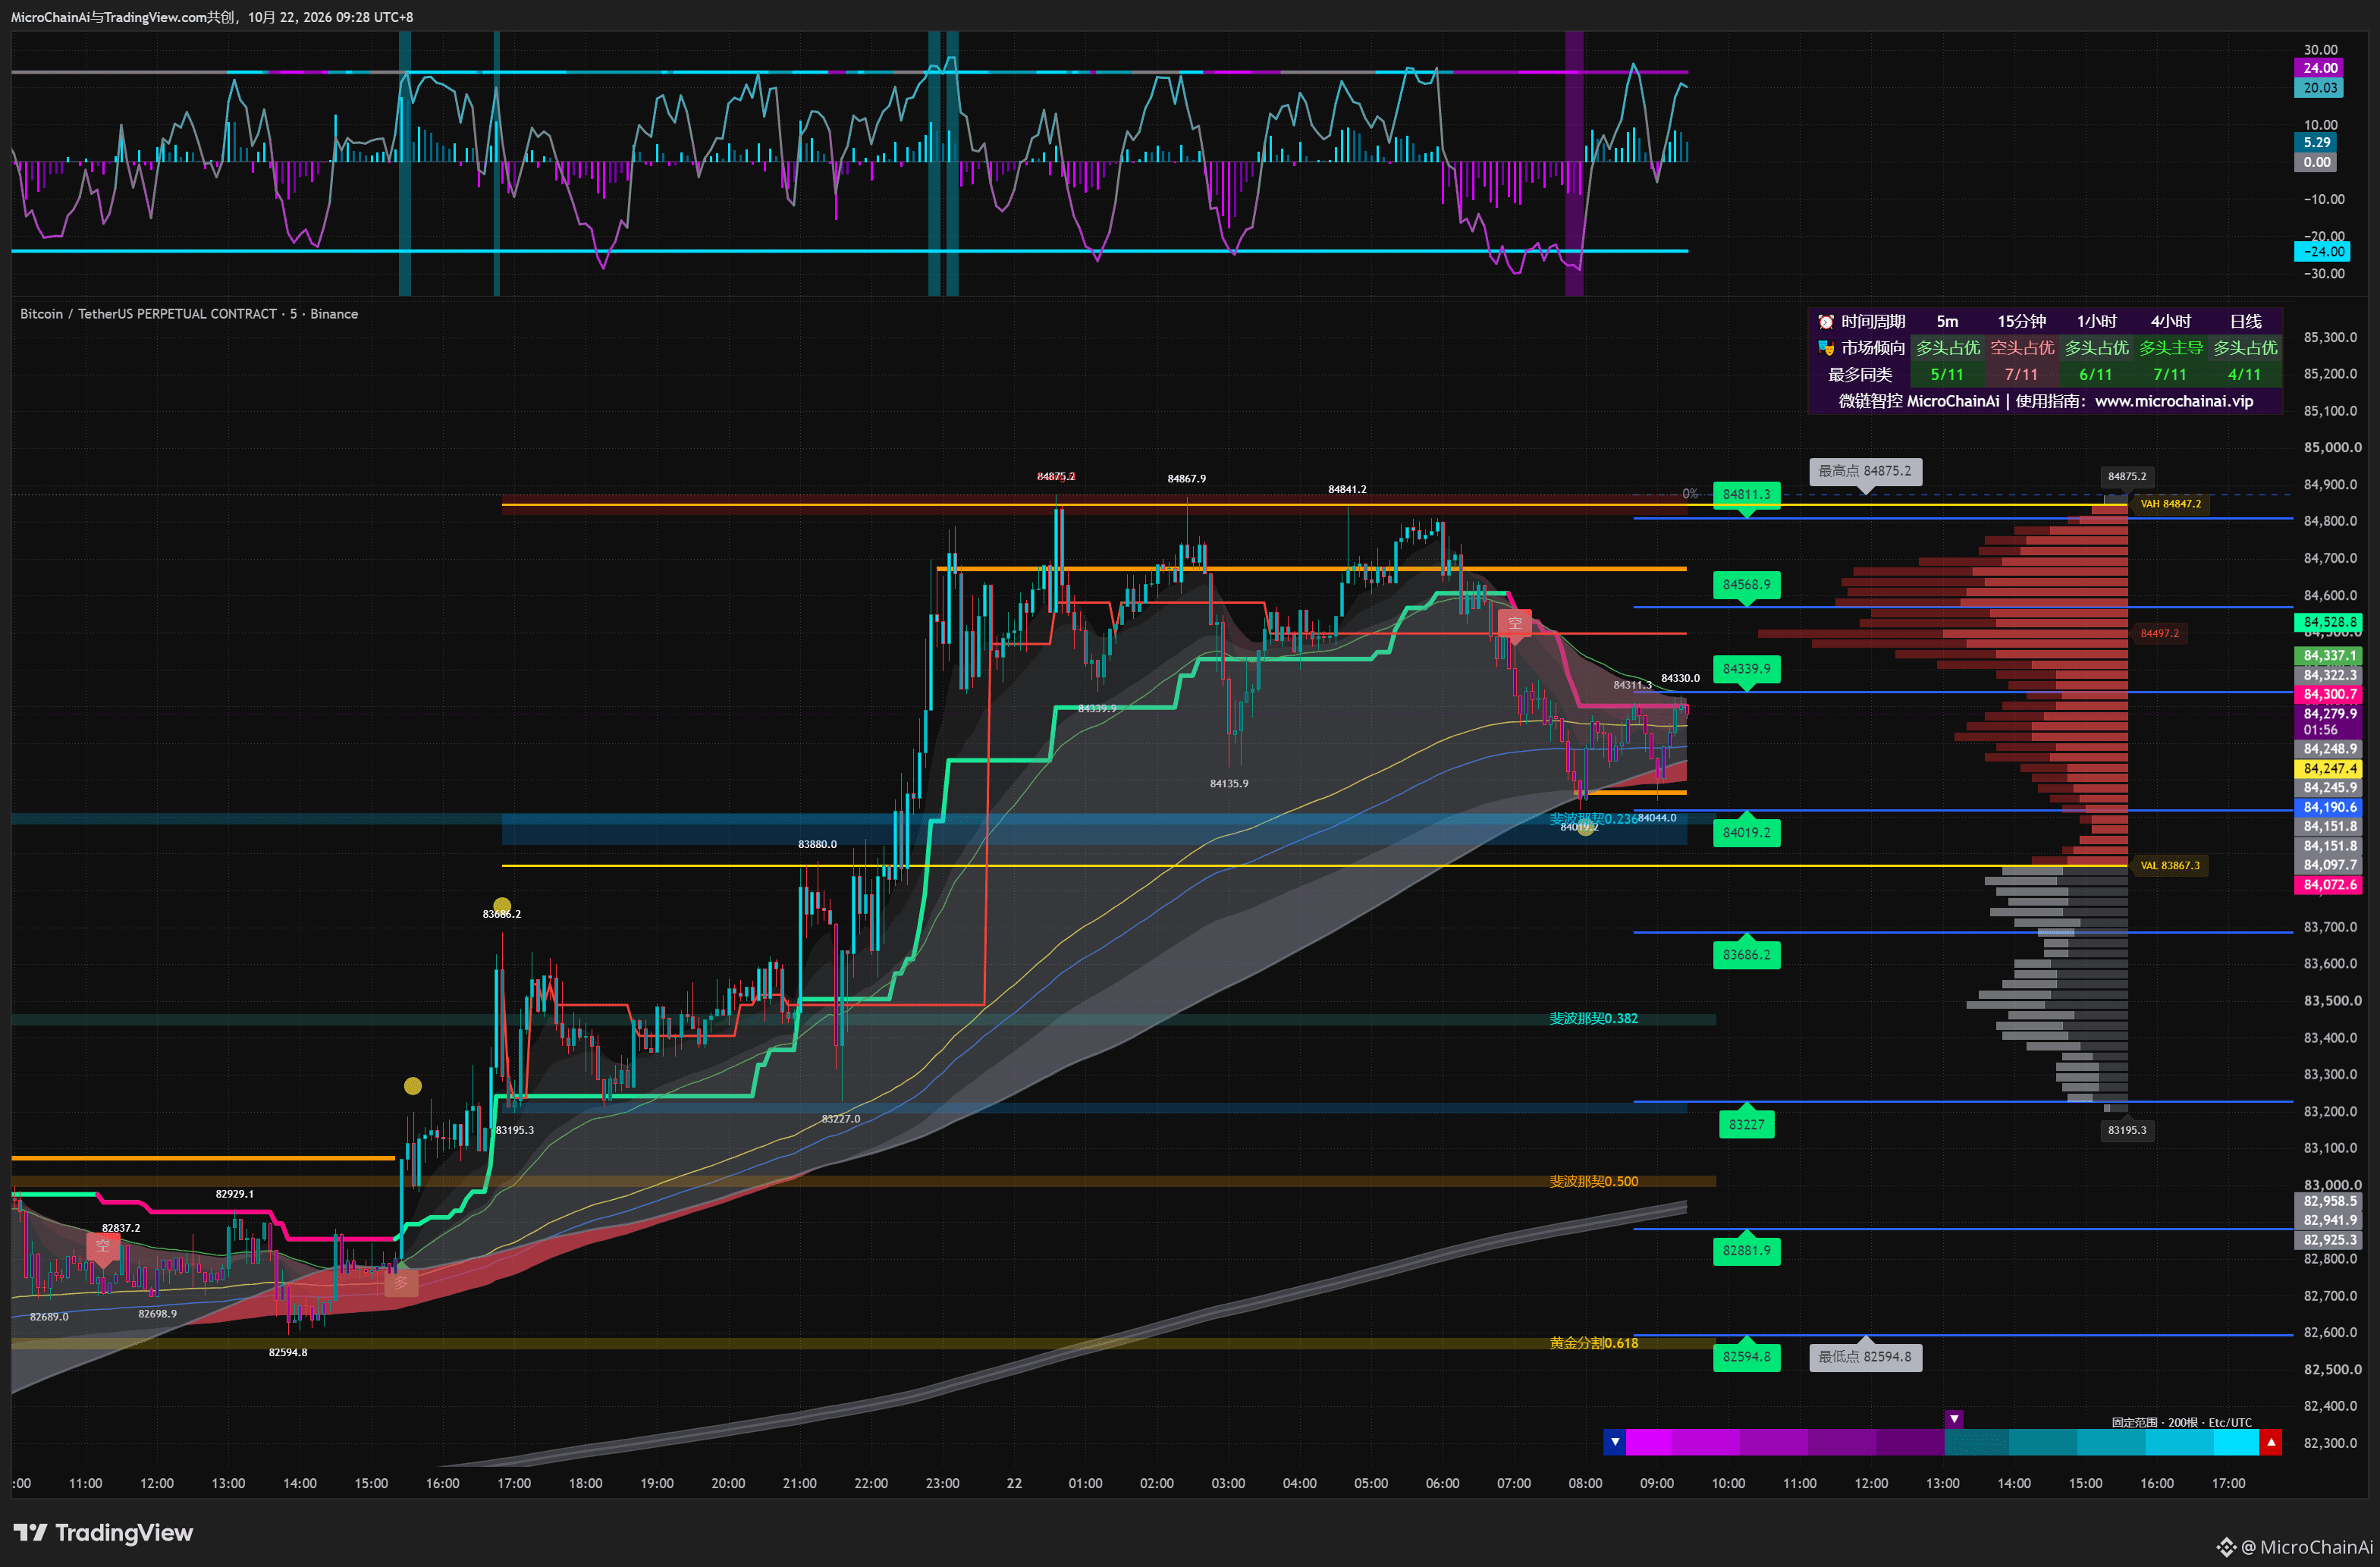
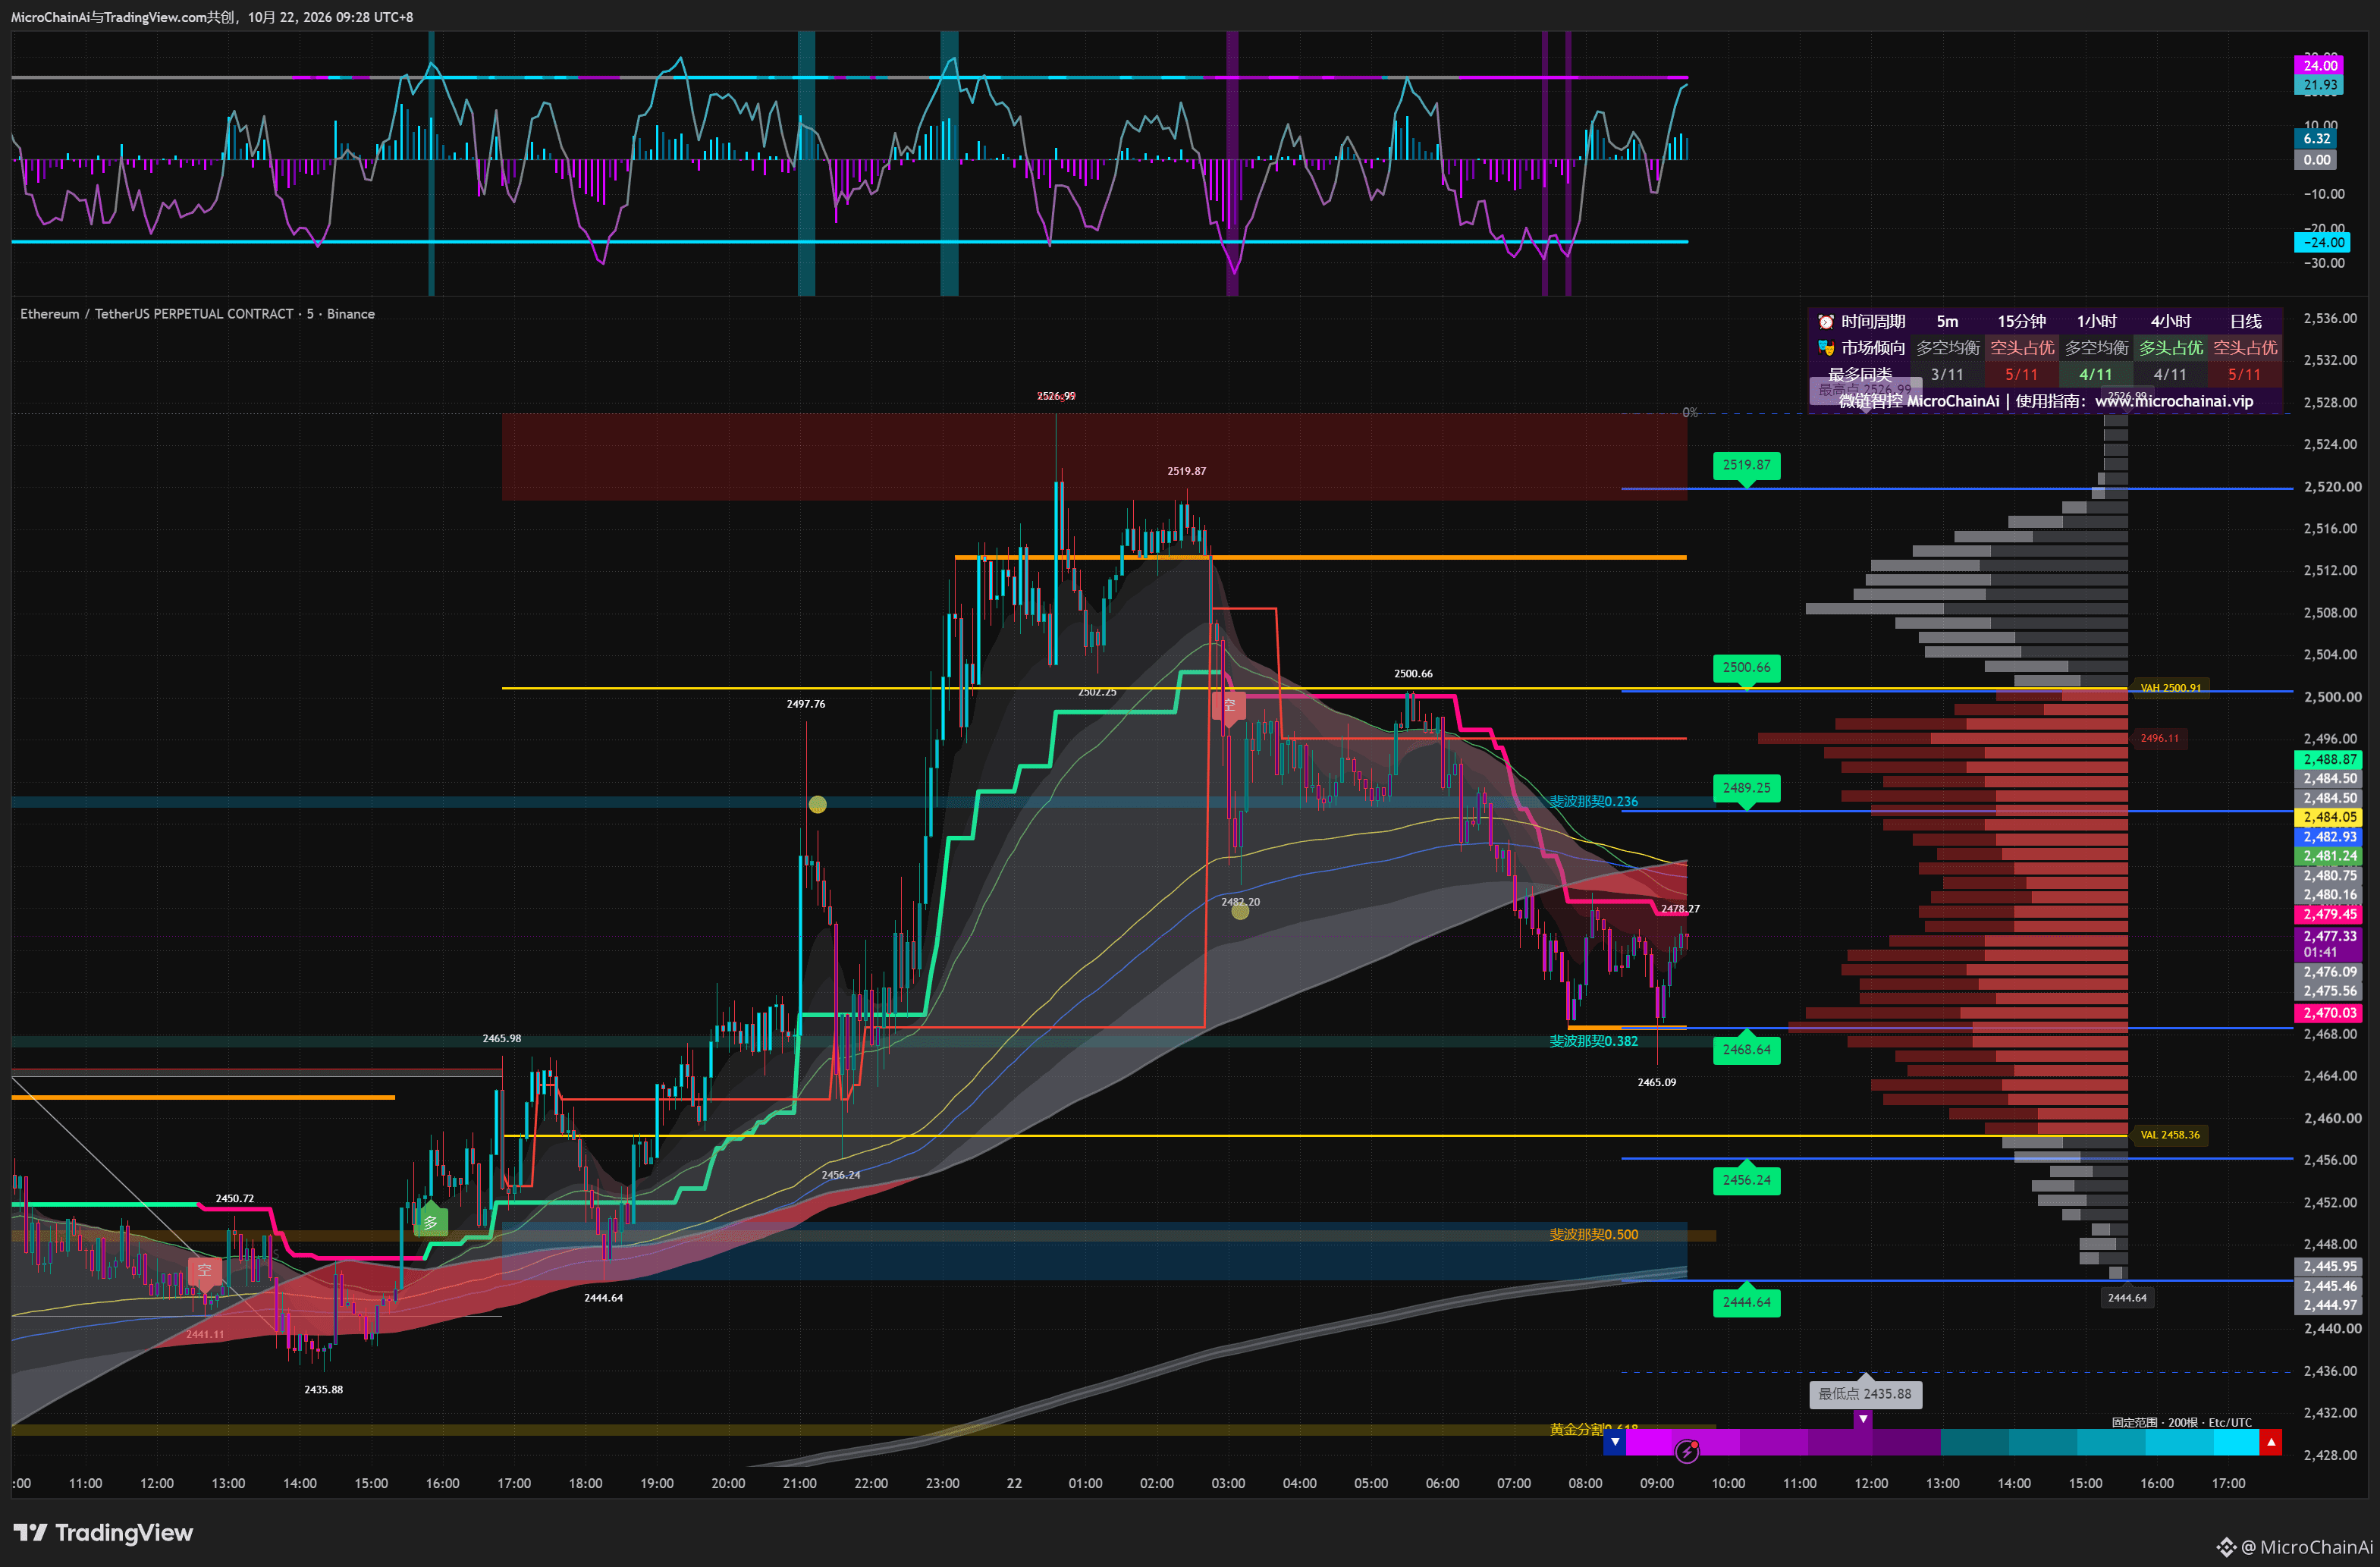
BTC and ETH have both seen short-term rebounds, but their prices are positioned differently within the structure. 🔍
Both charts use a 5-minute timeframe. BTC rebounded from around 84019.2 to approximately 84280; ETH recovered from around 2465.09 to approximately 2477.
📊 At the right edge, BTC’s price has returned inside the wider cloud band, while ETH remains near and below the cloud band. The momentum curves and bars at the top are both above the zero line, but the two assets differ in how much of their earlier declines they have retraced.
This shows that similar momentum conditions do not mean the structure has aligned.
🧭 When comparing assets, consider the size of the rebound, the position relative to the cloud band, and local highs and lows. Don’t group them into the same type of trend just because the indicator colors at the top match.
The same signal can require different interpretations in different contexts.
#BTC走势分析 #ETH
BTC and ETH have both seen short-term rebounds, but their prices are positioned differently within the structure. 🔍
Both charts use a 5-minute timeframe. BTC rebounded from around 84019.2 to approximately 84280; ETH recovered from around 2465.09 to approximately 2477.
📊 At the right edge, BTC’s price has returned inside the wider cloud band, while ETH remains near and below the cloud band. The momentum curves and bars at the top are both above the zero line, but the two assets differ in how much of their earlier declines they have retraced.
This shows that similar momentum conditions do not mean the structure has aligned.
🧭 When comparing assets, consider the size of the rebound, the position relative to the cloud band, and local highs and lows. Don’t group them into the same type of trend just because the indicator colors at the top match.
The same signal can require different interpretations in different contexts.
#BTC走势分析 #ETH
Both charts use a 5-minute timeframe. BTC rebounded from around 84019.2 to approximately 84280; ETH recovered from around 2465.09 to approximately 2477.
📊 At the right edge, BTC’s price has returned inside the wider cloud band, while ETH remains near and below the cloud band. The momentum curves and bars at the top are both above the zero line, but the two assets differ in how much of their earlier declines they have retraced.
This shows that similar momentum conditions do not mean the structure has aligned.
🧭 When comparing assets, consider the size of the rebound, the position relative to the cloud band, and local highs and lows. Don’t group them into the same type of trend just because the indicator colors at the top match.
The same signal can require different interpretations in different contexts.
#BTC走势分析 #ETH
155
Log in to explore more content
Join global crypto users on Binance Square
⚡️ Get latest and useful information about crypto.
💬 Trusted by the world’s largest crypto exchange.
👍 Discover real insights from verified creators.
Email / Phone number
Trending Topics
USMidterms-WhatAreMarketsExpecting?
152,821 views
1,111 Discussing
Democratic Congressional Sweep Shakes Trump Trades in AI Stocks and Crypto
Binance News
·16 Likes
·6k views
USOctoberNFP-AreRateCutsStillPossible
284,085 views
2,178 Discussing
CircleQ3Revenue865M
2,186 views
110 Discussing