
BitcoinGuide
100 Posts

BitcoinGuide
Report
Block User
I've been working as a chart analyst at TradingView for 10 years. You can check "Bitcoin" entry prices, target prices, stop-loss and trading paths in real time daily on a 30-minute candle chart. You'll be the experience a new world. Thank you.
0 Following
2 Followers
1 Liked
Posts
All
Videos
·
--
[OCTOBER 2 Bitcoin chart analysis]
BTCUSD 30Min Chart
*My analysis is optimized for TradingView.
If you press the replay button, you can check real-time movements.
-Long position strategy-
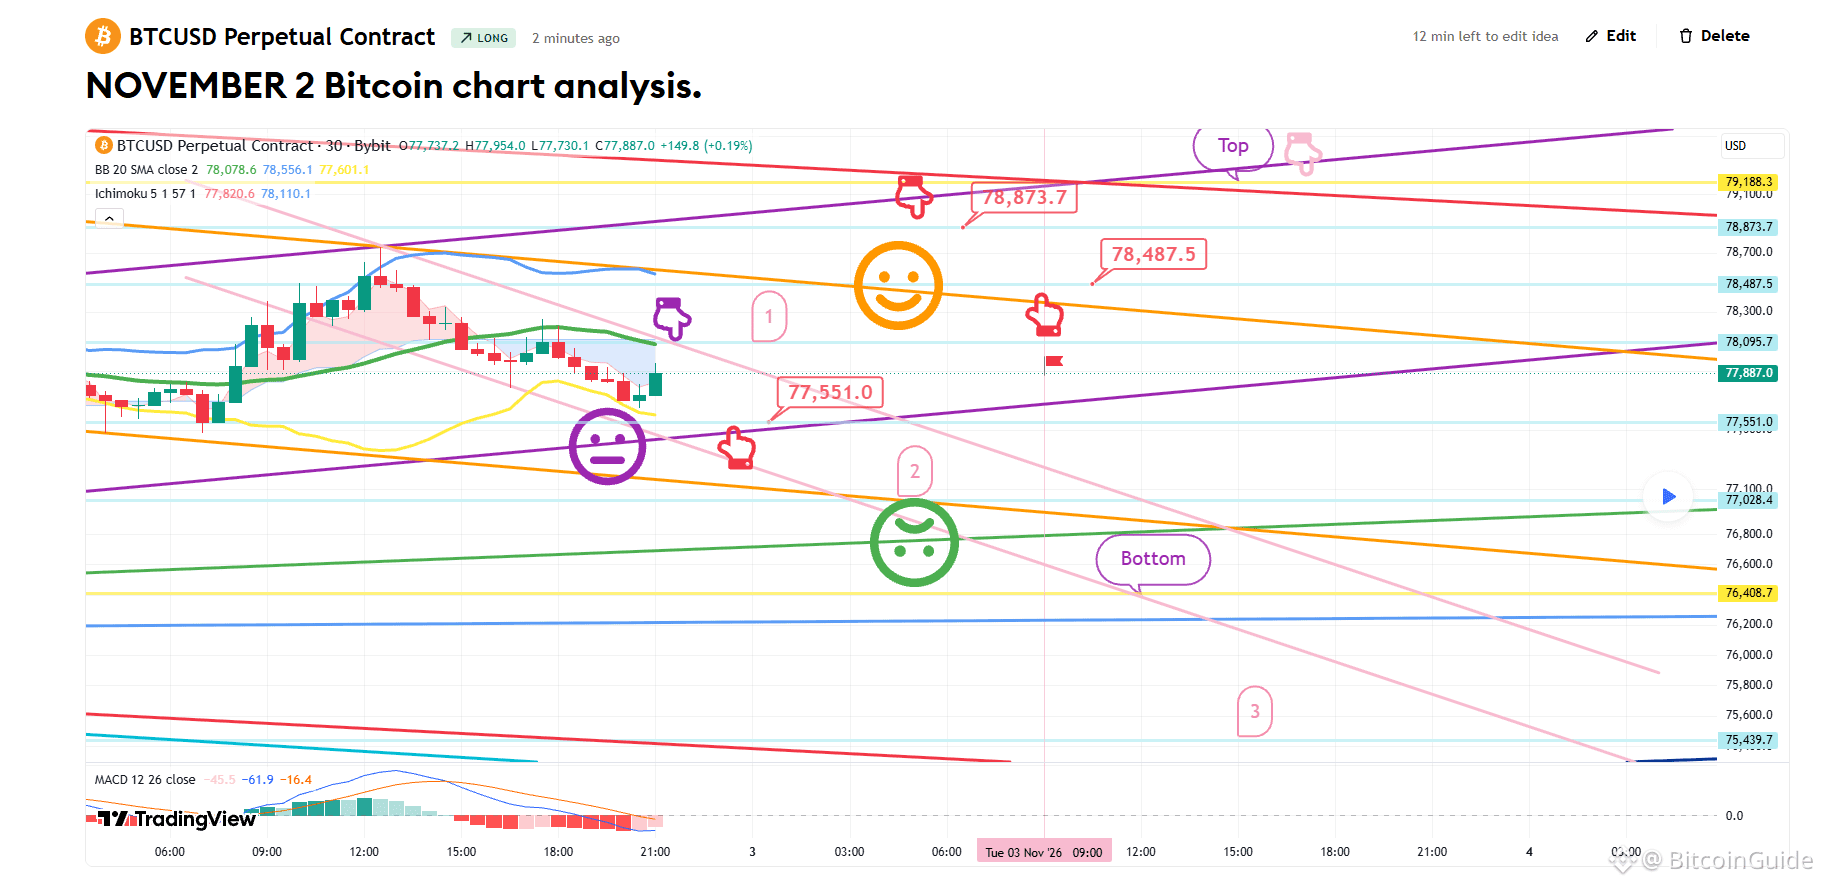
*Upon confirming a touch at the level marked with the purple finger (labeled '1'):
1) After confirming a touch at the first level ($78,095.7) — *optional short position possible here* — look to enter a long position at the level marked with the red finger ($77,551). Use the purple support line as your stop-loss level.
2) First target for the long position is $78,873.7; the second target is the top of the range.
- The $78.4K level can be used as a re-entry point for a long position.
- If the price drops without touching the level marked with the purple finger ('1'), wait for a long position entry at the second level (further down). Use the green support line as your stop-loss level.
- If the green support line is broken:
The price could potentially fall toward the bottom, with up to three levels of support to watch. If the light blue support line is also breached, the medium-term channel will be broken, which could mean a much longer wait for any potential recovery.
Please treat this analysis as a reference only.
Trade according to your established principles, always use stop-losses, and stay safe.
I post the analysis results as a Comment every day.
Thank you.
(You can find the link on my profile.)
- Click Follow to receive faster information every day.
- Check the results using the replay button on TradingView.
#BTC Price Analysis# #Crypto# #Altcoin Season# $USDT $BNB $BTC $ETH
[OCTOBER 2 Bitcoin chart analysis]
BTCUSD 30Min Chart
*My analysis is optimized for TradingView.
If you press the replay button, you can check real-time movements.
-Long position strategy-
*Upon confirming a touch at the level marked with the purple finger (labeled '1'):
1) After confirming a touch at the first level ($78,095.7) — *optional short position possible here* — look to enter a long position at the level marked with the red finger ($77,551). Use the purple support line as your stop-loss level.
2) First target for the long position is $78,873.7; the second target is the top of the range.
- The $78.4K level can be used as a re-entry point for a long position.
- If the price drops without touching the level marked with the purple finger ('1'), wait for a long position entry at the second level (further down). Use the green support line as your stop-loss level.
- If the green support line is broken:
The price could potentially fall toward the bottom, with up to three levels of support to watch. If the light blue support line is also breached, the medium-term channel will be broken, which could mean a much longer wait for any potential recovery.
Please treat this analysis as a reference only.
Trade according to your established principles, always use stop-losses, and stay safe.
I post the analysis results as a Comment every day.
Thank you.
(You can find the link on my profile.)
- Click Follow to receive faster information every day.
- Check the results using the replay button on TradingView.
#BTC Price Analysis# #Crypto# #Altcoin Season# $USDT $BNB $BTC $ETH
BTCUSD 30Min Chart
*My analysis is optimized for TradingView.
If you press the replay button, you can check real-time movements.
-Long position strategy-
*Upon confirming a touch at the level marked with the purple finger (labeled '1'):
1) After confirming a touch at the first level ($78,095.7) — *optional short position possible here* — look to enter a long position at the level marked with the red finger ($77,551). Use the purple support line as your stop-loss level.
2) First target for the long position is $78,873.7; the second target is the top of the range.
- The $78.4K level can be used as a re-entry point for a long position.
- If the price drops without touching the level marked with the purple finger ('1'), wait for a long position entry at the second level (further down). Use the green support line as your stop-loss level.
- If the green support line is broken:
The price could potentially fall toward the bottom, with up to three levels of support to watch. If the light blue support line is also breached, the medium-term channel will be broken, which could mean a much longer wait for any potential recovery.
Please treat this analysis as a reference only.
Trade according to your established principles, always use stop-losses, and stay safe.
I post the analysis results as a Comment every day.
Thank you.
(You can find the link on my profile.)
- Click Follow to receive faster information every day.
- Check the results using the replay button on TradingView.
#BTC Price Analysis# #Crypto# #Altcoin Season# $USDT $BNB $BTC $ETH
66
·
--
[OCTOBER 29 Bitcoin chart analysis]
BTCUSD 30Min Chart
*My analysis is optimized for TradingView.
If you press the replay button, you can check real-time movements.
-Long position strategy-
The Nasdaq is currently showing very erratic, messy price action.
If we can successfully navigate through this risky period today,
we may see a rebound later tonight or from tomorrow onwards.
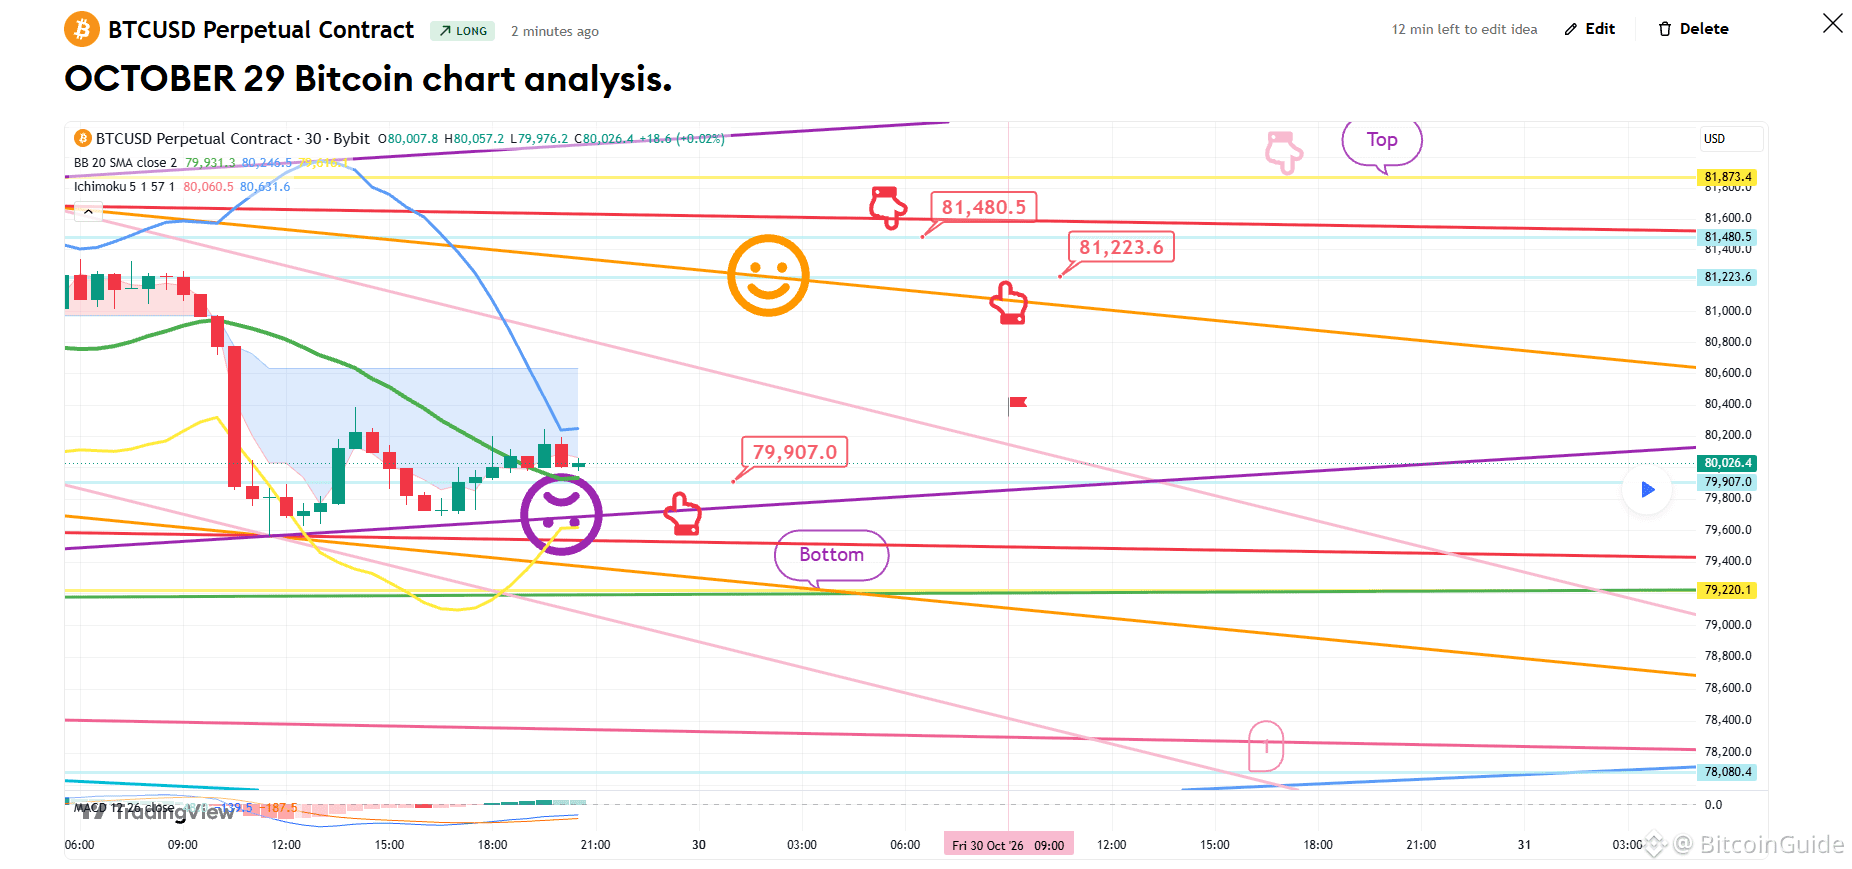
*If the price follows the path indicated by the red arrow:
Long position strategy
1) Entry zone for a long position: $79,907 | Stop-loss: If the price breaks below the purple support line.
2) First target for the long position: $81,480.5 | Second target: The "Top" level.
- If the strategy succeeds, the $81.2K level can be used as an entry point for a new long position.
- If the price breaks below the purple support line,
it could decline toward the "Bottom" zone, potentially reaching as far as the "1" zone.
Please treat this analysis as a reference only.
Ensure you trade according to your established principles and always use a stop-loss to keep your trading safe.
I post the analysis results as a Comment every day.
Thank you.
(You can find the link on my profile.)
- Click Follow to receive faster information every day.
- Check the results using the replay button on TradingView.
$TRX $USDC $USDT $BTC #Altcoin Season# #Bitcoin #Crypto# #BTC Price Analysis#
[OCTOBER 29 Bitcoin chart analysis]
BTCUSD 30Min Chart
*My analysis is optimized for TradingView.
If you press the replay button, you can check real-time movements.
-Long position strategy-
The Nasdaq is currently showing very erratic, messy price action.
If we can successfully navigate through this risky period today,
we may see a rebound later tonight or from tomorrow onwards.
*If the price follows the path indicated by the red arrow:
Long position strategy
1) Entry zone for a long position: $79,907 | Stop-loss: If the price breaks below the purple support line.
2) First target for the long position: $81,480.5 | Second target: The "Top" level.
- If the strategy succeeds, the $81.2K level can be used as an entry point for a new long position.
- If the price breaks below the purple support line,
it could decline toward the "Bottom" zone, potentially reaching as far as the "1" zone.
Please treat this analysis as a reference only.
Ensure you trade according to your established principles and always use a stop-loss to keep your trading safe.
I post the analysis results as a Comment every day.
Thank you.
(You can find the link on my profile.)
- Click Follow to receive faster information every day.
- Check the results using the replay button on TradingView.
$TRX $USDC $USDT $BTC #Altcoin Season# #Bitcoin #Crypto# #BTC Price Analysis#
BTCUSD 30Min Chart
*My analysis is optimized for TradingView.
If you press the replay button, you can check real-time movements.
-Long position strategy-
The Nasdaq is currently showing very erratic, messy price action.
If we can successfully navigate through this risky period today,
we may see a rebound later tonight or from tomorrow onwards.
*If the price follows the path indicated by the red arrow:
Long position strategy
1) Entry zone for a long position: $79,907 | Stop-loss: If the price breaks below the purple support line.
2) First target for the long position: $81,480.5 | Second target: The "Top" level.
- If the strategy succeeds, the $81.2K level can be used as an entry point for a new long position.
- If the price breaks below the purple support line,
it could decline toward the "Bottom" zone, potentially reaching as far as the "1" zone.
Please treat this analysis as a reference only.
Ensure you trade according to your established principles and always use a stop-loss to keep your trading safe.
I post the analysis results as a Comment every day.
Thank you.
(You can find the link on my profile.)
- Click Follow to receive faster information every day.
- Check the results using the replay button on TradingView.
$TRX $USDC $USDT $BTC #Altcoin Season# #Bitcoin #Crypto# #BTC Price Analysis#
69
·
--
[OCTOBER 16 Bitcoin chart analysis]
BTCUSD 30Min Chart
*My analysis is optimized for TradingView.
If you press the replay button, you can check real-time movements.
-Long position strategy-
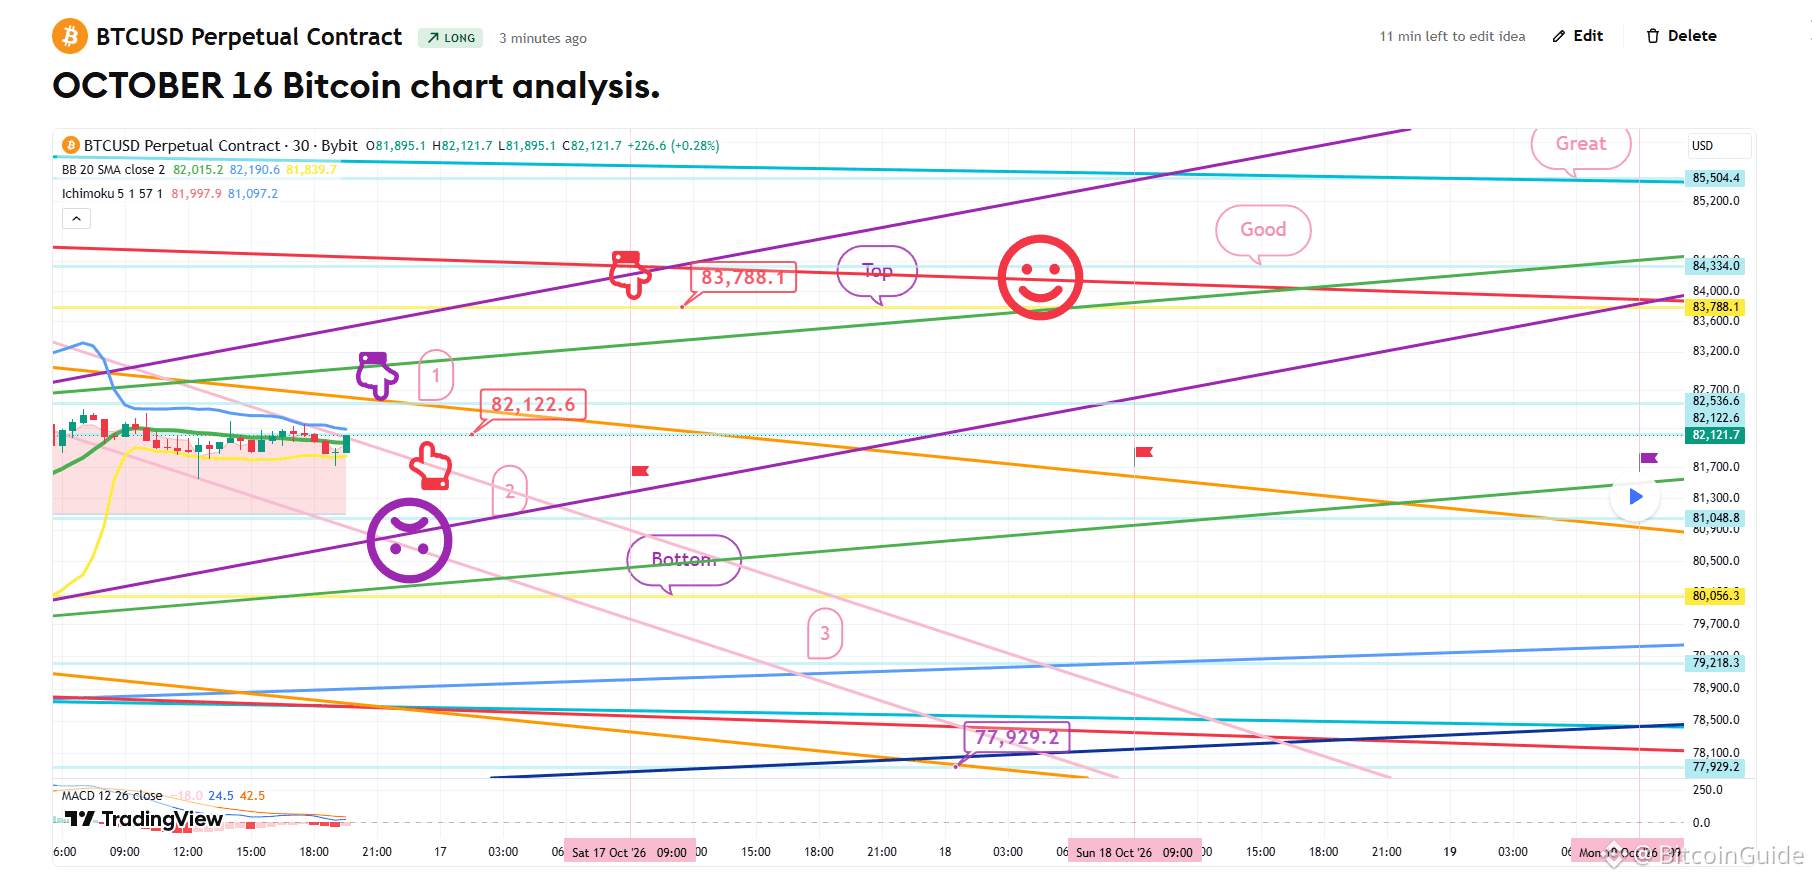
*Long position strategy based on the touch points indicated by the purple arrows:
1) After confirming a touch at the first purple arrow (82.5K), enter a long position at the level marked by the red arrow ($82,122.6). Use a break below the purple support line as your stop-loss level.
2) Target price: $83,788.1 (the "Top" zone). Over the weekend, aim for the targets labeled "Good" and "Great" in that order.
3) If the price drops without touching the purple arrow, enter a long position at the second zone (lower down) at $81,048.8. Use a break below the green support line as your stop-loss level.
- If the green support line is breached, the price could potentially fall toward the third zone—down to as low as 77.9K. Note that 77.9K is a significant low point, a level also recently reached by the Nasdaq.
Please use this analysis only as a reference for your own trading.
Always trade according to your established principles and be sure to use stop-loss orders to keep your trading safe.
You’ve all worked hard this week.
I post the analysis results as a Comment every day.
Thank you.
(You can find the link on my profile.)
- Click Follow to receive faster information every day.
- Check the results using the replay button on TradingView.
#BTC Price Analysis# #Altcoin Season# #Crypto #Bitcoin $ETH $XRP $USDT $BTC
[OCTOBER 16 Bitcoin chart analysis]
BTCUSD 30Min Chart
*My analysis is optimized for TradingView.
If you press the replay button, you can check real-time movements.
-Long position strategy-
*Long position strategy based on the touch points indicated by the purple arrows:
1) After confirming a touch at the first purple arrow (82.5K), enter a long position at the level marked by the red arrow ($82,122.6). Use a break below the purple support line as your stop-loss level.
2) Target price: $83,788.1 (the "Top" zone). Over the weekend, aim for the targets labeled "Good" and "Great" in that order.
3) If the price drops without touching the purple arrow, enter a long position at the second zone (lower down) at $81,048.8. Use a break below the green support line as your stop-loss level.
- If the green support line is breached, the price could potentially fall toward the third zone—down to as low as 77.9K. Note that 77.9K is a significant low point, a level also recently reached by the Nasdaq.
Please use this analysis only as a reference for your own trading.
Always trade according to your established principles and be sure to use stop-loss orders to keep your trading safe.
You’ve all worked hard this week.
I post the analysis results as a Comment every day.
Thank you.
(You can find the link on my profile.)
- Click Follow to receive faster information every day.
- Check the results using the replay button on TradingView.
#BTC Price Analysis# #Altcoin Season# #Crypto #Bitcoin $ETH $XRP $USDT $BTC
BTCUSD 30Min Chart
*My analysis is optimized for TradingView.
If you press the replay button, you can check real-time movements.
-Long position strategy-
*Long position strategy based on the touch points indicated by the purple arrows:
1) After confirming a touch at the first purple arrow (82.5K), enter a long position at the level marked by the red arrow ($82,122.6). Use a break below the purple support line as your stop-loss level.
2) Target price: $83,788.1 (the "Top" zone). Over the weekend, aim for the targets labeled "Good" and "Great" in that order.
3) If the price drops without touching the purple arrow, enter a long position at the second zone (lower down) at $81,048.8. Use a break below the green support line as your stop-loss level.
- If the green support line is breached, the price could potentially fall toward the third zone—down to as low as 77.9K. Note that 77.9K is a significant low point, a level also recently reached by the Nasdaq.
Please use this analysis only as a reference for your own trading.
Always trade according to your established principles and be sure to use stop-loss orders to keep your trading safe.
You’ve all worked hard this week.
I post the analysis results as a Comment every day.
Thank you.
(You can find the link on my profile.)
- Click Follow to receive faster information every day.
- Check the results using the replay button on TradingView.
#BTC Price Analysis# #Altcoin Season# #Crypto #Bitcoin $ETH $XRP $USDT $BTC
76
·
--
[OCTOBER 15 Bitcoin chart analysis]
BTCUSD 30Min Chart
*My analysis is optimized for TradingView.
If you press the replay button, you can check real-time movements.
-Neutral strategy-
This is the 30-minute chart for Bitcoin.
Nasdaq-related data is set to be released shortly at 9:30.
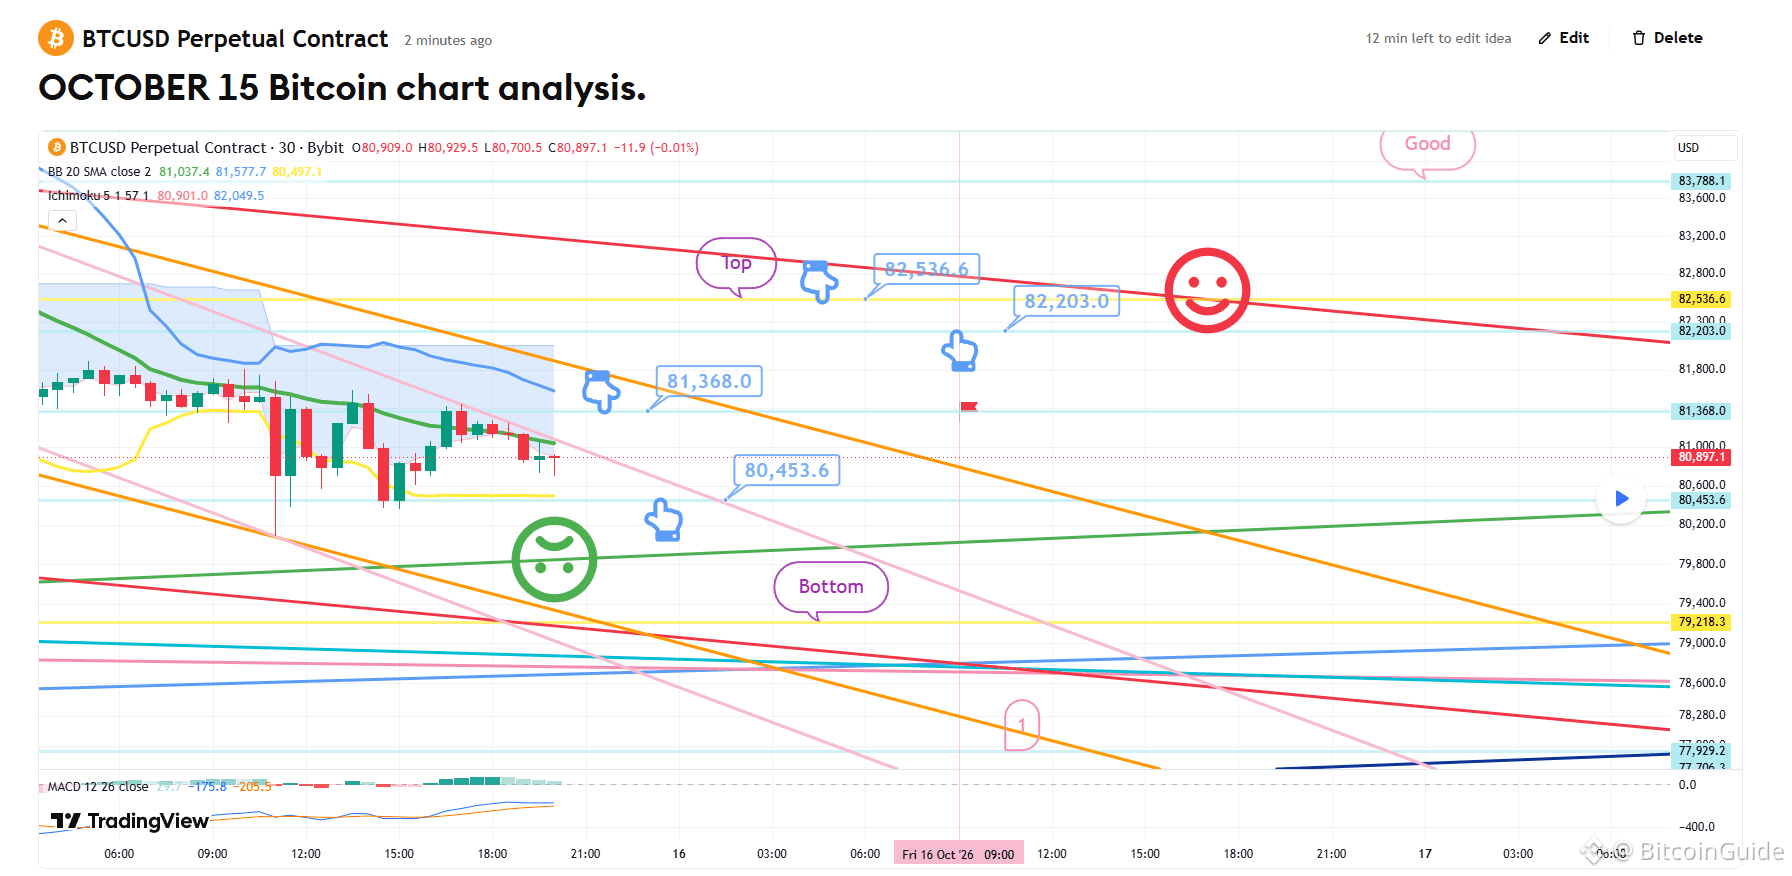
*Following the path indicated by the light blue arrows:
This is a neutral, two-way strategy involving a switch from a short position to a long position.
1) Entry zone for a short position at $81,368 (marked by the light blue arrow).
/ Stop-loss level: If the orange resistance line is broken.
2) Switch to a long position at $80,453.6.
/ Stop-loss level: If the price falls below the green support line.
3) First target for the long position is $82,536.6, with a further "good" second target level.
- If the price falls below the green support line:
The medium-term uptrend would be broken, indicating the potential for further decline.
- If the price drops directly without first touching the $81.3K level (the upper zone):
The lower "bottom" zone serves as the final entry point for a long position.
Please be cautious, as the price could potentially decline as far as the first zone mentioned above.
Please use this analysis only as a reference.
I encourage you to trade according to your established principles and always use stop-loss orders to ensure safe trading.
I post the analysis results as a Comment every day.
Thank you.
(You can find the link on my profile.)
- Click Follow to receive faster information every day.
- Check the results using the replay button on TradingView.
#Altcoin Season# #XRP #Crypto #BTC Price Analysis# $USDC $BNB $BTC $GOLD #S&P
[OCTOBER 15 Bitcoin chart analysis]
BTCUSD 30Min Chart
*My analysis is optimized for TradingView.
If you press the replay button, you can check real-time movements.
-Neutral strategy-
This is the 30-minute chart for Bitcoin.
Nasdaq-related data is set to be released shortly at 9:30.
*Following the path indicated by the light blue arrows:
This is a neutral, two-way strategy involving a switch from a short position to a long position.
1) Entry zone for a short position at $81,368 (marked by the light blue arrow).
/ Stop-loss level: If the orange resistance line is broken.
2) Switch to a long position at $80,453.6.
/ Stop-loss level: If the price falls below the green support line.
3) First target for the long position is $82,536.6, with a further "good" second target level.
- If the price falls below the green support line:
The medium-term uptrend would be broken, indicating the potential for further decline.
- If the price drops directly without first touching the $81.3K level (the upper zone):
The lower "bottom" zone serves as the final entry point for a long position.
Please be cautious, as the price could potentially decline as far as the first zone mentioned above.
Please use this analysis only as a reference.
I encourage you to trade according to your established principles and always use stop-loss orders to ensure safe trading.
I post the analysis results as a Comment every day.
Thank you.
(You can find the link on my profile.)
- Click Follow to receive faster information every day.
- Check the results using the replay button on TradingView.
#Altcoin Season# #XRP #Crypto #BTC Price Analysis# $USDC $BNB $BTC $GOLD #S&P
BTCUSD 30Min Chart
*My analysis is optimized for TradingView.
If you press the replay button, you can check real-time movements.
-Neutral strategy-
This is the 30-minute chart for Bitcoin.
Nasdaq-related data is set to be released shortly at 9:30.
*Following the path indicated by the light blue arrows:
This is a neutral, two-way strategy involving a switch from a short position to a long position.
1) Entry zone for a short position at $81,368 (marked by the light blue arrow).
/ Stop-loss level: If the orange resistance line is broken.
2) Switch to a long position at $80,453.6.
/ Stop-loss level: If the price falls below the green support line.
3) First target for the long position is $82,536.6, with a further "good" second target level.
- If the price falls below the green support line:
The medium-term uptrend would be broken, indicating the potential for further decline.
- If the price drops directly without first touching the $81.3K level (the upper zone):
The lower "bottom" zone serves as the final entry point for a long position.
Please be cautious, as the price could potentially decline as far as the first zone mentioned above.
Please use this analysis only as a reference.
I encourage you to trade according to your established principles and always use stop-loss orders to ensure safe trading.
I post the analysis results as a Comment every day.
Thank you.
(You can find the link on my profile.)
- Click Follow to receive faster information every day.
- Check the results using the replay button on TradingView.
#Altcoin Season# #XRP #Crypto #BTC Price Analysis# $USDC $BNB $BTC $GOLD #S&P
72
·
--
[OCTOBER 14 Bitcoin chart analysis]
BTCUSD 30Min Chart
*My analysis is optimized for TradingView.
If you press the replay button, you can check real-time movements.
-Long position strategy-
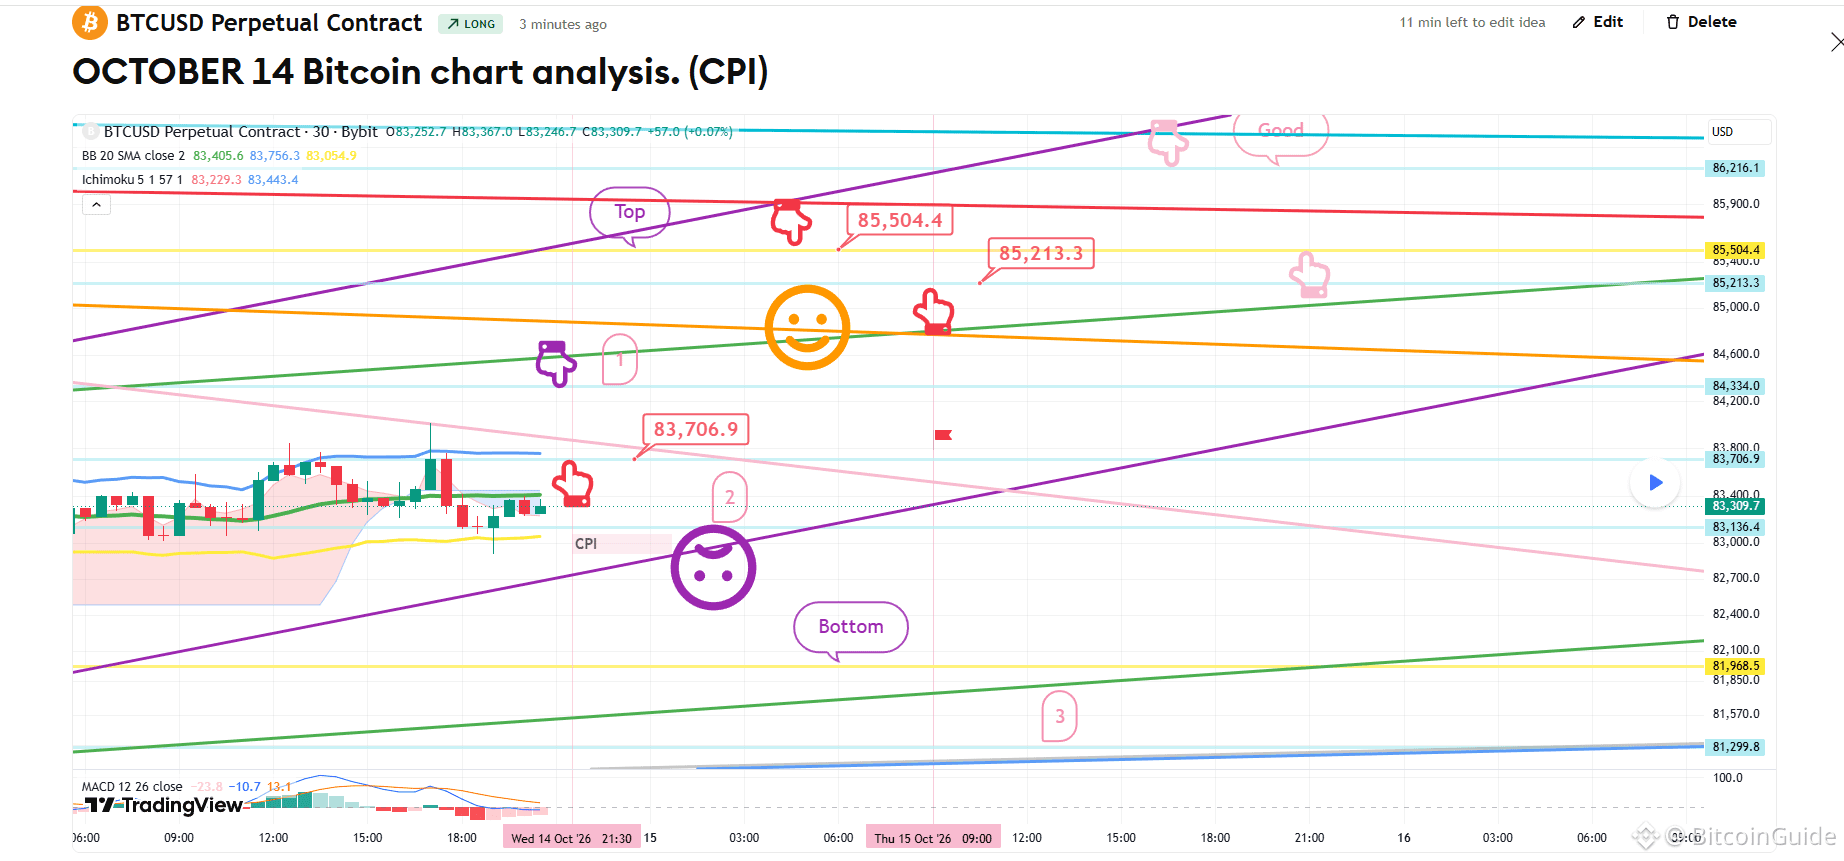
1) After confirming a touch on the "Purple Finger 1" zone (optional short position),
enter a long position at the "Red Finger" level ($83,706.9); set the stop-loss if the purple support line is breached.
2) Target price for the long position is $85,504.4; the $85.2K level is a zone for re-entering a long position.
I have also provided a simulation for the period following today, marked with the "Pink Finger."
3) If the price drops immediately without touching the "Purple Finger 1" zone,
look to enter a long position at the lower "Zone 2" ($83,136.4);
set the stop-loss if the purple support line is breached.
-For a strong upward move today,
the price should not drop down to the vicinity of the purple support line (sideways movement is possible).
-If the purple support line is breached,
be aware that the downside is open all the way to the "Bottom" (up to "Zone 3").
Please use this analysis solely for reference and guidance,
and I hope you trade safely by adhering to your principles and using stop-loss orders.
(You can find the link on my profile.)
- Click Follow to receive faster information every day.
- Check the results using the replay button on TradingView.
#Crypto# #Altcoin Season# #BTC100K #BTC Price Analysis# $ETH $USDT $XRP $BNB $BTC
[OCTOBER 14 Bitcoin chart analysis]
BTCUSD 30Min Chart
*My analysis is optimized for TradingView.
If you press the replay button, you can check real-time movements.
-Long position strategy-
1) After confirming a touch on the "Purple Finger 1" zone (optional short position),
enter a long position at the "Red Finger" level ($83,706.9); set the stop-loss if the purple support line is breached.
2) Target price for the long position is $85,504.4; the $85.2K level is a zone for re-entering a long position.
I have also provided a simulation for the period following today, marked with the "Pink Finger."
3) If the price drops immediately without touching the "Purple Finger 1" zone,
look to enter a long position at the lower "Zone 2" ($83,136.4);
set the stop-loss if the purple support line is breached.
-For a strong upward move today,
the price should not drop down to the vicinity of the purple support line (sideways movement is possible).
-If the purple support line is breached,
be aware that the downside is open all the way to the "Bottom" (up to "Zone 3").
Please use this analysis solely for reference and guidance,
and I hope you trade safely by adhering to your principles and using stop-loss orders.
(You can find the link on my profile.)
- Click Follow to receive faster information every day.
- Check the results using the replay button on TradingView.
#Crypto# #Altcoin Season# #BTC100K #BTC Price Analysis# $ETH $USDT $XRP $BNB $BTC
BTCUSD 30Min Chart
*My analysis is optimized for TradingView.
If you press the replay button, you can check real-time movements.
-Long position strategy-
1) After confirming a touch on the "Purple Finger 1" zone (optional short position),
enter a long position at the "Red Finger" level ($83,706.9); set the stop-loss if the purple support line is breached.
2) Target price for the long position is $85,504.4; the $85.2K level is a zone for re-entering a long position.
I have also provided a simulation for the period following today, marked with the "Pink Finger."
3) If the price drops immediately without touching the "Purple Finger 1" zone,
look to enter a long position at the lower "Zone 2" ($83,136.4);
set the stop-loss if the purple support line is breached.
-For a strong upward move today,
the price should not drop down to the vicinity of the purple support line (sideways movement is possible).
-If the purple support line is breached,
be aware that the downside is open all the way to the "Bottom" (up to "Zone 3").
Please use this analysis solely for reference and guidance,
and I hope you trade safely by adhering to your principles and using stop-loss orders.
(You can find the link on my profile.)
- Click Follow to receive faster information every day.
- Check the results using the replay button on TradingView.
#Crypto# #Altcoin Season# #BTC100K #BTC Price Analysis# $ETH $USDT $XRP $BNB $BTC
76
·
--
[OCTOBER 13 Bitcoin chart analysis]
BTCUSD 30Min Chart
*My analysis is optimized for TradingView.
If you press the replay button, you can check real-time movements.
-Long position strategy-
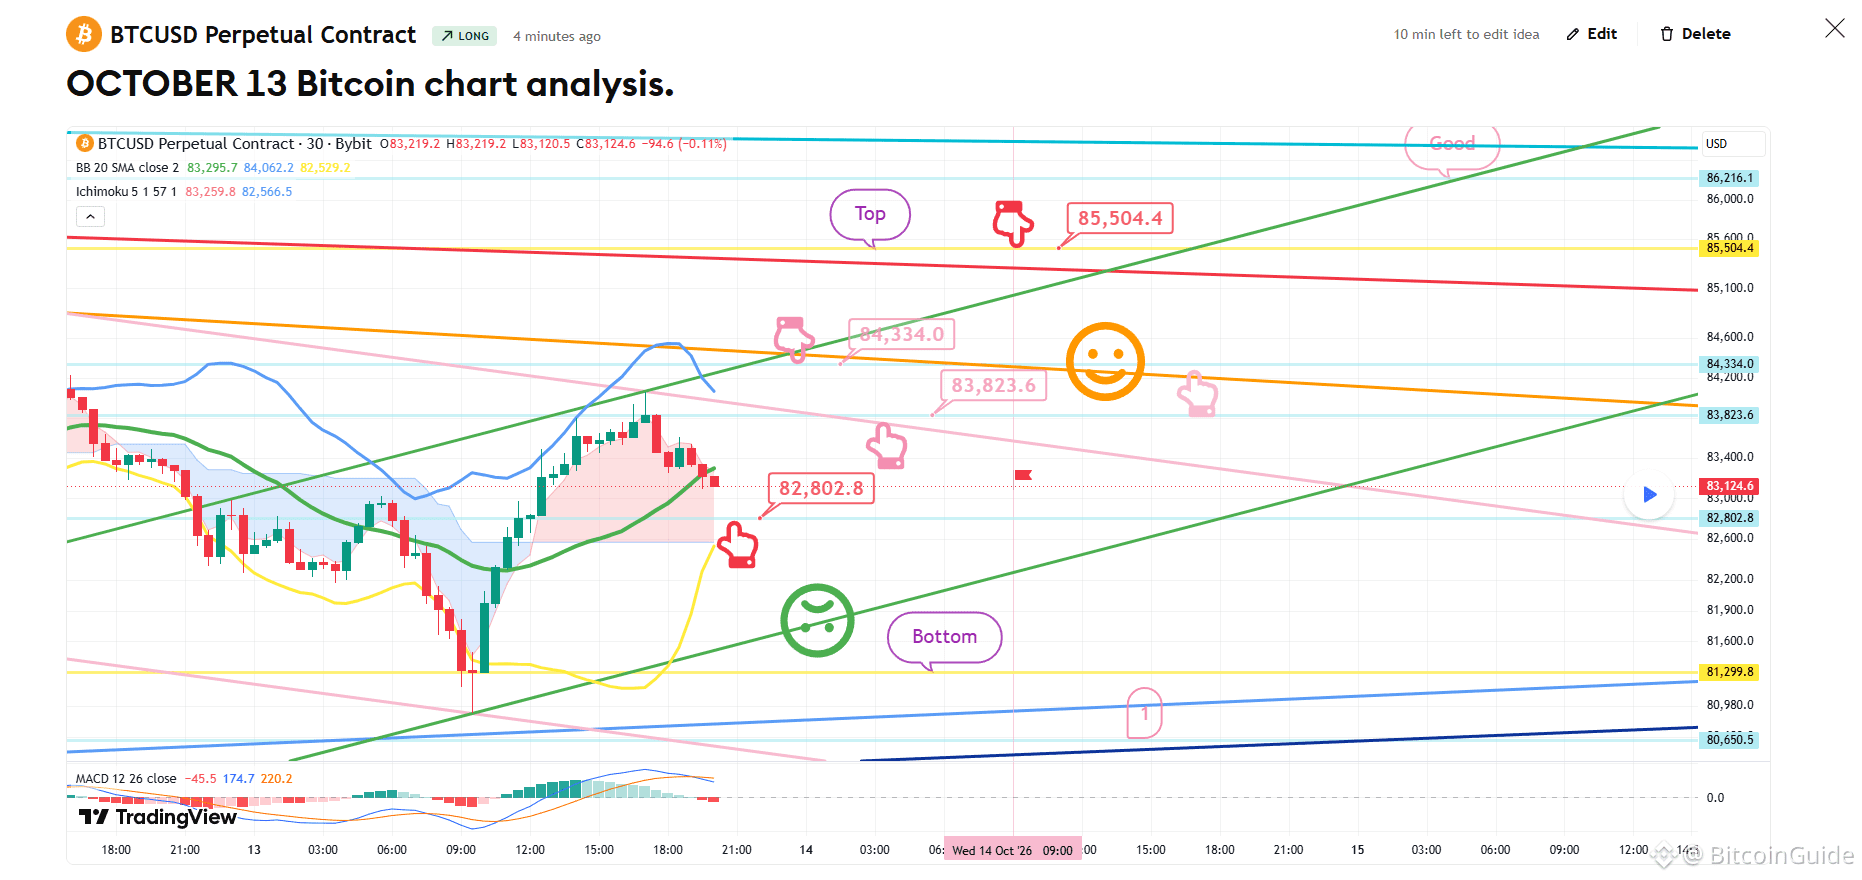
*Long position strategy based on the path indicated by the red arrow:
1) Long position entry zone: $82,802.8 / Stop-loss level: If the green support line is breached
2) Long position target price: $85,504.4 (Top zone) / Secondary target price
- I have also marked a re-entry zone for long positions with a pink arrow.
- Although less likely, if the price touches the $84.3K level first from its current position,
it could surge vertically without pulling back to the $82.8K long entry zone.
- If the green support line is breached,
the price could drop to the lower "Bottom" zone—or as far down as "Zone 1"—
so please keep a close eye on Nasdaq movements.
Please use this analysis solely for reference,
and ensure you trade safely by adhering to your principles and using stop-loss orders.
I post the analysis results as a Comment every day.
Thank you.
(You can find the link on my profile.)
- Click Follow to receive faster information every day.
- Check the results using the replay button on TradingView.
#BTCCharts# #BTC100K #Crypto #Altcoin Season# #ETH $XRP $USDT $BTC $GOLD
[OCTOBER 13 Bitcoin chart analysis]
BTCUSD 30Min Chart
*My analysis is optimized for TradingView.
If you press the replay button, you can check real-time movements.
-Long position strategy-
*Long position strategy based on the path indicated by the red arrow:
1) Long position entry zone: $82,802.8 / Stop-loss level: If the green support line is breached
2) Long position target price: $85,504.4 (Top zone) / Secondary target price
- I have also marked a re-entry zone for long positions with a pink arrow.
- Although less likely, if the price touches the $84.3K level first from its current position,
it could surge vertically without pulling back to the $82.8K long entry zone.
- If the green support line is breached,
the price could drop to the lower "Bottom" zone—or as far down as "Zone 1"—
so please keep a close eye on Nasdaq movements.
Please use this analysis solely for reference,
and ensure you trade safely by adhering to your principles and using stop-loss orders.
I post the analysis results as a Comment every day.
Thank you.
(You can find the link on my profile.)
- Click Follow to receive faster information every day.
- Check the results using the replay button on TradingView.
#BTCCharts# #BTC100K #Crypto #Altcoin Season# #ETH $XRP $USDT $BTC $GOLD
BTCUSD 30Min Chart
*My analysis is optimized for TradingView.
If you press the replay button, you can check real-time movements.
-Long position strategy-
*Long position strategy based on the path indicated by the red arrow:
1) Long position entry zone: $82,802.8 / Stop-loss level: If the green support line is breached
2) Long position target price: $85,504.4 (Top zone) / Secondary target price
- I have also marked a re-entry zone for long positions with a pink arrow.
- Although less likely, if the price touches the $84.3K level first from its current position,
it could surge vertically without pulling back to the $82.8K long entry zone.
- If the green support line is breached,
the price could drop to the lower "Bottom" zone—or as far down as "Zone 1"—
so please keep a close eye on Nasdaq movements.
Please use this analysis solely for reference,
and ensure you trade safely by adhering to your principles and using stop-loss orders.
I post the analysis results as a Comment every day.
Thank you.
(You can find the link on my profile.)
- Click Follow to receive faster information every day.
- Check the results using the replay button on TradingView.
#BTCCharts# #BTC100K #Crypto #Altcoin Season# #ETH $XRP $USDT $BTC $GOLD
89
·
--
[OCTOBER 12 Bitcoin chart analysis]
BTCUSD 30Min Chart
*My analysis is optimized for TradingView.
If you press the replay button, you can check real-time movements.
-Long position strategy-
There are no specific Nasdaq data releases scheduled,
but a MACD "death cross" is currently forming on the daily chart.
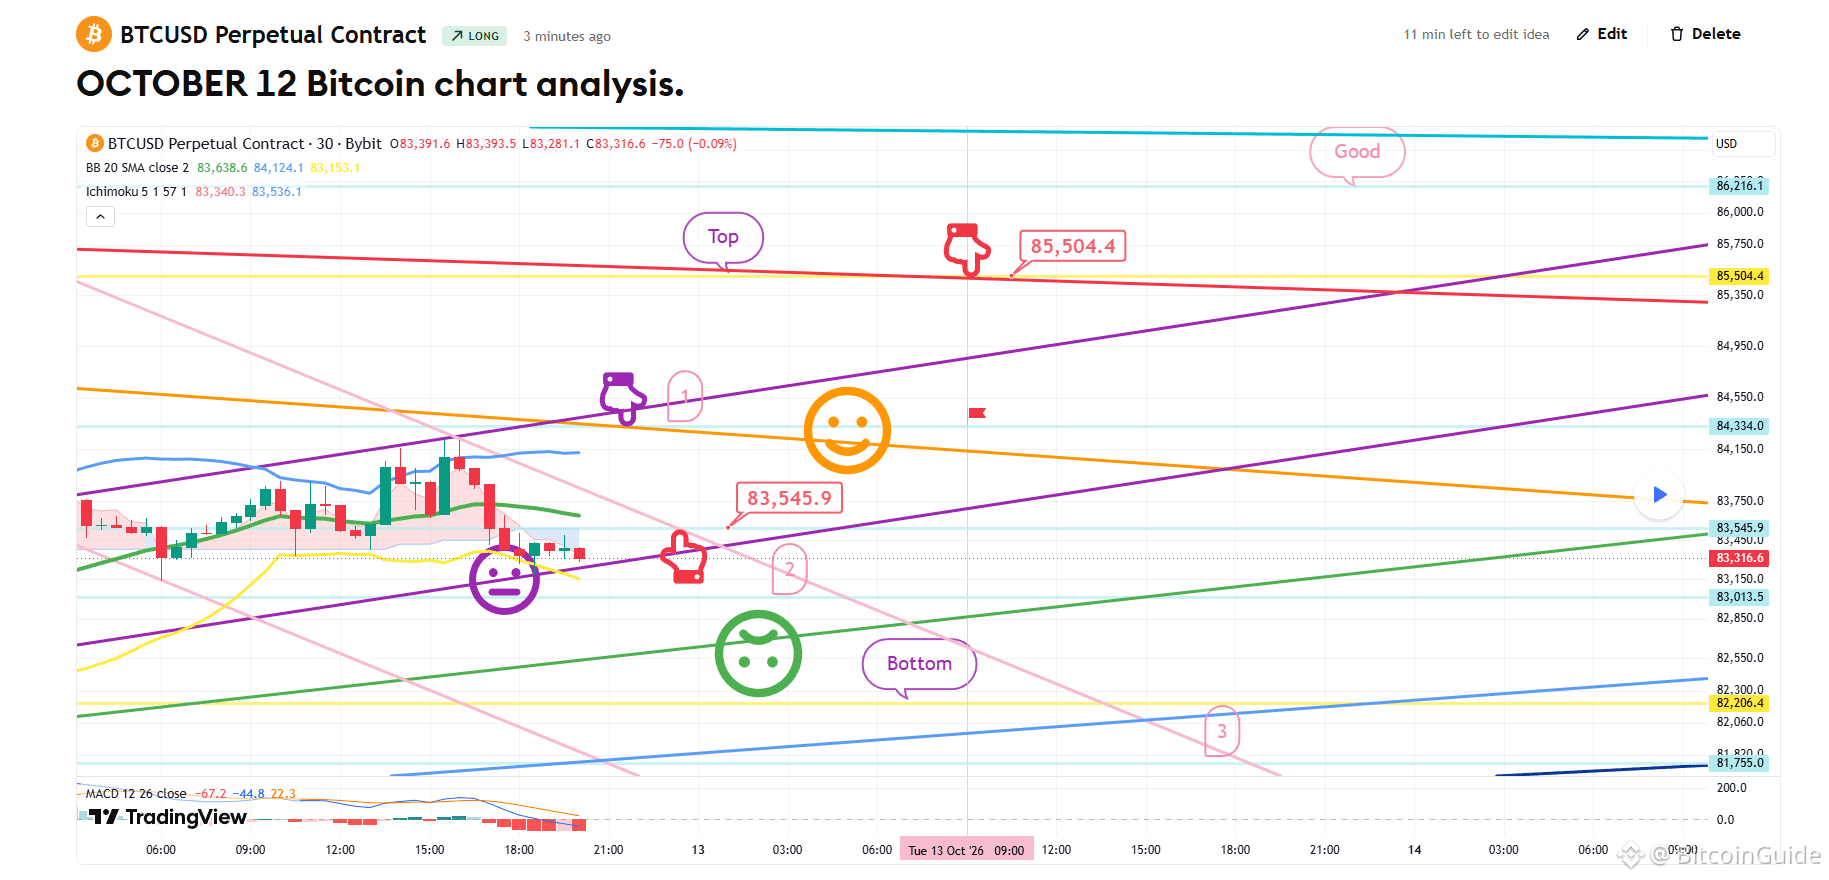
I am maintaining the long position entered at the October 8th "Bottom" level ($80,946.5).
Please pay attention to the purple parallel support line I have marked.
*Strategy regarding the area marked with the purple finger (Zone 1):
1) After confirming a touch of the purple finger zone (Zone 1):
Switch to a long position at the red finger level ($83,545.9) below.
/ Stop-loss if the price breaks below the purple support line.
2) First target for the long position: "Top" level ($85,504.4) ->
Second target: "Good" zone level (for tomorrow or later).
3) If the price drops directly without touching the purple finger zone:
Entry zone for a long position: "Zone 2" ($83,013.5) below.
/ Stop-loss if the price breaks below the green support line.
Please be cautious, as a sharp drop in the Nasdaq could lead to forced market coupling.
If the price breaks below the green support line,
the downside is open from the "Bottom" level down to "Zone 3."
I post the analysis results as a Comment every day.
Thank you.
(You can find the link on my profile.)
- Click Follow to receive faster information every day.
- Check the results using the replay button on TradingView.
#Crypto# #BTC100K #Altcoin Season# #Trading #BTC Price Analysis# $USDC $BNB $ETH $BTC $XRP
[OCTOBER 12 Bitcoin chart analysis]
BTCUSD 30Min Chart
*My analysis is optimized for TradingView.
If you press the replay button, you can check real-time movements.
-Long position strategy-
There are no specific Nasdaq data releases scheduled,
but a MACD "death cross" is currently forming on the daily chart.
I am maintaining the long position entered at the October 8th "Bottom" level ($80,946.5).
Please pay attention to the purple parallel support line I have marked.
*Strategy regarding the area marked with the purple finger (Zone 1):
1) After confirming a touch of the purple finger zone (Zone 1):
Switch to a long position at the red finger level ($83,545.9) below.
/ Stop-loss if the price breaks below the purple support line.
2) First target for the long position: "Top" level ($85,504.4) ->
Second target: "Good" zone level (for tomorrow or later).
3) If the price drops directly without touching the purple finger zone:
Entry zone for a long position: "Zone 2" ($83,013.5) below.
/ Stop-loss if the price breaks below the green support line.
Please be cautious, as a sharp drop in the Nasdaq could lead to forced market coupling.
If the price breaks below the green support line,
the downside is open from the "Bottom" level down to "Zone 3."
I post the analysis results as a Comment every day.
Thank you.
(You can find the link on my profile.)
- Click Follow to receive faster information every day.
- Check the results using the replay button on TradingView.
#Crypto# #BTC100K #Altcoin Season# #Trading #BTC Price Analysis# $USDC $BNB $ETH $BTC $XRP
BTCUSD 30Min Chart
*My analysis is optimized for TradingView.
If you press the replay button, you can check real-time movements.
-Long position strategy-
There are no specific Nasdaq data releases scheduled,
but a MACD "death cross" is currently forming on the daily chart.
I am maintaining the long position entered at the October 8th "Bottom" level ($80,946.5).
Please pay attention to the purple parallel support line I have marked.
*Strategy regarding the area marked with the purple finger (Zone 1):
1) After confirming a touch of the purple finger zone (Zone 1):
Switch to a long position at the red finger level ($83,545.9) below.
/ Stop-loss if the price breaks below the purple support line.
2) First target for the long position: "Top" level ($85,504.4) ->
Second target: "Good" zone level (for tomorrow or later).
3) If the price drops directly without touching the purple finger zone:
Entry zone for a long position: "Zone 2" ($83,013.5) below.
/ Stop-loss if the price breaks below the green support line.
Please be cautious, as a sharp drop in the Nasdaq could lead to forced market coupling.
If the price breaks below the green support line,
the downside is open from the "Bottom" level down to "Zone 3."
I post the analysis results as a Comment every day.
Thank you.
(You can find the link on my profile.)
- Click Follow to receive faster information every day.
- Check the results using the replay button on TradingView.
#Crypto# #BTC100K #Altcoin Season# #Trading #BTC Price Analysis# $USDC $BNB $ETH $BTC $XRP
67
·
--
[OCTOBER 8 Bitcoin chart analysis]
BTCUSD 30Min Chart
*My analysis is optimized for TradingView.
If you press the replay button, you can check real-time movements.
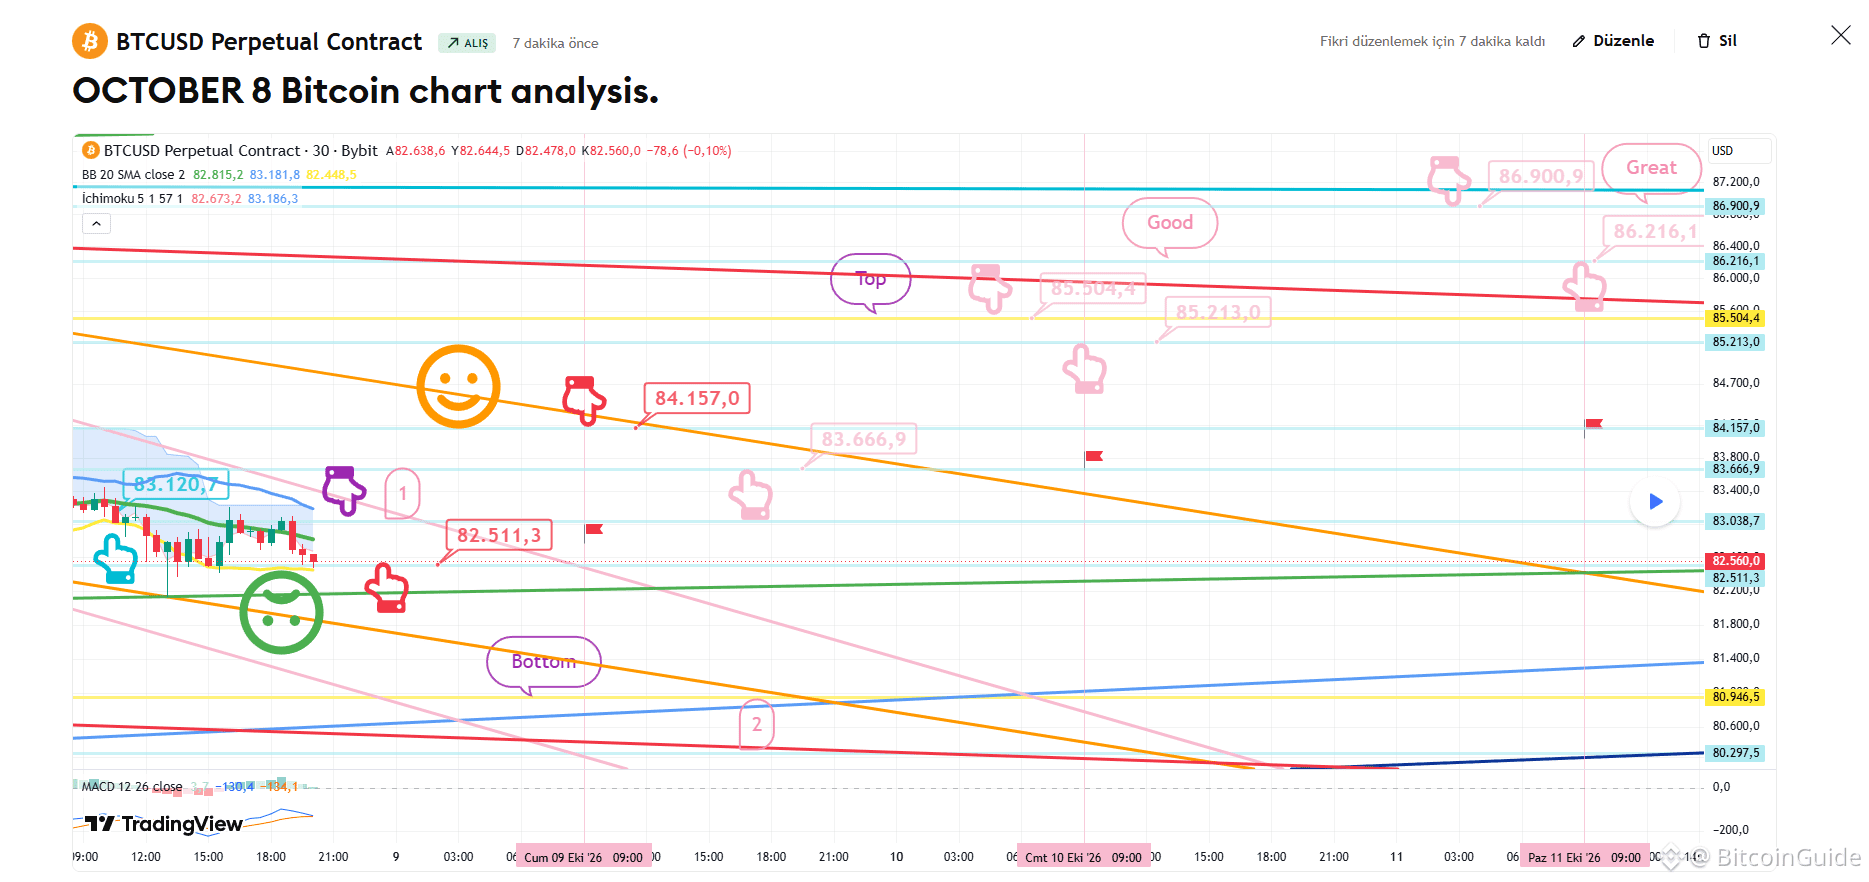
On the left, I have maintained the strategy for the long position entry point at $83,120.7 (marked by the light blue finger), which was established on October 7.
*Long position strategy regarding the touch of the zone marked by the purple finger (Zone 1):
1) After confirming the touch of the purple finger zone (Zone 1):
Long position entry point at $82,511.3 (red finger);
Stop-loss level if the green support line is broken (this stop-loss level also applies to those currently holding the $83.1K long position).
2) First target for the long position: $84,157;
-> I have provided a simulation with pink finger markers showing the target levels in the order of "Top," "Good," and "Great" for the weekend,
so please refer to that.
3) If the price drops directly without touching the purple finger zone (Zone 1):
Long position entry point at the "Bottom" zone of $80,946.5;
Stop-loss level if the light blue support line is broken.
If the "Bottom" zone is breached, the price could fall as far as Zone 2;
given the possibility of further Nasdaq corrections and the fact that the low of the Bitcoin monthly candle has been broken,
there is a high likelihood of continued volatility (swings in both directions) this month.
Please note that the medium-term pattern can be maintained
as long as the green support line holds.
Please use my analysis solely for reference and guidance.
I urge you to trade based on principles and always use stop-loss orders to ensure safety.
Thank you.
(You can find the link on my profile.)
- Click Follow to receive faster information every day.
- Check the results using the replay button on TradingView.
#Crypto #BTC Price Analysis# #Altcoin Season# #ETH $XRP $USDT $BTC $ETH
[OCTOBER 8 Bitcoin chart analysis]
BTCUSD 30Min Chart
*My analysis is optimized for TradingView.
If you press the replay button, you can check real-time movements.
On the left, I have maintained the strategy for the long position entry point at $83,120.7 (marked by the light blue finger), which was established on October 7.
*Long position strategy regarding the touch of the zone marked by the purple finger (Zone 1):
1) After confirming the touch of the purple finger zone (Zone 1):
Long position entry point at $82,511.3 (red finger);
Stop-loss level if the green support line is broken (this stop-loss level also applies to those currently holding the $83.1K long position).
2) First target for the long position: $84,157;
-> I have provided a simulation with pink finger markers showing the target levels in the order of "Top," "Good," and "Great" for the weekend,
so please refer to that.
3) If the price drops directly without touching the purple finger zone (Zone 1):
Long position entry point at the "Bottom" zone of $80,946.5;
Stop-loss level if the light blue support line is broken.
If the "Bottom" zone is breached, the price could fall as far as Zone 2;
given the possibility of further Nasdaq corrections and the fact that the low of the Bitcoin monthly candle has been broken,
there is a high likelihood of continued volatility (swings in both directions) this month.
Please note that the medium-term pattern can be maintained
as long as the green support line holds.
Please use my analysis solely for reference and guidance.
I urge you to trade based on principles and always use stop-loss orders to ensure safety.
Thank you.
(You can find the link on my profile.)
- Click Follow to receive faster information every day.
- Check the results using the replay button on TradingView.
#Crypto #BTC Price Analysis# #Altcoin Season# #ETH $XRP $USDT $BTC $ETH
BTCUSD 30Min Chart
*My analysis is optimized for TradingView.
If you press the replay button, you can check real-time movements.
On the left, I have maintained the strategy for the long position entry point at $83,120.7 (marked by the light blue finger), which was established on October 7.
*Long position strategy regarding the touch of the zone marked by the purple finger (Zone 1):
1) After confirming the touch of the purple finger zone (Zone 1):
Long position entry point at $82,511.3 (red finger);
Stop-loss level if the green support line is broken (this stop-loss level also applies to those currently holding the $83.1K long position).
2) First target for the long position: $84,157;
-> I have provided a simulation with pink finger markers showing the target levels in the order of "Top," "Good," and "Great" for the weekend,
so please refer to that.
3) If the price drops directly without touching the purple finger zone (Zone 1):
Long position entry point at the "Bottom" zone of $80,946.5;
Stop-loss level if the light blue support line is broken.
If the "Bottom" zone is breached, the price could fall as far as Zone 2;
given the possibility of further Nasdaq corrections and the fact that the low of the Bitcoin monthly candle has been broken,
there is a high likelihood of continued volatility (swings in both directions) this month.
Please note that the medium-term pattern can be maintained
as long as the green support line holds.
Please use my analysis solely for reference and guidance.
I urge you to trade based on principles and always use stop-loss orders to ensure safety.
Thank you.
(You can find the link on my profile.)
- Click Follow to receive faster information every day.
- Check the results using the replay button on TradingView.
#Crypto #BTC Price Analysis# #Altcoin Season# #ETH $XRP $USDT $BTC $ETH
80
·
--
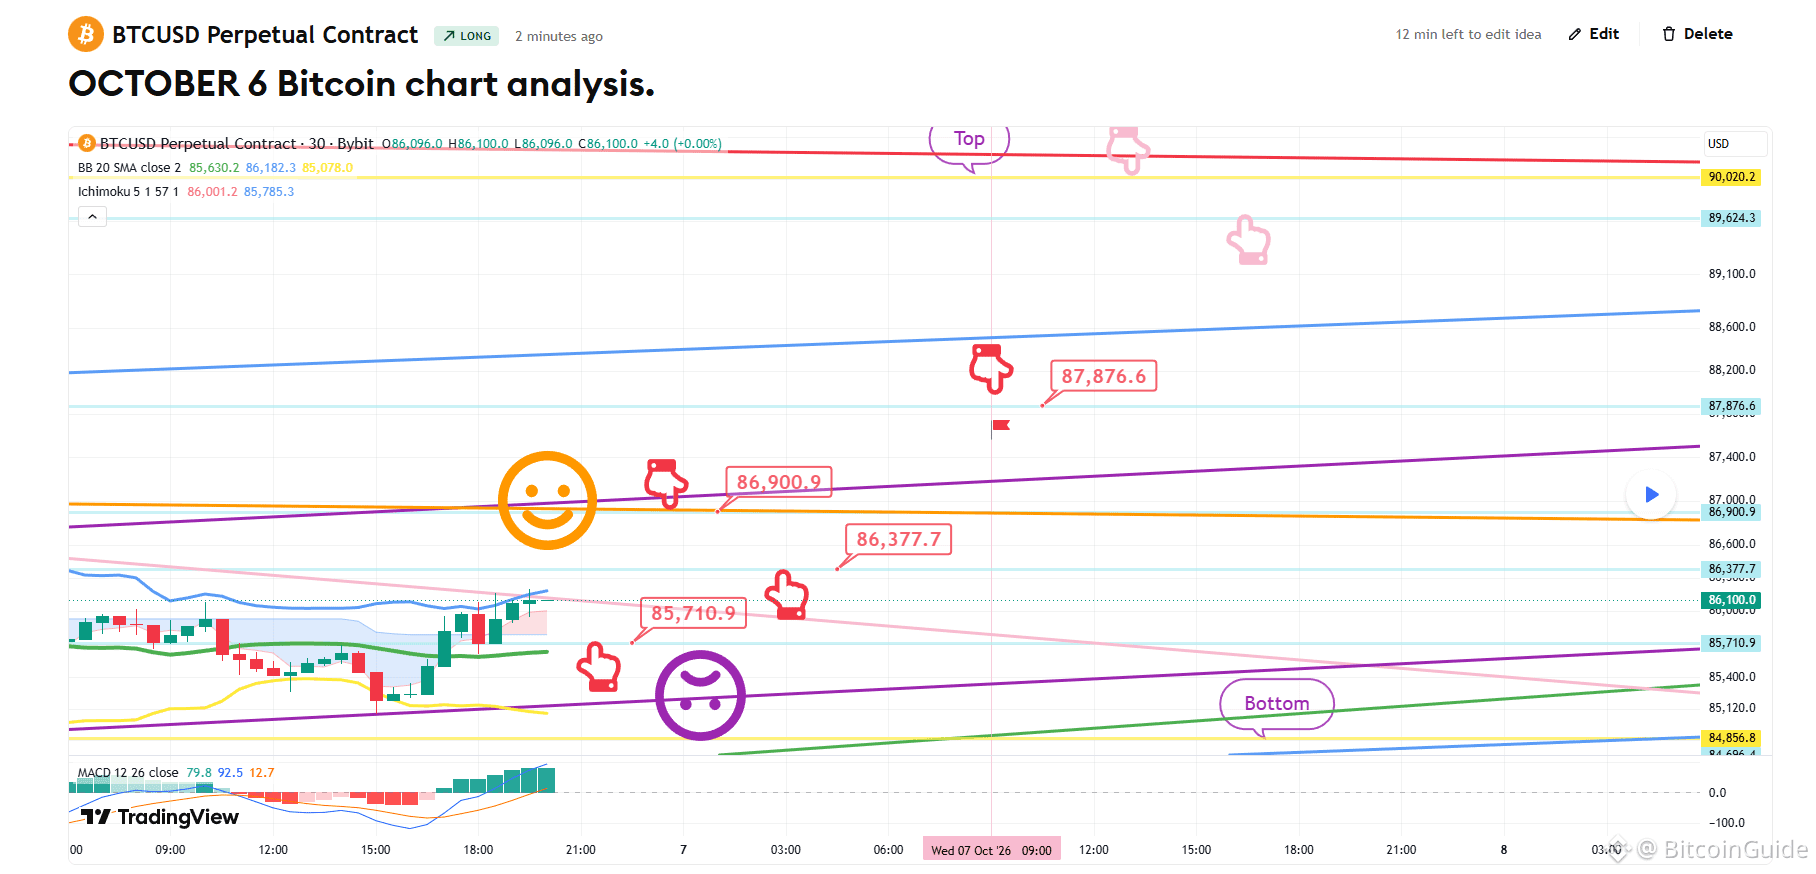
[OCTOBER 6 Bitcoin chart analysis]
BTCUSD 30Min Chart
*My analysis is optimized for TradingView.
If you press the replay button, you can check real-time movements.
This is the Bitcoin 30-minute chart.
The current price level coincides with a MACD "death cross" on the 6-hour and 12-hour charts,
meaning the market could see either an upward move or a correction.
I have decided to disregard the warning signal and formulate a long position strategy.
*Scenario following the red arrow path
Long position strategy
1) Entry zone: $85,710.9 / Stop-loss: If the price breaks below the purple support line
2) Targets: 1st target at $86,900.9 -> followed by $87.8K and the "Top" zone
If the strategy succeeds, the $86.3K level can be used for re-entering a long position.
I have also provided a simulation based on the pink arrow path, depending on tomorrow's movements.
If the price breaks below the purple support line:
The downside is open all the way to the "Bottom" level.
If the price drops to this zone:
Please be aware that the MACD death cross on the 6-hour and 12-hour charts will be in effect.
Please treat this analysis merely as a reference for your own trading.
I post the analysis results as a Comment every day.
Thank you.
(You can find the link on my profile.)
- Click Follow to receive faster information every day.
- Check the results using the replay button on TradingView.
#BTC Price Analysis# #BTC100K #Crypto# #Altcoin Season# $BTC $ETH $USDT $XRP
[OCTOBER 6 Bitcoin chart analysis]
BTCUSD 30Min Chart
*My analysis is optimized for TradingView.
If you press the replay button, you can check real-time movements.
This is the Bitcoin 30-minute chart.
The current price level coincides with a MACD "death cross" on the 6-hour and 12-hour charts,
meaning the market could see either an upward move or a correction.
I have decided to disregard the warning signal and formulate a long position strategy.
*Scenario following the red arrow path
Long position strategy
1) Entry zone: $85,710.9 / Stop-loss: If the price breaks below the purple support line
2) Targets: 1st target at $86,900.9 -> followed by $87.8K and the "Top" zone
If the strategy succeeds, the $86.3K level can be used for re-entering a long position.
I have also provided a simulation based on the pink arrow path, depending on tomorrow's movements.
If the price breaks below the purple support line:
The downside is open all the way to the "Bottom" level.
If the price drops to this zone:
Please be aware that the MACD death cross on the 6-hour and 12-hour charts will be in effect.
Please treat this analysis merely as a reference for your own trading.
I post the analysis results as a Comment every day.
Thank you.
(You can find the link on my profile.)
- Click Follow to receive faster information every day.
- Check the results using the replay button on TradingView.
#BTC Price Analysis# #BTC100K #Crypto# #Altcoin Season# $BTC $ETH $USDT $XRP
BTCUSD 30Min Chart
*My analysis is optimized for TradingView.
If you press the replay button, you can check real-time movements.
This is the Bitcoin 30-minute chart.
The current price level coincides with a MACD "death cross" on the 6-hour and 12-hour charts,
meaning the market could see either an upward move or a correction.
I have decided to disregard the warning signal and formulate a long position strategy.
*Scenario following the red arrow path
Long position strategy
1) Entry zone: $85,710.9 / Stop-loss: If the price breaks below the purple support line
2) Targets: 1st target at $86,900.9 -> followed by $87.8K and the "Top" zone
If the strategy succeeds, the $86.3K level can be used for re-entering a long position.
I have also provided a simulation based on the pink arrow path, depending on tomorrow's movements.
If the price breaks below the purple support line:
The downside is open all the way to the "Bottom" level.
If the price drops to this zone:
Please be aware that the MACD death cross on the 6-hour and 12-hour charts will be in effect.
Please treat this analysis merely as a reference for your own trading.
I post the analysis results as a Comment every day.
Thank you.
(You can find the link on my profile.)
- Click Follow to receive faster information every day.
- Check the results using the replay button on TradingView.
#BTC Price Analysis# #BTC100K #Crypto# #Altcoin Season# $BTC $ETH $USDT $XRP
61
·
--
[OCTOBER 1 Bitcoin chart analysis]
BTCUSD 30Min Chart
*My analysis is optimized for TradingView.
If you press the replay button, you can check real-time movements.
-Long position strategy-
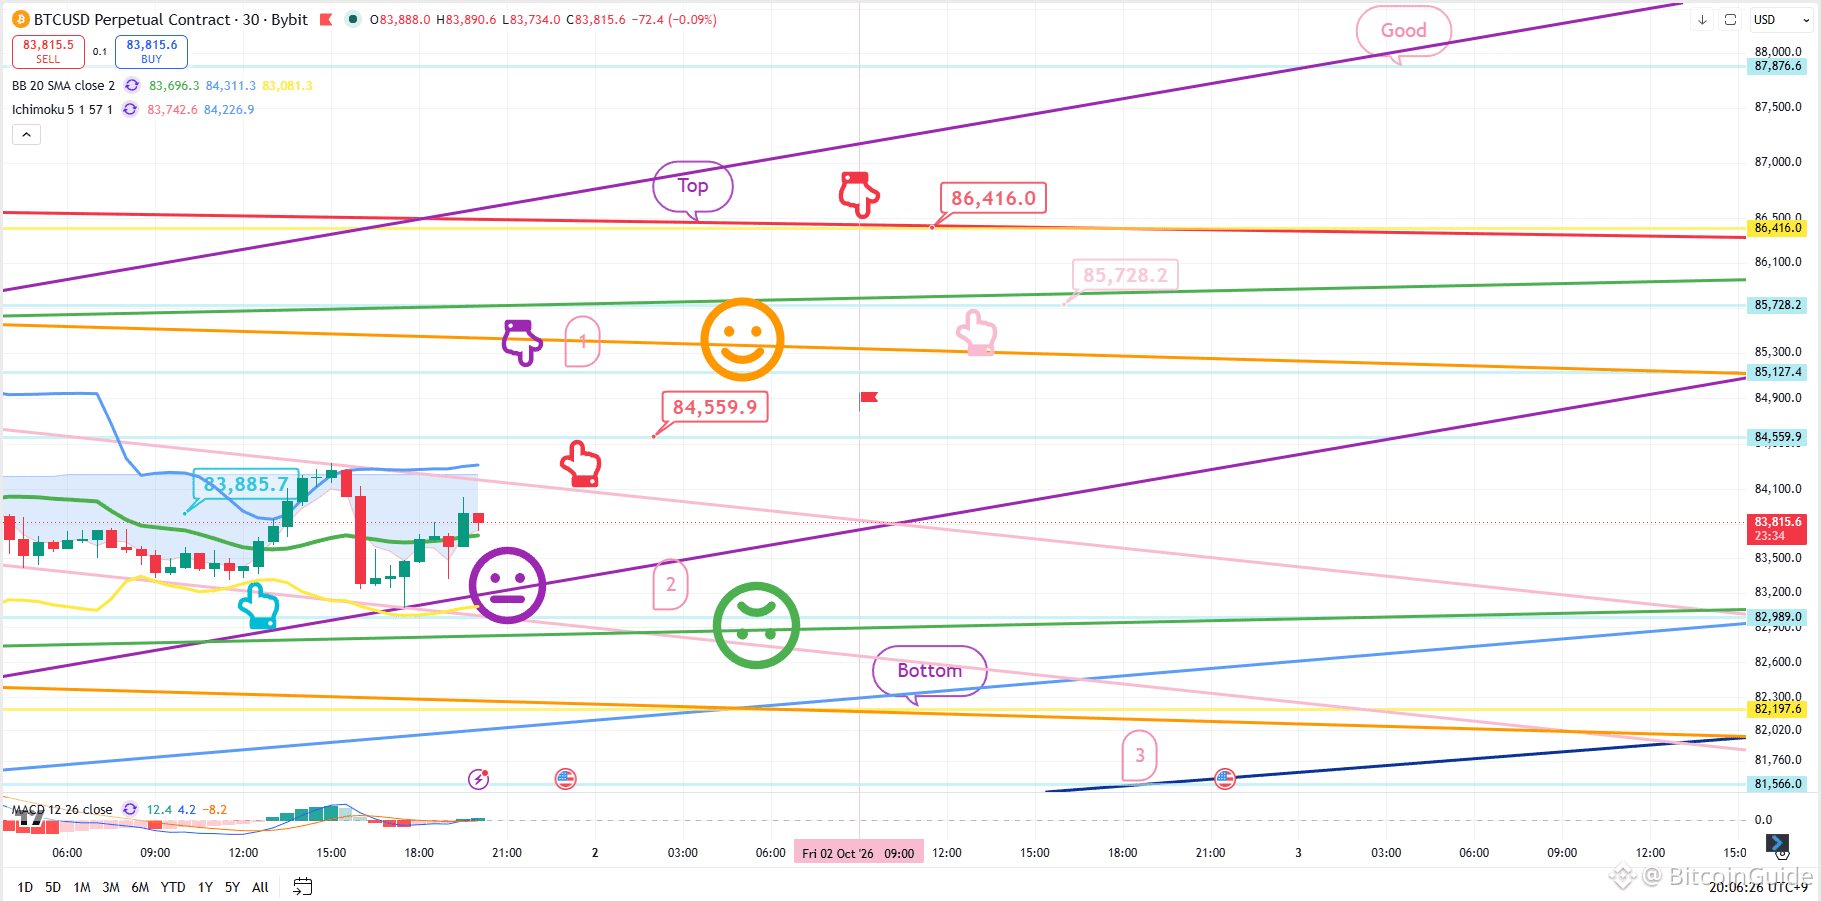
At the bottom left, indicated by the light blue finger, I have maintained the strategy for the long position entry point of $83,885.7 established yesterday.
Nasdaq economic data is scheduled for release at 11:00.
*Long position strategy based on touching the "Purple Finger 1" zone at the top:
1) After confirming a touch on "Purple Finger 1":
Long position entry at the red finger mark ($84,559.9) / Stop-loss if the purple support line is breached.
2) Top zone ($86,416) as the 1st target for the long position -> "Good" level as the 2nd target.
If the strategy succeeds, the $85.7K level can be used for re-entering a long position.
3) If the price drops without touching Zone 1:
Long position entry at Zone 2 ($82,989) / Stop-loss if the green support line is breached.
For those holding the $83.8K long position from yesterday,
it would be advisable to apply the same stop-loss level based on the green support line.
Once the green support line is breached,
the price could drop toward the "Bottom" zone marked below—potentially down to Zone 3—
so please exercise caution.
Although yesterday's monthly candle formed at the lower end,
it touched the Bollinger Bands' middle line;
therefore, if it holds without breaking the purple support line, the upward trend can continue.
I post the analysis results as a Comment every day.
Thank you.
(You can find the link on my profile.)
- Click Follow to receive faster information every day.
- Check the results using the replay button on TradingView.
#BTC100K #Altcoin Season# #Crypto #BTC Price Analysis# $ETH $XRP $USDT $BTC
[OCTOBER 1 Bitcoin chart analysis]
BTCUSD 30Min Chart
*My analysis is optimized for TradingView.
If you press the replay button, you can check real-time movements.
-Long position strategy-
At the bottom left, indicated by the light blue finger, I have maintained the strategy for the long position entry point of $83,885.7 established yesterday.
Nasdaq economic data is scheduled for release at 11:00.
*Long position strategy based on touching the "Purple Finger 1" zone at the top:
1) After confirming a touch on "Purple Finger 1":
Long position entry at the red finger mark ($84,559.9) / Stop-loss if the purple support line is breached.
2) Top zone ($86,416) as the 1st target for the long position -> "Good" level as the 2nd target.
If the strategy succeeds, the $85.7K level can be used for re-entering a long position.
3) If the price drops without touching Zone 1:
Long position entry at Zone 2 ($82,989) / Stop-loss if the green support line is breached.
For those holding the $83.8K long position from yesterday,
it would be advisable to apply the same stop-loss level based on the green support line.
Once the green support line is breached,
the price could drop toward the "Bottom" zone marked below—potentially down to Zone 3—
so please exercise caution.
Although yesterday's monthly candle formed at the lower end,
it touched the Bollinger Bands' middle line;
therefore, if it holds without breaking the purple support line, the upward trend can continue.
I post the analysis results as a Comment every day.
Thank you.
(You can find the link on my profile.)
- Click Follow to receive faster information every day.
- Check the results using the replay button on TradingView.
#BTC100K #Altcoin Season# #Crypto #BTC Price Analysis# $ETH $XRP $USDT $BTC
BTCUSD 30Min Chart
*My analysis is optimized for TradingView.
If you press the replay button, you can check real-time movements.
-Long position strategy-
At the bottom left, indicated by the light blue finger, I have maintained the strategy for the long position entry point of $83,885.7 established yesterday.
Nasdaq economic data is scheduled for release at 11:00.
*Long position strategy based on touching the "Purple Finger 1" zone at the top:
1) After confirming a touch on "Purple Finger 1":
Long position entry at the red finger mark ($84,559.9) / Stop-loss if the purple support line is breached.
2) Top zone ($86,416) as the 1st target for the long position -> "Good" level as the 2nd target.
If the strategy succeeds, the $85.7K level can be used for re-entering a long position.
3) If the price drops without touching Zone 1:
Long position entry at Zone 2 ($82,989) / Stop-loss if the green support line is breached.
For those holding the $83.8K long position from yesterday,
it would be advisable to apply the same stop-loss level based on the green support line.
Once the green support line is breached,
the price could drop toward the "Bottom" zone marked below—potentially down to Zone 3—
so please exercise caution.
Although yesterday's monthly candle formed at the lower end,
it touched the Bollinger Bands' middle line;
therefore, if it holds without breaking the purple support line, the upward trend can continue.
I post the analysis results as a Comment every day.
Thank you.
(You can find the link on my profile.)
- Click Follow to receive faster information every day.
- Check the results using the replay button on TradingView.
#BTC100K #Altcoin Season# #Crypto #BTC Price Analysis# $ETH $XRP $USDT $BTC
79
·
--
[September 29 Bitcoin chart analysis]
BTCUSD 30Min Chart
*My analysis is optimized for TradingView.
If you press the replay button, you can check real-time movements.
- Neutral strategy-
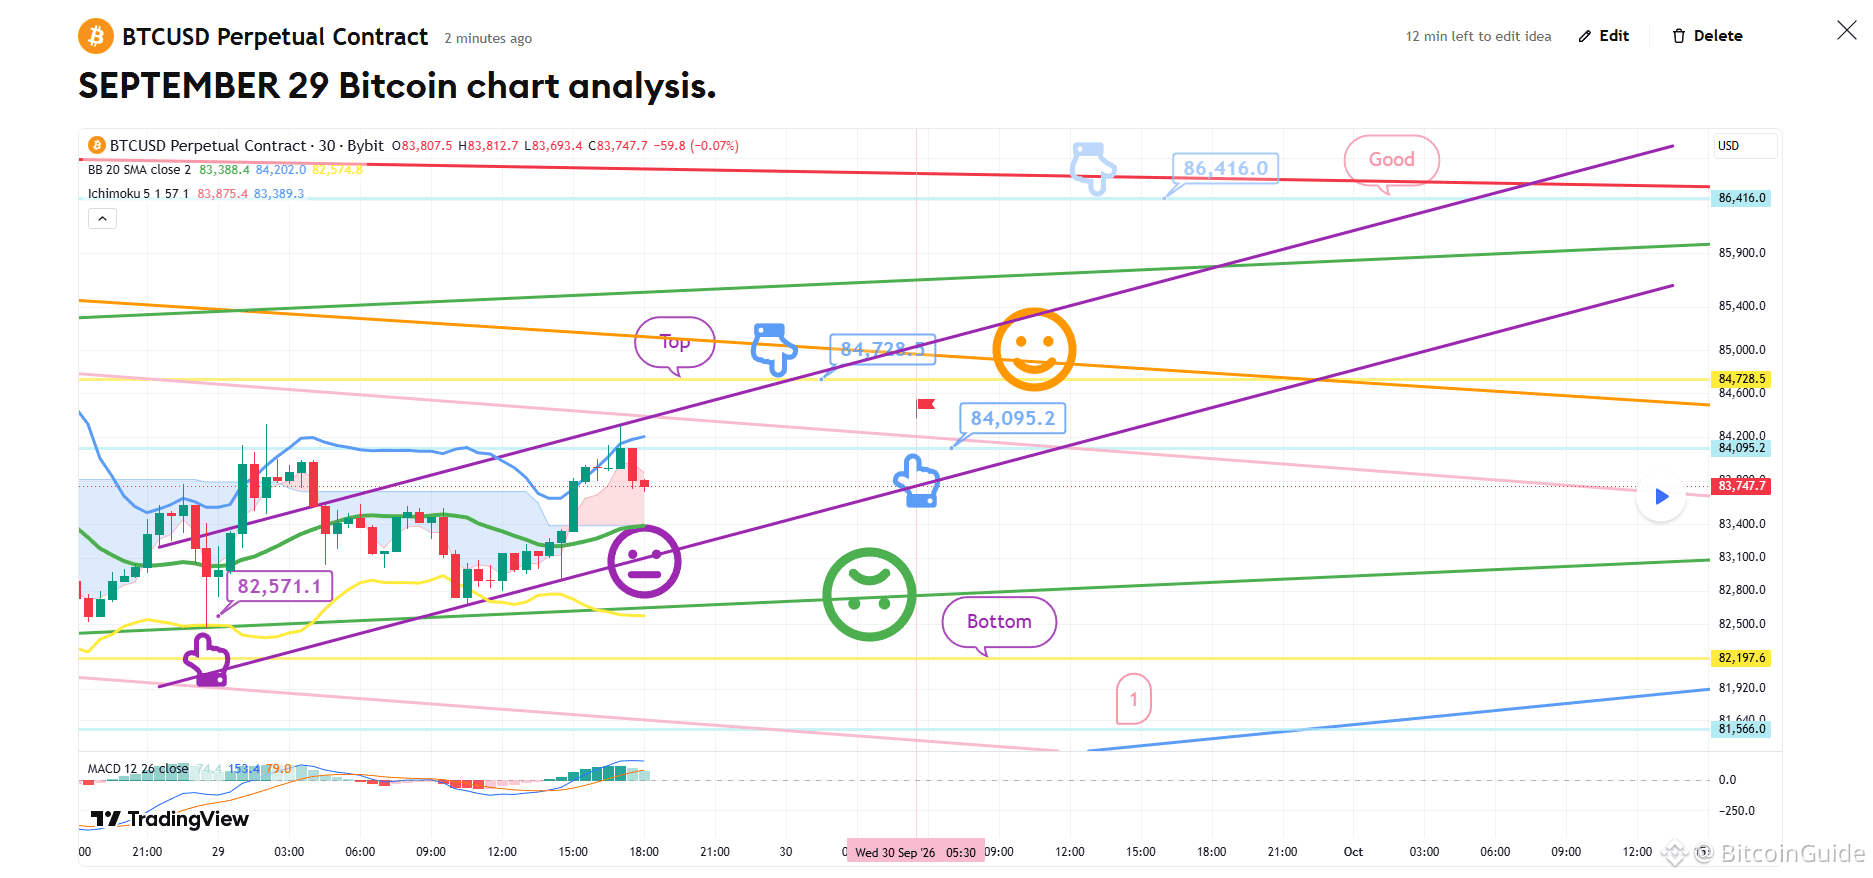
This is the 30-minute Bitcoin chart.
At the bottom left, indicated by a purple finger,
I have maintained the strategy for the long position entered on the 28th at $82,571.1.
*If the price follows the path of the light blue finger:
A two-way neutral strategy
1) Top zone (light blue finger):
Short position entry at $84,728.5 / Stop-loss if the orange resistance line is broken.
2) Re-entry zone for long position at $84,095.2 / Stop-loss if the purple support line is broken.
3) Final target zone (post-tomorrow): $86,416
/ Watch for a confirmed MACD "death cross" on the daily chart.
4) If the purple support line is broken,
there is a possibility of sideways movement or further decline.
For those currently holding positions above $82.5K,
it is advisable to set a stop-loss based on a break of the final green support line.
If the green support line is broken,
the price could drop to the "Bottom" zone marked at the lower end (down to Zone 1),
so please exercise caution.
As there is currently a strong correlation ("forced coupling") with the Nasdaq,
please keep a close eye on Nasdaq movements.
I post the analysis results as a Comment every day.
Thank you.
(You can find the link on my profile.)
- Click Follow to receive faster information every day.
- Check the results using the replay button on TradingView.
#BTC Price Analysis# #Crypto #Gold #Altcoin Season# $XRP $USDC $USDT $BTC
[September 29 Bitcoin chart analysis]
BTCUSD 30Min Chart
*My analysis is optimized for TradingView.
If you press the replay button, you can check real-time movements.
- Neutral strategy-
This is the 30-minute Bitcoin chart.
At the bottom left, indicated by a purple finger,
I have maintained the strategy for the long position entered on the 28th at $82,571.1.
*If the price follows the path of the light blue finger:
A two-way neutral strategy
1) Top zone (light blue finger):
Short position entry at $84,728.5 / Stop-loss if the orange resistance line is broken.
2) Re-entry zone for long position at $84,095.2 / Stop-loss if the purple support line is broken.
3) Final target zone (post-tomorrow): $86,416
/ Watch for a confirmed MACD "death cross" on the daily chart.
4) If the purple support line is broken,
there is a possibility of sideways movement or further decline.
For those currently holding positions above $82.5K,
it is advisable to set a stop-loss based on a break of the final green support line.
If the green support line is broken,
the price could drop to the "Bottom" zone marked at the lower end (down to Zone 1),
so please exercise caution.
As there is currently a strong correlation ("forced coupling") with the Nasdaq,
please keep a close eye on Nasdaq movements.
I post the analysis results as a Comment every day.
Thank you.
(You can find the link on my profile.)
- Click Follow to receive faster information every day.
- Check the results using the replay button on TradingView.
#BTC Price Analysis# #Crypto #Gold #Altcoin Season# $XRP $USDC $USDT $BTC
BTCUSD 30Min Chart
*My analysis is optimized for TradingView.
If you press the replay button, you can check real-time movements.
- Neutral strategy-
This is the 30-minute Bitcoin chart.
At the bottom left, indicated by a purple finger,
I have maintained the strategy for the long position entered on the 28th at $82,571.1.
*If the price follows the path of the light blue finger:
A two-way neutral strategy
1) Top zone (light blue finger):
Short position entry at $84,728.5 / Stop-loss if the orange resistance line is broken.
2) Re-entry zone for long position at $84,095.2 / Stop-loss if the purple support line is broken.
3) Final target zone (post-tomorrow): $86,416
/ Watch for a confirmed MACD "death cross" on the daily chart.
4) If the purple support line is broken,
there is a possibility of sideways movement or further decline.
For those currently holding positions above $82.5K,
it is advisable to set a stop-loss based on a break of the final green support line.
If the green support line is broken,
the price could drop to the "Bottom" zone marked at the lower end (down to Zone 1),
so please exercise caution.
As there is currently a strong correlation ("forced coupling") with the Nasdaq,
please keep a close eye on Nasdaq movements.
I post the analysis results as a Comment every day.
Thank you.
(You can find the link on my profile.)
- Click Follow to receive faster information every day.
- Check the results using the replay button on TradingView.
#BTC Price Analysis# #Crypto #Gold #Altcoin Season# $XRP $USDC $USDT $BTC
74
·
--
[September 23 Bitcoin chart analysis]
BTCUSD 30Min Chart
*My analysis is optimized for TradingView.
If you press the replay button, you can check real-time movements.
-Long position strategy-
This is the 30-minute Bitcoin chart.
While a correction is likely for the Nasdaq,
Bitcoin appears highly likely to move sideways at this level.
I have disregarded the MACD "death cross" on the 6-hour chart.
Also, I am interpreting the monthly chart as not having touched the middle line of the Bollinger Bands.
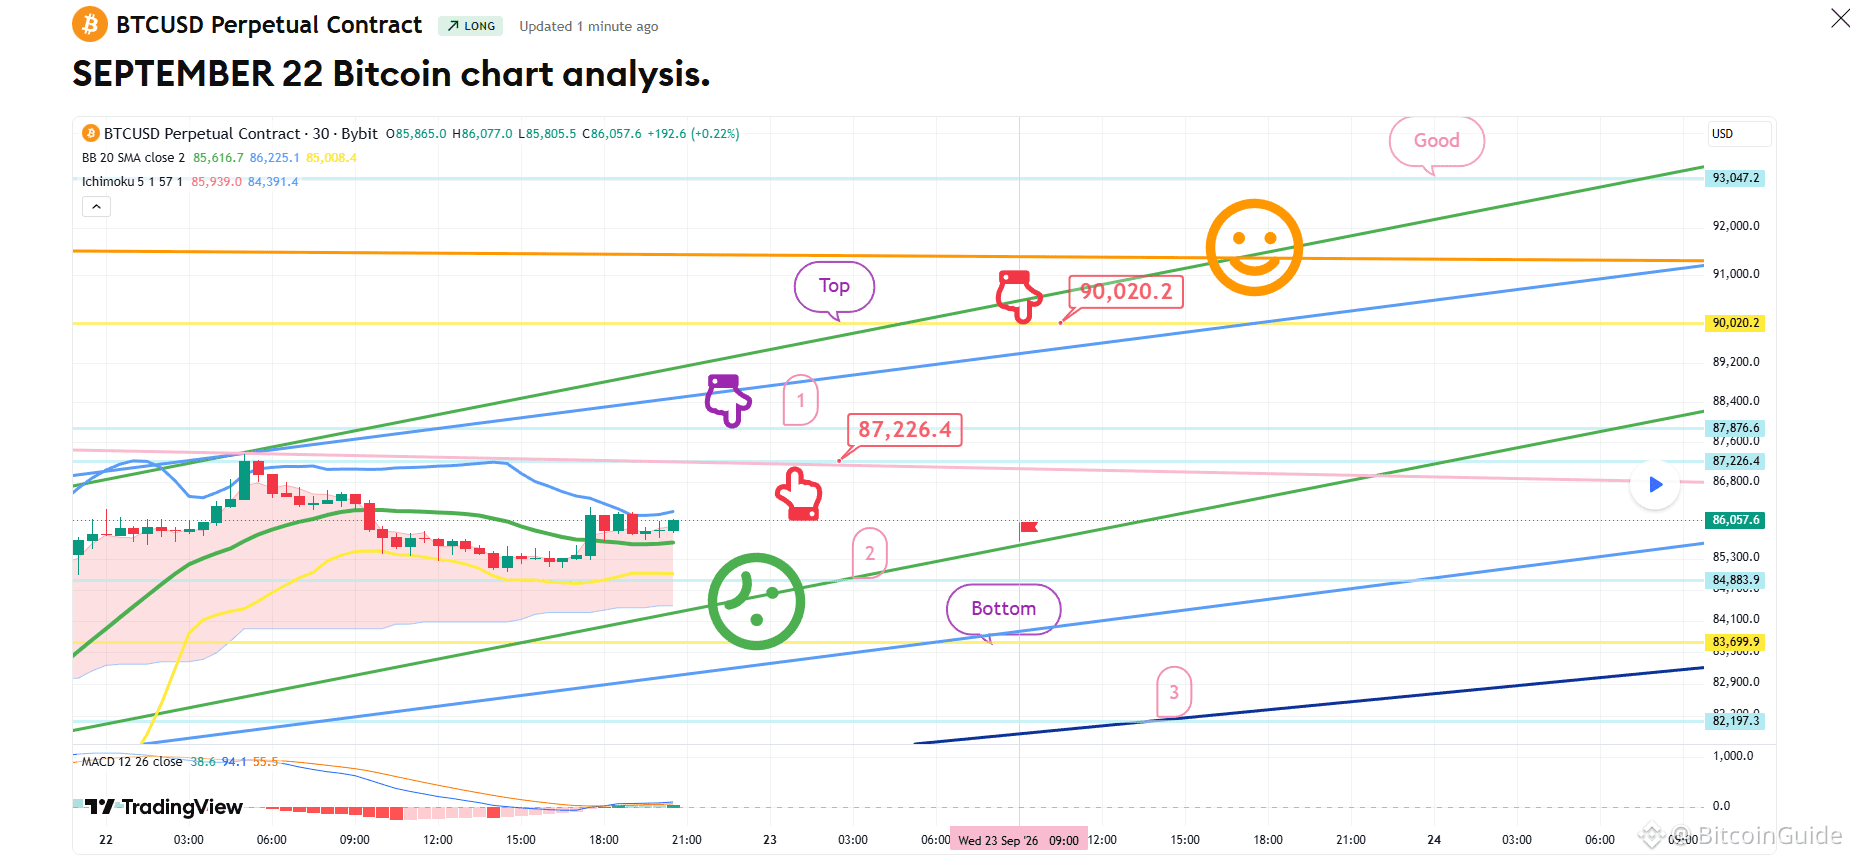
*If the price follows the path indicated by the red arrow:
Long position strategy
1) Long entry zone: $85,871.9 / Stop-loss level: If the purple support line is breached
2) Long position 1st target: $87,876.6 -> 2nd target: Top zone
The $87,114.4 level is a zone to consider for re-entering a long position.
Even if the price drops after a period of sideways movement, the bullish pattern remains intact,
so the area down to the "Bottom" level is considered a safe zone.
If the purple support line is breached,
please be aware that the price could drop to the "Bottom" level marked below,
then to level 1, and potentially as low as $83,699.9 by the weekend.
South Korea observes the Chuseok (Mid-Autumn Festival) holiday from tomorrow until the 27th.
I’ll take a good rest over the weekend and return next Monday.
I post the analysis results as a Comment every day.
Thank you.
(You can find the link on my profile.)
- Click Follow to receive faster information every day.
- Check the results using the replay button on TradingView.
#Bitcoin #BTC100K #Crypto #Altcoin Season# #BTC Price Analysis# $ETH $USDT $BTC $BNB $XRP
[September 23 Bitcoin chart analysis]
BTCUSD 30Min Chart
*My analysis is optimized for TradingView.
If you press the replay button, you can check real-time movements.
-Long position strategy-
This is the 30-minute Bitcoin chart.
While a correction is likely for the Nasdaq,
Bitcoin appears highly likely to move sideways at this level.
I have disregarded the MACD "death cross" on the 6-hour chart.
Also, I am interpreting the monthly chart as not having touched the middle line of the Bollinger Bands.
*If the price follows the path indicated by the red arrow:
Long position strategy
1) Long entry zone: $85,871.9 / Stop-loss level: If the purple support line is breached
2) Long position 1st target: $87,876.6 -> 2nd target: Top zone
The $87,114.4 level is a zone to consider for re-entering a long position.
Even if the price drops after a period of sideways movement, the bullish pattern remains intact,
so the area down to the "Bottom" level is considered a safe zone.
If the purple support line is breached,
please be aware that the price could drop to the "Bottom" level marked below,
then to level 1, and potentially as low as $83,699.9 by the weekend.
South Korea observes the Chuseok (Mid-Autumn Festival) holiday from tomorrow until the 27th.
I’ll take a good rest over the weekend and return next Monday.
I post the analysis results as a Comment every day.
Thank you.
(You can find the link on my profile.)
- Click Follow to receive faster information every day.
- Check the results using the replay button on TradingView.
#Bitcoin #BTC100K #Crypto #Altcoin Season# #BTC Price Analysis# $ETH $USDT $BTC $BNB $XRP
BTCUSD 30Min Chart
*My analysis is optimized for TradingView.
If you press the replay button, you can check real-time movements.
-Long position strategy-
This is the 30-minute Bitcoin chart.
While a correction is likely for the Nasdaq,
Bitcoin appears highly likely to move sideways at this level.
I have disregarded the MACD "death cross" on the 6-hour chart.
Also, I am interpreting the monthly chart as not having touched the middle line of the Bollinger Bands.
*If the price follows the path indicated by the red arrow:
Long position strategy
1) Long entry zone: $85,871.9 / Stop-loss level: If the purple support line is breached
2) Long position 1st target: $87,876.6 -> 2nd target: Top zone
The $87,114.4 level is a zone to consider for re-entering a long position.
Even if the price drops after a period of sideways movement, the bullish pattern remains intact,
so the area down to the "Bottom" level is considered a safe zone.
If the purple support line is breached,
please be aware that the price could drop to the "Bottom" level marked below,
then to level 1, and potentially as low as $83,699.9 by the weekend.
South Korea observes the Chuseok (Mid-Autumn Festival) holiday from tomorrow until the 27th.
I’ll take a good rest over the weekend and return next Monday.
I post the analysis results as a Comment every day.
Thank you.
(You can find the link on my profile.)
- Click Follow to receive faster information every day.
- Check the results using the replay button on TradingView.
#Bitcoin #BTC100K #Crypto #Altcoin Season# #BTC Price Analysis# $ETH $USDT $BTC $BNB $XRP
88
·
--
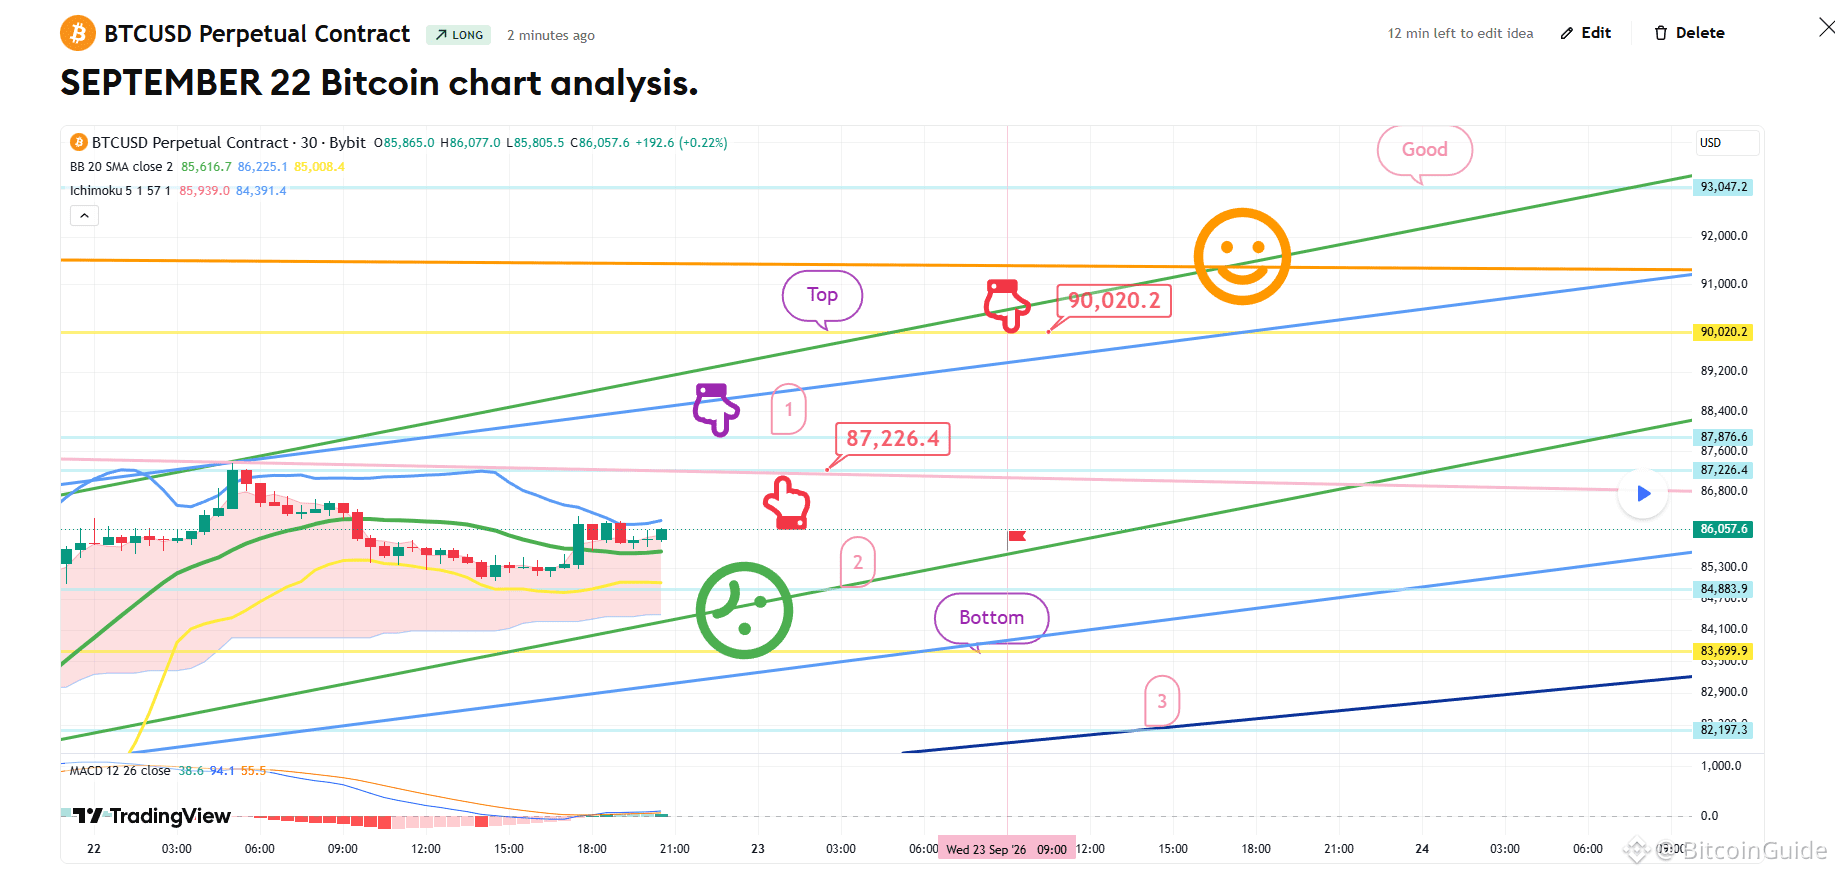
[September 22 Bitcoin chart analysis] BTCUSD 30Min Chart *My analysis is optimized for TradingView. If you press the replay button, you can check real-time movements. -Long position strategy- *The long position strategy focuses on the area marked by the purple finger (labeled "1")—specifically, the movements before and after touching it. 1) After confirming a touch at the purple finger zone (87,876.6 USD): Enter a long position at the red finger zone (87,226.4 USD); set the stop-loss level at the point where the green support line is breached. 2) Top zone (90,0020.2 USD) is the first target for the long position -> "Good" zone is the second target. 3) If the price drops immediately without touching the purple finger zone: The strategy is to wait for a long entry at the lower zone marked "2." Please be cautious: if the green support line is broken, the price could fall to the levels marked "Bottom" or even down to zone "3." I post the analysis results as a Comment every day. Thank you. (You can find the link on my profile.) - Click Follow to receive faster information every day. - Check the results using the replay button on TradingView. #Bitcoin #Crypto# #XRP #BTC100K $USDT $XRP $BTC $ETH
[September 22 Bitcoin chart analysis] BTCUSD 30Min Chart *My analysis is optimized for TradingView. If you press the replay button, you can check real-time movements. -Long position strategy- *The long position strategy focuses on the area marked by the purple finger (labeled "1")—specifically, the movements before and after touching it. 1) After confirming a touch at the purple finger zone (87,876.6 USD): Enter a long position at the red finger zone (87,226.4 USD); set the stop-loss level at the point where the green support line is breached. 2) Top zone (90,0020.2 USD) is the first target for the long position -> "Good" zone is the second target. 3) If the price drops immediately without touching the purple finger zone: The strategy is to wait for a long entry at the lower zone marked "2." Please be cautious: if the green support line is broken, the price could fall to the levels marked "Bottom" or even down to zone "3." I post the analysis results as a Comment every day. Thank you. (You can find the link on my profile.) - Click Follow to receive faster information every day. - Check the results using the replay button on TradingView. #Bitcoin #Crypto# #XRP #BTC100K $USDT $XRP $BTC $ETH
55
·
--
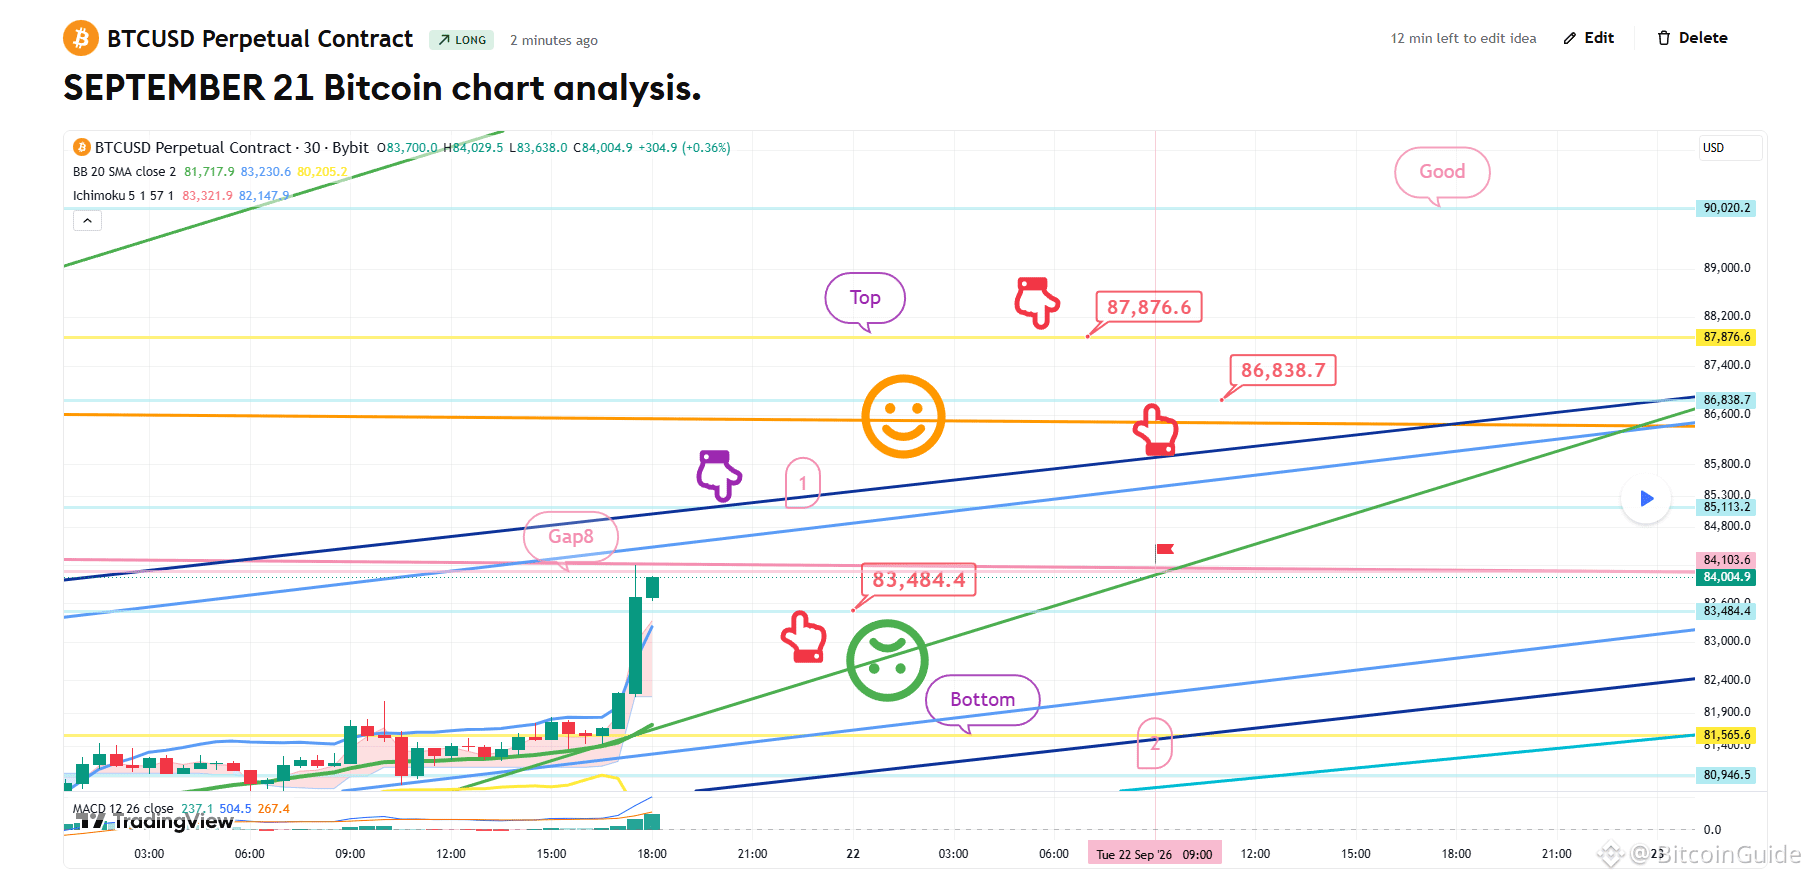
[September 21 Bitcoin chart analysis]
BTCUSD 30Min Chart
*My analysis is optimized for TradingView.
If you press the replay button, you can check real-time movements.
-Long position strategy-
1) Regardless of whether the price touches the purple arrow marker (labeled "1")—where a vertical surge typically follows—
Enter a long position at the red arrow level ($83,484.4); set the stop-loss at the point where the green support line is breached.
2) Primary target for the long position is the $87,876.6 "Top" zone; the "Good" level serves as the secondary target.
If the strategy succeeds, the marked 86.8K zone can be used for re-entering a long position.
If the green support line is breached:
The price could slide down to the "Bottom" zone marked at the lower end—potentially extending as far as the "2" marker.
I post the analysis results as a Comment every day.
Thank you.
(You can find the link on my profile.)
- Click Follow to receive faster information every day.
- Check the results using the replay button on TradingView.
#BTC Price Analysis# #Altcoin Season# #Crypto# #BTC100K $BTC $USDT $XRP $ETH
[September 21 Bitcoin chart analysis]
BTCUSD 30Min Chart
*My analysis is optimized for TradingView.
If you press the replay button, you can check real-time movements.
-Long position strategy-
1) Regardless of whether the price touches the purple arrow marker (labeled "1")—where a vertical surge typically follows—
Enter a long position at the red arrow level ($83,484.4); set the stop-loss at the point where the green support line is breached.
2) Primary target for the long position is the $87,876.6 "Top" zone; the "Good" level serves as the secondary target.
If the strategy succeeds, the marked 86.8K zone can be used for re-entering a long position.
If the green support line is breached:
The price could slide down to the "Bottom" zone marked at the lower end—potentially extending as far as the "2" marker.
I post the analysis results as a Comment every day.
Thank you.
(You can find the link on my profile.)
- Click Follow to receive faster information every day.
- Check the results using the replay button on TradingView.
#BTC Price Analysis# #Altcoin Season# #Crypto# #BTC100K $BTC $USDT $XRP $ETH
BTCUSD 30Min Chart
*My analysis is optimized for TradingView.
If you press the replay button, you can check real-time movements.
-Long position strategy-
1) Regardless of whether the price touches the purple arrow marker (labeled "1")—where a vertical surge typically follows—
Enter a long position at the red arrow level ($83,484.4); set the stop-loss at the point where the green support line is breached.
2) Primary target for the long position is the $87,876.6 "Top" zone; the "Good" level serves as the secondary target.
If the strategy succeeds, the marked 86.8K zone can be used for re-entering a long position.
If the green support line is breached:
The price could slide down to the "Bottom" zone marked at the lower end—potentially extending as far as the "2" marker.
I post the analysis results as a Comment every day.
Thank you.
(You can find the link on my profile.)
- Click Follow to receive faster information every day.
- Check the results using the replay button on TradingView.
#BTC Price Analysis# #Altcoin Season# #Crypto# #BTC100K $BTC $USDT $XRP $ETH
62
·
--
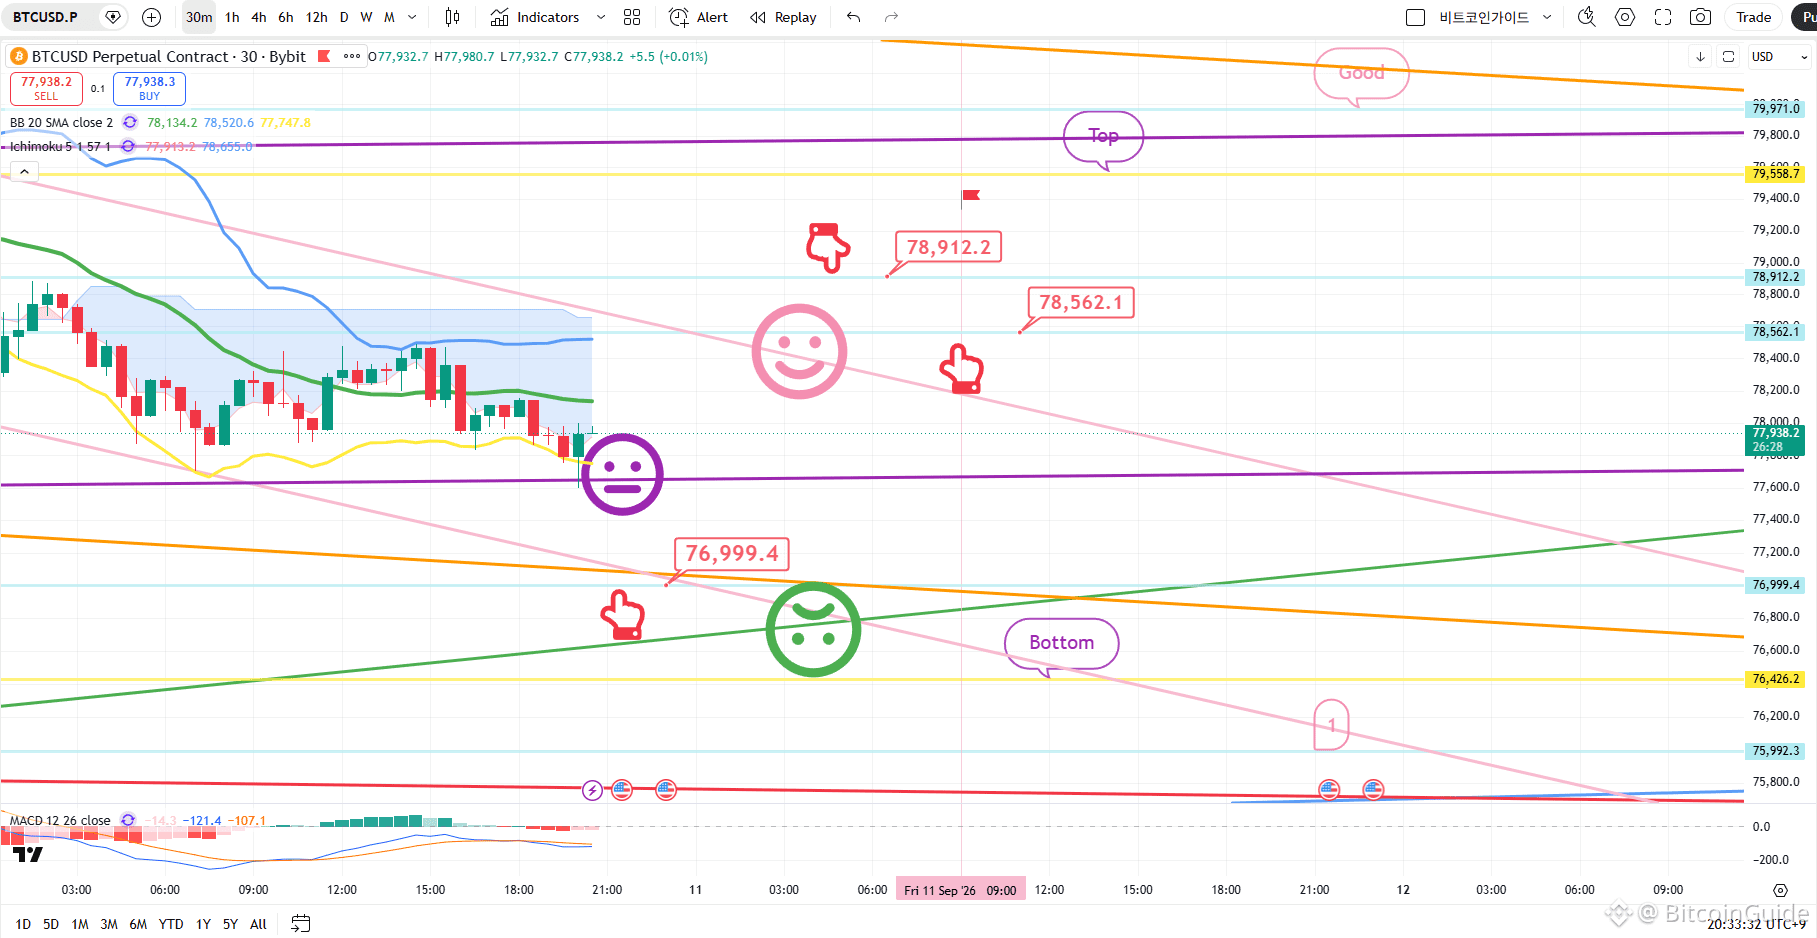
[September 10 Bitcoin chart analysis]
BTCUSD 30Min Chart
*My analysis is optimized for TradingView.
If you press the replay button, you can check real-time movements.
-Long position strategy-
*If the price follows the path indicated by the red arrow:
Long position strategy
1) Long entry zone: $76,999.4 / Stop-loss: If the price breaks below the green support line
2) Long position 1st target: $78,912.2 -> Subsequent targets: 'Top' and then 'Good'
- If the strategy succeeds, the $78.5K level (marked by the red arrow) can be used as a re-entry zone for long positions.
- If the price breaks below the green support line,
the rising channel will be invalidated, and it may take a long time for the price to rise again.
- Currently, the Nasdaq is showing a MACD "death cross" on the 12-hour chart,
so there is a high probability of sideways movement.
If the price holds above the purple support line, the market may close with an upward-drifting sideways trend.
If it breaks below the green support line, the price could drop toward the 'Bottom' level marked below
-> potentially extending down to the '1' zone.
I post the analysis results as a Comment every day.
Thank you.
(You can find the link on my profile.)
- Click Follow to receive faster information every day.
- Check the results using the replay button on TradingView.
#BTC Price Analysis# #Altcoin Season# #Crypto# $USDT $BTC $ETH
[September 10 Bitcoin chart analysis]
BTCUSD 30Min Chart
*My analysis is optimized for TradingView.
If you press the replay button, you can check real-time movements.
-Long position strategy-
*If the price follows the path indicated by the red arrow:
Long position strategy
1) Long entry zone: $76,999.4 / Stop-loss: If the price breaks below the green support line
2) Long position 1st target: $78,912.2 -> Subsequent targets: 'Top' and then 'Good'
- If the strategy succeeds, the $78.5K level (marked by the red arrow) can be used as a re-entry zone for long positions.
- If the price breaks below the green support line,
the rising channel will be invalidated, and it may take a long time for the price to rise again.
- Currently, the Nasdaq is showing a MACD "death cross" on the 12-hour chart,
so there is a high probability of sideways movement.
If the price holds above the purple support line, the market may close with an upward-drifting sideways trend.
If it breaks below the green support line, the price could drop toward the 'Bottom' level marked below
-> potentially extending down to the '1' zone.
I post the analysis results as a Comment every day.
Thank you.
(You can find the link on my profile.)
- Click Follow to receive faster information every day.
- Check the results using the replay button on TradingView.
#BTC Price Analysis# #Altcoin Season# #Crypto# $USDT $BTC $ETH
BTCUSD 30Min Chart
*My analysis is optimized for TradingView.
If you press the replay button, you can check real-time movements.
-Long position strategy-
*If the price follows the path indicated by the red arrow:
Long position strategy
1) Long entry zone: $76,999.4 / Stop-loss: If the price breaks below the green support line
2) Long position 1st target: $78,912.2 -> Subsequent targets: 'Top' and then 'Good'
- If the strategy succeeds, the $78.5K level (marked by the red arrow) can be used as a re-entry zone for long positions.
- If the price breaks below the green support line,
the rising channel will be invalidated, and it may take a long time for the price to rise again.
- Currently, the Nasdaq is showing a MACD "death cross" on the 12-hour chart,
so there is a high probability of sideways movement.
If the price holds above the purple support line, the market may close with an upward-drifting sideways trend.
If it breaks below the green support line, the price could drop toward the 'Bottom' level marked below
-> potentially extending down to the '1' zone.
I post the analysis results as a Comment every day.
Thank you.
(You can find the link on my profile.)
- Click Follow to receive faster information every day.
- Check the results using the replay button on TradingView.
#BTC Price Analysis# #Altcoin Season# #Crypto# $USDT $BTC $ETH
71
·
--
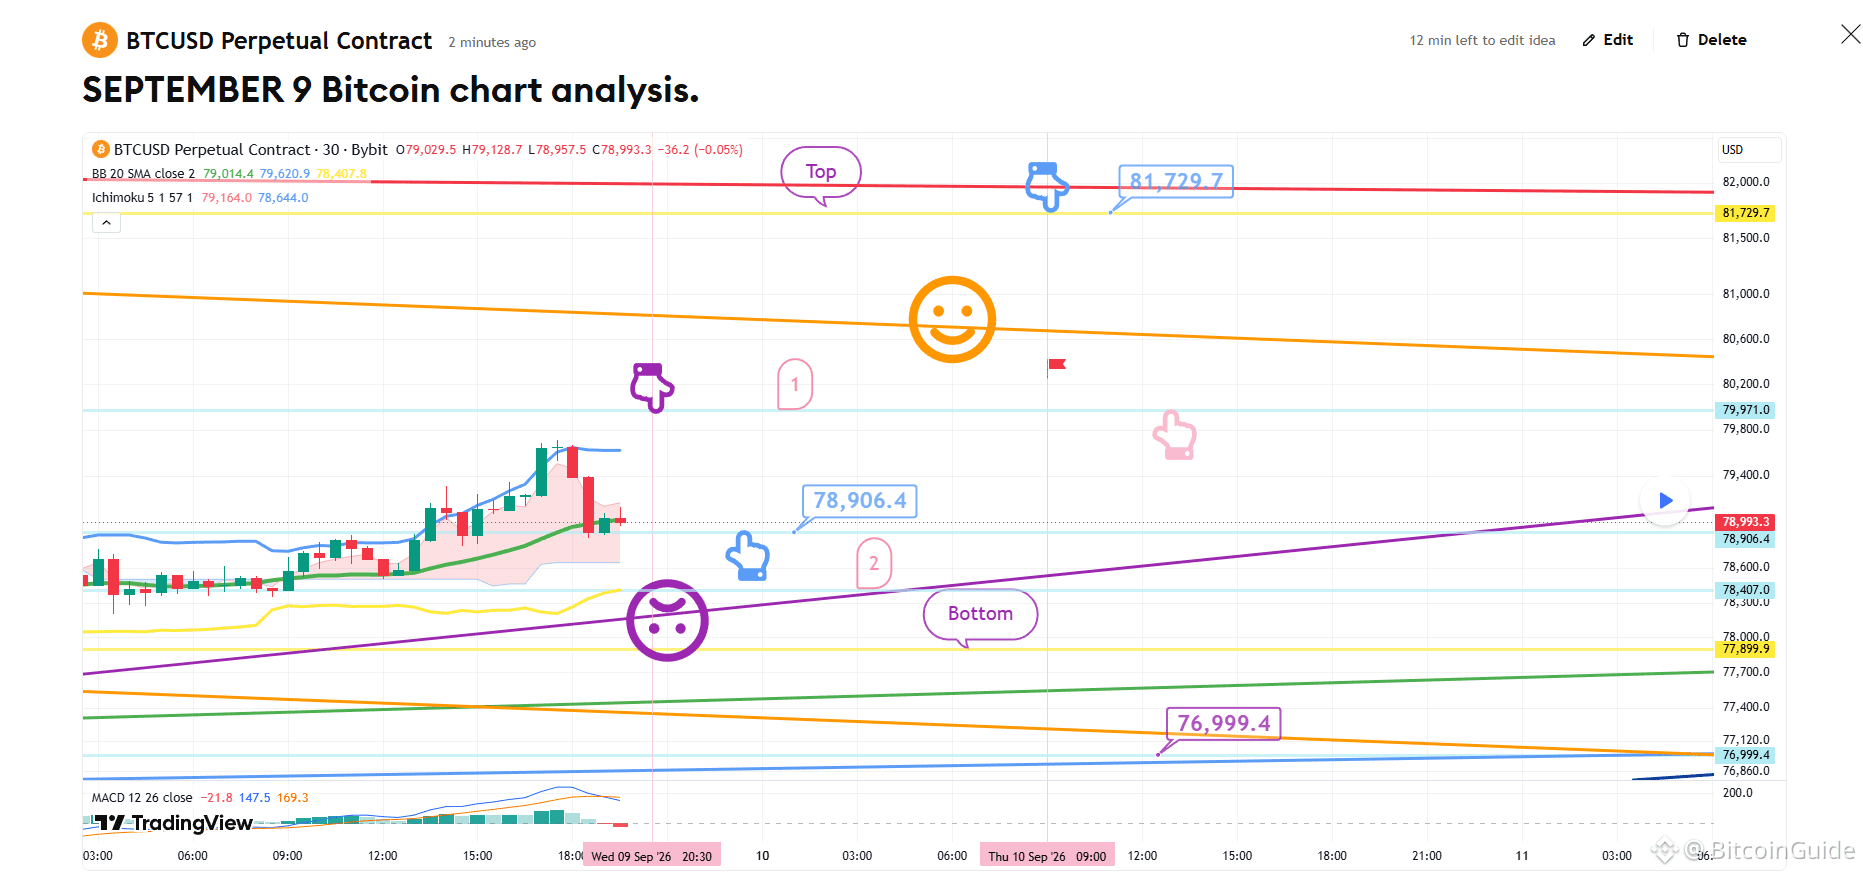
[September 9 Bitcoin chart analysis]
*My analysis is optimized for TradingView.
If you press the replay button, you can check real-time movements.
This is the Bitcoin 30-minute chart.
Since the overall medium-term pattern has broken down,
we may see significant volatility in both directions.
*A neutral strategy (trading both directions)
applied around the "Purple Finger 1" zone at the top:
1) After confirming a touch of the Purple Finger 1 zone at $79,791 (consider a short position),
look to enter a long position at the lower level marked by the light blue finger ($78,906.4).
/ Stop-loss if the purple support line is breached.
2) Switch to a short position at $81,729.7 / Stop-loss if the red resistance line is broken.
This also serves as the final zone to re-enter a long position.
3) If the price drops immediately without touching the 1 zone at the top,
the "Zone 2" level at $78.4K is the final waiting point for a long position.
The stop-loss condition (if the purple support line is breached) remains the same.
Once the purple support line is breached,
the price could drop to the "Bottom" level marked below—potentially as low as $76.9K—
so please exercise caution.
If the light blue support line at $76.9K is broken,
the medium-term bullish channel will be invalidated, which is unfavorable for long positions.
I post the analysis results as a Comment every day.
Thank you.
(You can find the link on my profile.)
- Click Follow to receive faster information every day.
- Check the results using the replay button on TradingView.
#Crypto# #BTC Price Analysis# #Altcoin Season# #BNBChain# #ㅠㅆ
[September 9 Bitcoin chart analysis]
*My analysis is optimized for TradingView.
If you press the replay button, you can check real-time movements.
This is the Bitcoin 30-minute chart.
Since the overall medium-term pattern has broken down,
we may see significant volatility in both directions.
*A neutral strategy (trading both directions)
applied around the "Purple Finger 1" zone at the top:
1) After confirming a touch of the Purple Finger 1 zone at $79,791 (consider a short position),
look to enter a long position at the lower level marked by the light blue finger ($78,906.4).
/ Stop-loss if the purple support line is breached.
2) Switch to a short position at $81,729.7 / Stop-loss if the red resistance line is broken.
This also serves as the final zone to re-enter a long position.
3) If the price drops immediately without touching the 1 zone at the top,
the "Zone 2" level at $78.4K is the final waiting point for a long position.
The stop-loss condition (if the purple support line is breached) remains the same.
Once the purple support line is breached,
the price could drop to the "Bottom" level marked below—potentially as low as $76.9K—
so please exercise caution.
If the light blue support line at $76.9K is broken,
the medium-term bullish channel will be invalidated, which is unfavorable for long positions.
I post the analysis results as a Comment every day.
Thank you.
(You can find the link on my profile.)
- Click Follow to receive faster information every day.
- Check the results using the replay button on TradingView.
#Crypto# #BTC Price Analysis# #Altcoin Season# #BNBChain# #ㅠㅆ
*My analysis is optimized for TradingView.
If you press the replay button, you can check real-time movements.
This is the Bitcoin 30-minute chart.
Since the overall medium-term pattern has broken down,
we may see significant volatility in both directions.
*A neutral strategy (trading both directions)
applied around the "Purple Finger 1" zone at the top:
1) After confirming a touch of the Purple Finger 1 zone at $79,791 (consider a short position),
look to enter a long position at the lower level marked by the light blue finger ($78,906.4).
/ Stop-loss if the purple support line is breached.
2) Switch to a short position at $81,729.7 / Stop-loss if the red resistance line is broken.
This also serves as the final zone to re-enter a long position.
3) If the price drops immediately without touching the 1 zone at the top,
the "Zone 2" level at $78.4K is the final waiting point for a long position.
The stop-loss condition (if the purple support line is breached) remains the same.
Once the purple support line is breached,
the price could drop to the "Bottom" level marked below—potentially as low as $76.9K—
so please exercise caution.
If the light blue support line at $76.9K is broken,
the medium-term bullish channel will be invalidated, which is unfavorable for long positions.
I post the analysis results as a Comment every day.
Thank you.
(You can find the link on my profile.)
- Click Follow to receive faster information every day.
- Check the results using the replay button on TradingView.
#Crypto# #BTC Price Analysis# #Altcoin Season# #BNBChain# #ㅠㅆ
56
·
--
[September 4 Bitcoin chart analysis]
BTCUSD 30Min Chart
*My analysis is optimized for TradingView.
If you press the replay button, you can check real-time movements.
-Long position strategy-
*If the price follows the path indicated by the red arrow:
Long position strategy
1) Long entry zone: $80,613.9 / Stop-loss: If the purple support line is breached
2) 1st target: $85,113.2 -> 2nd target: The "Good" zone (valid through the weekend)
If the strategy succeeds, the "Gap 8" zone can be used for re-entering a long position.
- The "Good" zone is the most critical resistance level this month.
A strong breakout above this zone could lead to a powerful continuation of the uptrend.
If the purple support line is breached,
please be aware that the price could drop to the "Bottom" level
or as low as "Zone 1" (marked at the bottom).
The MACD on the 2-hour chart is currently showing a "dead cross,"
so please keep in mind that the price might move sideways today when managing your trades.
Please treat this analysis as a reference only.
I post the analysis results as a Comment every day.
Thank you.
(You can find the link on my profile.)
- Click Follow to receive faster information every day.
- Check the results using the replay button on TradingView.
#BTC100K #Macro Insights# #Altcoin Season# #BTCCharts# $USDT $TRX $BTC $ETH
[September 4 Bitcoin chart analysis]
BTCUSD 30Min Chart
*My analysis is optimized for TradingView.
If you press the replay button, you can check real-time movements.
-Long position strategy-
*If the price follows the path indicated by the red arrow:
Long position strategy
1) Long entry zone: $80,613.9 / Stop-loss: If the purple support line is breached
2) 1st target: $85,113.2 -> 2nd target: The "Good" zone (valid through the weekend)
If the strategy succeeds, the "Gap 8" zone can be used for re-entering a long position.
- The "Good" zone is the most critical resistance level this month.
A strong breakout above this zone could lead to a powerful continuation of the uptrend.
If the purple support line is breached,
please be aware that the price could drop to the "Bottom" level
or as low as "Zone 1" (marked at the bottom).
The MACD on the 2-hour chart is currently showing a "dead cross,"
so please keep in mind that the price might move sideways today when managing your trades.
Please treat this analysis as a reference only.
I post the analysis results as a Comment every day.
Thank you.
(You can find the link on my profile.)
- Click Follow to receive faster information every day.
- Check the results using the replay button on TradingView.
#BTC100K #Macro Insights# #Altcoin Season# #BTCCharts# $USDT $TRX $BTC $ETH
BTCUSD 30Min Chart
*My analysis is optimized for TradingView.
If you press the replay button, you can check real-time movements.
-Long position strategy-
*If the price follows the path indicated by the red arrow:
Long position strategy
1) Long entry zone: $80,613.9 / Stop-loss: If the purple support line is breached
2) 1st target: $85,113.2 -> 2nd target: The "Good" zone (valid through the weekend)
If the strategy succeeds, the "Gap 8" zone can be used for re-entering a long position.
- The "Good" zone is the most critical resistance level this month.
A strong breakout above this zone could lead to a powerful continuation of the uptrend.
If the purple support line is breached,
please be aware that the price could drop to the "Bottom" level
or as low as "Zone 1" (marked at the bottom).
The MACD on the 2-hour chart is currently showing a "dead cross,"
so please keep in mind that the price might move sideways today when managing your trades.
Please treat this analysis as a reference only.
I post the analysis results as a Comment every day.
Thank you.
(You can find the link on my profile.)
- Click Follow to receive faster information every day.
- Check the results using the replay button on TradingView.
#BTC100K #Macro Insights# #Altcoin Season# #BTCCharts# $USDT $TRX $BTC $ETH
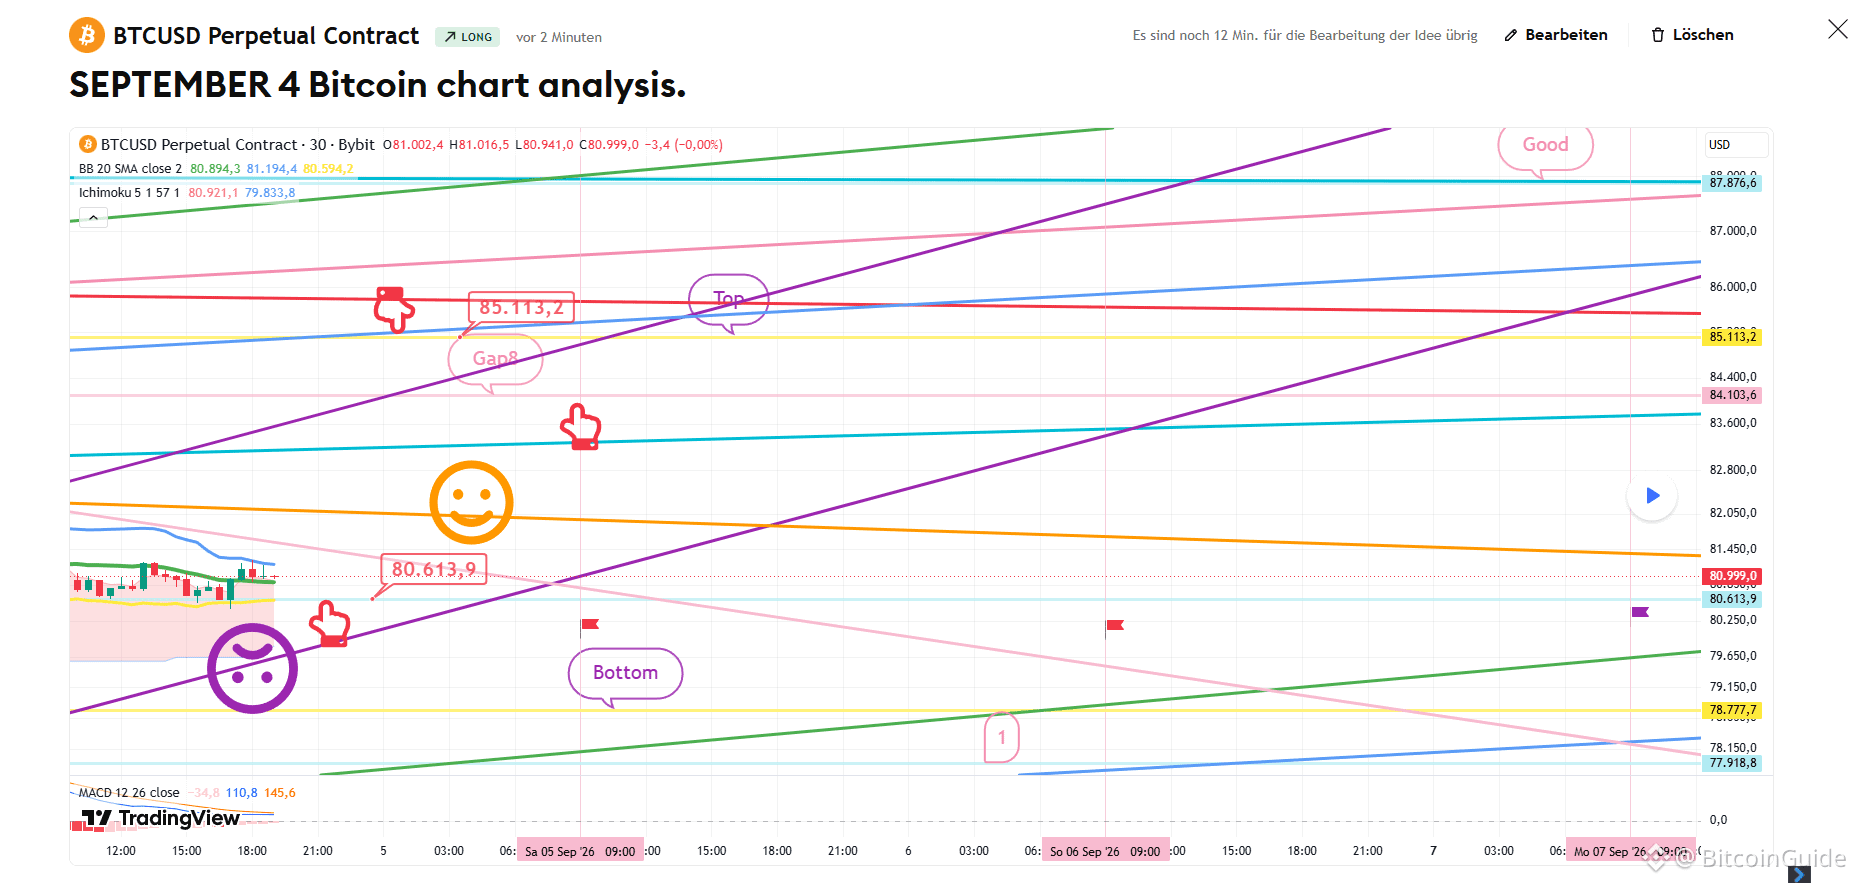
72
·
--
[SEPTEMBER 1 Bitcoin chart analysis]
BTCUSD 30Min Chart
*My analysis is optimized for TradingView.
If you press the replay button, you can check real-time movements.
-Long position strategy-
This is the Bitcoin 30-minute chart.
A MACD Dead Cross is currently in progress on the daily chart.
Caution is required as this position has the potential for a sharp decline.
I have developed a strategy based on a sideways market that maintains the channel.
*Long Position Strategy based on the movement path of the red finger
1) Entry point for the long position at $77,309.9 / Stop loss if the purple support line is broken
2) 1st target for the long position at $78,711 -> Target prices in the order of Top, Good
While the overall trend suggests the Bottom zone is likely,
I proceeded with the strategy based on the Nasdaq's movements.
If the Bottom is broken, the possibility of reaching Zone 1 remains open.
I post the analysis results as a Comment every day.
Thank you.
(You can find the link on my profile.)
- Click Follow to receive faster information every day.
- Check the results using the replay button on TradingView.
#BTC Price Analysis# #Altcoin Season# #BTC100K #XRP $ETH $USDT $BTC $GOLD
[SEPTEMBER 1 Bitcoin chart analysis]
BTCUSD 30Min Chart
*My analysis is optimized for TradingView.
If you press the replay button, you can check real-time movements.
-Long position strategy-
This is the Bitcoin 30-minute chart.
A MACD Dead Cross is currently in progress on the daily chart.
Caution is required as this position has the potential for a sharp decline.
I have developed a strategy based on a sideways market that maintains the channel.
*Long Position Strategy based on the movement path of the red finger
1) Entry point for the long position at $77,309.9 / Stop loss if the purple support line is broken
2) 1st target for the long position at $78,711 -> Target prices in the order of Top, Good
While the overall trend suggests the Bottom zone is likely,
I proceeded with the strategy based on the Nasdaq's movements.
If the Bottom is broken, the possibility of reaching Zone 1 remains open.
I post the analysis results as a Comment every day.
Thank you.
(You can find the link on my profile.)
- Click Follow to receive faster information every day.
- Check the results using the replay button on TradingView.
#BTC Price Analysis# #Altcoin Season# #BTC100K #XRP $ETH $USDT $BTC $GOLD
BTCUSD 30Min Chart
*My analysis is optimized for TradingView.
If you press the replay button, you can check real-time movements.
-Long position strategy-
This is the Bitcoin 30-minute chart.
A MACD Dead Cross is currently in progress on the daily chart.
Caution is required as this position has the potential for a sharp decline.
I have developed a strategy based on a sideways market that maintains the channel.
*Long Position Strategy based on the movement path of the red finger
1) Entry point for the long position at $77,309.9 / Stop loss if the purple support line is broken
2) 1st target for the long position at $78,711 -> Target prices in the order of Top, Good
While the overall trend suggests the Bottom zone is likely,
I proceeded with the strategy based on the Nasdaq's movements.
If the Bottom is broken, the possibility of reaching Zone 1 remains open.
I post the analysis results as a Comment every day.
Thank you.
(You can find the link on my profile.)
- Click Follow to receive faster information every day.
- Check the results using the replay button on TradingView.
#BTC Price Analysis# #Altcoin Season# #BTC100K #XRP $ETH $USDT $BTC $GOLD
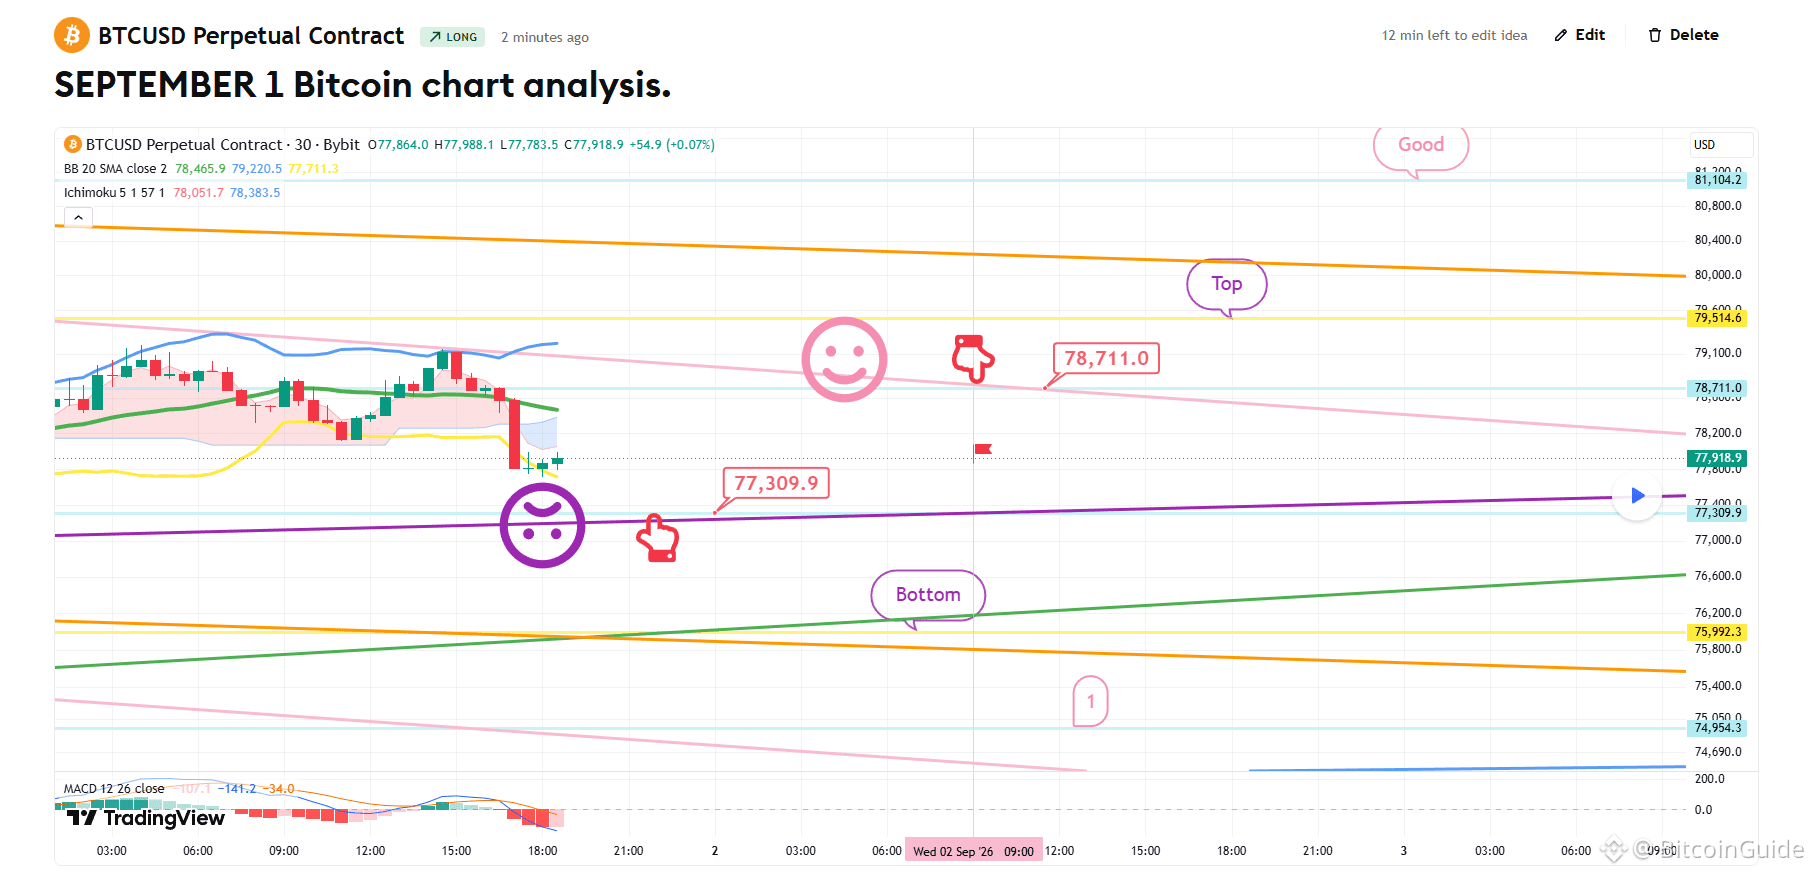
81
·
--
[August 26 Bitcoin chart analysis]
BTCUSD 30Min Chart
*My analysis is optimized for TradingView.
If you press the replay button, you can check real-time movements.
-On the left, marked by the purple finger, I have connected the strategy exactly as it was at the entry point of the long position entered on the 25th, 79.2K.
A MACD Dead Cross is currently in progress on the 12-hour chart.
*Based on the movement path of the light blue finger:
Short -> Long -> Short Two-way Neutral Strategy
1) Short position entry point at $79,757.5 / Stop loss upon breakout of the orange resistance line
2) Switch to long position at $78,950.7 / Stop loss upon breakout of the purple support line
(Same stop loss applies to those maintaining the long position at 79.2K)
3) Switch to short position at $80,972 / Stop loss upon breakout of the red resistance line
This is the zone to utilize for re-entering the long position at 79.7K from tomorrow onwards.
- If the price reaches the "Good" zone today,
you do not need to operate a short position,
and there is a very high possibility of sideways movement today.
Please exercise caution, as a break below the purple support line could lead to a decline to the bottom -> up to Zone 1.
I post the analysis results as a Comment every day.
Thank you.
(You can find the link on my profile.)
- Click Follow to receive faster information every day.
- Check the results using the replay button on TradingView.
#BTC100K #Altcoin Season# #ETH #BTC Price Analysis# $CRYPTO $GOLD $XRP $BTC
[August 26 Bitcoin chart analysis]
BTCUSD 30Min Chart
*My analysis is optimized for TradingView.
If you press the replay button, you can check real-time movements.
-On the left, marked by the purple finger, I have connected the strategy exactly as it was at the entry point of the long position entered on the 25th, 79.2K.
A MACD Dead Cross is currently in progress on the 12-hour chart.
*Based on the movement path of the light blue finger:
Short -> Long -> Short Two-way Neutral Strategy
1) Short position entry point at $79,757.5 / Stop loss upon breakout of the orange resistance line
2) Switch to long position at $78,950.7 / Stop loss upon breakout of the purple support line
(Same stop loss applies to those maintaining the long position at 79.2K)
3) Switch to short position at $80,972 / Stop loss upon breakout of the red resistance line
This is the zone to utilize for re-entering the long position at 79.7K from tomorrow onwards.
- If the price reaches the "Good" zone today,
you do not need to operate a short position,
and there is a very high possibility of sideways movement today.
Please exercise caution, as a break below the purple support line could lead to a decline to the bottom -> up to Zone 1.
I post the analysis results as a Comment every day.
Thank you.
(You can find the link on my profile.)
- Click Follow to receive faster information every day.
- Check the results using the replay button on TradingView.
#BTC100K #Altcoin Season# #ETH #BTC Price Analysis# $CRYPTO $GOLD $XRP $BTC
BTCUSD 30Min Chart
*My analysis is optimized for TradingView.
If you press the replay button, you can check real-time movements.
-On the left, marked by the purple finger, I have connected the strategy exactly as it was at the entry point of the long position entered on the 25th, 79.2K.
A MACD Dead Cross is currently in progress on the 12-hour chart.
*Based on the movement path of the light blue finger:
Short -> Long -> Short Two-way Neutral Strategy
1) Short position entry point at $79,757.5 / Stop loss upon breakout of the orange resistance line
2) Switch to long position at $78,950.7 / Stop loss upon breakout of the purple support line
(Same stop loss applies to those maintaining the long position at 79.2K)
3) Switch to short position at $80,972 / Stop loss upon breakout of the red resistance line
This is the zone to utilize for re-entering the long position at 79.7K from tomorrow onwards.
- If the price reaches the "Good" zone today,
you do not need to operate a short position,
and there is a very high possibility of sideways movement today.
Please exercise caution, as a break below the purple support line could lead to a decline to the bottom -> up to Zone 1.
I post the analysis results as a Comment every day.
Thank you.
(You can find the link on my profile.)
- Click Follow to receive faster information every day.
- Check the results using the replay button on TradingView.
#BTC100K #Altcoin Season# #ETH #BTC Price Analysis# $CRYPTO $GOLD $XRP $BTC
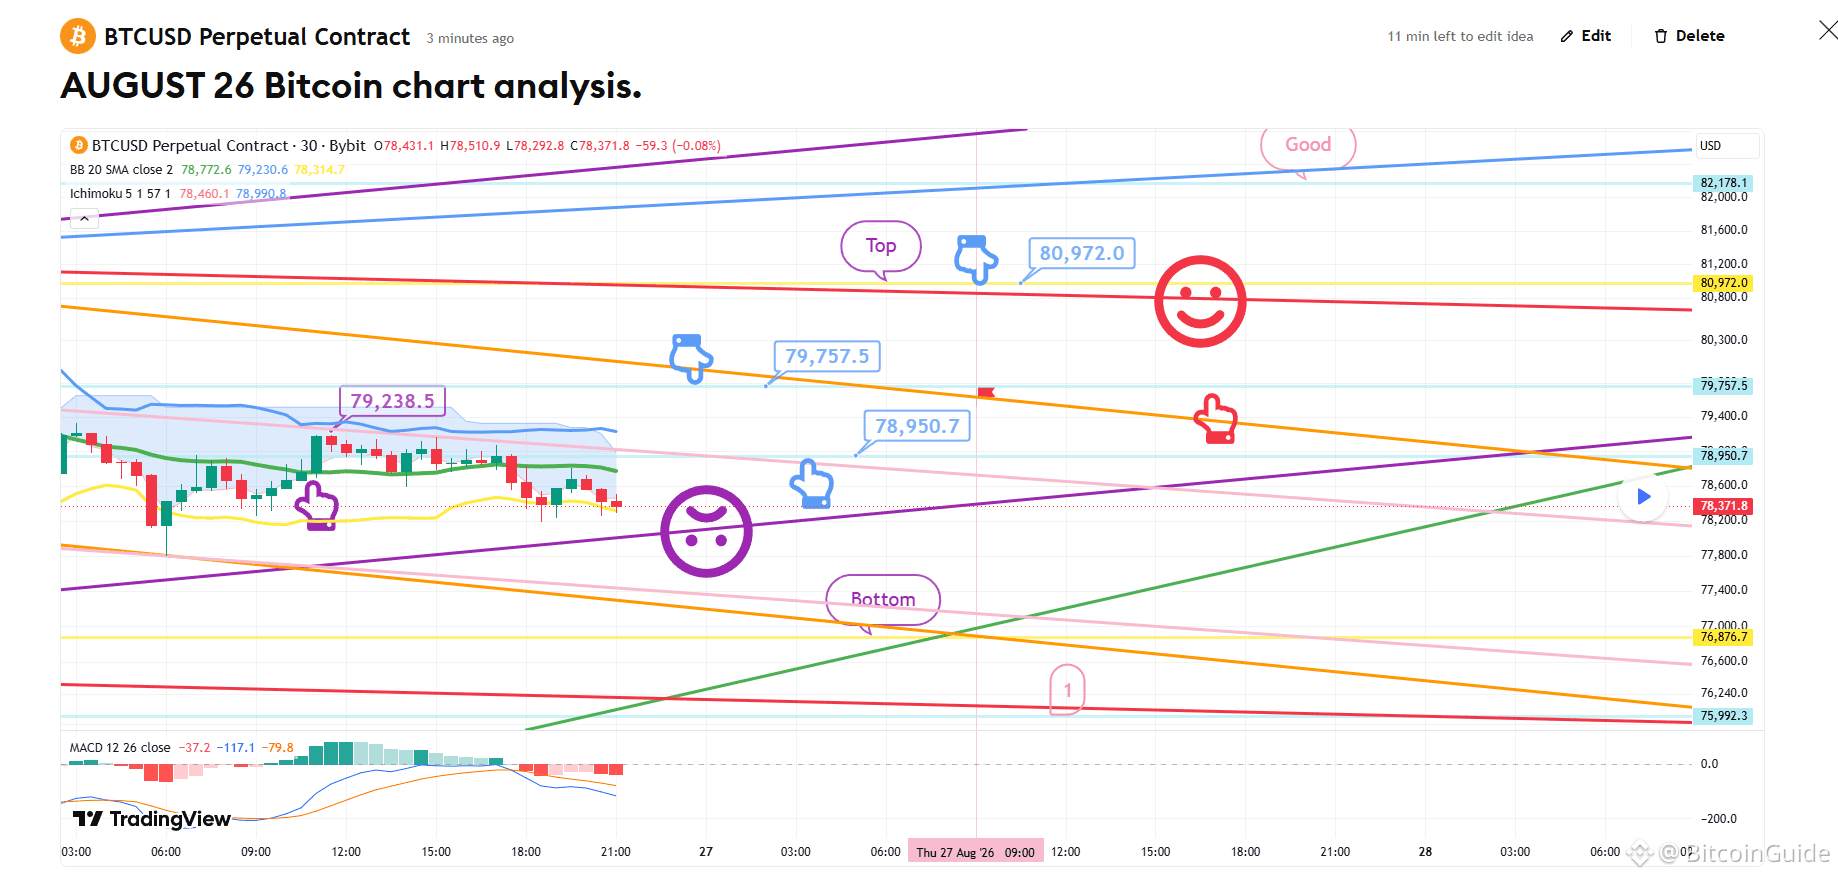
71
·
--
[August 25 Bitcoin chart analysis]
BTCUSD 30Min Chart
*My analysis is optimized for TradingView.
If you press the replay button, you can check real-time movements.
-Long position strategy-
This is the Bitcoin 30-minute chart.
There is a Nasdaq indicator release at 11:00.
*Long Position Strategy based on the movement path of the red finger
1) Buy at $79,238.5 / Stop loss if broken below the purple support line
2) 1st target for the long position at the $82,178.1 Top zone -> Target prices in order of Gap 8 and Good
- If broken below the purple support line
Please be careful as the price could fall to the Bottom zone indicated at the bottom -> up to zone 1.
I post the analysis results as a Comment every day.
Thank you.
(You can find the link on my profile.)
- Click Follow to receive faster information every day.
- Check the results using the replay button on TradingView.
#BTC Price Analysis# #Altcoin Season# #Bitcoin #Crypto# $XRP $ETH $BTC $USDT
[August 25 Bitcoin chart analysis]
BTCUSD 30Min Chart
*My analysis is optimized for TradingView.
If you press the replay button, you can check real-time movements.
-Long position strategy-
This is the Bitcoin 30-minute chart.
There is a Nasdaq indicator release at 11:00.
*Long Position Strategy based on the movement path of the red finger
1) Buy at $79,238.5 / Stop loss if broken below the purple support line
2) 1st target for the long position at the $82,178.1 Top zone -> Target prices in order of Gap 8 and Good
- If broken below the purple support line
Please be careful as the price could fall to the Bottom zone indicated at the bottom -> up to zone 1.
I post the analysis results as a Comment every day.
Thank you.
(You can find the link on my profile.)
- Click Follow to receive faster information every day.
- Check the results using the replay button on TradingView.
#BTC Price Analysis# #Altcoin Season# #Bitcoin #Crypto# $XRP $ETH $BTC $USDT
BTCUSD 30Min Chart
*My analysis is optimized for TradingView.
If you press the replay button, you can check real-time movements.
-Long position strategy-
This is the Bitcoin 30-minute chart.
There is a Nasdaq indicator release at 11:00.
*Long Position Strategy based on the movement path of the red finger
1) Buy at $79,238.5 / Stop loss if broken below the purple support line
2) 1st target for the long position at the $82,178.1 Top zone -> Target prices in order of Gap 8 and Good
- If broken below the purple support line
Please be careful as the price could fall to the Bottom zone indicated at the bottom -> up to zone 1.
I post the analysis results as a Comment every day.
Thank you.
(You can find the link on my profile.)
- Click Follow to receive faster information every day.
- Check the results using the replay button on TradingView.
#BTC Price Analysis# #Altcoin Season# #Bitcoin #Crypto# $XRP $ETH $BTC $USDT
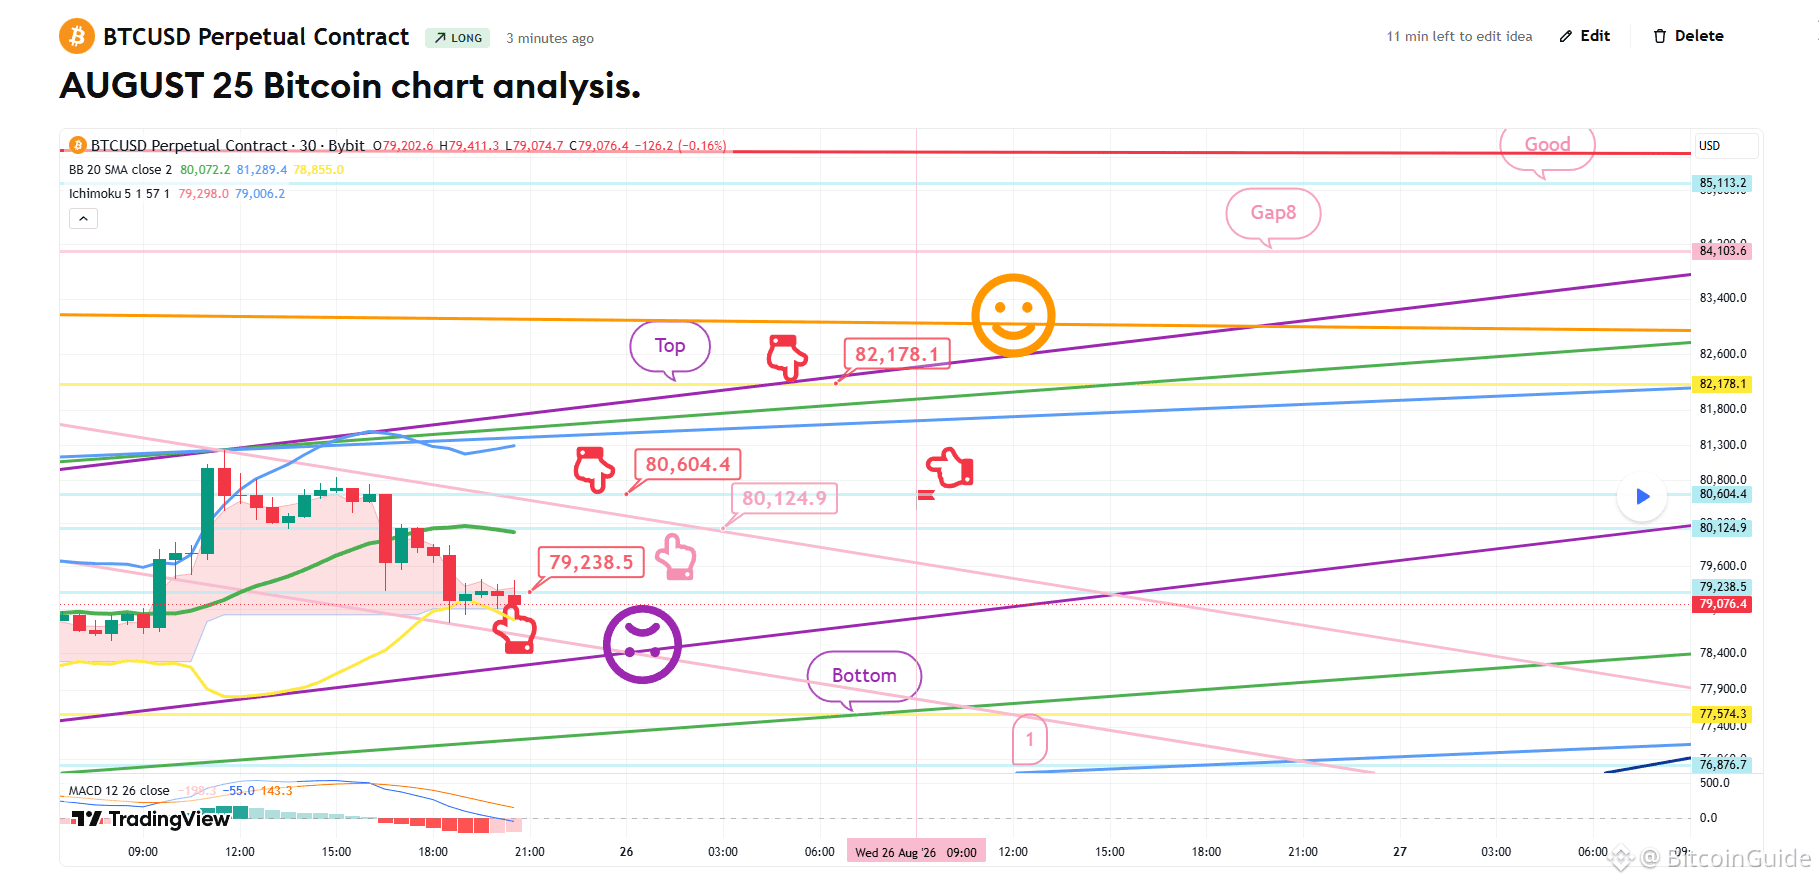
95
Log in to explore more content
Join global crypto users on Binance Square
⚡️ Get latest and useful information about crypto.
💬 Trusted by the world’s largest crypto exchange.
👍 Discover real insights from verified creators.
Email / Phone number
Trending Topics
JobsReportRaisesHikeOdds
6,321 views
224 Discussing
TradFi News | US Adds 165,000 Jobs in October, More Than Double the 65,000 Forecast, as Unemployment Falls to 4.1%
Binance News
·10 Likes
·5.9k views
US Data Center Rules May Constrain AI Expansion
1,220 views
37 Discussing
CanUSStocksReboundAfterNonfarmPayrolls?
16,997 views
472 Discussing