
abhi__web3
413 Posts

abhi__web3
Report
Block User
crypto expart | Insight signals
Open Trade
Frequent Trader
1.9 Years
44 Following
52 Followers
413 Liked
Posts
Portfolio
All
Videos
·
--
Bullish
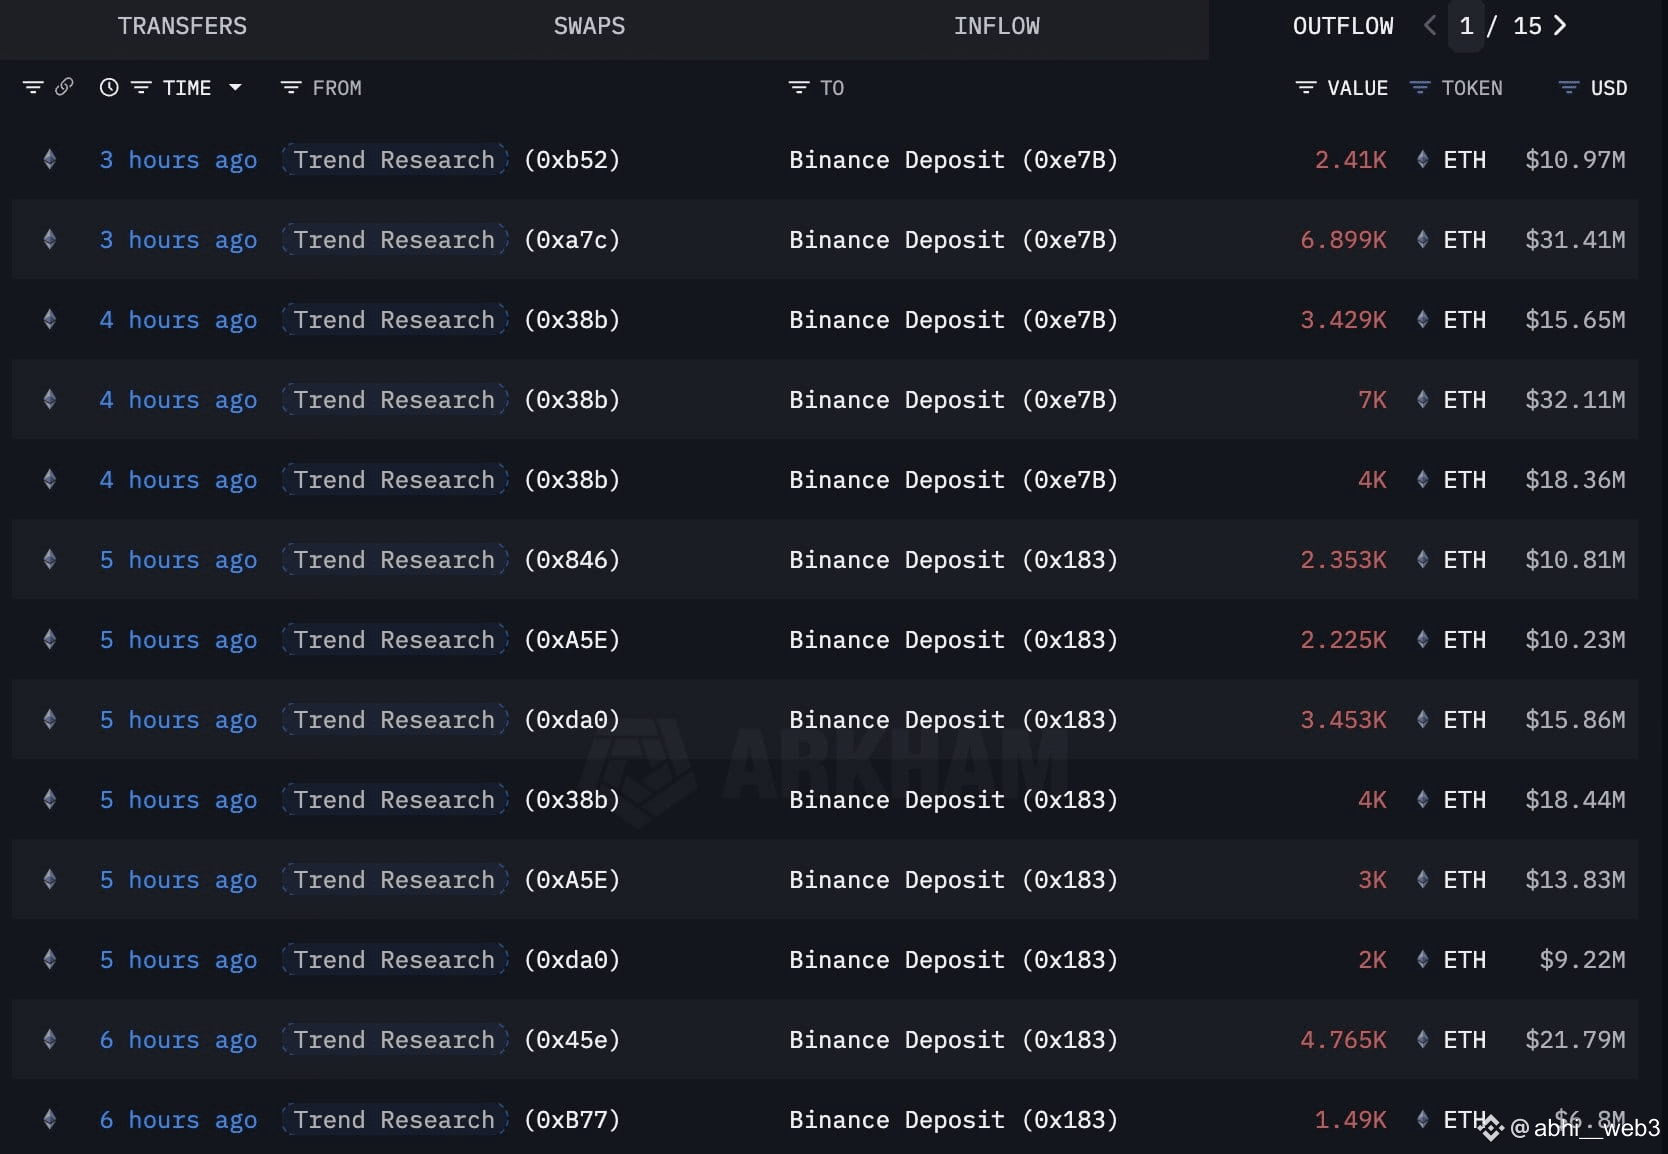
Trend Research deposited another 77,491 $ETH($354.5M) into #Binance for sale in the past 10 hours.
Over the past 4 days, they have deposited 143,124 $ETH($642M) into #Binance .
$ETH
{spot}(ETHUSDT)
Trend Research deposited another 77,491 $ETH ($354.5M) into #Binance for sale in the past 10 hours.
Over the past 4 days, they have deposited 143,124 $ETH ($642M) into #Binance .
$ETH
Over the past 4 days, they have deposited 143,124 $ETH ($642M) into #Binance .
$ETH
1
4
·
--
Bullish
$LUNC /USDT
{spot}(LUNCUSDT)
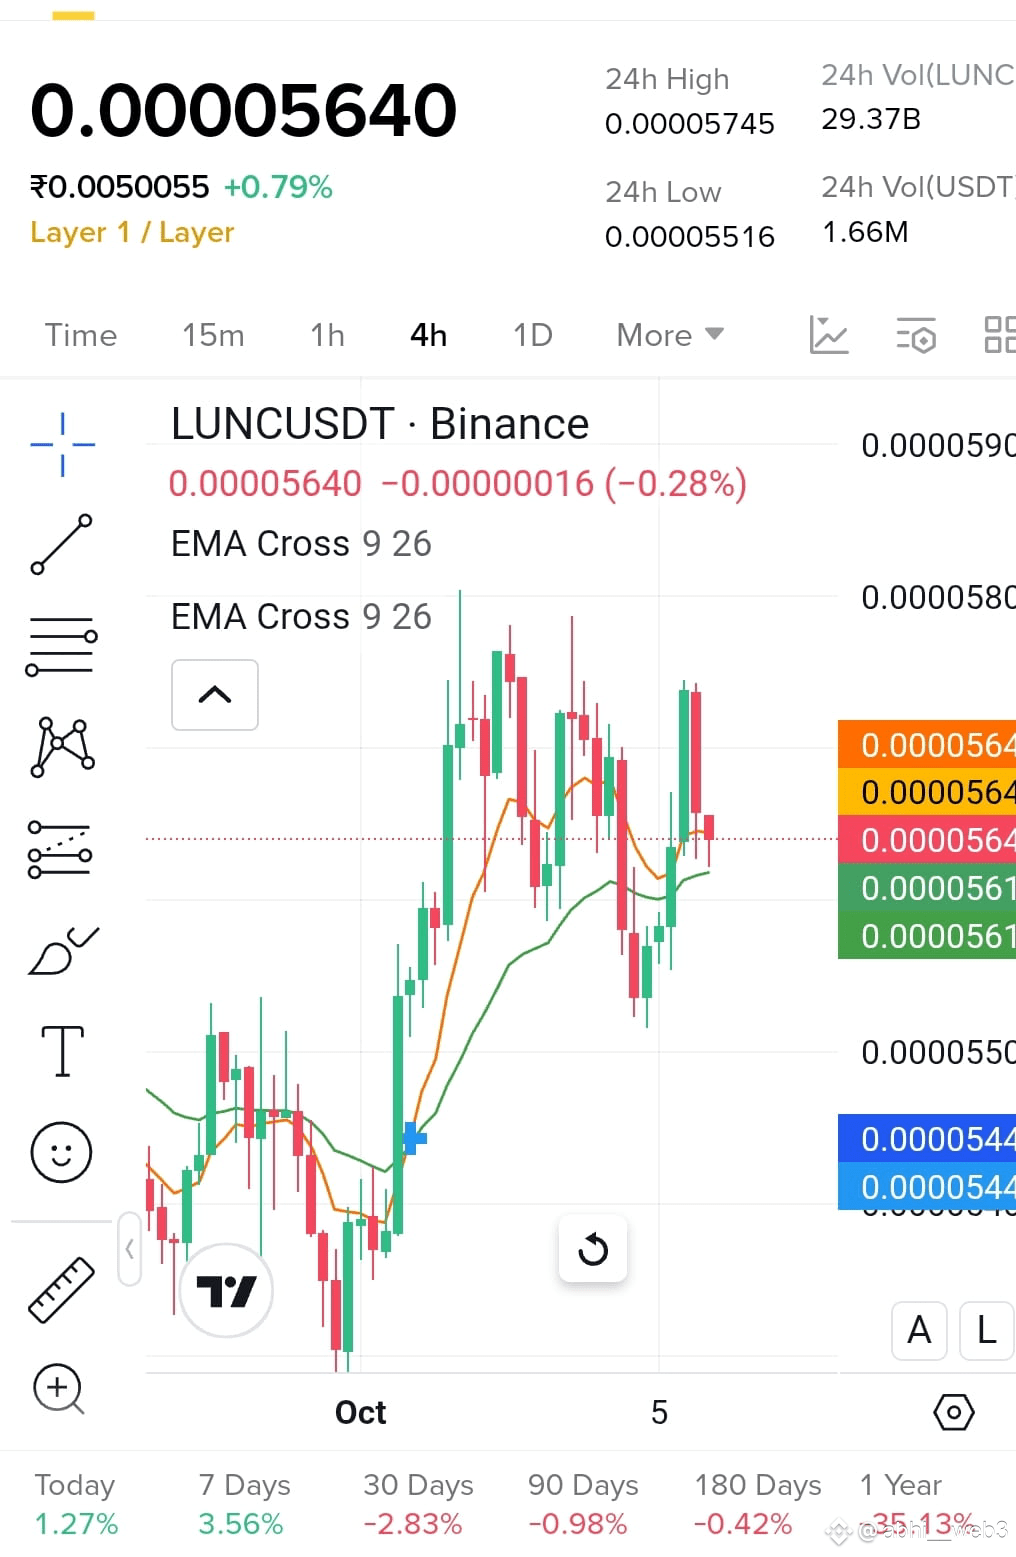
0.00005640. To analyze this and provide a long trade signal, let's break down the key elements visible in the image.
Key Elements
- *Current Price*: 0.00005640
- *EMA Cross 9 26*: This indicator is used to identify trends and potential buy or sell signals.
Analysis
The graph shows a fluctuating trend with red and green bars indicating price movements. The EMA Cross 9 26 indicator suggests a potential trend reversal or continuation.
Long Trade Signal
To determine a long trade signal, we need to consider the following factors ¹:
- *Trend*: The overall trend appears to be slightly bullish, given the recent price movements.
- *Indicators*: The EMA Cross 9 26 indicator is suggesting a potential buy signal.
$LUNC /USDT
0.00005640. To analyze this and provide a long trade signal, let's break down the key elements visible in the image.
Key Elements
- *Current Price*: 0.00005640
- *EMA Cross 9 26*: This indicator is used to identify trends and potential buy or sell signals.
Analysis
The graph shows a fluctuating trend with red and green bars indicating price movements. The EMA Cross 9 26 indicator suggests a potential trend reversal or continuation.
Long Trade Signal
To determine a long trade signal, we need to consider the following factors ¹:
- *Trend*: The overall trend appears to be slightly bullish, given the recent price movements.
- *Indicators*: The EMA Cross 9 26 indicator is suggesting a potential buy signal.
0.00005640. To analyze this and provide a long trade signal, let's break down the key elements visible in the image.
Key Elements
- *Current Price*: 0.00005640
- *EMA Cross 9 26*: This indicator is used to identify trends and potential buy or sell signals.
Analysis
The graph shows a fluctuating trend with red and green bars indicating price movements. The EMA Cross 9 26 indicator suggests a potential trend reversal or continuation.
Long Trade Signal
To determine a long trade signal, we need to consider the following factors ¹:
- *Trend*: The overall trend appears to be slightly bullish, given the recent price movements.
- *Indicators*: The EMA Cross 9 26 indicator is suggesting a potential buy signal.
6
364
·
--
Bullish
$DUSK /USDT
{spot}(DUSKUSDT)
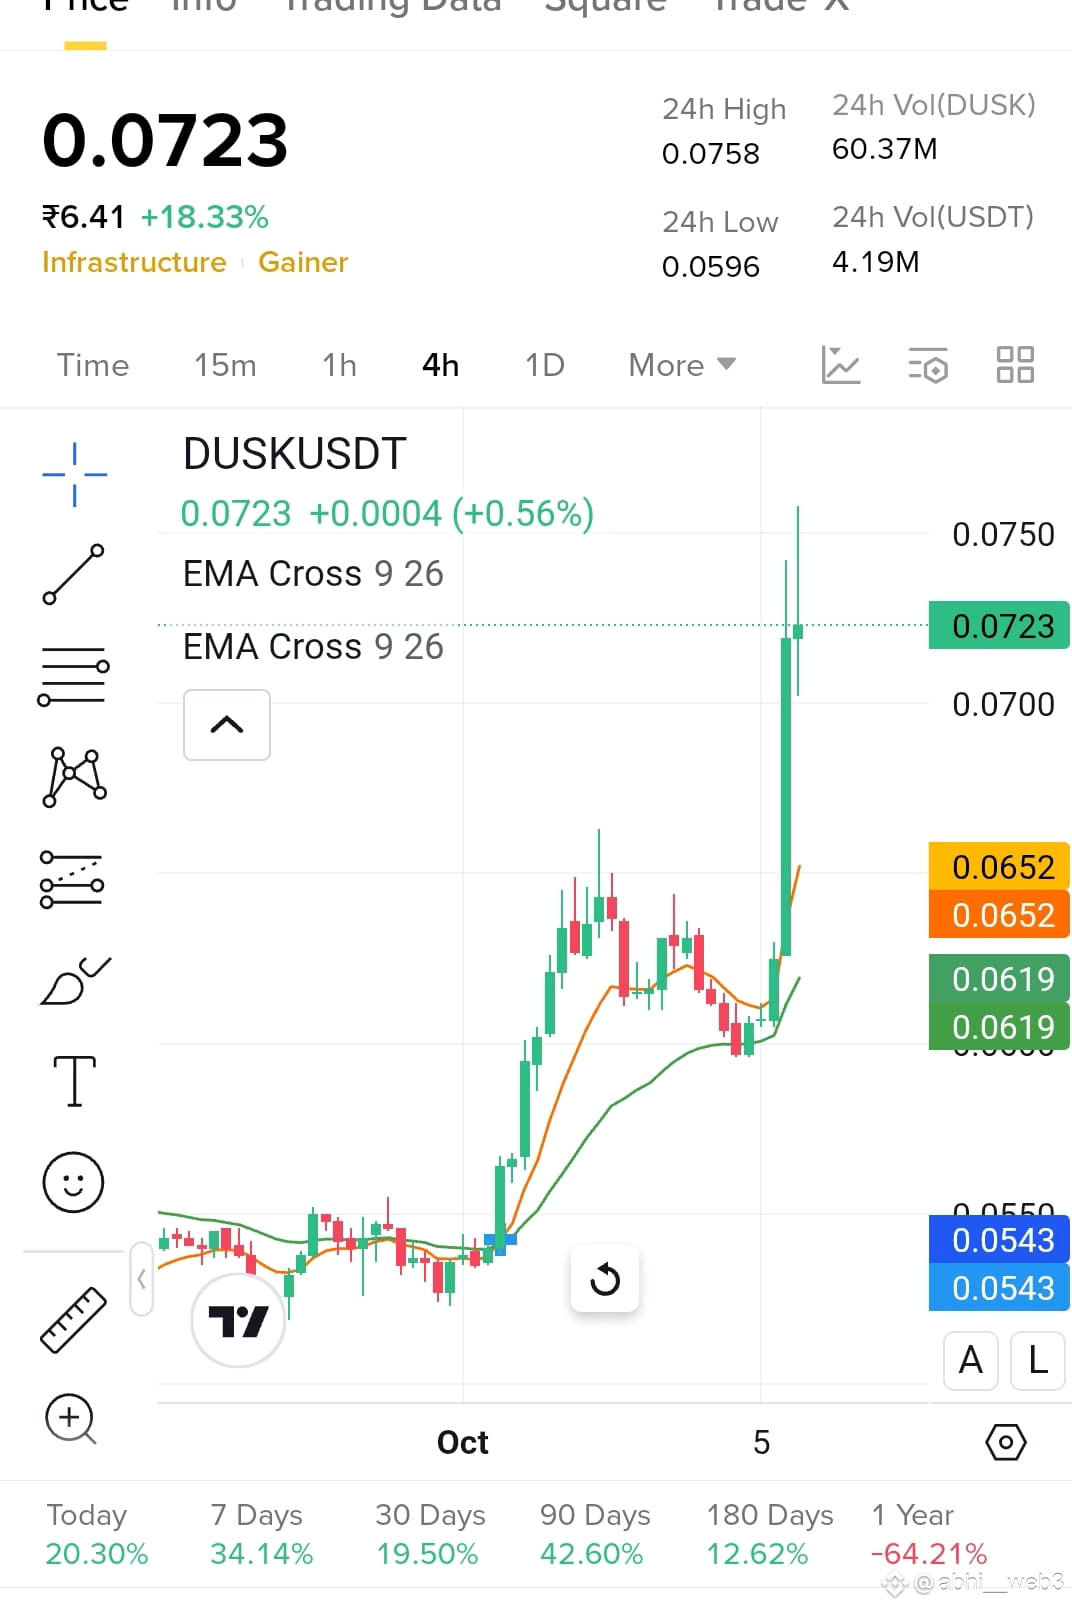
chart shows a significant increase in price over the past day, with a sharp spike in the last 24 hours, currently trading at $0.0723. Here's a breakdown of the analysis and potential long trade signal:
Technical Analysis
The chart indicates a bullish trend, with the price breaking above the EMA89 resistance. The DUSKUSDT pair is also nearing a breakout from the descending trendline, which could lead to a strong rally towards $0.15.
Potential Long Trade Signal
- *Entry*: $0.0723
- *Target*: $0.0825, $0.1040, or $0.1185
- *Stop Loss*: $0.0685
Additional Insights
- The Relative Strength Index (RSI) and other oscillators are not available, but the overall technical rating is "strong buy".
$DUSK /USDT
chart shows a significant increase in price over the past day, with a sharp spike in the last 24 hours, currently trading at $0.0723. Here's a breakdown of the analysis and potential long trade signal:
Technical Analysis
The chart indicates a bullish trend, with the price breaking above the EMA89 resistance. The DUSKUSDT pair is also nearing a breakout from the descending trendline, which could lead to a strong rally towards $0.15.
Potential Long Trade Signal
- *Entry*: $0.0723
- *Target*: $0.0825, $0.1040, or $0.1185
- *Stop Loss*: $0.0685
Additional Insights
- The Relative Strength Index (RSI) and other oscillators are not available, but the overall technical rating is "strong buy".
chart shows a significant increase in price over the past day, with a sharp spike in the last 24 hours, currently trading at $0.0723. Here's a breakdown of the analysis and potential long trade signal:
Technical Analysis
The chart indicates a bullish trend, with the price breaking above the EMA89 resistance. The DUSKUSDT pair is also nearing a breakout from the descending trendline, which could lead to a strong rally towards $0.15.
Potential Long Trade Signal
- *Entry*: $0.0723
- *Target*: $0.0825, $0.1040, or $0.1185
- *Stop Loss*: $0.0685
Additional Insights
- The Relative Strength Index (RSI) and other oscillators are not available, but the overall technical rating is "strong buy".
1
101
·
--
Bullish
$OPEN /USDT
{spot}(OPENUSDT)
Analysis and Long Trade Signal
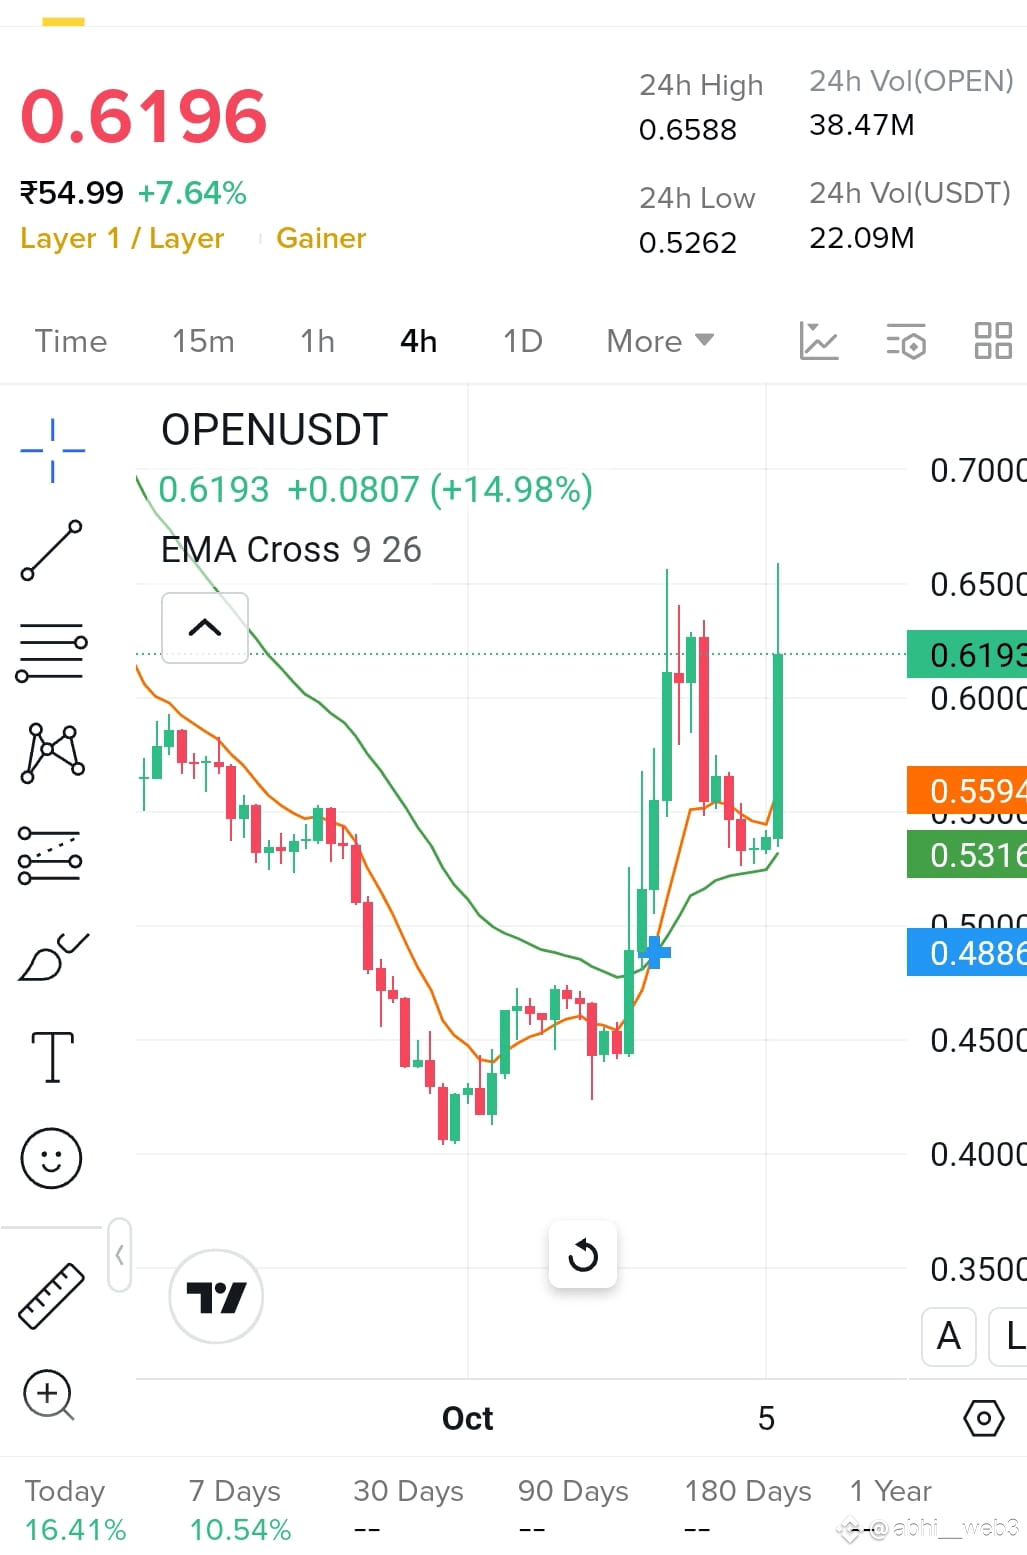
The current price of OPENUSDT is 0.6193 USDT, with a 14.98% increase. The chart shows a bullish trend, with the price above both EMAs (9 and 26).
- *Bullish Trend*: The EMA(9) is above EMA(26), indicating a potential continuation of the upward movement.
- *Support and Resistance*: The recent low is around 0.5262 USDT, and the current price is above it, showing a strong support level.
- *Volume*: The 24-hour volume is 38.47M OPEN, indicating significant trading activity.
Long Trade Signal:
- *Entry Zone*: 0.640-0.650USDT
- *Stop Loss*: 0.610 USDT
- *Take Profit*: 0.720 USDT
Additional Insights:
- The OPENUSDT price has increased by 164.45% over the last month, showing a strong upward trend.
$OPEN /USDT
Analysis and Long Trade Signal
The current price of OPENUSDT is 0.6193 USDT, with a 14.98% increase. The chart shows a bullish trend, with the price above both EMAs (9 and 26).
- *Bullish Trend*: The EMA(9) is above EMA(26), indicating a potential continuation of the upward movement.
- *Support and Resistance*: The recent low is around 0.5262 USDT, and the current price is above it, showing a strong support level.
- *Volume*: The 24-hour volume is 38.47M OPEN, indicating significant trading activity.
Long Trade Signal:
- *Entry Zone*: 0.640-0.650USDT
- *Stop Loss*: 0.610 USDT
- *Take Profit*: 0.720 USDT
Additional Insights:
- The OPENUSDT price has increased by 164.45% over the last month, showing a strong upward trend.
Analysis and Long Trade Signal
The current price of OPENUSDT is 0.6193 USDT, with a 14.98% increase. The chart shows a bullish trend, with the price above both EMAs (9 and 26).
- *Bullish Trend*: The EMA(9) is above EMA(26), indicating a potential continuation of the upward movement.
- *Support and Resistance*: The recent low is around 0.5262 USDT, and the current price is above it, showing a strong support level.
- *Volume*: The 24-hour volume is 38.47M OPEN, indicating significant trading activity.
Long Trade Signal:
- *Entry Zone*: 0.640-0.650USDT
- *Stop Loss*: 0.610 USDT
- *Take Profit*: 0.720 USDT
Additional Insights:
- The OPENUSDT price has increased by 164.45% over the last month, showing a strong upward trend.
2
365
·
--
Bullish
NEW: 🇺🇸 Publicly traded BitMine Immersion buys 233,877 $ETH worth 935.1 million over the past few days.$ETH
{spot}(ETHUSDT)
NEW: 🇺🇸 Publicly traded BitMine Immersion buys 233,877 $ETH worth 935.1 million over the past few days.$ETH


1
44
·
--
Bullish
Market Heating Up!
MNT/USDT → +6.5% 🚀 breakout continuation
BNB/USDT → +3.25% to $968, eyeing $1K 🔥
DOGE/USDT → +4.45% to $0.23 🐶 meme power returns
LINK/USDT → +4.95% to $21.11 📡 oracle demand rising
🔎 Top Bullish Momentum Scans:
👉 $SOL / $MNT / $PIXEL / $ORDER
"Momentum is alive across majors & alts. BNB charging toward 1K, DOGE barking back, and LINK surging. SOL, MNT, PIXEL & ORDER stand out as today’s long radar plays." 🚀
{spot}(SOLUSDT)
{spot}(PIXELUSDT)
Market Heating Up!
MNT/USDT → +6.5% 🚀 breakout continuation
BNB/USDT → +3.25% to $968, eyeing $1K 🔥
DOGE/USDT → +4.45% to $0.23 🐶 meme power returns
LINK/USDT → +4.95% to $21.11 📡 oracle demand rising
🔎 Top Bullish Momentum Scans:
👉 $SOL / $MNT / $PIXEL / $ORDER
"Momentum is alive across majors & alts. BNB charging toward 1K, DOGE barking back, and LINK surging. SOL, MNT, PIXEL & ORDER stand out as today’s long radar plays." 🚀
MNT/USDT → +6.5% 🚀 breakout continuation
BNB/USDT → +3.25% to $968, eyeing $1K 🔥
DOGE/USDT → +4.45% to $0.23 🐶 meme power returns
LINK/USDT → +4.95% to $21.11 📡 oracle demand rising
🔎 Top Bullish Momentum Scans:
👉 $SOL / $MNT / $PIXEL / $ORDER
"Momentum is alive across majors & alts. BNB charging toward 1K, DOGE barking back, and LINK surging. SOL, MNT, PIXEL & ORDER stand out as today’s long radar plays." 🚀

1
1
1
569
·
--
Bullish
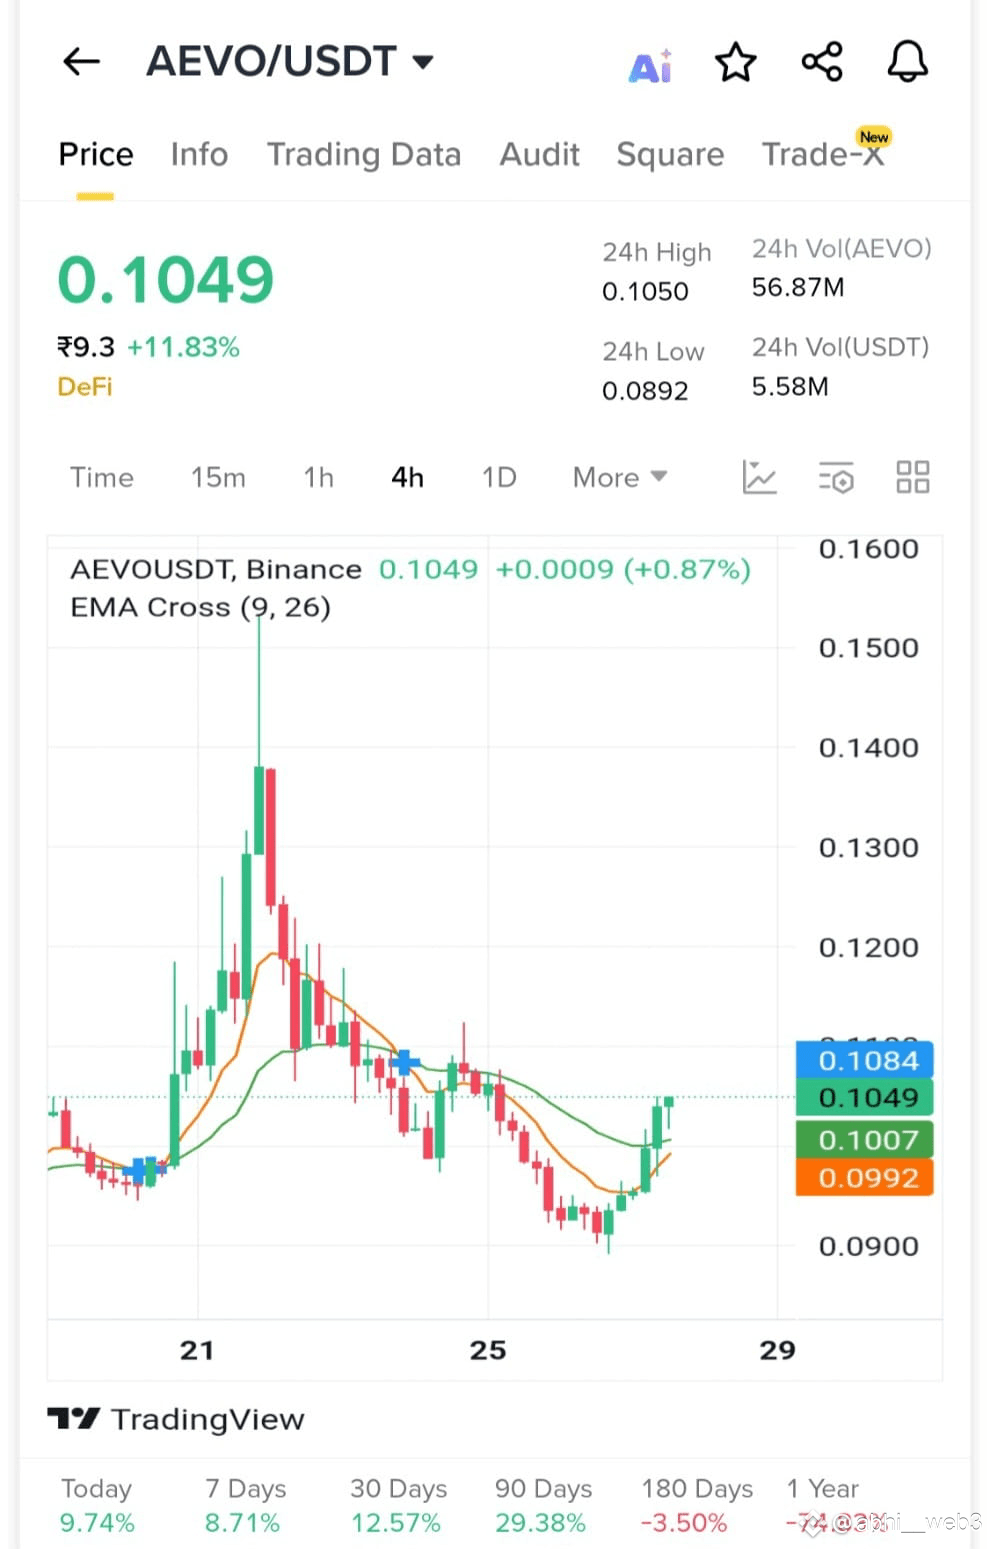
$AEVO /USDT
{spot}(AEVOUSDT)
– LONG SIGNAL 📈
AEVO showing strong bounce from support + EMA bullish crossover (9>26) 🔄. Buyers stepping back with momentum 💥.
🔹 Entry Zone: 0.1030 – 0.1050
🎯 Targets: 0.1120 / 0.1200 / 0.1350
🔴 Stop-loss: 0.0970
⚡️ Why Long?
EMA bullish cross → trend reversal signal
Demand zone (0.09) strongly defended 🛡️
Price pushing near 24h high → buyers in control
🔥 AEVO waking up, bulls may take it higher! 🚀
$AEVO /USDT
– LONG SIGNAL 📈
AEVO showing strong bounce from support + EMA bullish crossover (9>26) 🔄. Buyers stepping back with momentum 💥.
🔹 Entry Zone: 0.1030 – 0.1050
🎯 Targets: 0.1120 / 0.1200 / 0.1350
🔴 Stop-loss: 0.0970
⚡️ Why Long?
EMA bullish cross → trend reversal signal
Demand zone (0.09) strongly defended 🛡️
Price pushing near 24h high → buyers in control
🔥 AEVO waking up, bulls may take it higher! 🚀
– LONG SIGNAL 📈
AEVO showing strong bounce from support + EMA bullish crossover (9>26) 🔄. Buyers stepping back with momentum 💥.
🔹 Entry Zone: 0.1030 – 0.1050
🎯 Targets: 0.1120 / 0.1200 / 0.1350
🔴 Stop-loss: 0.0970
⚡️ Why Long?
EMA bullish cross → trend reversal signal
Demand zone (0.09) strongly defended 🛡️
Price pushing near 24h high → buyers in control
🔥 AEVO waking up, bulls may take it higher! 🚀
2
204
·
--
Bullish
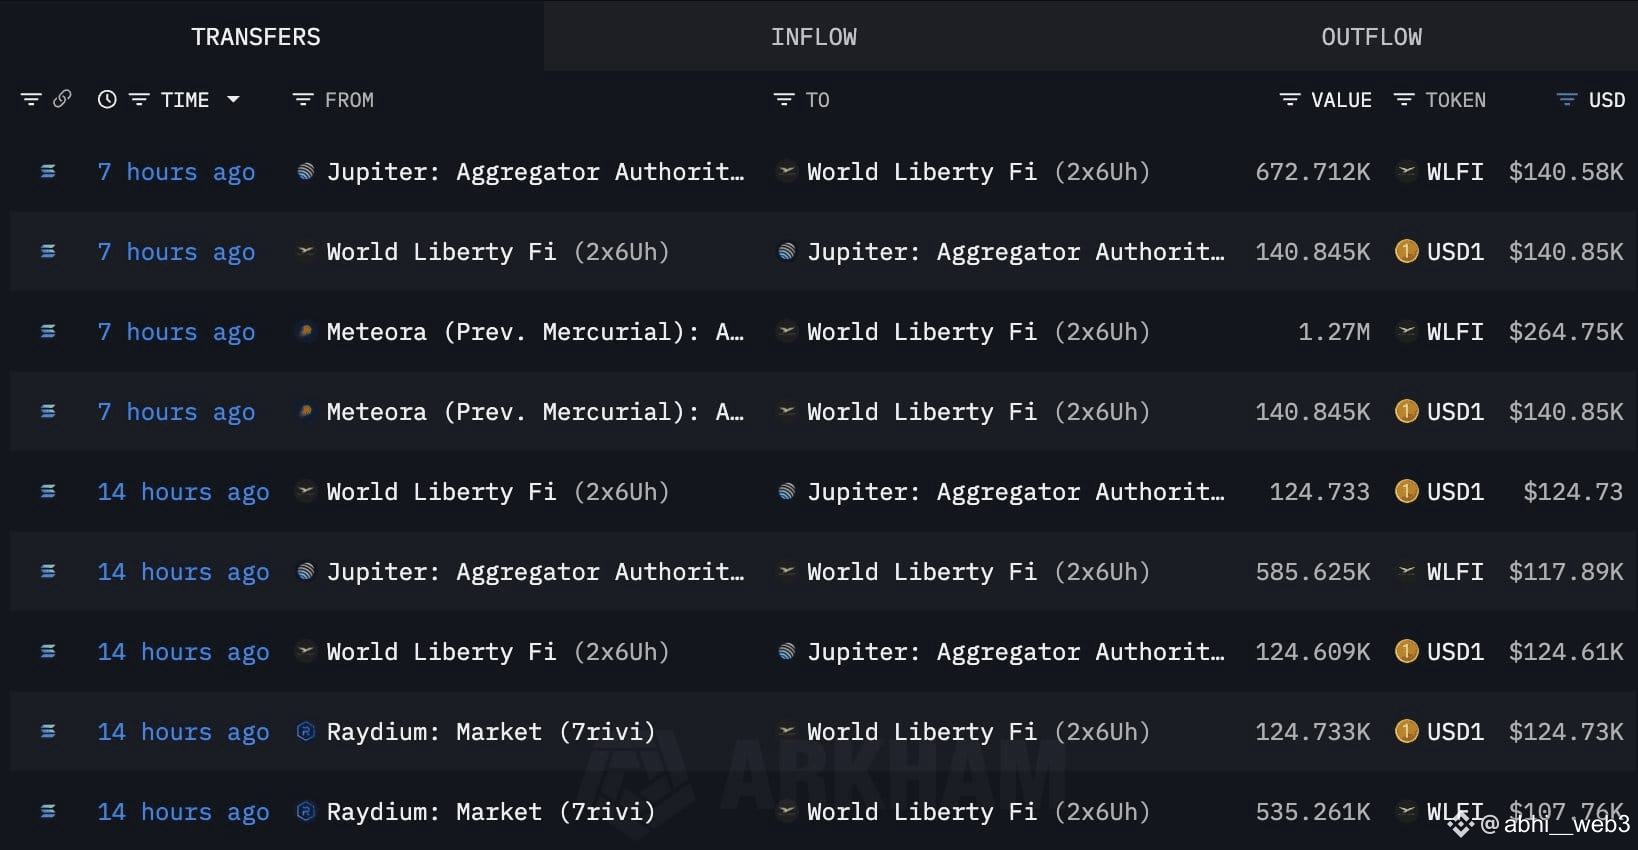
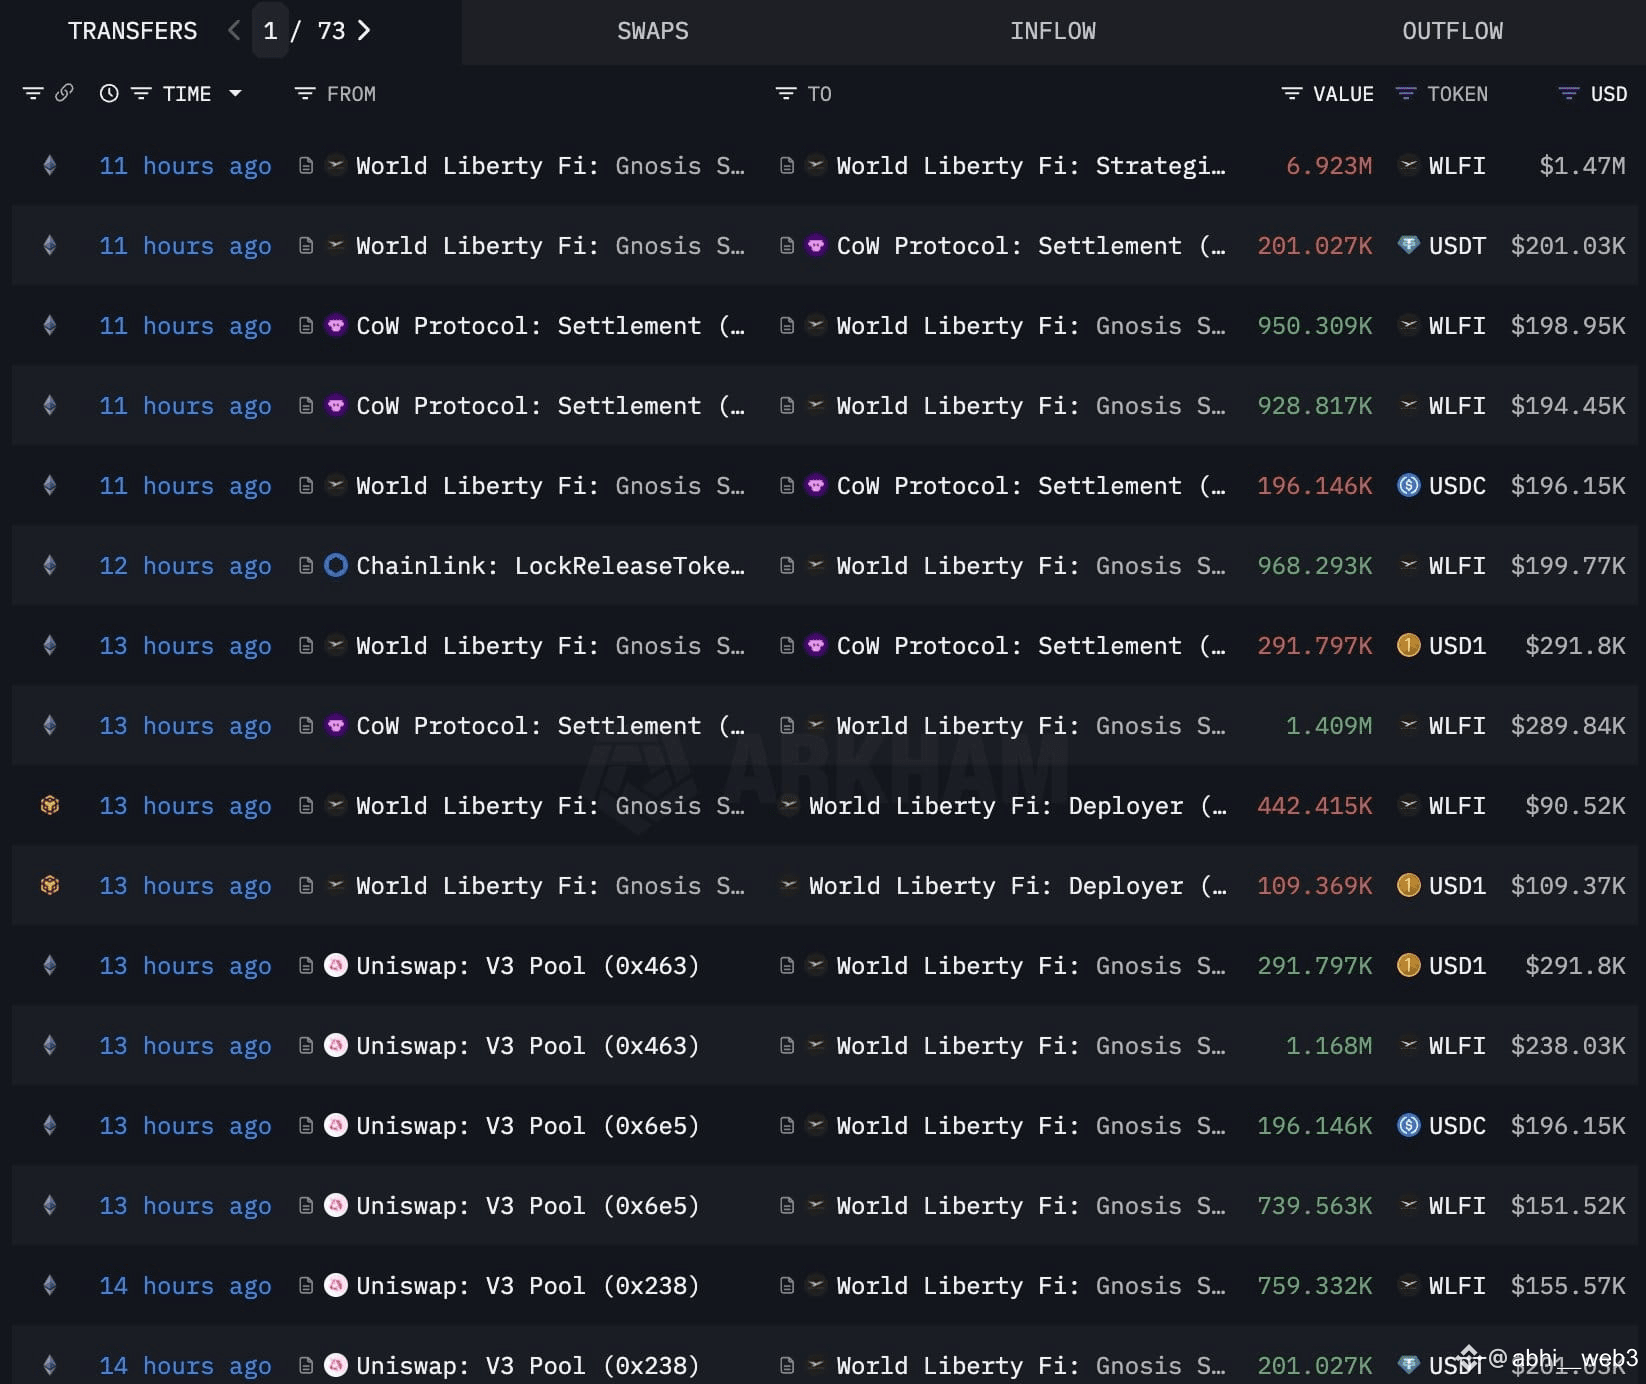
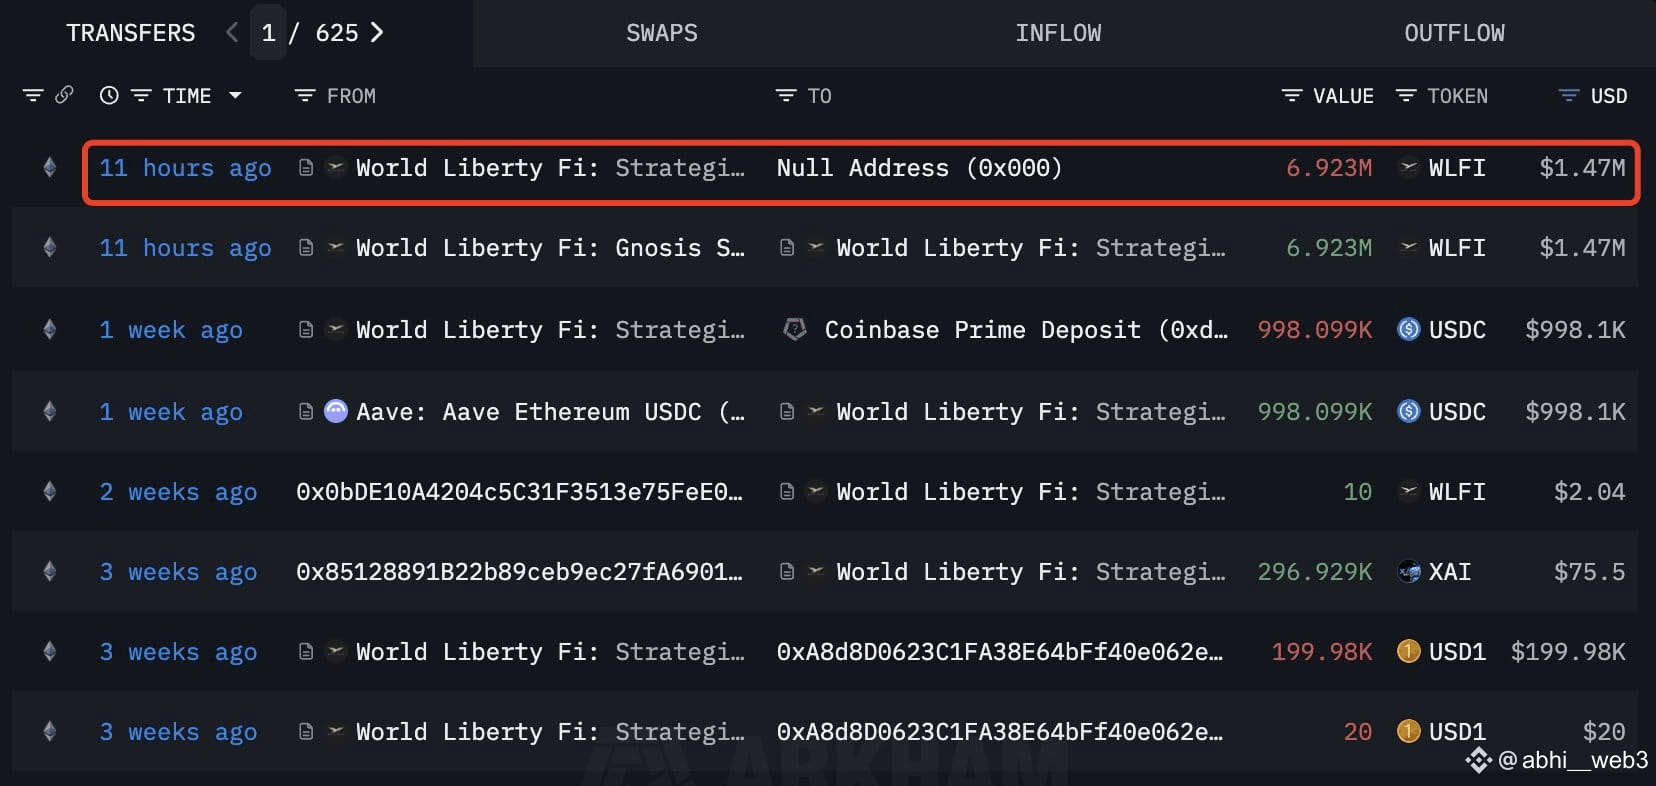
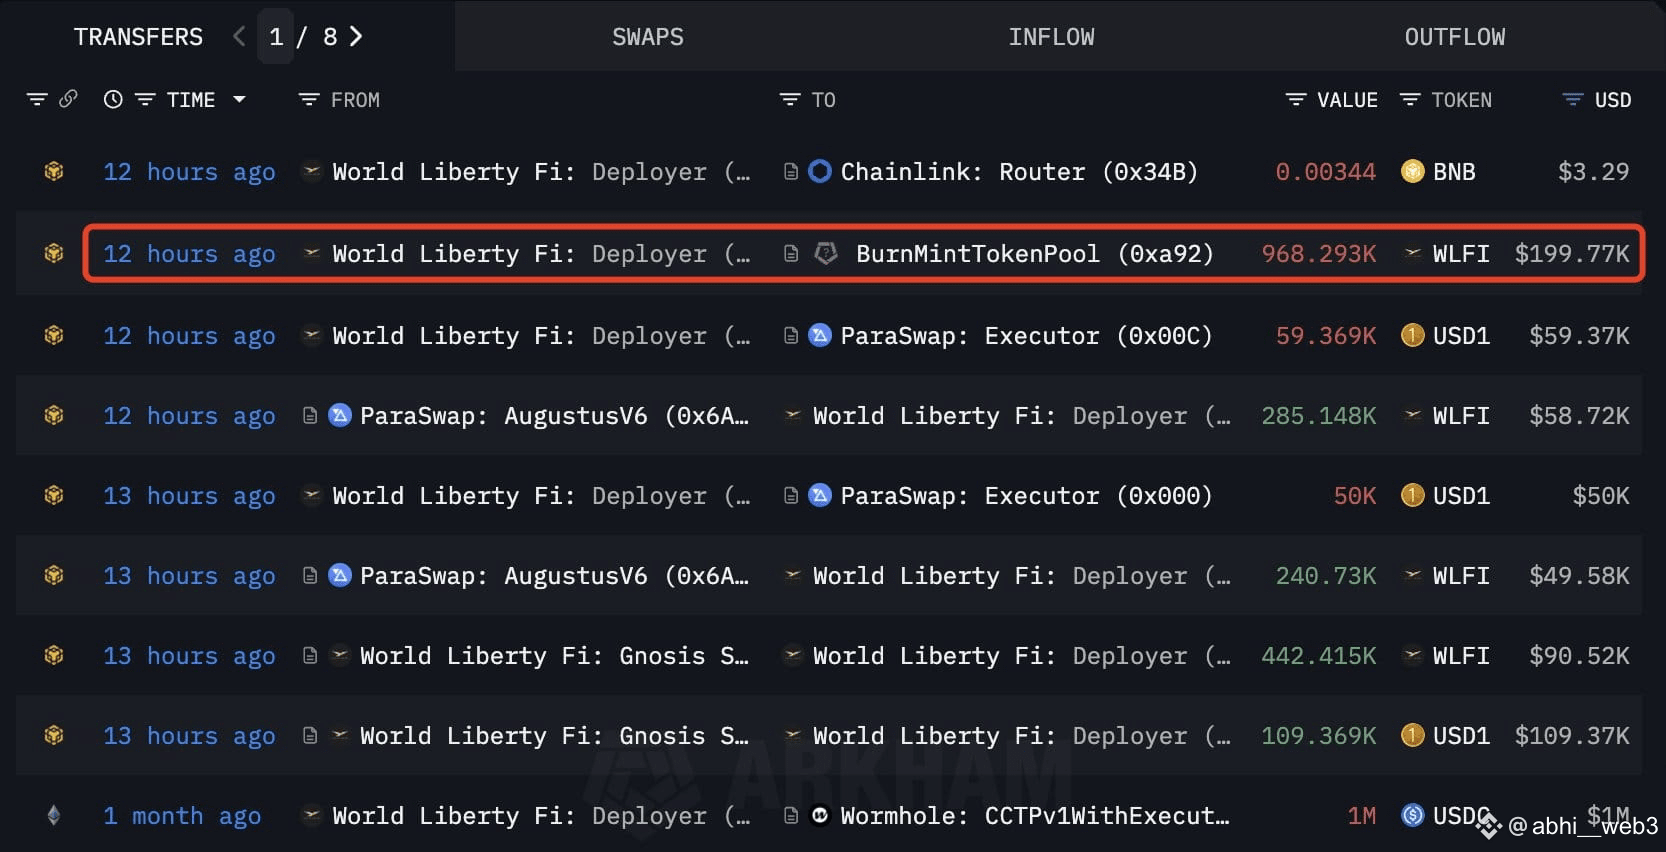
WLFI(@worldlibertyfi) has repurchased 6.04M $WLFI ($1.06M) and burned 7.89M $WLFI ($1.43M).
They collected 4.91M $WLFI($1.01M) and $1.06M in fees on Solana, BSC, and Ethereum, then spent $1.06M to buy 6.04M $WLFI.
They later burned 7.89M $WLFI ($1.43M) on BSC and Ethereum, leaving 3.06M $WLFI($638K) unburned on Solana.
{spot}(WLFIUSDT)
WLFI(@worldlibertyfi) has repurchased 6.04M $WLFI ($1.06M) and burned 7.89M $WLFI ($1.43M).
They collected 4.91M $WLFI ($1.01M) and $1.06M in fees on Solana, BSC, and Ethereum, then spent $1.06M to buy 6.04M $WLFI .
They later burned 7.89M $WLFI ($1.43M) on BSC and Ethereum, leaving 3.06M $WLFI ($638K) unburned on Solana.
They collected 4.91M $WLFI ($1.01M) and $1.06M in fees on Solana, BSC, and Ethereum, then spent $1.06M to buy 6.04M $WLFI .
They later burned 7.89M $WLFI ($1.43M) on BSC and Ethereum, leaving 3.06M $WLFI ($638K) unburned on Solana.
1
1
·
--
Bullish
$LAZIO
{spot}(LAZIOUSDT)
/USDT Long Trade Opportunity!
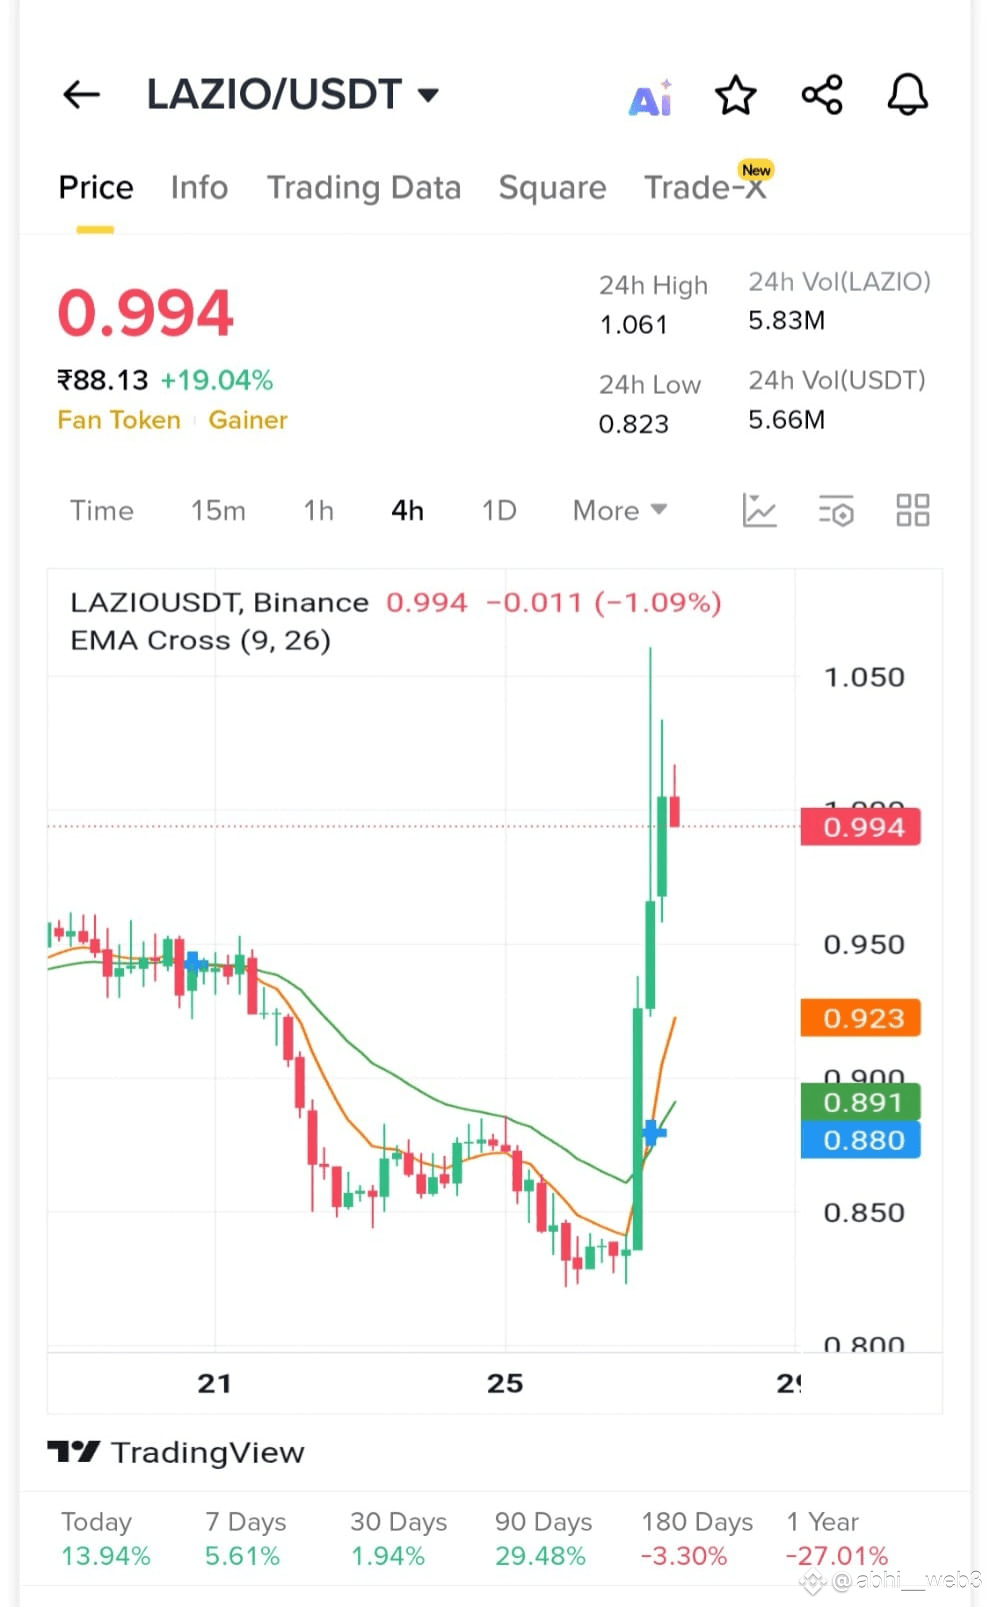
The current price of LAZIO/USDT is 0.994 USDT, with a 19% increase in fan tokens. The chart shows a bullish trend, with the price above both EMAs.
Trade Details:
- *Entry Zone:* 1.00 USDT
- *Stop Loss:* 0. 94 USDT
- *Take Profit:* 1.20 USDT (or higher resistance levels)
Analysis:
- The EMA(9) crossing above the EMA(26) indicates a bullish trend.
- The current price is above both EMAs, supporting the bullish trend.
- Recent candles show an upward movement.
Follow us for timely trade signals and market insights!
#LAZIO/USDT #USDT #TradeSignal
$LAZIO
/USDT Long Trade Opportunity!
The current price of LAZIO/USDT is 0.994 USDT, with a 19% increase in fan tokens. The chart shows a bullish trend, with the price above both EMAs.
Trade Details:
- *Entry Zone:* 1.00 USDT
- *Stop Loss:* 0. 94 USDT
- *Take Profit:* 1.20 USDT (or higher resistance levels)
Analysis:
- The EMA(9) crossing above the EMA(26) indicates a bullish trend.
- The current price is above both EMAs, supporting the bullish trend.
- Recent candles show an upward movement.
Follow us for timely trade signals and market insights!
#LAZIO/USDT #USDT #TradeSignal
/USDT Long Trade Opportunity!
The current price of LAZIO/USDT is 0.994 USDT, with a 19% increase in fan tokens. The chart shows a bullish trend, with the price above both EMAs.
Trade Details:
- *Entry Zone:* 1.00 USDT
- *Stop Loss:* 0. 94 USDT
- *Take Profit:* 1.20 USDT (or higher resistance levels)
Analysis:
- The EMA(9) crossing above the EMA(26) indicates a bullish trend.
- The current price is above both EMAs, supporting the bullish trend.
- Recent candles show an upward movement.
Follow us for timely trade signals and market insights!
#LAZIO/USDT #USDT #TradeSignal
1
1
·
--
Bullish
$BEAMX /USDT
{spot}(BEAMXUSDT)
Long Trade Opportunity!
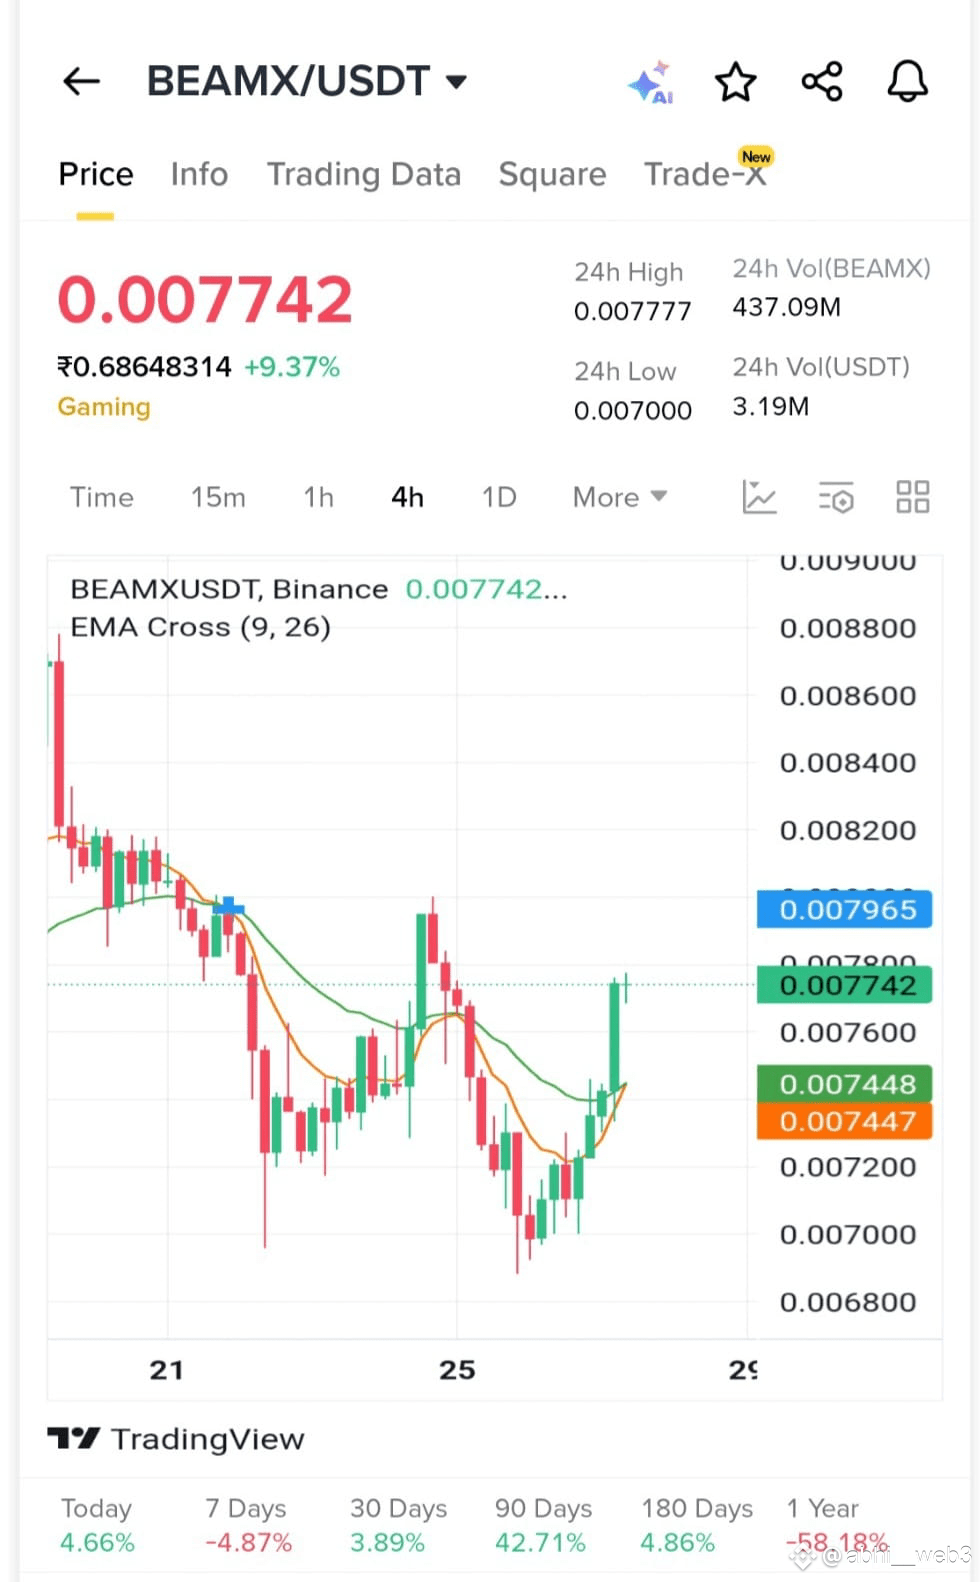
The current price of BEAMX/USDT is 0.007742 USDT, with a 24-hour high of 0.007777 USDT and a low of 0.007000 USDT. The chart shows a bullish trend, with the price above both EMAs.
Trade Details:
- *Entry Zone:* 0.00775USDT
- *Stop Loss:* 0.00 730USDT
- *Take Profit:* 0.00860USDT
Analysis:
- The EMA(9) crossing above the EMA(26) indicates a bullish trend.
- The current price is above both EMAs, supporting the bullish trend.
- Recent candles show an upward movement.
Follow us for timely trade signals and market insights!
#BEAMXUSDT #USDT #TradeSignal
$BEAMX /USDT
Long Trade Opportunity!
The current price of BEAMX/USDT is 0.007742 USDT, with a 24-hour high of 0.007777 USDT and a low of 0.007000 USDT. The chart shows a bullish trend, with the price above both EMAs.
Trade Details:
- *Entry Zone:* 0.00775USDT
- *Stop Loss:* 0.00 730USDT
- *Take Profit:* 0.00860USDT
Analysis:
- The EMA(9) crossing above the EMA(26) indicates a bullish trend.
- The current price is above both EMAs, supporting the bullish trend.
- Recent candles show an upward movement.
Follow us for timely trade signals and market insights!
#BEAMXUSDT #USDT #TradeSignal
Long Trade Opportunity!
The current price of BEAMX/USDT is 0.007742 USDT, with a 24-hour high of 0.007777 USDT and a low of 0.007000 USDT. The chart shows a bullish trend, with the price above both EMAs.
Trade Details:
- *Entry Zone:* 0.00775USDT
- *Stop Loss:* 0.00 730USDT
- *Take Profit:* 0.00860USDT
Analysis:
- The EMA(9) crossing above the EMA(26) indicates a bullish trend.
- The current price is above both EMAs, supporting the bullish trend.
- Recent candles show an upward movement.
Follow us for timely trade signals and market insights!
#BEAMXUSDT #USDT #TradeSignal
1
12
·
--
Bullish
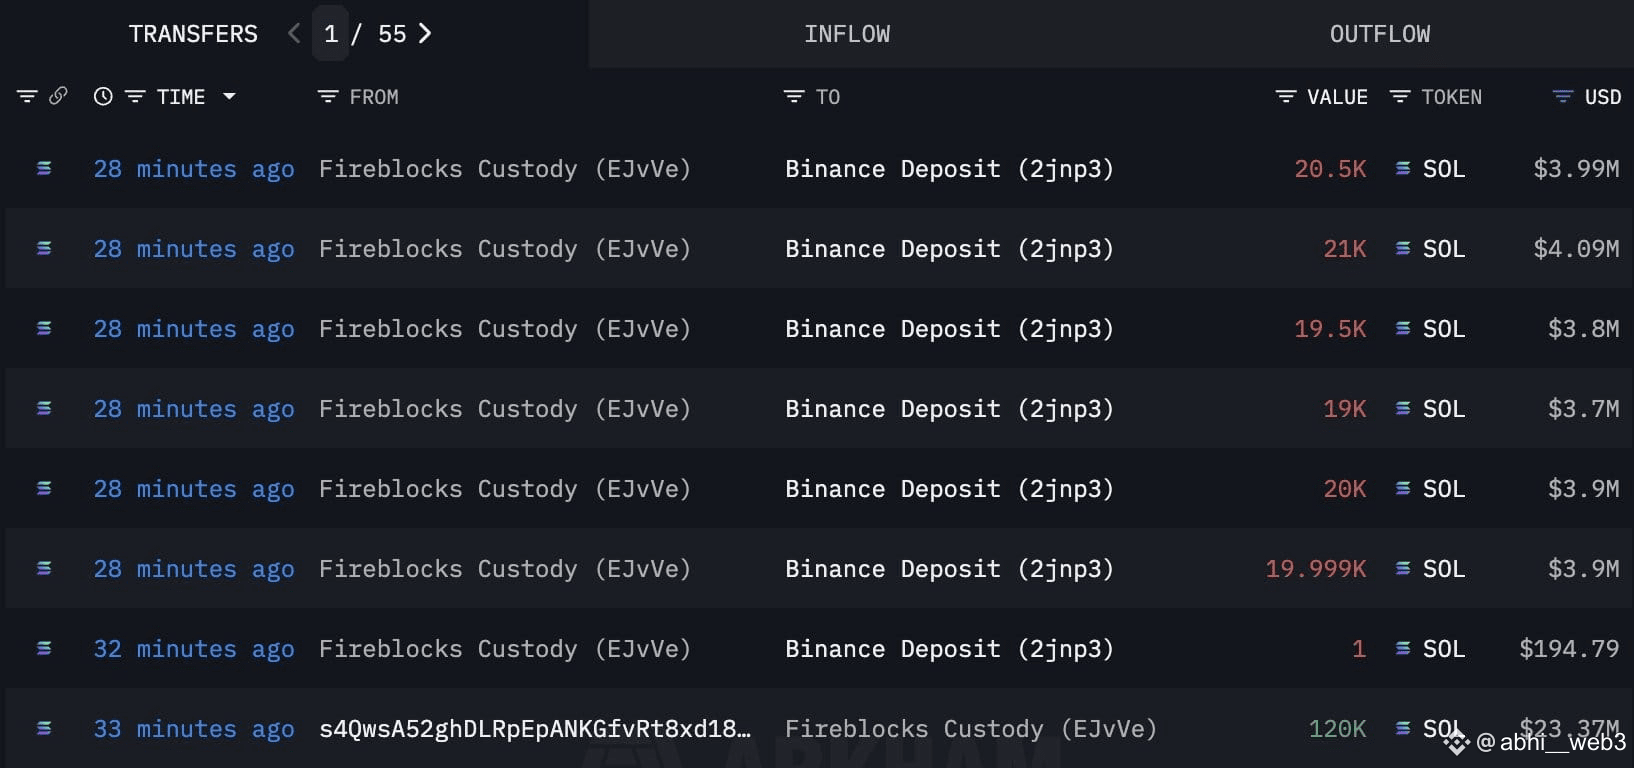
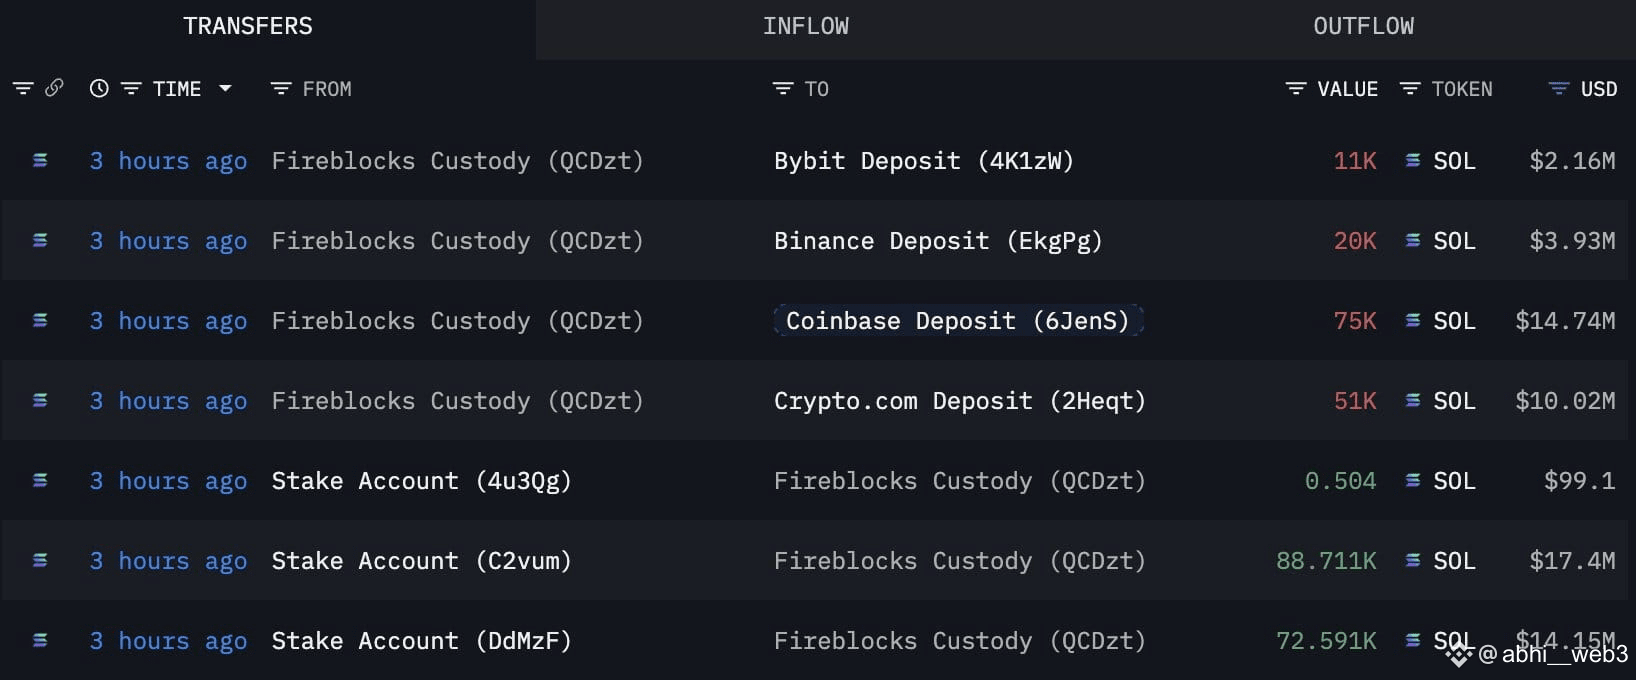
2 whales deposited 277,000 $SOL($54.23M) to exchanges in the past 3 hours.
$SOL
{spot}(SOLUSDT)
2 whales deposited 277,000 $SOL ($54.23M) to exchanges in the past 3 hours.
$SOL
$SOL
1
37
·
--
Bullish
$SNX /USDT
{spot}(SNXUSDT)
Analysis
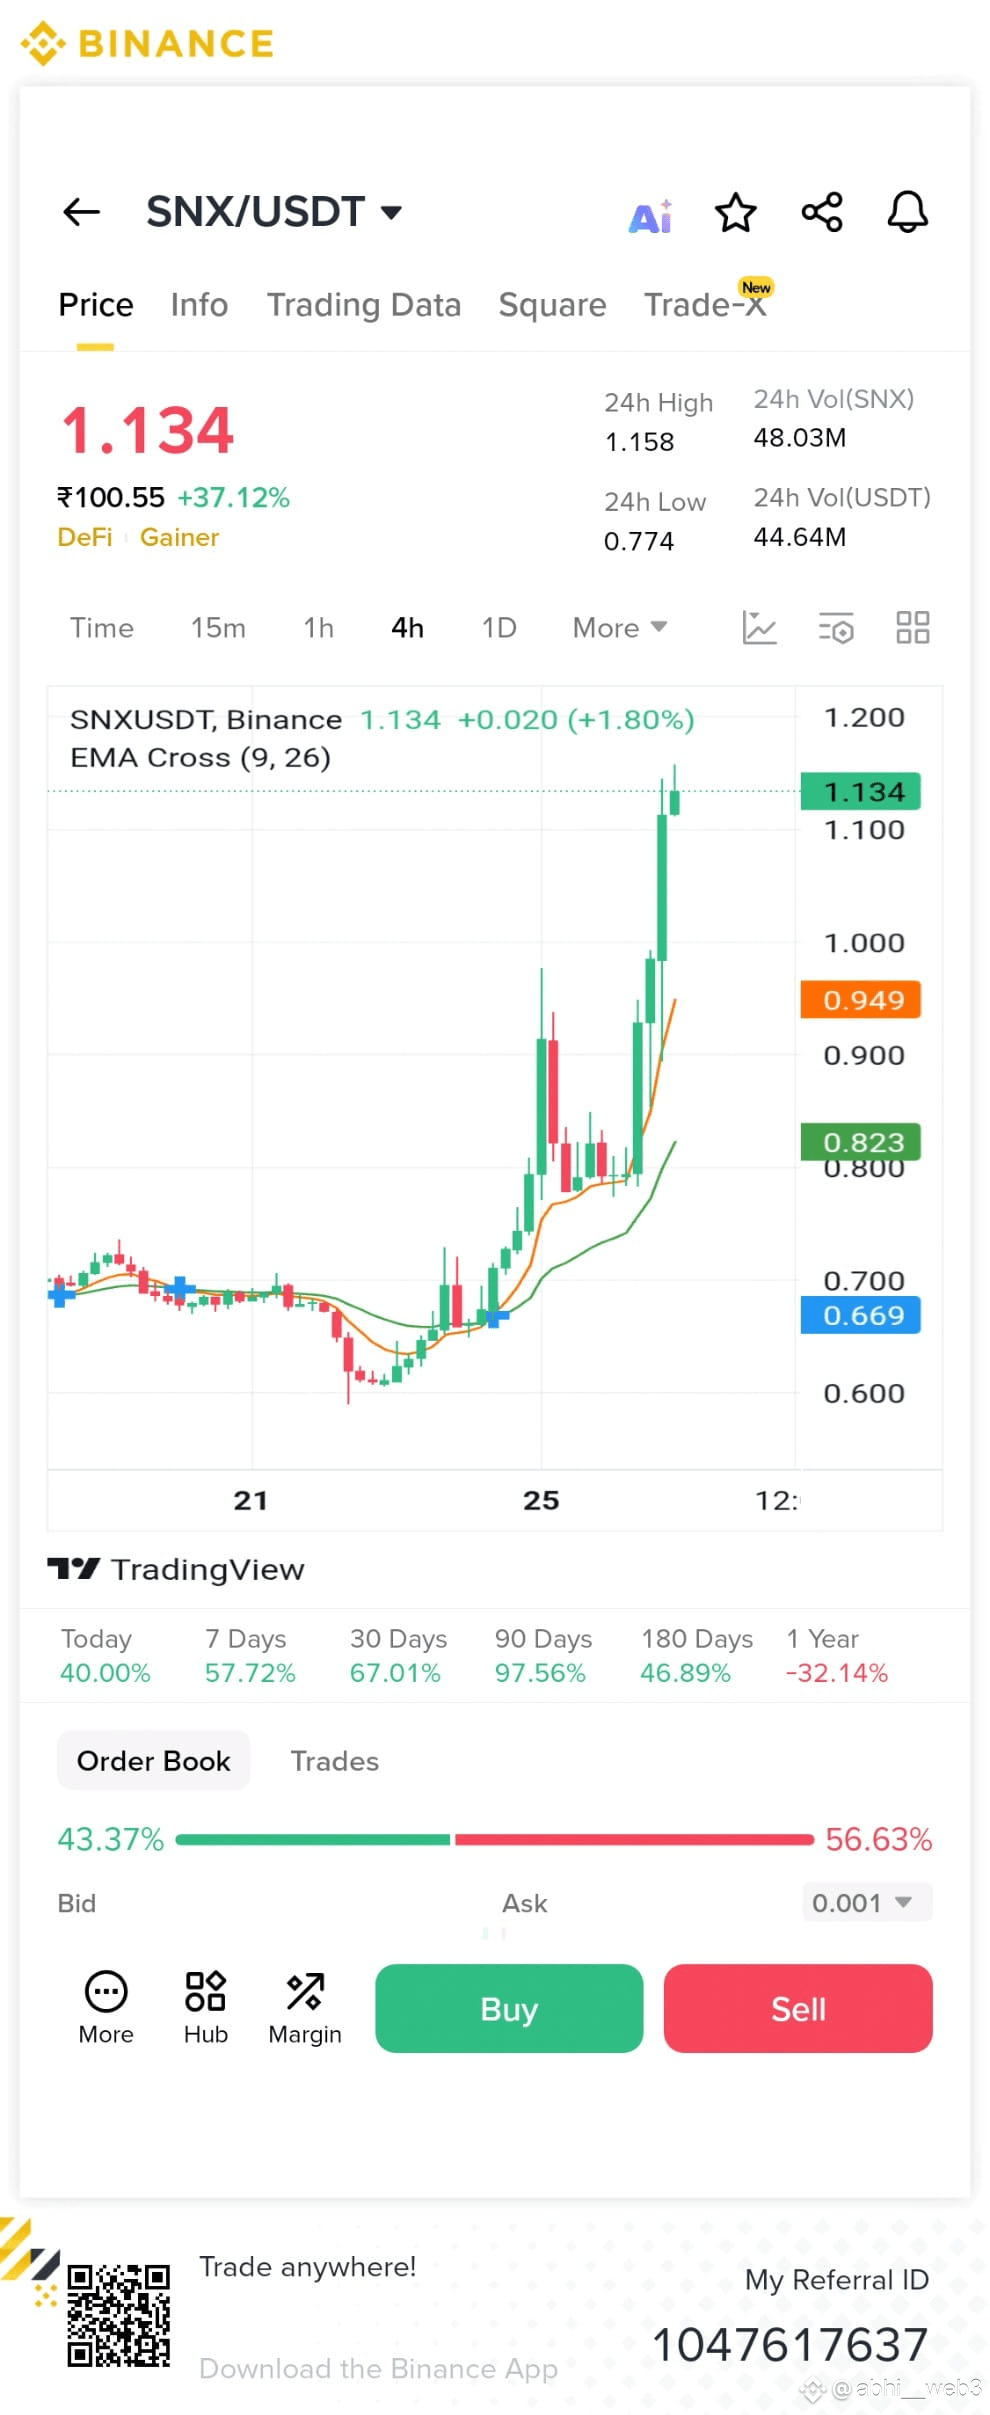
The current price of SNX/USDT is $1.137, with a 1.80% increase. The 1-day chart shows an uptrend, and the EMA Cross (9, 26) is bullish.
- The price has risen from 0.669 to 1.137, indicating a significant increase.
- The EMA Cross suggests a bullish trend.
- The current price is near the 24-hour high.
Trade Signal:
*Long Trade*
Entry Zone:
1.36 - 1.38
Targets:
- *Target 1:* 1.41
- *Target 2:* 1.45
Stop Loss:
1.33
#SNX #USDT #LongTrade
$SNX /USDT
Analysis
The current price of SNX/USDT is $1.137, with a 1.80% increase. The 1-day chart shows an uptrend, and the EMA Cross (9, 26) is bullish.
- The price has risen from 0.669 to 1.137, indicating a significant increase.
- The EMA Cross suggests a bullish trend.
- The current price is near the 24-hour high.
Trade Signal:
*Long Trade*
Entry Zone:
1.36 - 1.38
Targets:
- *Target 1:* 1.41
- *Target 2:* 1.45
Stop Loss:
1.33
#SNX #USDT #LongTrade
Analysis
The current price of SNX/USDT is $1.137, with a 1.80% increase. The 1-day chart shows an uptrend, and the EMA Cross (9, 26) is bullish.
- The price has risen from 0.669 to 1.137, indicating a significant increase.
- The EMA Cross suggests a bullish trend.
- The current price is near the 24-hour high.
Trade Signal:
*Long Trade*
Entry Zone:
1.36 - 1.38
Targets:
- *Target 1:* 1.41
- *Target 2:* 1.45
Stop Loss:
1.33
#SNX #USDT #LongTrade
1
231
·
--
Bearish
$0G /USDT
{future}(0GUSDT)
Analysis
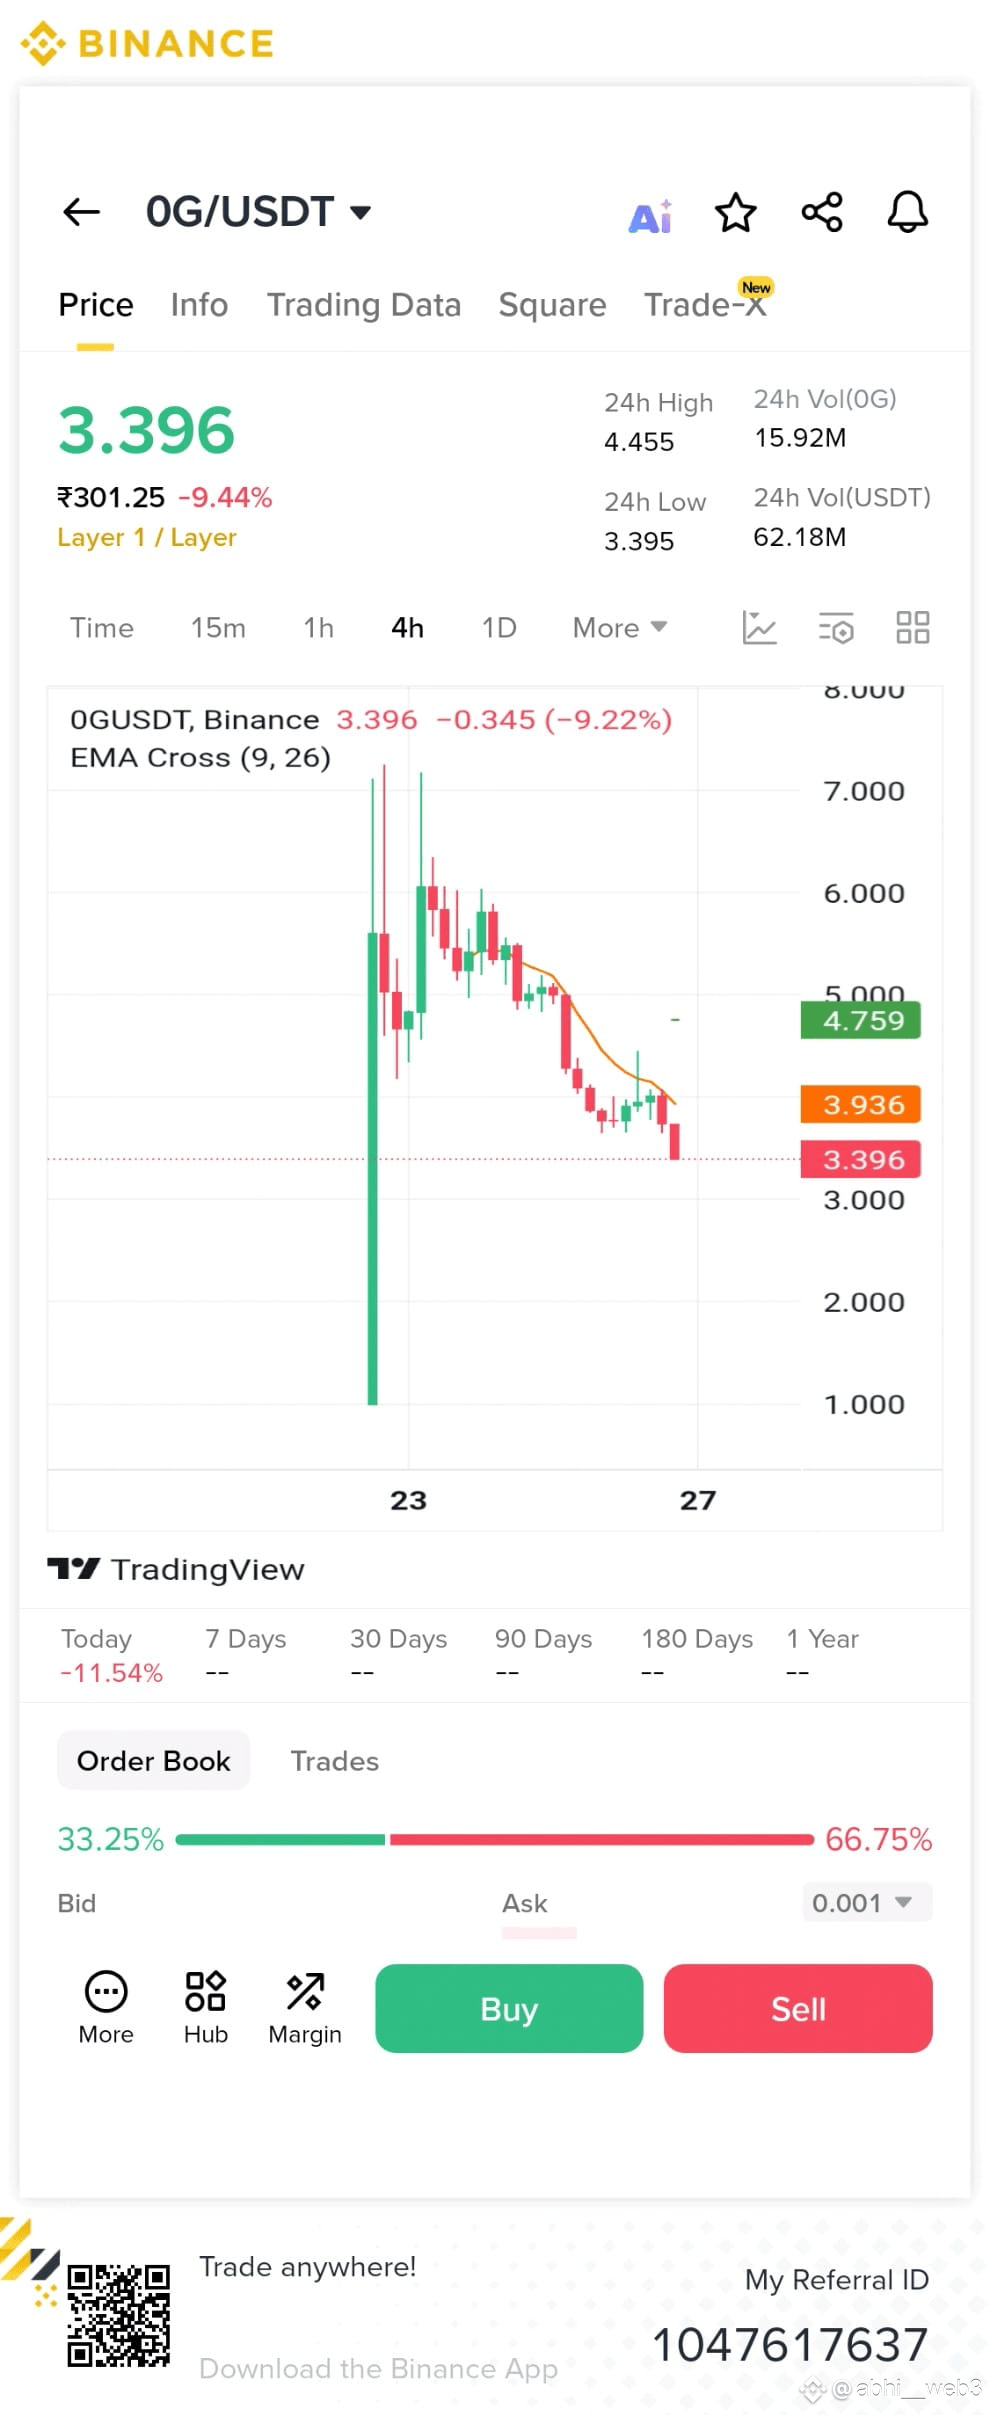
The current price of 0G/USDT is 3.396 USDT. The 4-hour chart shows a downtrend, and the EMA Cross (9, 26) is bearish.
Analysis:
- The price has dropped from 4.759 to 3.396, indicating a significant decline.
- The EMA Cross suggests a bearish trend.
- The current price is near the 24-hour low.
Trade Signal:
*Short Trade*
Entry Zone:
3.30 - 3.20
Targets:
- *Target 1:* 3.00
- *Target 2:* 2.80
Stop Loss:
3.50
$0G /USDT
Analysis
The current price of 0G/USDT is 3.396 USDT. The 4-hour chart shows a downtrend, and the EMA Cross (9, 26) is bearish.
Analysis:
- The price has dropped from 4.759 to 3.396, indicating a significant decline.
- The EMA Cross suggests a bearish trend.
- The current price is near the 24-hour low.
Trade Signal:
*Short Trade*
Entry Zone:
3.30 - 3.20
Targets:
- *Target 1:* 3.00
- *Target 2:* 2.80
Stop Loss:
3.50
Analysis
The current price of 0G/USDT is 3.396 USDT. The 4-hour chart shows a downtrend, and the EMA Cross (9, 26) is bearish.
Analysis:
- The price has dropped from 4.759 to 3.396, indicating a significant decline.
- The EMA Cross suggests a bearish trend.
- The current price is near the 24-hour low.
Trade Signal:
*Short Trade*
Entry Zone:
3.30 - 3.20
Targets:
- *Target 1:* 3.00
- *Target 2:* 2.80
Stop Loss:
3.50
1
494
·
--
Bullish
LA/USDT Long Signal
$LA
{spot}(LAUSDT)
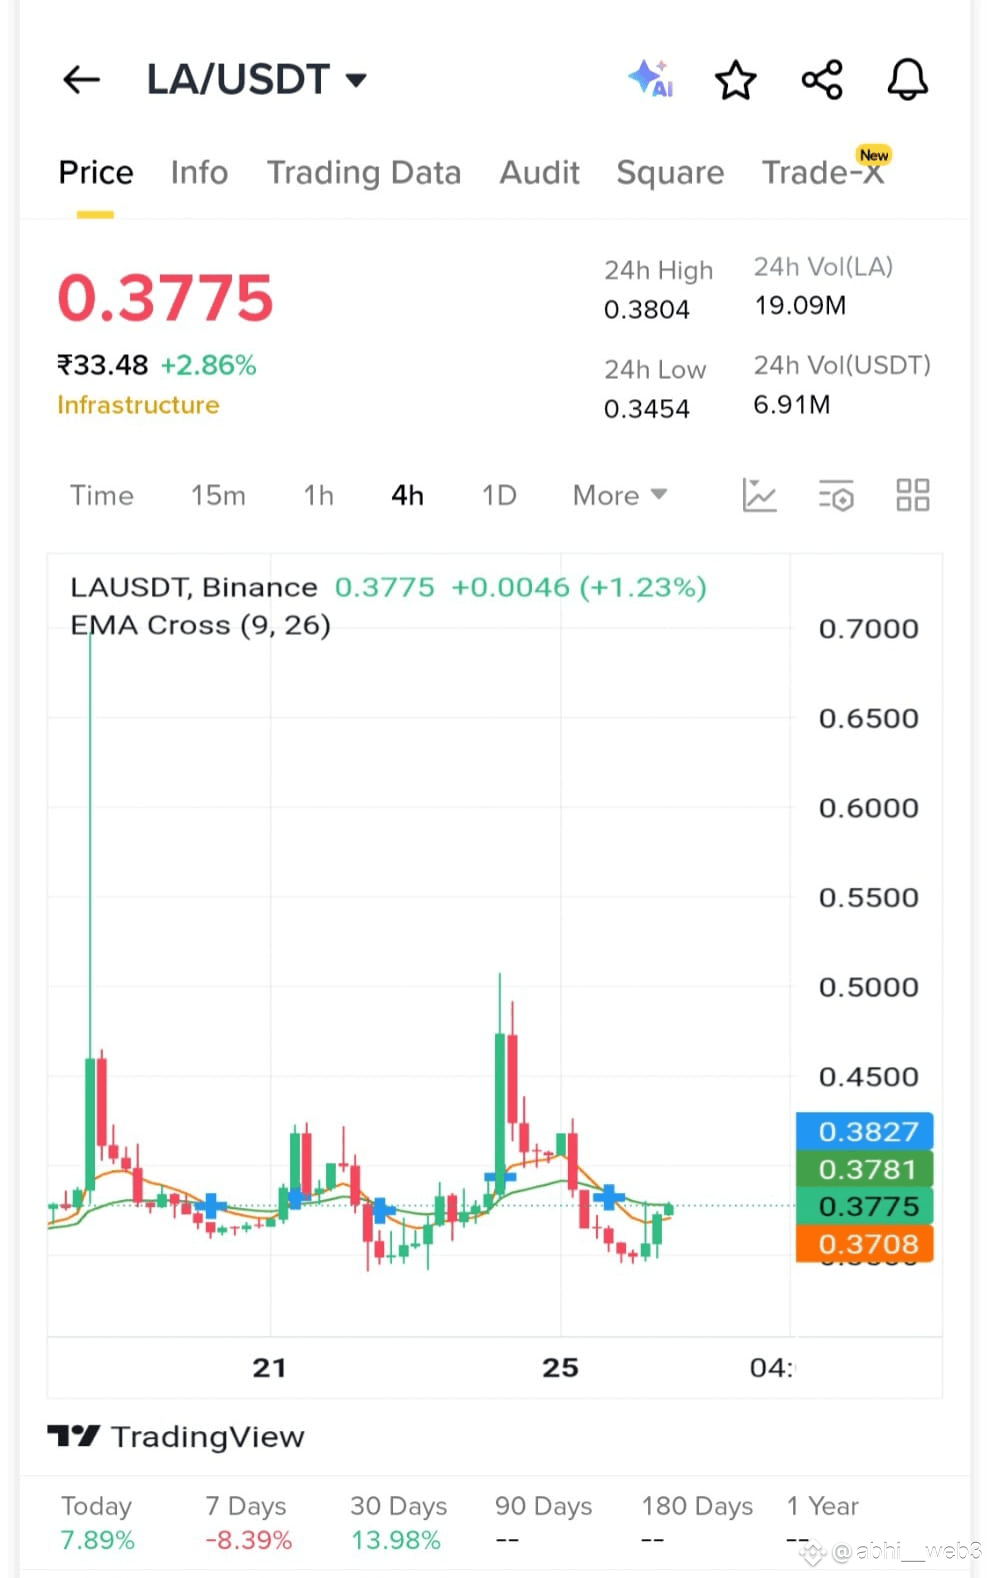
📉 Current Price: 0.3775
⚡ Trend: Reversal forming – bulls defending 0.37 support
📊 Today’s Gain: +7.89%
📌 Trade Setup (Long)
Entry Zone: 0.3740 – 0.3780
Targets:
🎯 TP1: 0.3825
🎯 TP2: 0.4200
🎯 TP3: 0.4500
Stop Loss: 0.3590
“LA price has bounced strongly from the 0.37 zone. Sellers are weakening, and buyers are gaining momentum. A clean break above 0.3825 can fuel a bullish rally towards 0.42–0.45. Smart long entries here with a tight stop look rewarding.”
LA/USDT Long Signal
$LA
📉 Current Price: 0.3775
⚡ Trend: Reversal forming – bulls defending 0.37 support
📊 Today’s Gain: +7.89%
📌 Trade Setup (Long)
Entry Zone: 0.3740 – 0.3780
Targets:
🎯 TP1: 0.3825
🎯 TP2: 0.4200
🎯 TP3: 0.4500
Stop Loss: 0.3590
“LA price has bounced strongly from the 0.37 zone. Sellers are weakening, and buyers are gaining momentum. A clean break above 0.3825 can fuel a bullish rally towards 0.42–0.45. Smart long entries here with a tight stop look rewarding.”
$LA
📉 Current Price: 0.3775
⚡ Trend: Reversal forming – bulls defending 0.37 support
📊 Today’s Gain: +7.89%
📌 Trade Setup (Long)
Entry Zone: 0.3740 – 0.3780
Targets:
🎯 TP1: 0.3825
🎯 TP2: 0.4200
🎯 TP3: 0.4500
Stop Loss: 0.3590
“LA price has bounced strongly from the 0.37 zone. Sellers are weakening, and buyers are gaining momentum. A clean break above 0.3825 can fuel a bullish rally towards 0.42–0.45. Smart long entries here with a tight stop look rewarding.”
1
82
·
--
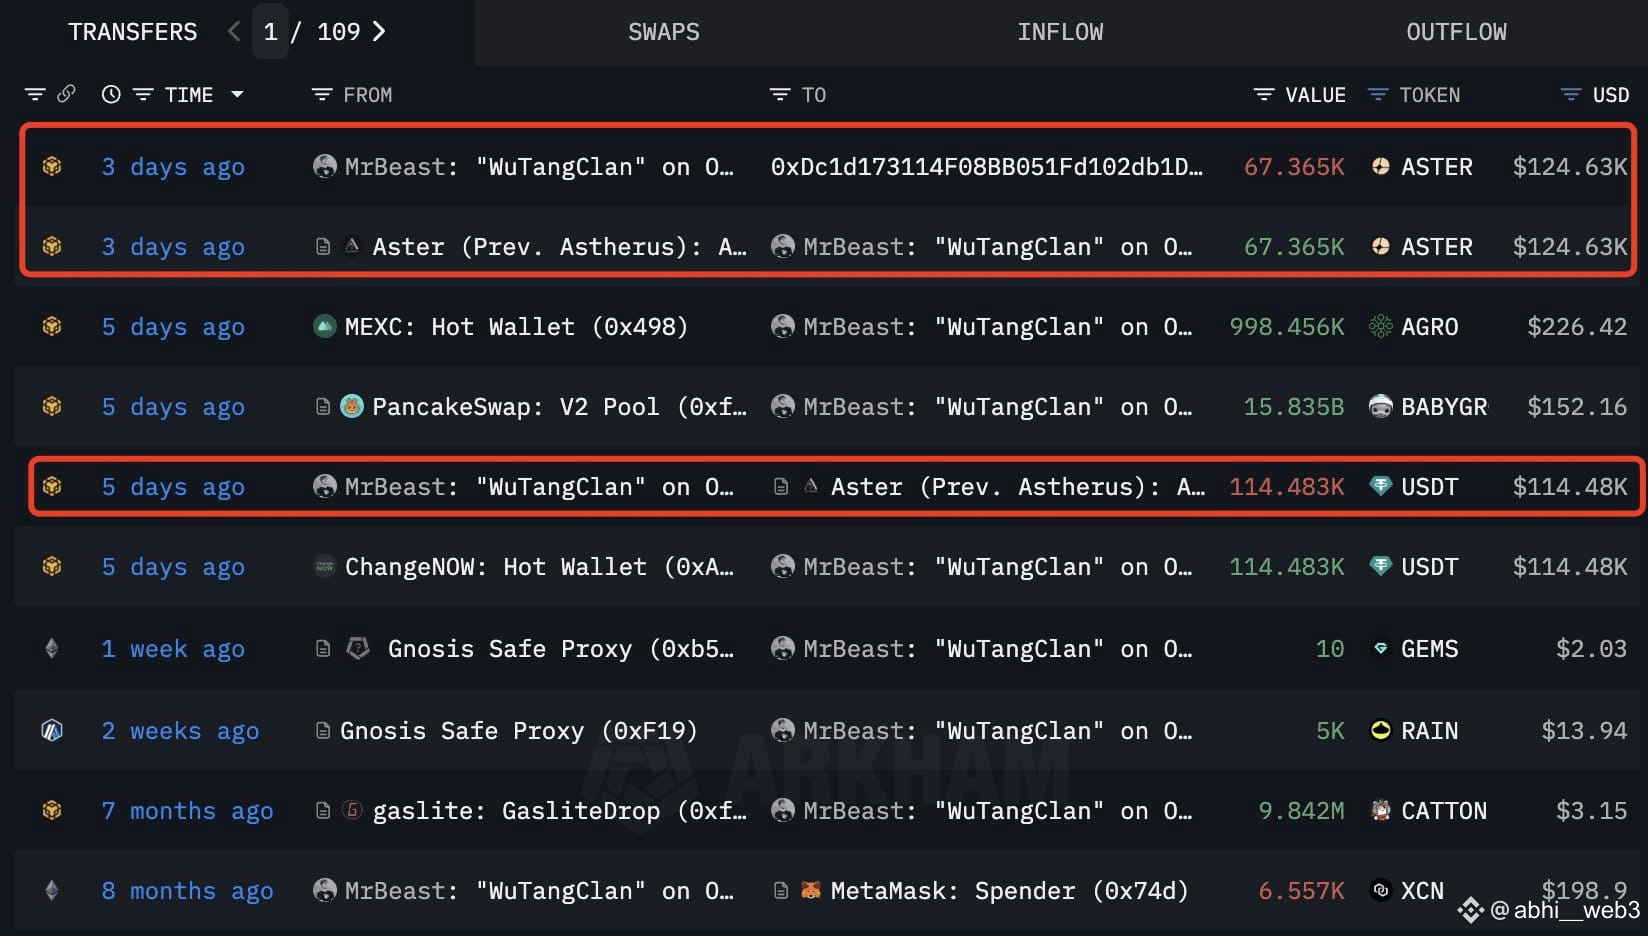
MrBeast(@MrBeast) bought 538,384 $ASTER($990K) over the past 3 days.
He deposited 1M $USDT into #Aster using public wallet 0x9e67 and new wallet 0x0e8A, then withdrew 538,384 $ASTER.
The average buying price was likely ~$1.87.
$ASTER
{future}(ASTERUSDT)
MrBeast(@MrBeast) bought 538,384 $ASTER ($990K) over the past 3 days.
He deposited 1M $USDT into #Aster using public wallet 0x9e67 and new wallet 0x0e8A, then withdrew 538,384 $ASTER .
The average buying price was likely ~$1.87.
$ASTER
He deposited 1M $USDT into #Aster using public wallet 0x9e67 and new wallet 0x0e8A, then withdrew 538,384 $ASTER .
The average buying price was likely ~$1.87.
$ASTER
·
--
Bullish
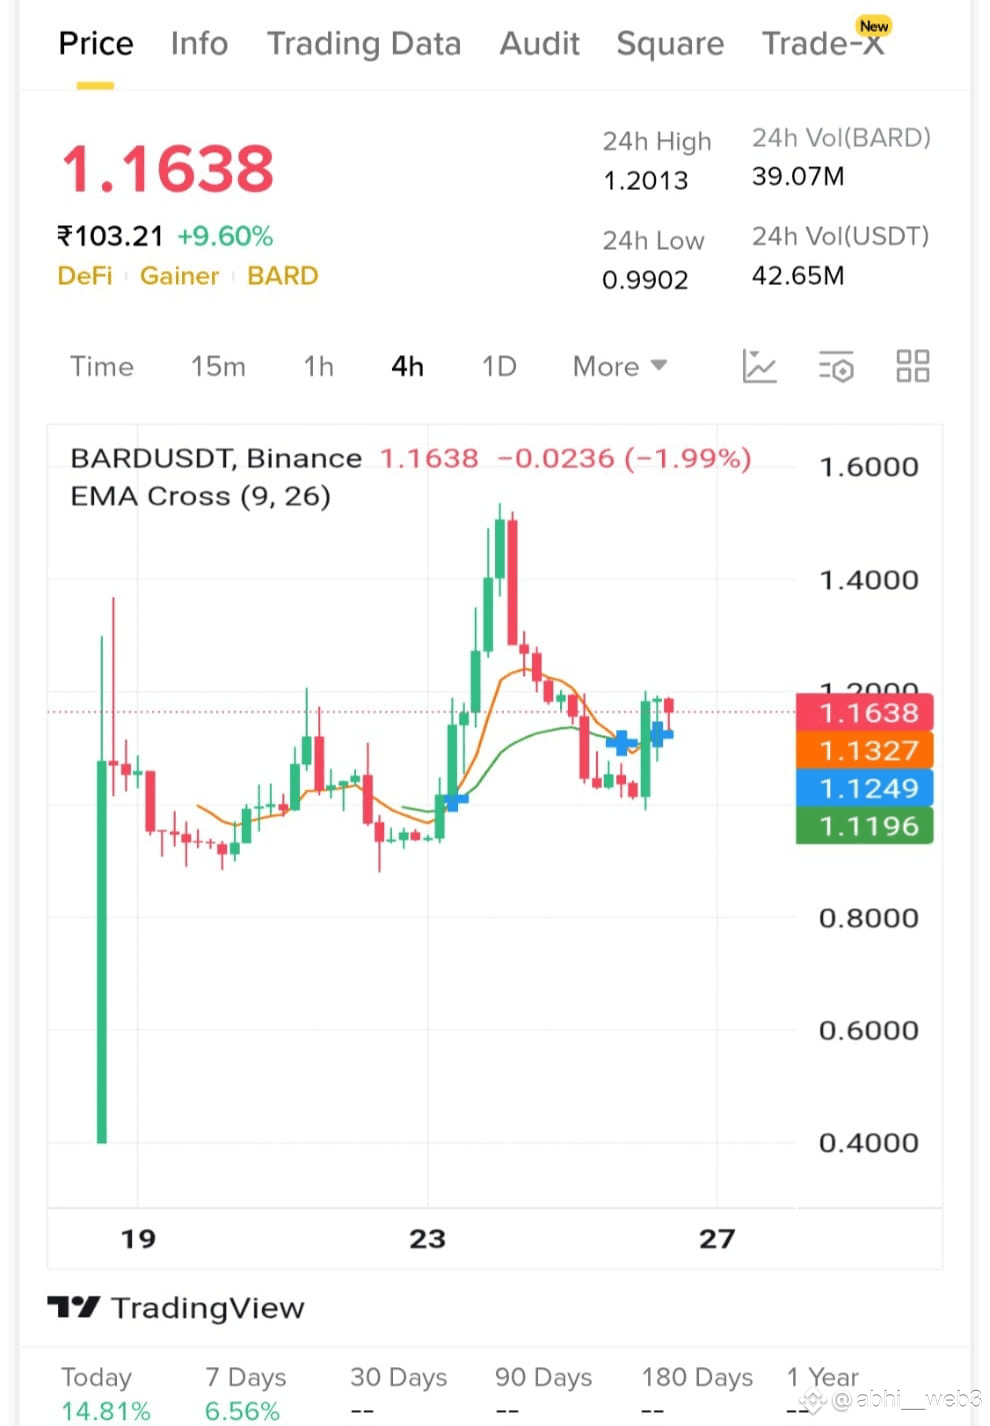
$BARD/USDT – LONG SETUP
📉 Current Price: ~1.17
📍 Entry Zone: 1.18
🎯 Targets:
TP1: 1.203
TP2: 1.28
TP3: 1.30
🛑 Stop-Loss: 0.99
📊 Why Long?
Pullback to key support aligning with EMA bounce zone
Uptrend structure still intact despite volatility
Positive sentiment & BTC yield hype boosting momentum.
$BARD
{spot}(BARDUSDT)
$BARD /USDT – LONG SETUP
📉 Current Price: ~1.17
📍 Entry Zone: 1.18
🎯 Targets:
TP1: 1.203
TP2: 1.28
TP3: 1.30
🛑 Stop-Loss: 0.99
📊 Why Long?
Pullback to key support aligning with EMA bounce zone
Uptrend structure still intact despite volatility
Positive sentiment & BTC yield hype boosting momentum.
$BARD
📉 Current Price: ~1.17
📍 Entry Zone: 1.18
🎯 Targets:
TP1: 1.203
TP2: 1.28
TP3: 1.30
🛑 Stop-Loss: 0.99
📊 Why Long?
Pullback to key support aligning with EMA bounce zone
Uptrend structure still intact despite volatility
Positive sentiment & BTC yield hype boosting momentum.
$BARD
1
424
Log in to explore more content
Join global crypto users on Binance Square
⚡️ Get latest and useful information about crypto.
💬 Trusted by the world’s largest crypto exchange.
👍 Discover real insights from verified creators.
Email / Phone number
Trending Topics
HuangRisksOusterOverReportedAffairWithSubordinate
808 views
27 Discussing
Nvidia Board Meets to Decide Jensen Huang's Future as Crisis Deepens
Binance News
·0 Likes
·740 views
AnthropicRejectsIPODelayValuationinQuestion
418,255 views
3,576 Discussing
CoreWeaveJumps10%On168%RevenueGrowth
42,824 views
654 Discussing