
AnFX Crypto
1.1k Posts

AnFX Crypto
Report
Block User
Teknikal Analisis Price Action | Twitter: @anfxcrypto_id
Open Trade
Frequent Trader
2.4 Years
421 Following
188 Followers
271 Liked
Posts
Portfolio
All
Quotes
·
--
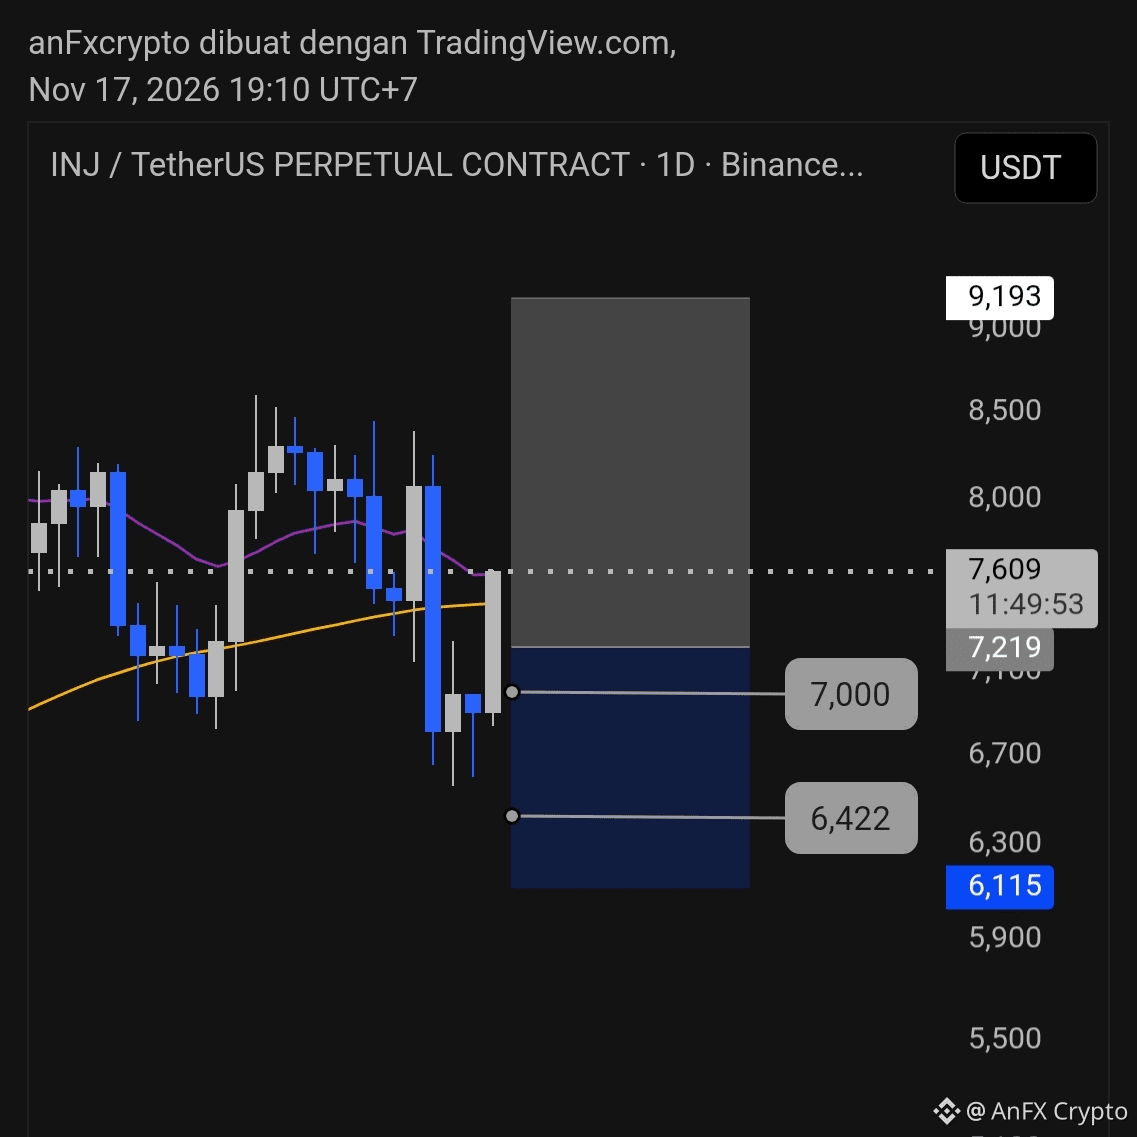
Technical Analysis $INJ /USDT (1D) :
Structure & Trend: The price is testing the support area around $7.00 – $7.21 after experiencing corrective selling pressure from the moving average area. A minor rejection has occurred, indicating buyers are attempting to defend the demand area.
Trading Signal (Long Setup):
Entry (Buy): $7.10 – $7.25 (Current support/consolidation area).
Stop Loss (SL): Below $6.40 (A daily close below this level invalidates the bullish scenario).
Take Profit (TP):
TP 1: $7.60 (Nearest resistance)
TP 2: $8.50 – $9.19 (Upper target of the previous order block/gap zone).
{future}(INJUSDT)
Technical Analysis $INJ /USDT (1D) :
Structure & Trend: The price is testing the support area around $7.00 – $7.21 after experiencing corrective selling pressure from the moving average area. A minor rejection has occurred, indicating buyers are attempting to defend the demand area.
Trading Signal (Long Setup):
Entry (Buy): $7.10 – $7.25 (Current support/consolidation area).
Stop Loss (SL): Below $6.40 (A daily close below this level invalidates the bullish scenario).
Take Profit (TP):
TP 1: $7.60 (Nearest resistance)
TP 2: $8.50 – $9.19 (Upper target of the previous order block/gap zone).
Structure & Trend: The price is testing the support area around $7.00 – $7.21 after experiencing corrective selling pressure from the moving average area. A minor rejection has occurred, indicating buyers are attempting to defend the demand area.
Trading Signal (Long Setup):
Entry (Buy): $7.10 – $7.25 (Current support/consolidation area).
Stop Loss (SL): Below $6.40 (A daily close below this level invalidates the bullish scenario).
Take Profit (TP):
TP 1: $7.60 (Nearest resistance)
TP 2: $8.50 – $9.19 (Upper target of the previous order block/gap zone).
123
·
--
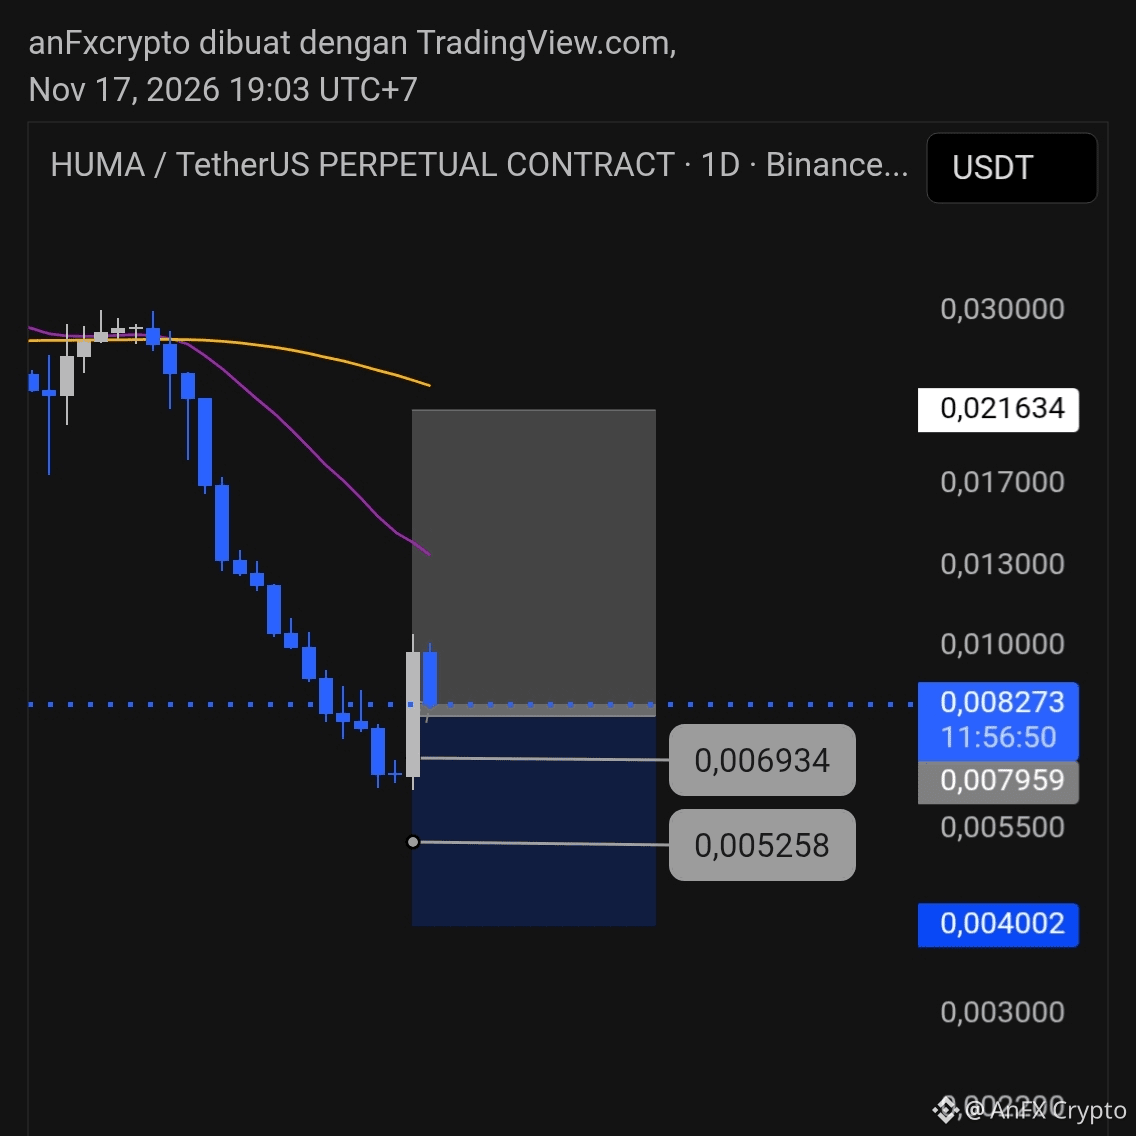
Technical Analysis of $HUMA /USDT Perpetual (Daily Chart):
Trend & Structure: The price is in a significant long-term bearish trend and has just hit a new all-time low (ATL) around $0.0062.
Volume Spike: A massive buying volume spike appeared on the latest daily candle near the lower support area, indicating a potential technical rebound or short-term accumulation.
Key Zones:
Support: $0.0052 – $0.0069
Nearest Resistance: $0.0082 – $0.0100
Trading Signal (Rebound / Short-Term Scalp):
Direction: Long / Buy on Dip (High Risk / Speculative)
Entry Area: $0.0073 – $0.0080
Take Profit (TP) Targets:
TP1: $0.0095
TP2: $0.0120
Stop Loss: Below $0.0051 (a break below this support would extend the downtrend)
{future}(HUMAUSDT)
Technical Analysis of $HUMA /USDT Perpetual (Daily Chart):
Trend & Structure: The price is in a significant long-term bearish trend and has just hit a new all-time low (ATL) around $0.0062.
Volume Spike: A massive buying volume spike appeared on the latest daily candle near the lower support area, indicating a potential technical rebound or short-term accumulation.
Key Zones:
Support: $0.0052 – $0.0069
Nearest Resistance: $0.0082 – $0.0100
Trading Signal (Rebound / Short-Term Scalp):
Direction: Long / Buy on Dip (High Risk / Speculative)
Entry Area: $0.0073 – $0.0080
Take Profit (TP) Targets:
TP1: $0.0095
TP2: $0.0120
Stop Loss: Below $0.0051 (a break below this support would extend the downtrend)
Trend & Structure: The price is in a significant long-term bearish trend and has just hit a new all-time low (ATL) around $0.0062.
Volume Spike: A massive buying volume spike appeared on the latest daily candle near the lower support area, indicating a potential technical rebound or short-term accumulation.
Key Zones:
Support: $0.0052 – $0.0069
Nearest Resistance: $0.0082 – $0.0100
Trading Signal (Rebound / Short-Term Scalp):
Direction: Long / Buy on Dip (High Risk / Speculative)
Entry Area: $0.0073 – $0.0080
Take Profit (TP) Targets:
TP1: $0.0095
TP2: $0.0120
Stop Loss: Below $0.0051 (a break below this support would extend the downtrend)
142
·
--
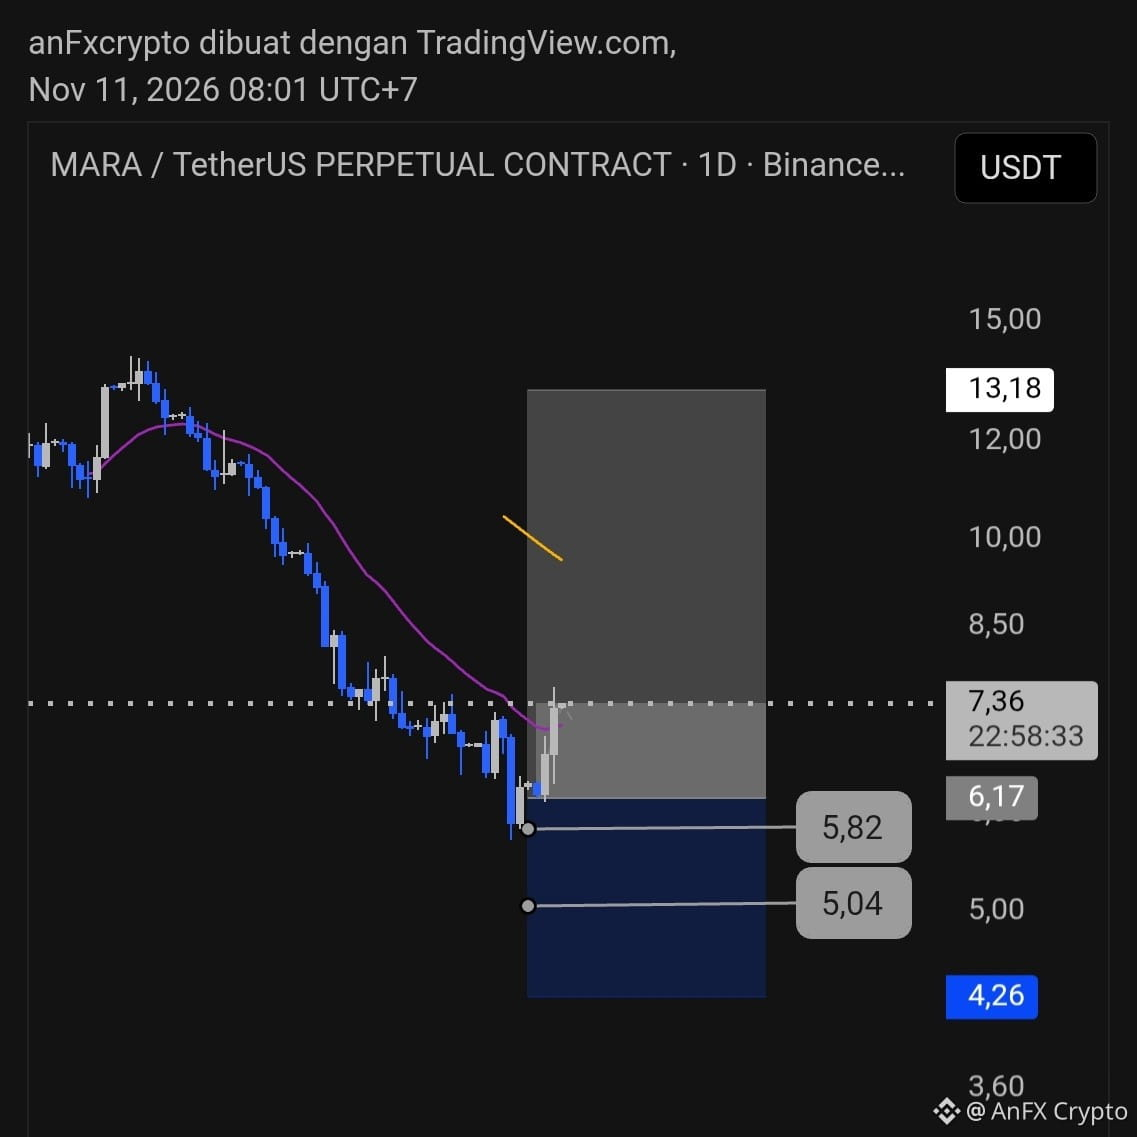
Technical Analysis ($MARA / USDT Perpetual - 1D):
Trend Structure: Price action is in a strong medium-term downtrend following a breakdown from the previous consolidation area, with dynamic resistance (purple line) continuing to push prices lower.
Price Action & Volume: A significant volume spike is visible in early November, indicating a selling climax or an accumulation attempt near the lower support area. The price is currently consolidating around $7.36 after bouncing from the crucial support area around $5.82 – $5.04.
Trading Signals:
Bias: Cautious Bearish / Potential Mean Reversion
Entry Zone: Wait for retest confirmation at $6.17 – $6.50 or
Take Profit (TP):
TP1: $8.50
TP2: $10.00
Stop Loss: Below $5.00 (if support is invalidated)
{future}(MARAUSDT)
Technical Analysis ($MARA / USDT Perpetual - 1D):
Trend Structure: Price action is in a strong medium-term downtrend following a breakdown from the previous consolidation area, with dynamic resistance (purple line) continuing to push prices lower.
Price Action & Volume: A significant volume spike is visible in early November, indicating a selling climax or an accumulation attempt near the lower support area. The price is currently consolidating around $7.36 after bouncing from the crucial support area around $5.82 – $5.04.
Trading Signals:
Bias: Cautious Bearish / Potential Mean Reversion
Entry Zone: Wait for retest confirmation at $6.17 – $6.50 or
Take Profit (TP):
TP1: $8.50
TP2: $10.00
Stop Loss: Below $5.00 (if support is invalidated)
Trend Structure: Price action is in a strong medium-term downtrend following a breakdown from the previous consolidation area, with dynamic resistance (purple line) continuing to push prices lower.
Price Action & Volume: A significant volume spike is visible in early November, indicating a selling climax or an accumulation attempt near the lower support area. The price is currently consolidating around $7.36 after bouncing from the crucial support area around $5.82 – $5.04.
Trading Signals:
Bias: Cautious Bearish / Potential Mean Reversion
Entry Zone: Wait for retest confirmation at $6.17 – $6.50 or
Take Profit (TP):
TP1: $8.50
TP2: $10.00
Stop Loss: Below $5.00 (if support is invalidated)
56
·
--
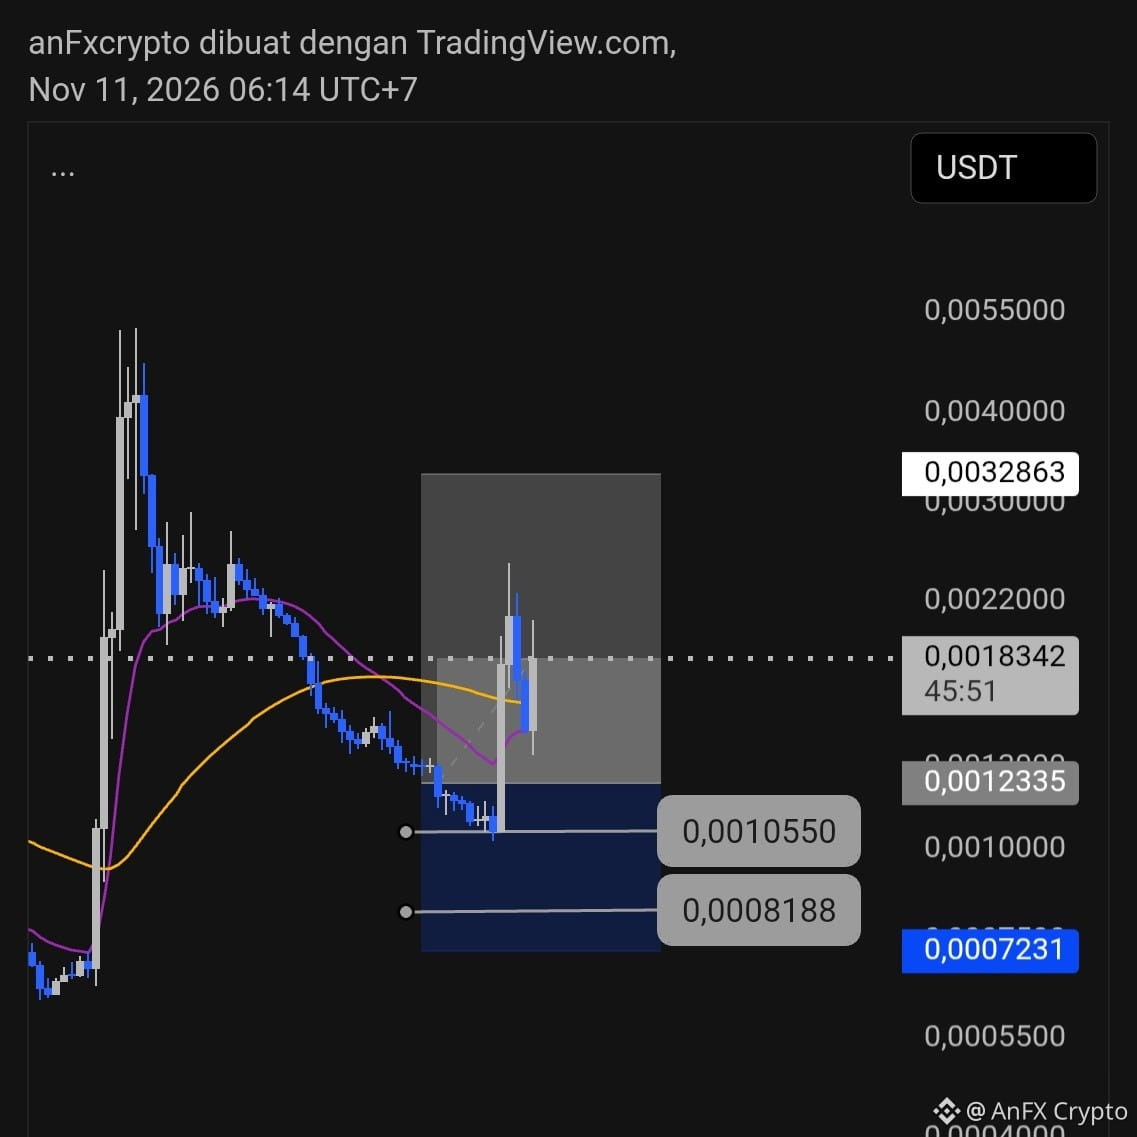
Technical Analysis: $ONE /USDT -(1D)
Market Structure & Price: The chart shows a significant volume spike (liquidity surge), followed by a sharp correction phase, before price eventually attempts to recover (rebound) from the lower support area.
Demand Zone (Demand Zone / Order Block): The blue box area around 0,0008188–0,0010550 acts as a strong support area where accumulation has taken place.
Moving Average (MA) Indicator: The indicator lines show a potential crossover after a long consolidation phase at the bottom, suggesting a possible start to a short-term uptrend (bullish continuation).
Risk Management: Given this asset's very high volatility (meme coin or micro-cap altcoin category), price movements are vulnerable to liquidity manipulation (stop hunting).
Trading Signals & Plan (Setup):
Signal Type: Buy on Weakness / Long Entry (Speculative)
Entry Zone: 0,0010000–0,0011500 (near the blue-box support area or upon confirmation of a pullback)
Take-Profit Targets (TP):
TP 1: 0,0018342 (dashed-line resistance)
TP 2: 0,0022000
TP 3: 0,0032863 (maximum target in the upper area)
Stop Loss (SL): Below 0,0007800 (if price validly breaks through the lower demand area).
Risk Note: Always use strict risk management (a minimum risk-to-reward ratio of 1:2) and adjust position sizing, as small-cap assets carry high liquidity risk.
{future}(ONEUSDT)
Technical Analysis: $ONE /USDT -(1D)
Market Structure & Price: The chart shows a significant volume spike (liquidity surge), followed by a sharp correction phase, before price eventually attempts to recover (rebound) from the lower support area.
Demand Zone (Demand Zone / Order Block): The blue box area around 0,0008188–0,0010550 acts as a strong support area where accumulation has taken place.
Moving Average (MA) Indicator: The indicator lines show a potential crossover after a long consolidation phase at the bottom, suggesting a possible start to a short-term uptrend (bullish continuation).
Risk Management: Given this asset's very high volatility (meme coin or micro-cap altcoin category), price movements are vulnerable to liquidity manipulation (stop hunting).
Trading Signals & Plan (Setup):
Signal Type: Buy on Weakness / Long Entry (Speculative)
Entry Zone: 0,0010000–0,0011500 (near the blue-box support area or upon confirmation of a pullback)
Take-Profit Targets (TP):
TP 1: 0,0018342 (dashed-line resistance)
TP 2: 0,0022000
TP 3: 0,0032863 (maximum target in the upper area)
Stop Loss (SL): Below 0,0007800 (if price validly breaks through the lower demand area).
Risk Note: Always use strict risk management (a minimum risk-to-reward ratio of 1:2) and adjust position sizing, as small-cap assets carry high liquidity risk.
Market Structure & Price: The chart shows a significant volume spike (liquidity surge), followed by a sharp correction phase, before price eventually attempts to recover (rebound) from the lower support area.
Demand Zone (Demand Zone / Order Block): The blue box area around 0,0008188–0,0010550 acts as a strong support area where accumulation has taken place.
Moving Average (MA) Indicator: The indicator lines show a potential crossover after a long consolidation phase at the bottom, suggesting a possible start to a short-term uptrend (bullish continuation).
Risk Management: Given this asset's very high volatility (meme coin or micro-cap altcoin category), price movements are vulnerable to liquidity manipulation (stop hunting).
Trading Signals & Plan (Setup):
Signal Type: Buy on Weakness / Long Entry (Speculative)
Entry Zone: 0,0010000–0,0011500 (near the blue-box support area or upon confirmation of a pullback)
Take-Profit Targets (TP):
TP 1: 0,0018342 (dashed-line resistance)
TP 2: 0,0022000
TP 3: 0,0032863 (maximum target in the upper area)
Stop Loss (SL): Below 0,0007800 (if price validly breaks through the lower demand area).
Risk Note: Always use strict risk management (a minimum risk-to-reward ratio of 1:2) and adjust position sizing, as small-cap assets carry high liquidity risk.
201
·
--
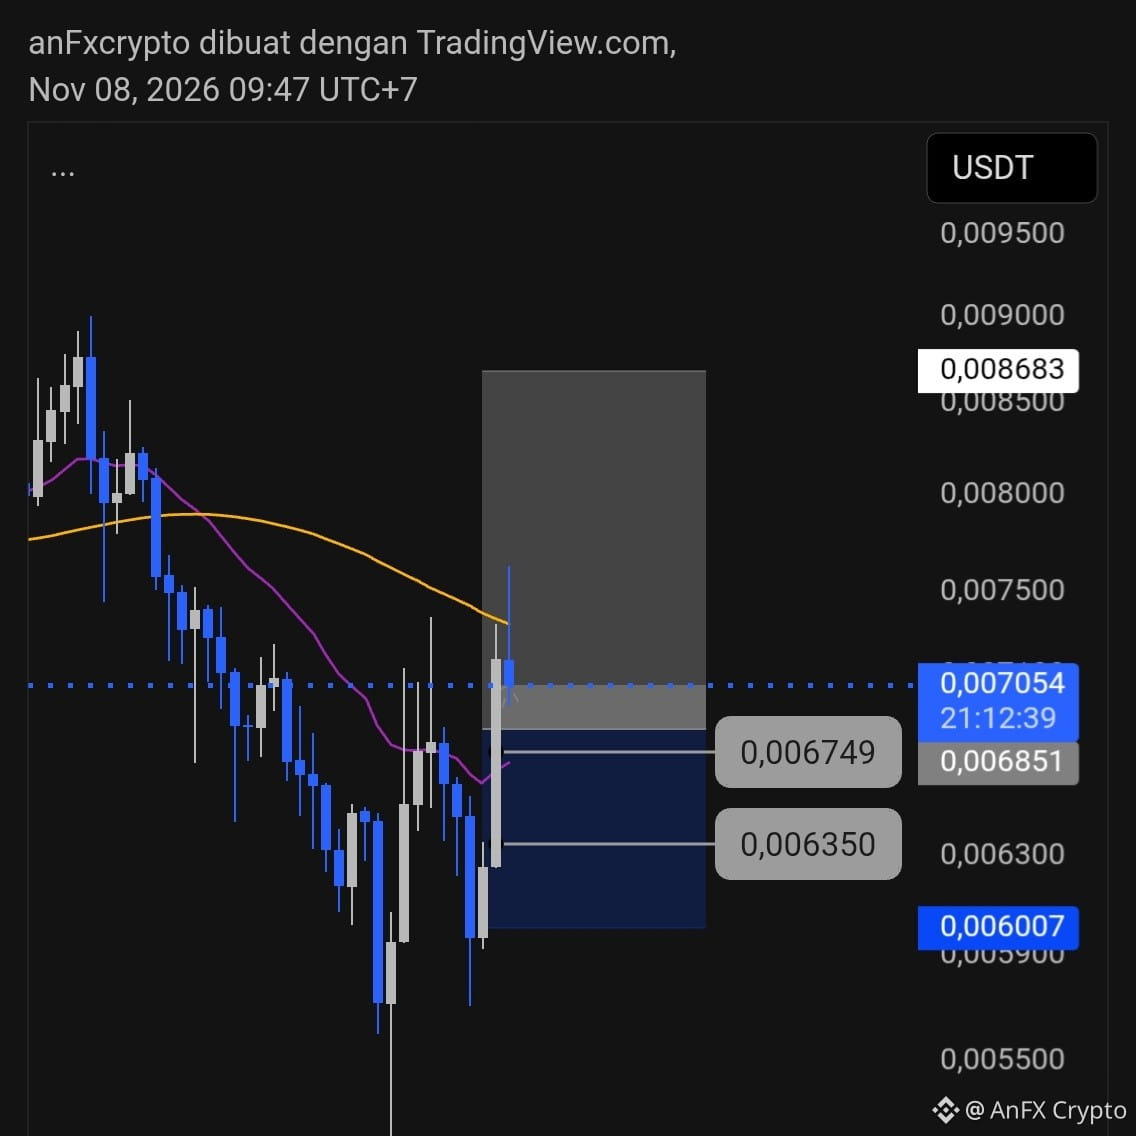
Technical analysis $SWARMS /USDT (1D)
Trend & Structure Analysis: A significant spike in buying volume is visible in early November, triggering a reversal from the downtrend (confirmed by a moving average breakout). The blue box area indicates a potential support zone or order block.
Trading Signal (Long / Buy):
Entry / Buy Area: 0.006350 - 0.006749
Stop Loss: Below 0.006007
Take Profit: 0.008500 - 0.008683
{future}(SWARMSUSDT)
Technical analysis $SWARMS /USDT (1D)
Trend & Structure Analysis: A significant spike in buying volume is visible in early November, triggering a reversal from the downtrend (confirmed by a moving average breakout). The blue box area indicates a potential support zone or order block.
Trading Signal (Long / Buy):
Entry / Buy Area: 0.006350 - 0.006749
Stop Loss: Below 0.006007
Take Profit: 0.008500 - 0.008683
Trend & Structure Analysis: A significant spike in buying volume is visible in early November, triggering a reversal from the downtrend (confirmed by a moving average breakout). The blue box area indicates a potential support zone or order block.
Trading Signal (Long / Buy):
Entry / Buy Area: 0.006350 - 0.006749
Stop Loss: Below 0.006007
Take Profit: 0.008500 - 0.008683
228
Log in to explore more content
Join global crypto users on Binance Square
⚡️ Get latest and useful information about crypto.
💬 Trusted by the world’s largest crypto exchange.
👍 Discover real insights from verified creators.
Email / Phone number
Trending Topics
IsAnthropic’s$1.5TMarketCapJustified?
24,093 views
125 Discussing
Anthropic Set to Open at $105 in Record Nasdaq Debut
Binance News
·12 Likes
·17.1k views
13FInstitutionsBitcoinSpotETPHoldingsHitRecord
1,598 views
41 Discussing
BTCRemainsUnderPressureAfterHawkishFOMCMinutes
300,060 views
2,239 Discussing