
Mek
916 Posts

Mek
Report
Block User
Trader Institutional & Analyst since 2018 · Binance KOL & BNBChain Martian. Building at Web3 and Sovereign Infrastructure.
Frequent Trader
5.3 Years
41 Following
2.8K+ Followers
1.7K+ Liked
Posts
All
Quotes
Videos
Live
·
--
Partly True

Article
Here’s an article about U.S. inflation and my take on the next FOMC.The inflation data that made the market start repricing rate hikes in September was, for the most part, its phone bill.
I'm not being ironic. The core of the U.S. CPI rose 0.29% in August.
Mobile telephony and lodging accounted for 14 of those 29 basis points.
All the rest of the American economy, taken together, came to about 15.
Two of the noisiest categories in the index did half the work on their own.
In the supercore it was worse. Up 0.51% over the month, with 29 basis points coming only from telephony. More than half of a single item.
Here’s an article about U.S. inflation and my take on the next FOMC.
The inflation data that made the market start repricing rate hikes in September was, for the most part, its phone bill.
I'm not being ironic. The core of the U.S. CPI rose 0.29% in August.
Mobile telephony and lodging accounted for 14 of those 29 basis points.
All the rest of the American economy, taken together, came to about 15.
Two of the noisiest categories in the index did half the work on their own.
In the supercore it was worse. Up 0.51% over the month, with 29 basis points coming only from telephony. More than half of a single item.
I'm not being ironic. The core of the U.S. CPI rose 0.29% in August.
Mobile telephony and lodging accounted for 14 of those 29 basis points.
All the rest of the American economy, taken together, came to about 15.
Two of the noisiest categories in the index did half the work on their own.
In the supercore it was worse. Up 0.51% over the month, with 29 basis points coming only from telephony. More than half of a single item.
1
827
·
--
🎙️ 📈 Trading & Coffee - Institutional Analysis (Pt-BR)

End
01 h 11 m 34 s
44
ETHUSDT
Perp
Market/Long
3
0
·
--
Verified
The US CPI for August came out at 3.4% year-over-year over the past 12 months, in line with expectations and the same as the previous month. 🚨
Core CPI fell to 2.4%, also in line, down from 2.5%.
On the monthly change, headline CPI rose 0.4%. Biggest monthly increase since May 2026.
Note that the core trend is still DECELERATION.
Even with the doomers saying there would now be a new upswing in inflation. Always remember to understand the data, not just Twitter narratives.
Overall, the numbers are pretty neutral. It should increase the market’s uncertainty about interest rates, and the real effect will be the middle path.
In other words, rates unchanged. I’ll bring an analysis on this later. #CPIWatch
The US CPI for August came out at 3.4% year-over-year over the past 12 months, in line with expectations and the same as the previous month. 🚨
Core CPI fell to 2.4%, also in line, down from 2.5%.
On the monthly change, headline CPI rose 0.4%. Biggest monthly increase since May 2026.
Note that the core trend is still DECELERATION.
Even with the doomers saying there would now be a new upswing in inflation. Always remember to understand the data, not just Twitter narratives.
Overall, the numbers are pretty neutral. It should increase the market’s uncertainty about interest rates, and the real effect will be the middle path.
In other words, rates unchanged. I’ll bring an analysis on this later. #CPIWatch
Core CPI fell to 2.4%, also in line, down from 2.5%.
On the monthly change, headline CPI rose 0.4%. Biggest monthly increase since May 2026.
Note that the core trend is still DECELERATION.
Even with the doomers saying there would now be a new upswing in inflation. Always remember to understand the data, not just Twitter narratives.
Overall, the numbers are pretty neutral. It should increase the market’s uncertainty about interest rates, and the real effect will be the middle path.
In other words, rates unchanged. I’ll bring an analysis on this later. #CPIWatch

2
2
1.4k
·
--
Bullish
Retail sold early in 2023. And it seems to be doing exactly the same thing now. 🔥
The realized profit momentum from short-term investors has surged to the highest peak since the beginning of 2024.
Anyone who bought bitcoin in recent months rushed to sell when the price neared ~US$ 79 thousand.
This has happened before, and in the same way.
January 2023. Bitcoin leaving US$ 16 thousand, with the FTX corpse still on the ground.
The same indicator exploded. Retail handed over coins on the first decent rally, convinced it was a bear market bounce.
A little more than two years later, the price was at US$ 120 thousand.
Will we see something similar again now?
{future}(BTCUSDT)
Retail sold early in 2023. And it seems to be doing exactly the same thing now. 🔥
The realized profit momentum from short-term investors has surged to the highest peak since the beginning of 2024.
Anyone who bought bitcoin in recent months rushed to sell when the price neared ~US$ 79 thousand.
This has happened before, and in the same way.
January 2023. Bitcoin leaving US$ 16 thousand, with the FTX corpse still on the ground.
The same indicator exploded. Retail handed over coins on the first decent rally, convinced it was a bear market bounce.
A little more than two years later, the price was at US$ 120 thousand.
Will we see something similar again now?
The realized profit momentum from short-term investors has surged to the highest peak since the beginning of 2024.
Anyone who bought bitcoin in recent months rushed to sell when the price neared ~US$ 79 thousand.
This has happened before, and in the same way.
January 2023. Bitcoin leaving US$ 16 thousand, with the FTX corpse still on the ground.
The same indicator exploded. Retail handed over coins on the first decent rally, convinced it was a bear market bounce.
A little more than two years later, the price was at US$ 120 thousand.
Will we see something similar again now?

1
780
·
--
Verified
The global commodities index is up 30% since the end of February and is at its highest level in 18 years.🚨
It’s only 10% below the 2008 record. And it’s not just energy.
International oil is more than 30% above Iran’s pre-war level.
European and Asian natural gas has more than doubled. Copper hit a 7-month high.
The easy reading here would be to say that this forces the Fed to raise interest rates. But interest rates don’t fix a logistics chain broken by war.
A supply shock doesn’t respond to monetary policy—it only shows up in the index and disappears when supply normalizes.
And there’s a detail that almost nobody is considering.
The cost of capital is already high on its own, with the 30-year yield near the highest since 2007.
The long-end curve is already doing the tightening the Fed would have to do.
Rates are not going to fall now, but the room to rise is getting more and more limited. Higher for longer.
The global commodities index is up 30% since the end of February and is at its highest level in 18 years.🚨
It’s only 10% below the 2008 record. And it’s not just energy.
International oil is more than 30% above Iran’s pre-war level.
European and Asian natural gas has more than doubled. Copper hit a 7-month high.
The easy reading here would be to say that this forces the Fed to raise interest rates. But interest rates don’t fix a logistics chain broken by war.
A supply shock doesn’t respond to monetary policy—it only shows up in the index and disappears when supply normalizes.
And there’s a detail that almost nobody is considering.
The cost of capital is already high on its own, with the 30-year yield near the highest since 2007.
The long-end curve is already doing the tightening the Fed would have to do.
Rates are not going to fall now, but the room to rise is getting more and more limited. Higher for longer.
It’s only 10% below the 2008 record. And it’s not just energy.
International oil is more than 30% above Iran’s pre-war level.
European and Asian natural gas has more than doubled. Copper hit a 7-month high.
The easy reading here would be to say that this forces the Fed to raise interest rates. But interest rates don’t fix a logistics chain broken by war.
A supply shock doesn’t respond to monetary policy—it only shows up in the index and disappears when supply normalizes.
And there’s a detail that almost nobody is considering.
The cost of capital is already high on its own, with the 30-year yield near the highest since 2007.
The long-end curve is already doing the tightening the Fed would have to do.
Rates are not going to fall now, but the room to rise is getting more and more limited. Higher for longer.

1
1.3k
·
--
Verified
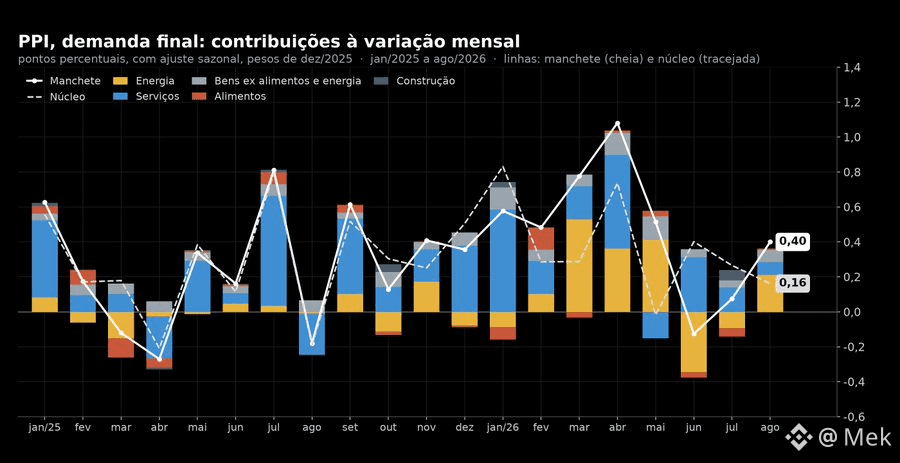
The PPI has three readings. The full PPI is the index of final demand, at 5.4% in the headlines. The core PPI excludes food and energy; it’s what appears on-screen as “Core PPI” and what the consensus is targeting. The core PPI ex margins excludes, in addition to food and energy, wholesale and retail margins; the official name is “final demand less foods, energy, and trade services”, and it’s the line the BLS highlights in the release, because trade margin is the most volatile component of the index. I will consider “core” to be the second one and “core ex margins” to be the third.
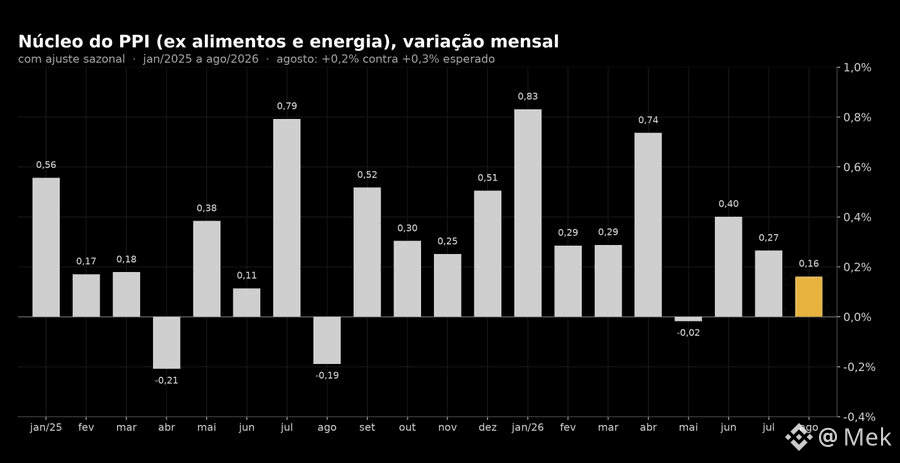
In August, core and core ex margins did not tell the same story. Core rose 0.16% versus 0.3% expected, the third month in a row of deceleration: 0.40 in June, 0.27 in July, and 0.16 now. Core ex margins rose 0.27%, in line with consensus of 0.3%, after 0.4% in July. The difference between the two lies in the trade margin, which fell 0.2% in the month and took about 0.04 of a point off core. The fuel retail margin collapsed 11.3%, and this is mechanical: when fuel rises at wholesale, retail takes time to pass it through, so the margin shrinks before it recomposes. Over twelve months, 4.6% in core, as expected, and 4.7% in core ex margins, unchanged from July. The 4.6% came from 4.3% due to base arithmetic: the −0.2% from August 2025 left the window and the +0.16% from August 2026 entered. The peak was 4.9% in April.
The same applies to the acceleration headline that the full PPI gained today. Over twelve months it went from 4.8% to 5.4%, but August 2025 had been −0.2% and August 2026 was +0.4%; swapping a negative month for a positive one accounts for the full 0.6 percentage points. The monthly pace of 0.4% was in line with/under the average monthly pace from the last year (0.44%).
In other words, today’s reading did not bring acceleration (only energy, for obvious reasons). Core has been decelerating for three months, core ex margins came in at consensus, and the full PPI’s 5.4% is a base swap: a −0.2 that exited and a +0.4 that entered.
The PPI has three readings. The full PPI is the index of final demand, at 5.4% in the headlines. The core PPI excludes food and energy; it’s what appears on-screen as “Core PPI” and what the consensus is targeting. The core PPI ex margins excludes, in addition to food and energy, wholesale and retail margins; the official name is “final demand less foods, energy, and trade services”, and it’s the line the BLS highlights in the release, because trade margin is the most volatile component of the index. I will consider “core” to be the second one and “core ex margins” to be the third.
In August, core and core ex margins did not tell the same story. Core rose 0.16% versus 0.3% expected, the third month in a row of deceleration: 0.40 in June, 0.27 in July, and 0.16 now. Core ex margins rose 0.27%, in line with consensus of 0.3%, after 0.4% in July. The difference between the two lies in the trade margin, which fell 0.2% in the month and took about 0.04 of a point off core. The fuel retail margin collapsed 11.3%, and this is mechanical: when fuel rises at wholesale, retail takes time to pass it through, so the margin shrinks before it recomposes. Over twelve months, 4.6% in core, as expected, and 4.7% in core ex margins, unchanged from July. The 4.6% came from 4.3% due to base arithmetic: the −0.2% from August 2025 left the window and the +0.16% from August 2026 entered. The peak was 4.9% in April.
The same applies to the acceleration headline that the full PPI gained today. Over twelve months it went from 4.8% to 5.4%, but August 2025 had been −0.2% and August 2026 was +0.4%; swapping a negative month for a positive one accounts for the full 0.6 percentage points. The monthly pace of 0.4% was in line with/under the average monthly pace from the last year (0.44%).
In other words, today’s reading did not bring acceleration (only energy, for obvious reasons). Core has been decelerating for three months, core ex margins came in at consensus, and the full PPI’s 5.4% is a base swap: a −0.2 that exited and a +0.4 that entered.
In August, core and core ex margins did not tell the same story. Core rose 0.16% versus 0.3% expected, the third month in a row of deceleration: 0.40 in June, 0.27 in July, and 0.16 now. Core ex margins rose 0.27%, in line with consensus of 0.3%, after 0.4% in July. The difference between the two lies in the trade margin, which fell 0.2% in the month and took about 0.04 of a point off core. The fuel retail margin collapsed 11.3%, and this is mechanical: when fuel rises at wholesale, retail takes time to pass it through, so the margin shrinks before it recomposes. Over twelve months, 4.6% in core, as expected, and 4.7% in core ex margins, unchanged from July. The 4.6% came from 4.3% due to base arithmetic: the −0.2% from August 2025 left the window and the +0.16% from August 2026 entered. The peak was 4.9% in April.
The same applies to the acceleration headline that the full PPI gained today. Over twelve months it went from 4.8% to 5.4%, but August 2025 had been −0.2% and August 2026 was +0.4%; swapping a negative month for a positive one accounts for the full 0.6 percentage points. The monthly pace of 0.4% was in line with/under the average monthly pace from the last year (0.44%).
In other words, today’s reading did not bring acceleration (only energy, for obvious reasons). Core has been decelerating for three months, core ex margins came in at consensus, and the full PPI’s 5.4% is a base swap: a −0.2 that exited and a +0.4 that entered.
1
828
·
--
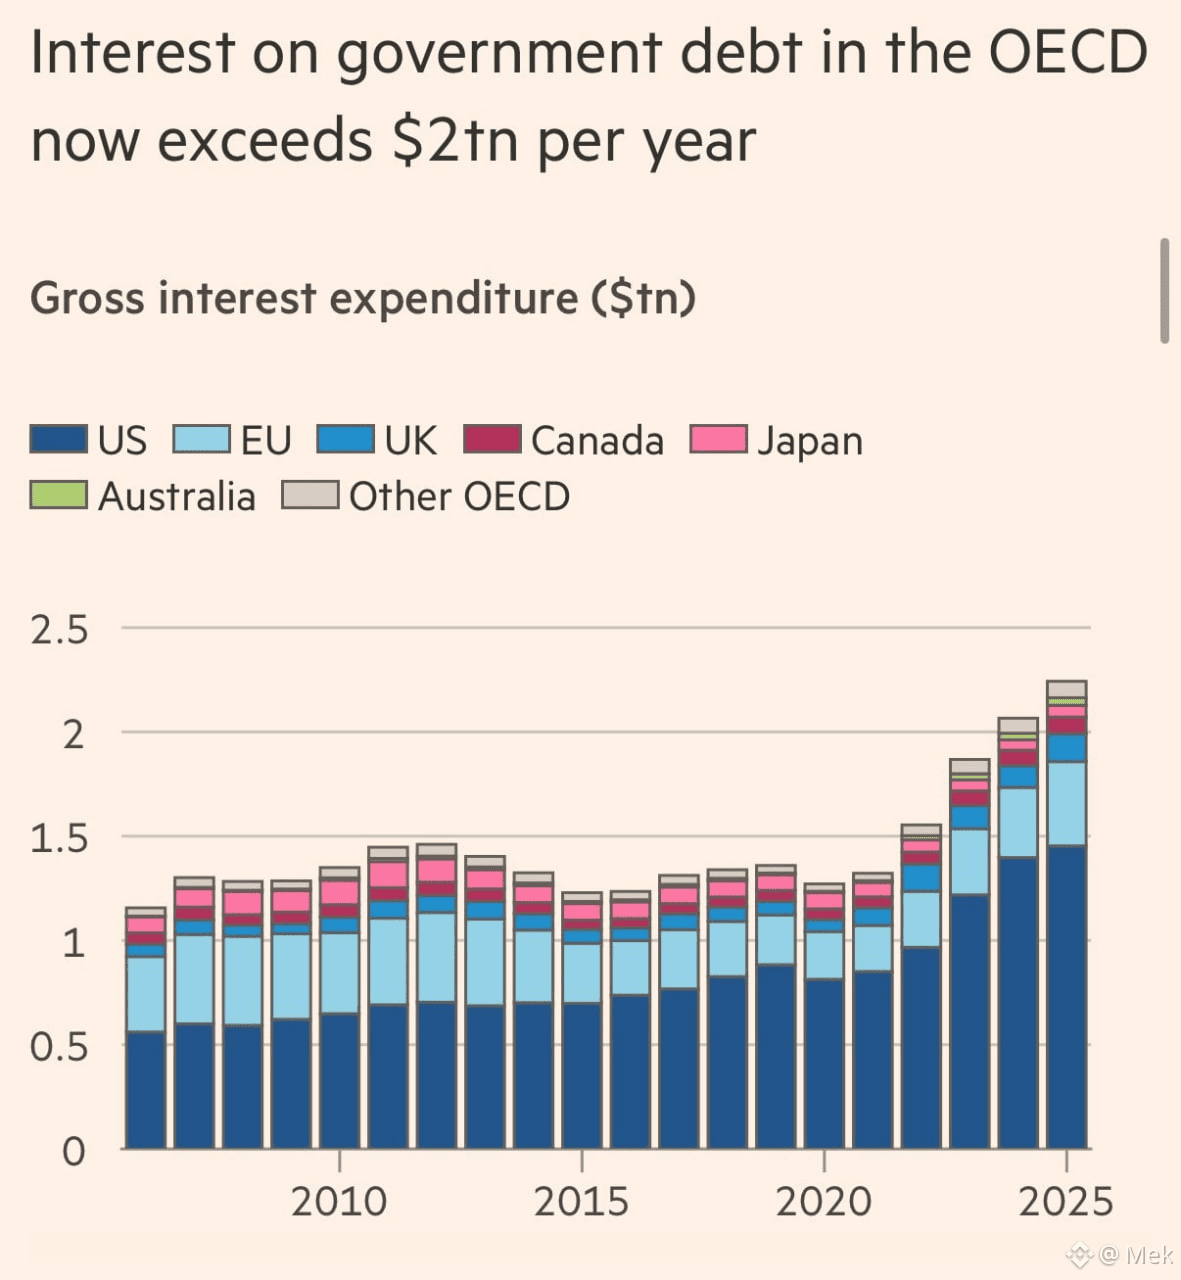
📊 The OECD countries now pay more than US$ 2 trillion per year in just PUBLIC DEBT INTEREST.
This figure has stayed flat near US$ 1.2 trillion for more than a decade.
It doubled in about 4 years.
And the US alone accounts for US$ 1.5 trillion of that total.
What stands out is not the level, but the curve.
Each year of deficit becomes a new stock of debt, which needs to be rolled at today’s rate, not the one from 2015.
As long as the US 30-year yield is near its highest level since 2007, this bar can only go in one direction.
That’s exactly why the Treasury doubled its long-term debt buybacks last month.
You have a small window of time—and one that’s getting shorter—to understand what this really means.
The race for scarce assets is going to intensify!
📊 The OECD countries now pay more than US$ 2 trillion per year in just PUBLIC DEBT INTEREST.
This figure has stayed flat near US$ 1.2 trillion for more than a decade.
It doubled in about 4 years.
And the US alone accounts for US$ 1.5 trillion of that total.
What stands out is not the level, but the curve.
Each year of deficit becomes a new stock of debt, which needs to be rolled at today’s rate, not the one from 2015.
As long as the US 30-year yield is near its highest level since 2007, this bar can only go in one direction.
That’s exactly why the Treasury doubled its long-term debt buybacks last month.
You have a small window of time—and one that’s getting shorter—to understand what this really means.
The race for scarce assets is going to intensify!
This figure has stayed flat near US$ 1.2 trillion for more than a decade.
It doubled in about 4 years.
And the US alone accounts for US$ 1.5 trillion of that total.
What stands out is not the level, but the curve.
Each year of deficit becomes a new stock of debt, which needs to be rolled at today’s rate, not the one from 2015.
As long as the US 30-year yield is near its highest level since 2007, this bar can only go in one direction.
That’s exactly why the Treasury doubled its long-term debt buybacks last month.
You have a small window of time—and one that’s getting shorter—to understand what this really means.
The race for scarce assets is going to intensify!
1
241

·
--
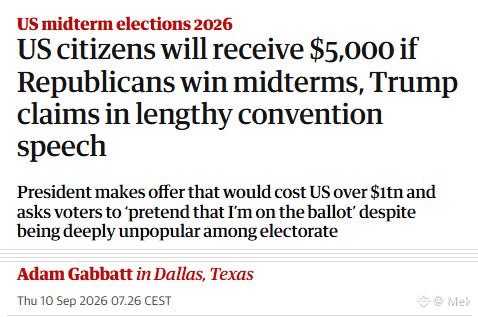
Trump promised US$ 5.000 for each adult American citizen if Republicans keep the House and the Senate.🤡
He called it the "Trump dividend".
The bill goes from US$ 1 trillion, according to estimates based on the census. It was not said where the money would come from.
Now put this into context.
The US already has US$ 40 trillion in gross debt, about 123% of GDP.
Annual spending just on interest hits US$ 1,25 trillion.
And the Treasury needed to double long-term debt buybacks last month just to keep the financing cost under control.
In other words: a US$ 1 trillion check would cost almost the same as the US already pays in interest in an entire year.
No matter who is in power, the direction is the same as what I’ve been showing here.
More spending, more debt, more issuance.
Are you sure you have enough scarce assets?
Trump promised US$ 5.000 for each adult American citizen if Republicans keep the House and the Senate.🤡
He called it the "Trump dividend".
The bill goes from US$ 1 trillion, according to estimates based on the census. It was not said where the money would come from.
Now put this into context.
The US already has US$ 40 trillion in gross debt, about 123% of GDP.
Annual spending just on interest hits US$ 1,25 trillion.
And the Treasury needed to double long-term debt buybacks last month just to keep the financing cost under control.
In other words: a US$ 1 trillion check would cost almost the same as the US already pays in interest in an entire year.
No matter who is in power, the direction is the same as what I’ve been showing here.
More spending, more debt, more issuance.
Are you sure you have enough scarce assets?
He called it the "Trump dividend".
The bill goes from US$ 1 trillion, according to estimates based on the census. It was not said where the money would come from.
Now put this into context.
The US already has US$ 40 trillion in gross debt, about 123% of GDP.
Annual spending just on interest hits US$ 1,25 trillion.
And the Treasury needed to double long-term debt buybacks last month just to keep the financing cost under control.
In other words: a US$ 1 trillion check would cost almost the same as the US already pays in interest in an entire year.
No matter who is in power, the direction is the same as what I’ve been showing here.
More spending, more debt, more issuance.
Are you sure you have enough scarce assets?
1
254
·
--
Verified
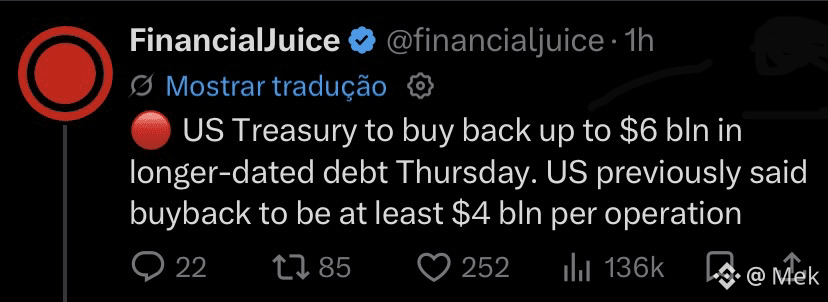
🚨 TREASURY ANNOUNCES $6 BILLION BUYBACKS THIS THURSDAY
This only scratches the surface of this current long-term debt. The volume will keep rising until it actually has some effect on the long end.
Hopefully by then you’ll already know what this means.
🚨 TREASURY ANNOUNCES $6 BILLION BUYBACKS THIS THURSDAY
This only scratches the surface of this current long-term debt. The volume will keep rising until it actually has some effect on the long end.
Hopefully by then you’ll already know what this means.
This only scratches the surface of this current long-term debt. The volume will keep rising until it actually has some effect on the long end.
Hopefully by then you’ll already know what this means.
2
1
308
·
--
Verified
And even so, there are still many investors looking only at the FED’s interest rate to understand the market.
They couldn’t be more out of touch. A tunnel vision, perhaps.
The name of the game now is duration.
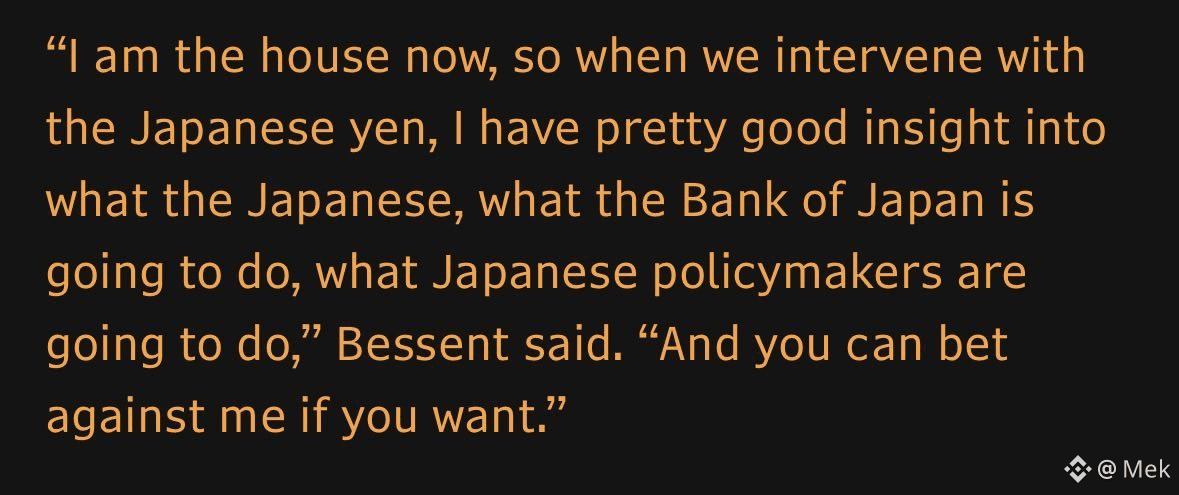
The intervention Bessent is making on the long end happens precisely when central banks—like Japan—continue to be offloading treasuries.
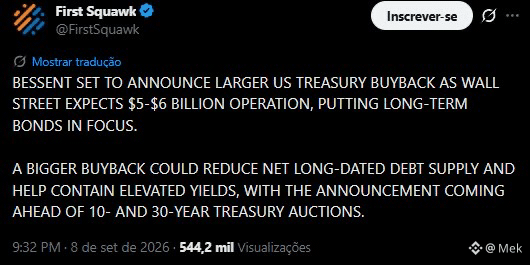
The $4 BILLION that were announced are just the tip of the iceberg. Much more issuance of t-bills will be needed (maybe triple, quadruple?).
And when t-bills are issued to buy long-dated securities, that’s a duration swap in the collateral.
Mainly in MMFs and shadow banking, they’ll feel this effect. Assets that work "almost like money".
So you’re following an analyst trying to figure out only what the FED will do with rates at the next meeting? Then just know you’re looking at half the market.
And even so, there are still many investors looking only at the FED’s interest rate to understand the market.
They couldn’t be more out of touch. A tunnel vision, perhaps.
The name of the game now is duration.
The intervention Bessent is making on the long end happens precisely when central banks—like Japan—continue to be offloading treasuries.
The $4 BILLION that were announced are just the tip of the iceberg. Much more issuance of t-bills will be needed (maybe triple, quadruple?).
And when t-bills are issued to buy long-dated securities, that’s a duration swap in the collateral.
Mainly in MMFs and shadow banking, they’ll feel this effect. Assets that work "almost like money".
So you’re following an analyst trying to figure out only what the FED will do with rates at the next meeting? Then just know you’re looking at half the market.
They couldn’t be more out of touch. A tunnel vision, perhaps.
The name of the game now is duration.
The intervention Bessent is making on the long end happens precisely when central banks—like Japan—continue to be offloading treasuries.
The $4 BILLION that were announced are just the tip of the iceberg. Much more issuance of t-bills will be needed (maybe triple, quadruple?).
And when t-bills are issued to buy long-dated securities, that’s a duration swap in the collateral.
Mainly in MMFs and shadow banking, they’ll feel this effect. Assets that work "almost like money".
So you’re following an analyst trying to figure out only what the FED will do with rates at the next meeting? Then just know you’re looking at half the market.
1
573
·
--
Verified
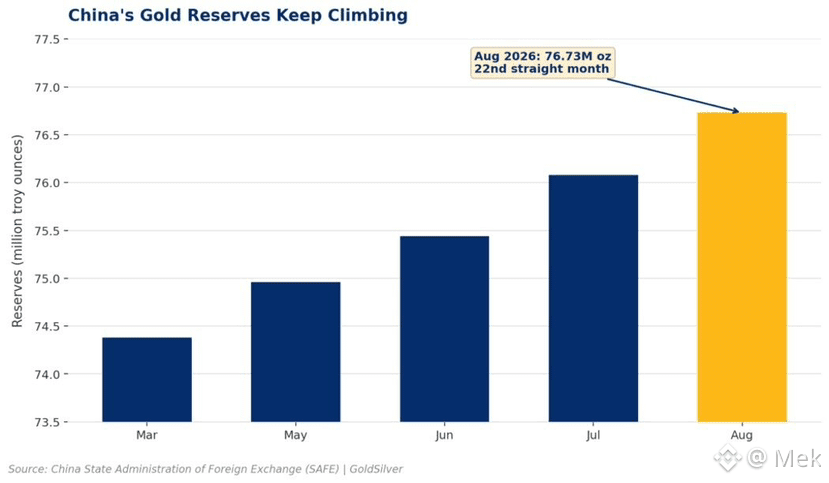
China has already bought more gold in 8 months of 2026 than in all of 2025.🚨
It was 80 tons versus 29 in the entire previous year.
Just in August, it was 20 tons—matching the highest monthly purchase since October 2023—and marking the 22nd consecutive month of buying.
Total reserves hit a record of 2,387 tons, or 76.73 million troy ounces.
And this is only the official figure.
Goldman Sachs estimates via the London OTC market suggest that the actual purchase is more than double what has been reported in some months.
The race for scarce assets continues to intensify.
China has already bought more gold in 8 months of 2026 than in all of 2025.🚨
It was 80 tons versus 29 in the entire previous year.
Just in August, it was 20 tons—matching the highest monthly purchase since October 2023—and marking the 22nd consecutive month of buying.
Total reserves hit a record of 2,387 tons, or 76.73 million troy ounces.
And this is only the official figure.
Goldman Sachs estimates via the London OTC market suggest that the actual purchase is more than double what has been reported in some months.
The race for scarce assets continues to intensify.
It was 80 tons versus 29 in the entire previous year.
Just in August, it was 20 tons—matching the highest monthly purchase since October 2023—and marking the 22nd consecutive month of buying.
Total reserves hit a record of 2,387 tons, or 76.73 million troy ounces.
And this is only the official figure.
Goldman Sachs estimates via the London OTC market suggest that the actual purchase is more than double what has been reported in some months.
The race for scarce assets continues to intensify.
2
1.2k
·
--
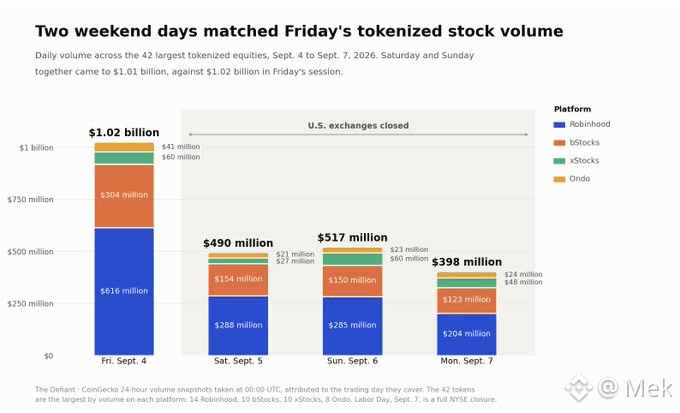
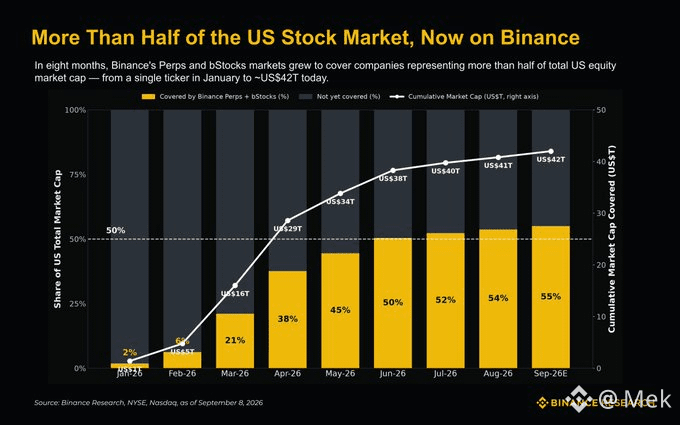
Wall Street is still closing. On Binance, that no longer exists.
In 8 months, Perps and bStocks went from 1 ticker in January to covering more than half of the U.S. equity market.
Look at the excerpt of @Binance_Research :
• ~US$ 42T out of ~US$ 76T of the U.S. market cap is already covered
• From 2% in Jan/26 to 55% now
• Mega caps, financials, health, consumer, semiconductors, and the AI core of the cycle
• A 24×7 market. No trading session wait.
The point almost nobody discusses: who’s getting into this isn’t the New York desk.
It’s a newer profile—emerging markets—accumulating exposure to U.S. stocks through Binance. A small slice. An access that a traditional broker never provided at this hour.
Tokenized stock holders doubled in August. BNB Chain is part of the mix that concentrates 95% of these holders, along with Solana and Robinhood Chain.
The thesis is simple.
This isn’t “crypto vs. stock.”
It’s U.S. equities running on the same track you already trade $BTC and $BNB
Anyone still waiting for the market to open at 10 a.m. is trading yesterday’s market. #bStocks
Wall Street is still closing. On Binance, that no longer exists.
In 8 months, Perps and bStocks went from 1 ticker in January to covering more than half of the U.S. equity market.
Look at the excerpt of @Binance Research :
• ~US$ 42T out of ~US$ 76T of the U.S. market cap is already covered
• From 2% in Jan/26 to 55% now
• Mega caps, financials, health, consumer, semiconductors, and the AI core of the cycle
• A 24×7 market. No trading session wait.
The point almost nobody discusses: who’s getting into this isn’t the New York desk.
It’s a newer profile—emerging markets—accumulating exposure to U.S. stocks through Binance. A small slice. An access that a traditional broker never provided at this hour.
Tokenized stock holders doubled in August. BNB Chain is part of the mix that concentrates 95% of these holders, along with Solana and Robinhood Chain.
The thesis is simple.
This isn’t “crypto vs. stock.”
It’s U.S. equities running on the same track you already trade $BTC and $BNB
Anyone still waiting for the market to open at 10 a.m. is trading yesterday’s market. #bStocks
In 8 months, Perps and bStocks went from 1 ticker in January to covering more than half of the U.S. equity market.
Look at the excerpt of @Binance Research :
• ~US$ 42T out of ~US$ 76T of the U.S. market cap is already covered
• From 2% in Jan/26 to 55% now
• Mega caps, financials, health, consumer, semiconductors, and the AI core of the cycle
• A 24×7 market. No trading session wait.
The point almost nobody discusses: who’s getting into this isn’t the New York desk.
It’s a newer profile—emerging markets—accumulating exposure to U.S. stocks through Binance. A small slice. An access that a traditional broker never provided at this hour.
Tokenized stock holders doubled in August. BNB Chain is part of the mix that concentrates 95% of these holders, along with Solana and Robinhood Chain.
The thesis is simple.
This isn’t “crypto vs. stock.”
It’s U.S. equities running on the same track you already trade $BTC and $BNB
Anyone still waiting for the market to open at 10 a.m. is trading yesterday’s market. #bStocks
2
1
484
·
--
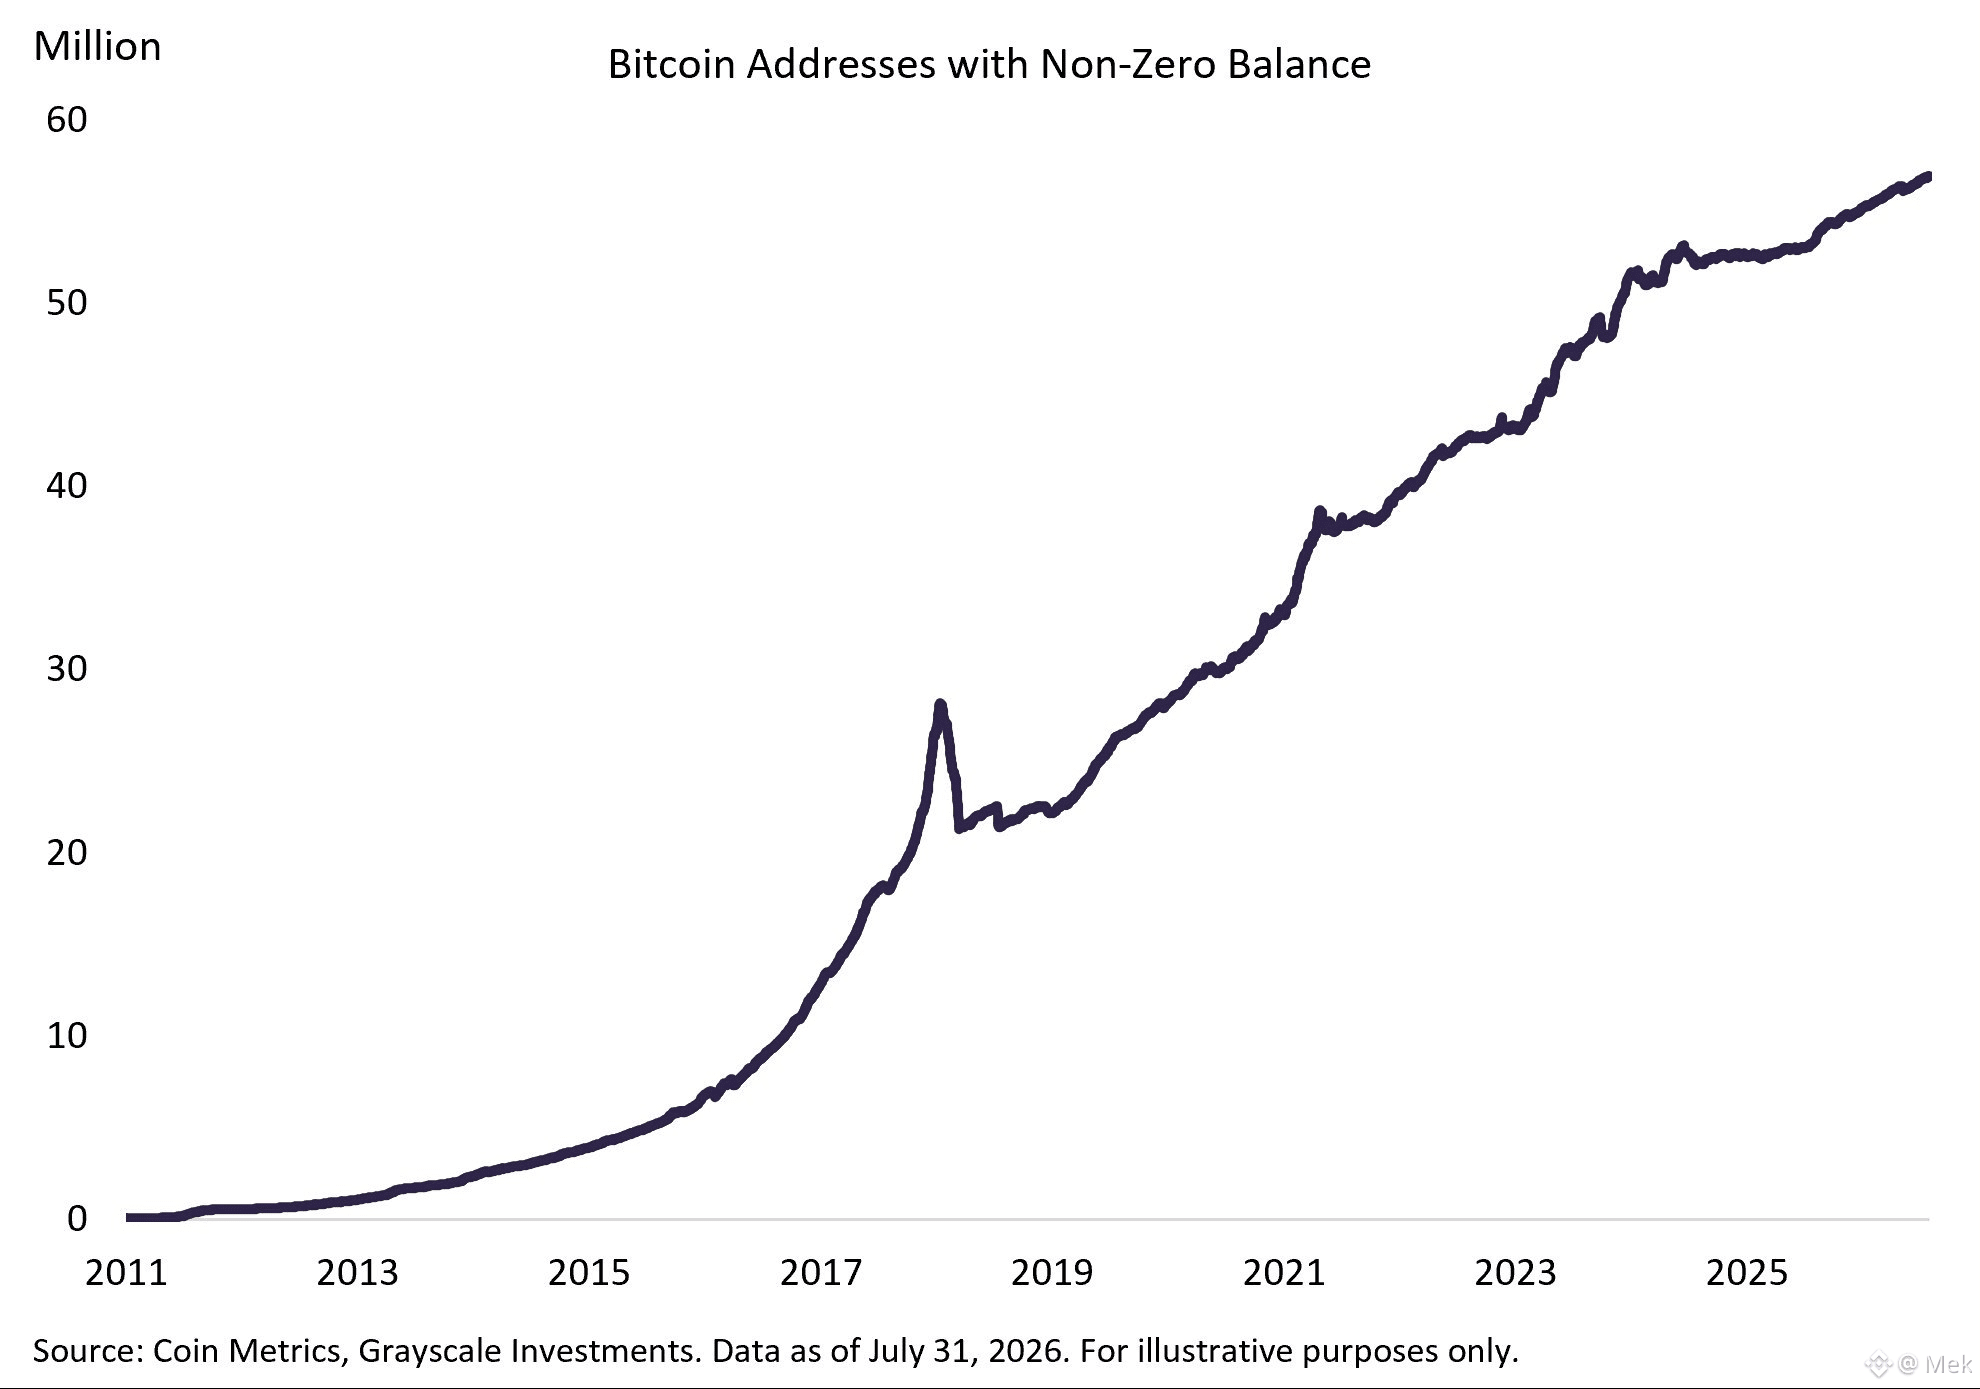
The number of Bitcoin holders continues to increase.
The number of Bitcoin holders continues to increase.
2
540
·
--
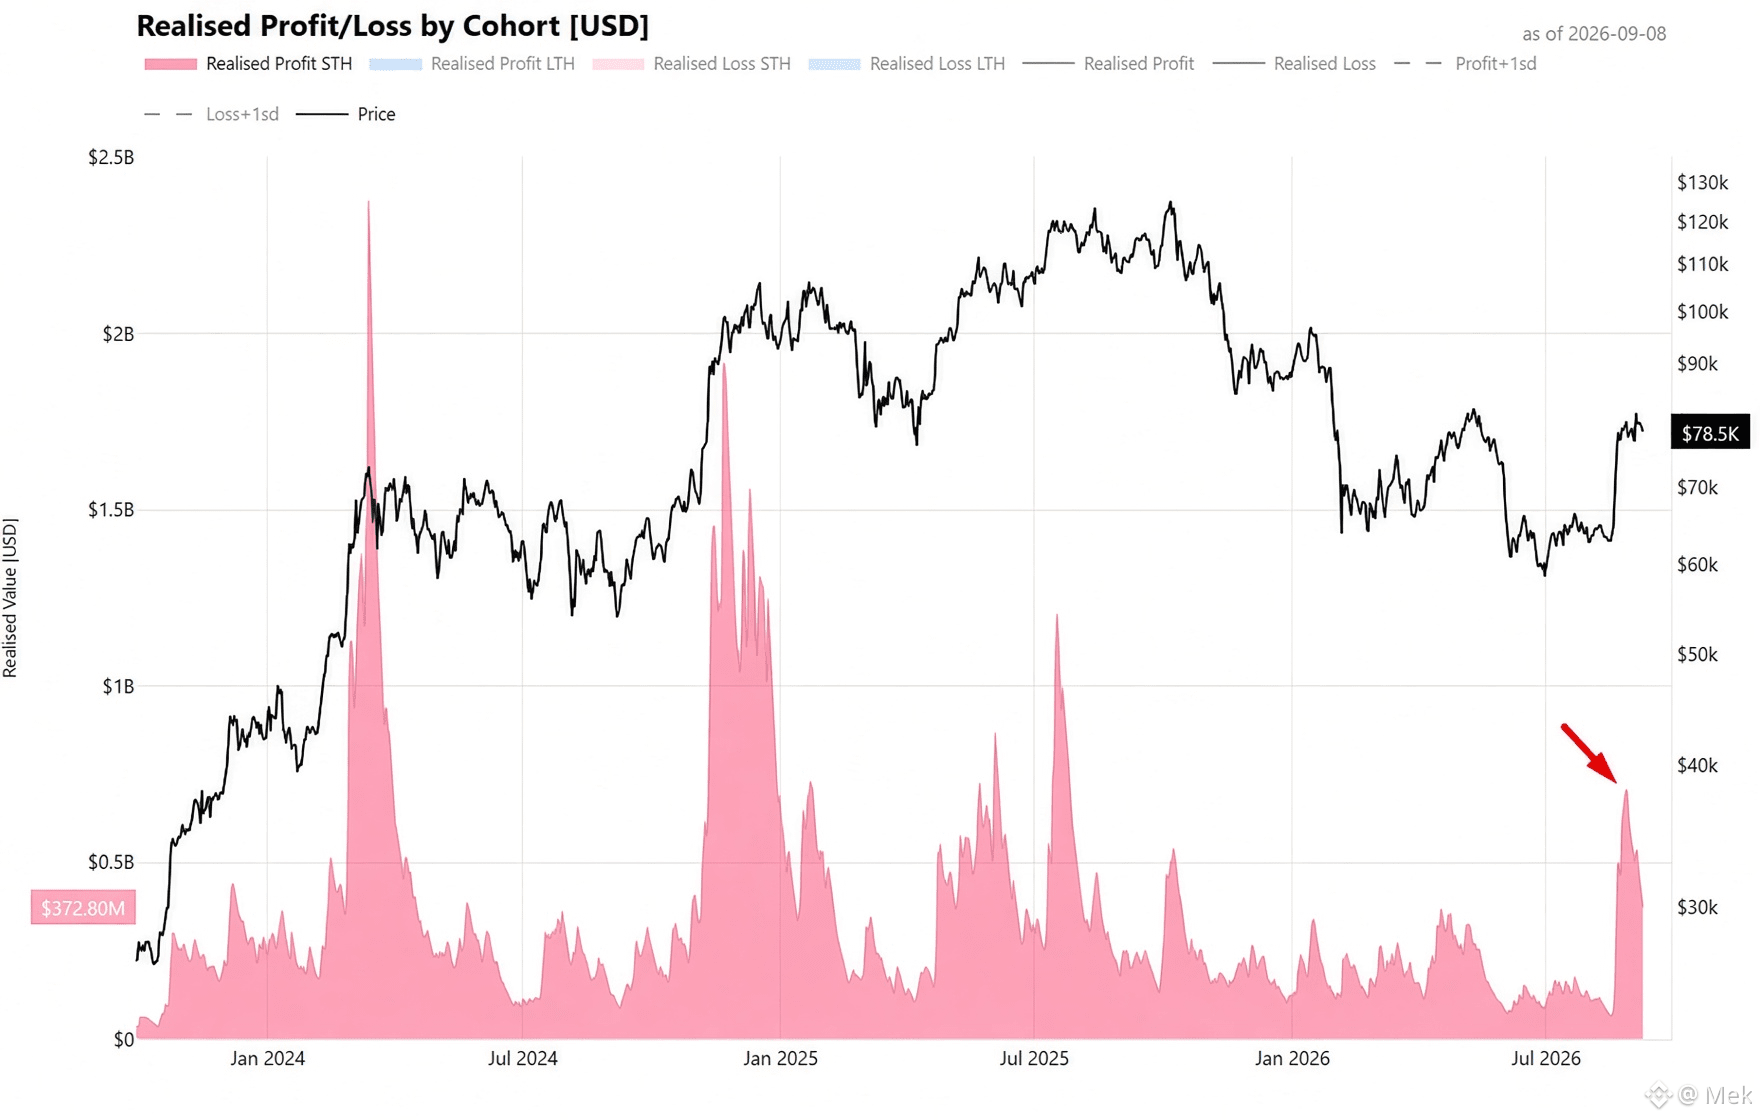
Short-term holders will realize about US$ 700 million in profit on the first leg of the rally.🚨
Weak hands leaving before the move has even had a chance to confirm on bitcoin.
This is the biggest realization peak since July 2025, and it showed up right at the start of the rally—not near the top.
The prior pattern shows the opposite: in January 2025 and July 2025, realization peaks came after months of accumulated gains, when the price was already stretched.
Anyone who bought near the July bottom is exiting with only a few percentage points in profit.
This is the classic behavior of people who entered without conviction and treat any rally as an opportunity to escape at emotionally flat “zero to zero.”
This exact structure creates the "rallies of disbelief" and keeps feeding further rallies. I’ll explain this in detail in today’s analyses.
Short-term holders will realize about US$ 700 million in profit on the first leg of the rally.🚨
Weak hands leaving before the move has even had a chance to confirm on bitcoin.
This is the biggest realization peak since July 2025, and it showed up right at the start of the rally—not near the top.
The prior pattern shows the opposite: in January 2025 and July 2025, realization peaks came after months of accumulated gains, when the price was already stretched.
Anyone who bought near the July bottom is exiting with only a few percentage points in profit.
This is the classic behavior of people who entered without conviction and treat any rally as an opportunity to escape at emotionally flat “zero to zero.”
This exact structure creates the "rallies of disbelief" and keeps feeding further rallies. I’ll explain this in detail in today’s analyses.
Weak hands leaving before the move has even had a chance to confirm on bitcoin.
This is the biggest realization peak since July 2025, and it showed up right at the start of the rally—not near the top.
The prior pattern shows the opposite: in January 2025 and July 2025, realization peaks came after months of accumulated gains, when the price was already stretched.
Anyone who bought near the July bottom is exiting with only a few percentage points in profit.
This is the classic behavior of people who entered without conviction and treat any rally as an opportunity to escape at emotionally flat “zero to zero.”
This exact structure creates the "rallies of disbelief" and keeps feeding further rallies. I’ll explain this in detail in today’s analyses.
2
1k
·
--
Verified
The middle path is the most likely, and many people aren’t managing to understand that.
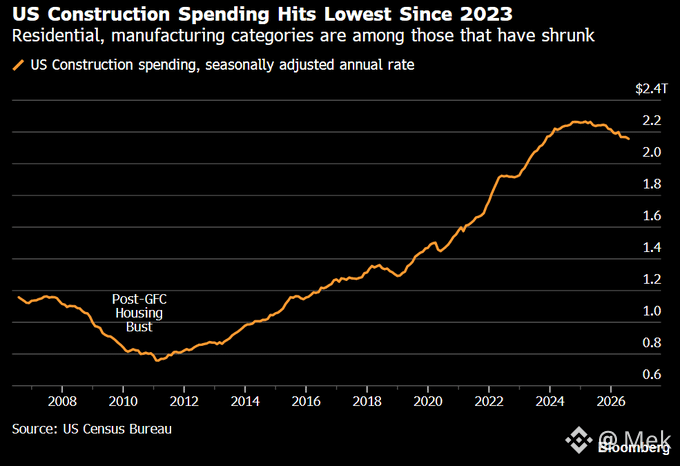
If the Fed raises interest rates in the US, it will further hit the real estate market, which is also currently seeing the lowest construction spending in the past 3 years.
The sector is already highly pressured.
Cutting rates further widens the gap versus yields on long-term bonds.
So keeping interest rates unchanged, or with no major change, is the path of least resistance.
Liquidity will be managed via the Treasury
The middle path is the most likely, and many people aren’t managing to understand that.
If the Fed raises interest rates in the US, it will further hit the real estate market, which is also currently seeing the lowest construction spending in the past 3 years.
The sector is already highly pressured.
Cutting rates further widens the gap versus yields on long-term bonds.
So keeping interest rates unchanged, or with no major change, is the path of least resistance.
Liquidity will be managed via the Treasury
If the Fed raises interest rates in the US, it will further hit the real estate market, which is also currently seeing the lowest construction spending in the past 3 years.
The sector is already highly pressured.
Cutting rates further widens the gap versus yields on long-term bonds.
So keeping interest rates unchanged, or with no major change, is the path of least resistance.
Liquidity will be managed via the Treasury
1
784
·
--
What explains Bitcoin volatility the most isn’t market cap, leverage, or volume.
It’s who holds the coins.
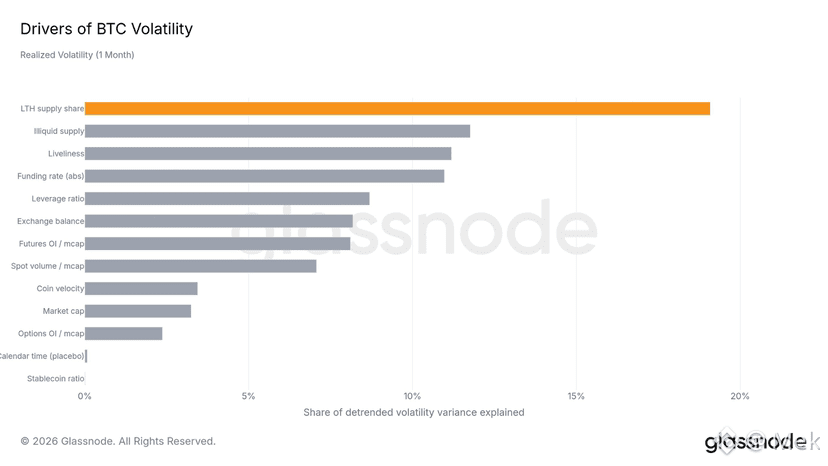
A Glassnode study tested 13 variables against the 1-month realized volatility.
Long-term holders’ share of the supply explains about 19% of the variance—more than any other single factor. Illiquid supply and liveliness come right after.
Market cap, the most repeated argument for explaining low volatility, appears near the bottom of the list, at a little over 3%.
Practically tied with coin velocity, and even below the funding rate.
Want to truly understand how Bitcoin volatility works? Study on-chain.
We’re in a low-volatility regime that should persist for a few more cycles before a new expansion.
What explains Bitcoin volatility the most isn’t market cap, leverage, or volume.
It’s who holds the coins.
A Glassnode study tested 13 variables against the 1-month realized volatility.
Long-term holders’ share of the supply explains about 19% of the variance—more than any other single factor. Illiquid supply and liveliness come right after.
Market cap, the most repeated argument for explaining low volatility, appears near the bottom of the list, at a little over 3%.
Practically tied with coin velocity, and even below the funding rate.
Want to truly understand how Bitcoin volatility works? Study on-chain.
We’re in a low-volatility regime that should persist for a few more cycles before a new expansion.
It’s who holds the coins.
A Glassnode study tested 13 variables against the 1-month realized volatility.
Long-term holders’ share of the supply explains about 19% of the variance—more than any other single factor. Illiquid supply and liveliness come right after.
Market cap, the most repeated argument for explaining low volatility, appears near the bottom of the list, at a little over 3%.
Practically tied with coin velocity, and even below the funding rate.
Want to truly understand how Bitcoin volatility works? Study on-chain.
We’re in a low-volatility regime that should persist for a few more cycles before a new expansion.
1
941
·
--
Verified
AMERICAN LABOR MARKET STRONGER THAN EXPECTED 🚨
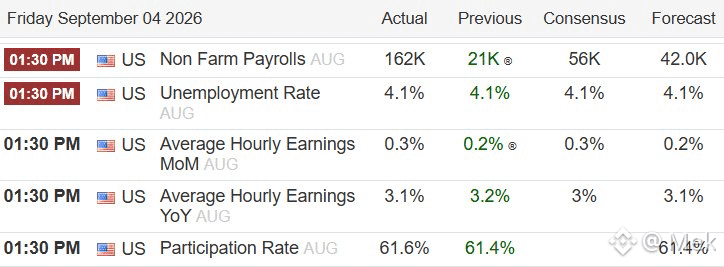
August payrolls came in at 162,000 jobs, nearly triple the consensus of 56,000.
The unemployment rate came in at 4.1%, in line with expectations. Labor force participation rose to 61.6%, reversing part of the decline seen since November.
The private sector added 127,000 jobs and the government, 35,000. Average hourly earnings rose 0.3% on the month and 3.1% over the year.
Previous data were also revised higher: July moved from -23,000 to +21,000, and June to +31,000.
More support for a tighter liquidity thesis (some people will be reviving the hawkish thesis here, but you already know what I think about that)
{spot}(BTCUSDT)
AMERICAN LABOR MARKET STRONGER THAN EXPECTED 🚨
August payrolls came in at 162,000 jobs, nearly triple the consensus of 56,000.
The unemployment rate came in at 4.1%, in line with expectations. Labor force participation rose to 61.6%, reversing part of the decline seen since November.
The private sector added 127,000 jobs and the government, 35,000. Average hourly earnings rose 0.3% on the month and 3.1% over the year.
Previous data were also revised higher: July moved from -23,000 to +21,000, and June to +31,000.
More support for a tighter liquidity thesis (some people will be reviving the hawkish thesis here, but you already know what I think about that)
August payrolls came in at 162,000 jobs, nearly triple the consensus of 56,000.
The unemployment rate came in at 4.1%, in line with expectations. Labor force participation rose to 61.6%, reversing part of the decline seen since November.
The private sector added 127,000 jobs and the government, 35,000. Average hourly earnings rose 0.3% on the month and 3.1% over the year.
Previous data were also revised higher: July moved from -23,000 to +21,000, and June to +31,000.
More support for a tighter liquidity thesis (some people will be reviving the hawkish thesis here, but you already know what I think about that)
2
4
2.2k
·
--
Partly True
This is what a lot of people in crypto don’t realize when analyzing the macro (or think they are analyzing it).
And this is what causes many people to “be surprised” by the strength of bitcoin.
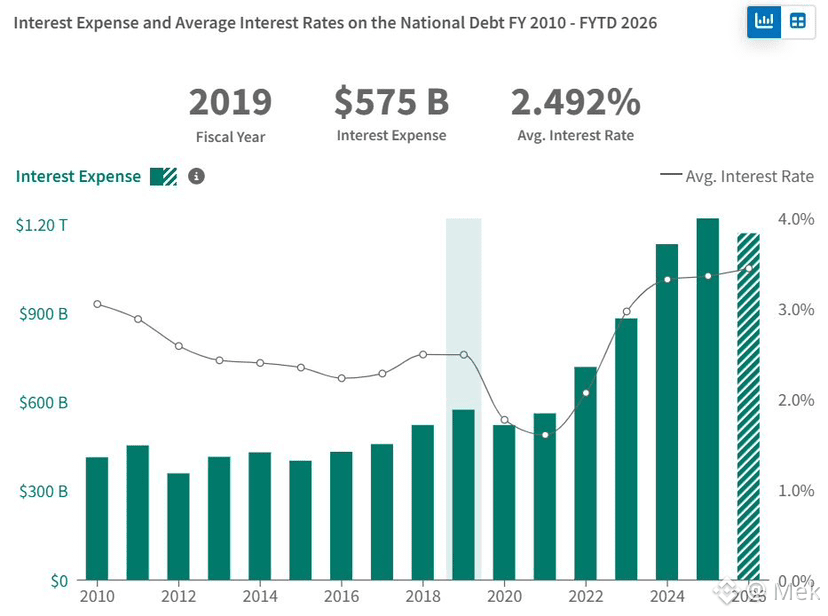
The cost of U.S. public debt is already exceeding all of last year for this entire year, and now that September has begun.
That’s why global treasury yields are rising.
That’s why scarce assets are rising along with them, when they should be falling.
That’s why bitcoin’s correlation with gold has recently hit highs.
Distrust in fiat currency is pushing capital toward real and scarce assets.
But this is only the beginning.
With each new round of debt refinancing, the need for liquidity increases, and along with it, monetary degradation also increases.
The sooner you understand this, the faster you’ll distance yourself from people who don’t help you on this journey.
My analyses today will be about this.
I hope you’re paying attention.
This is what a lot of people in crypto don’t realize when analyzing the macro (or think they are analyzing it).
And this is what causes many people to “be surprised” by the strength of bitcoin.
The cost of U.S. public debt is already exceeding all of last year for this entire year, and now that September has begun.
That’s why global treasury yields are rising.
That’s why scarce assets are rising along with them, when they should be falling.
That’s why bitcoin’s correlation with gold has recently hit highs.
Distrust in fiat currency is pushing capital toward real and scarce assets.
But this is only the beginning.
With each new round of debt refinancing, the need for liquidity increases, and along with it, monetary degradation also increases.
The sooner you understand this, the faster you’ll distance yourself from people who don’t help you on this journey.
My analyses today will be about this.
I hope you’re paying attention.
And this is what causes many people to “be surprised” by the strength of bitcoin.
The cost of U.S. public debt is already exceeding all of last year for this entire year, and now that September has begun.
That’s why global treasury yields are rising.
That’s why scarce assets are rising along with them, when they should be falling.
That’s why bitcoin’s correlation with gold has recently hit highs.
Distrust in fiat currency is pushing capital toward real and scarce assets.
But this is only the beginning.
With each new round of debt refinancing, the need for liquidity increases, and along with it, monetary degradation also increases.
The sooner you understand this, the faster you’ll distance yourself from people who don’t help you on this journey.
My analyses today will be about this.
I hope you’re paying attention.
2
802
Log in to explore more content
Join global crypto users on Binance Square
⚡️ Get latest and useful information about crypto.
💬 Trusted by the world’s largest crypto exchange.
👍 Discover real insights from verified creators.
Email / Phone number
Trending Topics
ClarityActFacesProceduralVoteSept15
3,189 views
91 Discussing
🏦 Regulatory Alert: Next Week’s Crucial Vote in the United States
This is the major regulatory news rocking the crypto ecosystem in mid-September: the CLARITY Act is facing a decisive cloture vote in the U.S. Senate as early as this Tuesday, September 15.
This bill aims to provide a strict regulatory framework and a clear market structure for digital assets in the United States. For many experts, the outcome of this vote will determine the market trend for the rest of the year.
Why it’s essential to watch:
🟩 The bullish scenario: If the vote passes, it will officially pave the way for the bill to be examined by the Senate before the midterm elections. AI predictive models estimate that a positive signal combined with easing from the Fed could propel Bitcoin well beyond the $100,000 mark.
🟥 The bearish scenario: If the bill fails or gets stalled, short-term forecasts fear a return of volatility and a technical correction that could bring the price of Bitcoin back toward $68,000.
Meanwhile, the U.S. crypto lobby is also working behind the scenes, launching major TV advertising campaigns to urge Congress to act.
Is regulatory clarity the key to mass adoption, or do you worry it could stifle innovation? Share your thoughts in the comments! 👇
#Crypto #Clari #ClarityActFacesProceduralVoteSept15 Tact #RegulatoryOverreach tion #Bitcoin #Finance #Blockchain #Web3
#ClarityActFacesProceduralVoteSept15
Djambario
·0 Likes
·56 views
US2YearYieldRisesTo4.61%
9,970 views
227 Discussing
US10YearTreasuryYieldNears5%
5,332 views
133 Discussing