

Koiisyourname
mình đăng bài chỉ để nhắc nhở bản thân khi vào lệnh, không mục đích kêu gọi, tạo nhóm hay bất cứ lý do gì khác…
Frequent Trader
5 Years
1 Following
4.1K+ Followers
30.0K+ Liked
Posts
All
Quotes
Koiisyourname
·
--
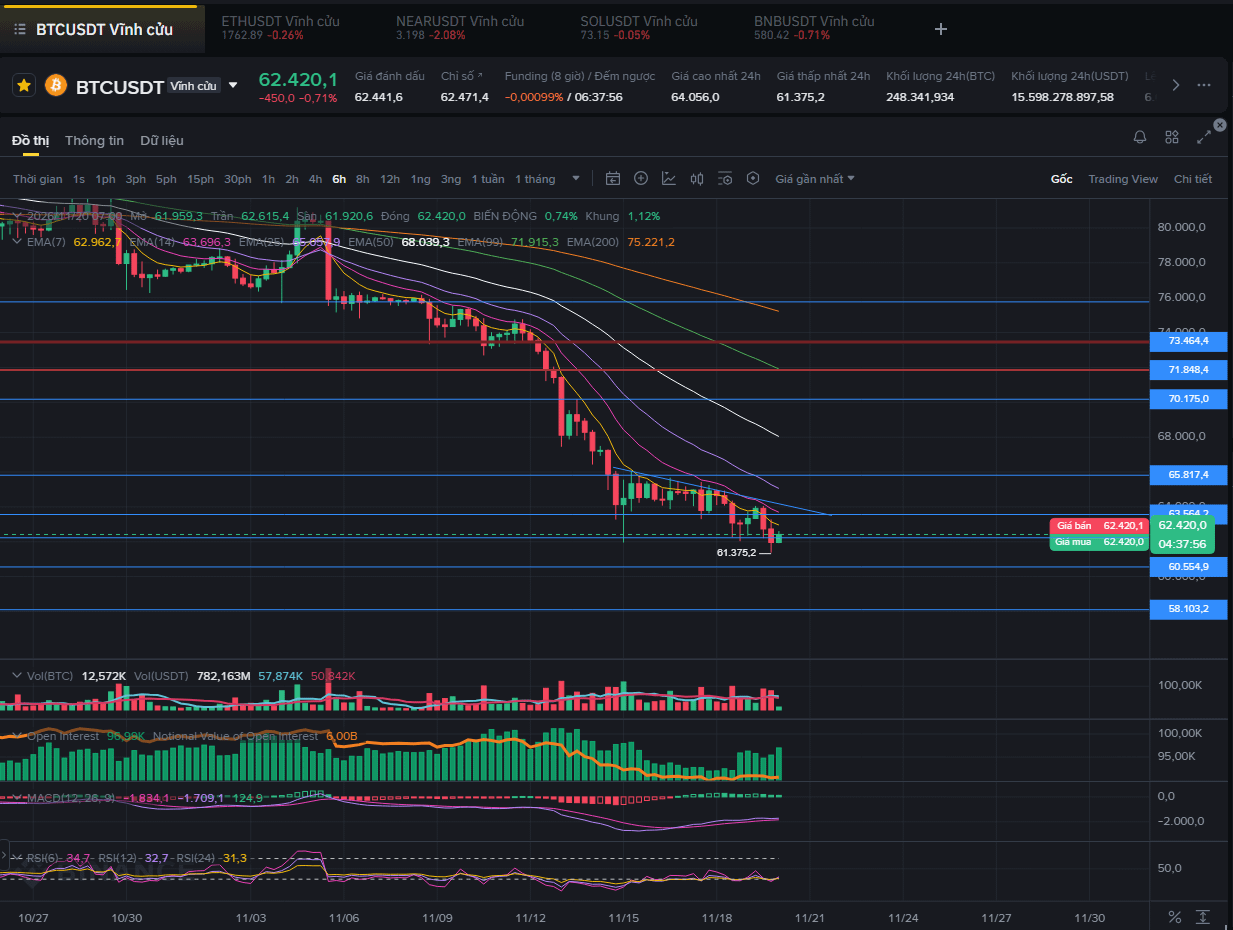
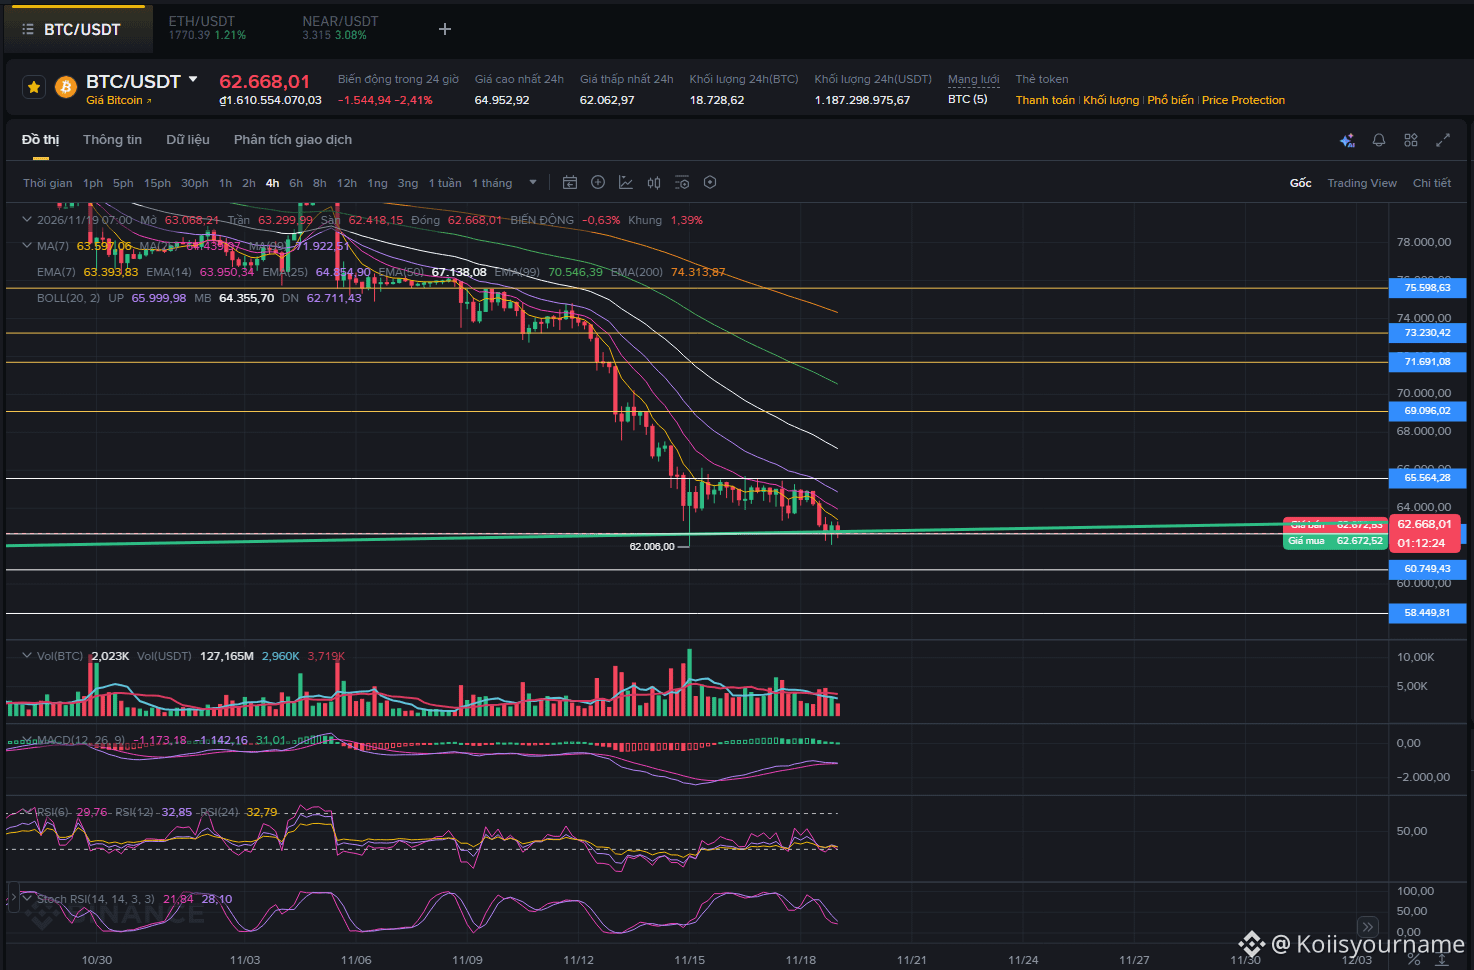
$BTC Daily range: 63K–60.5K – Downtrend continues
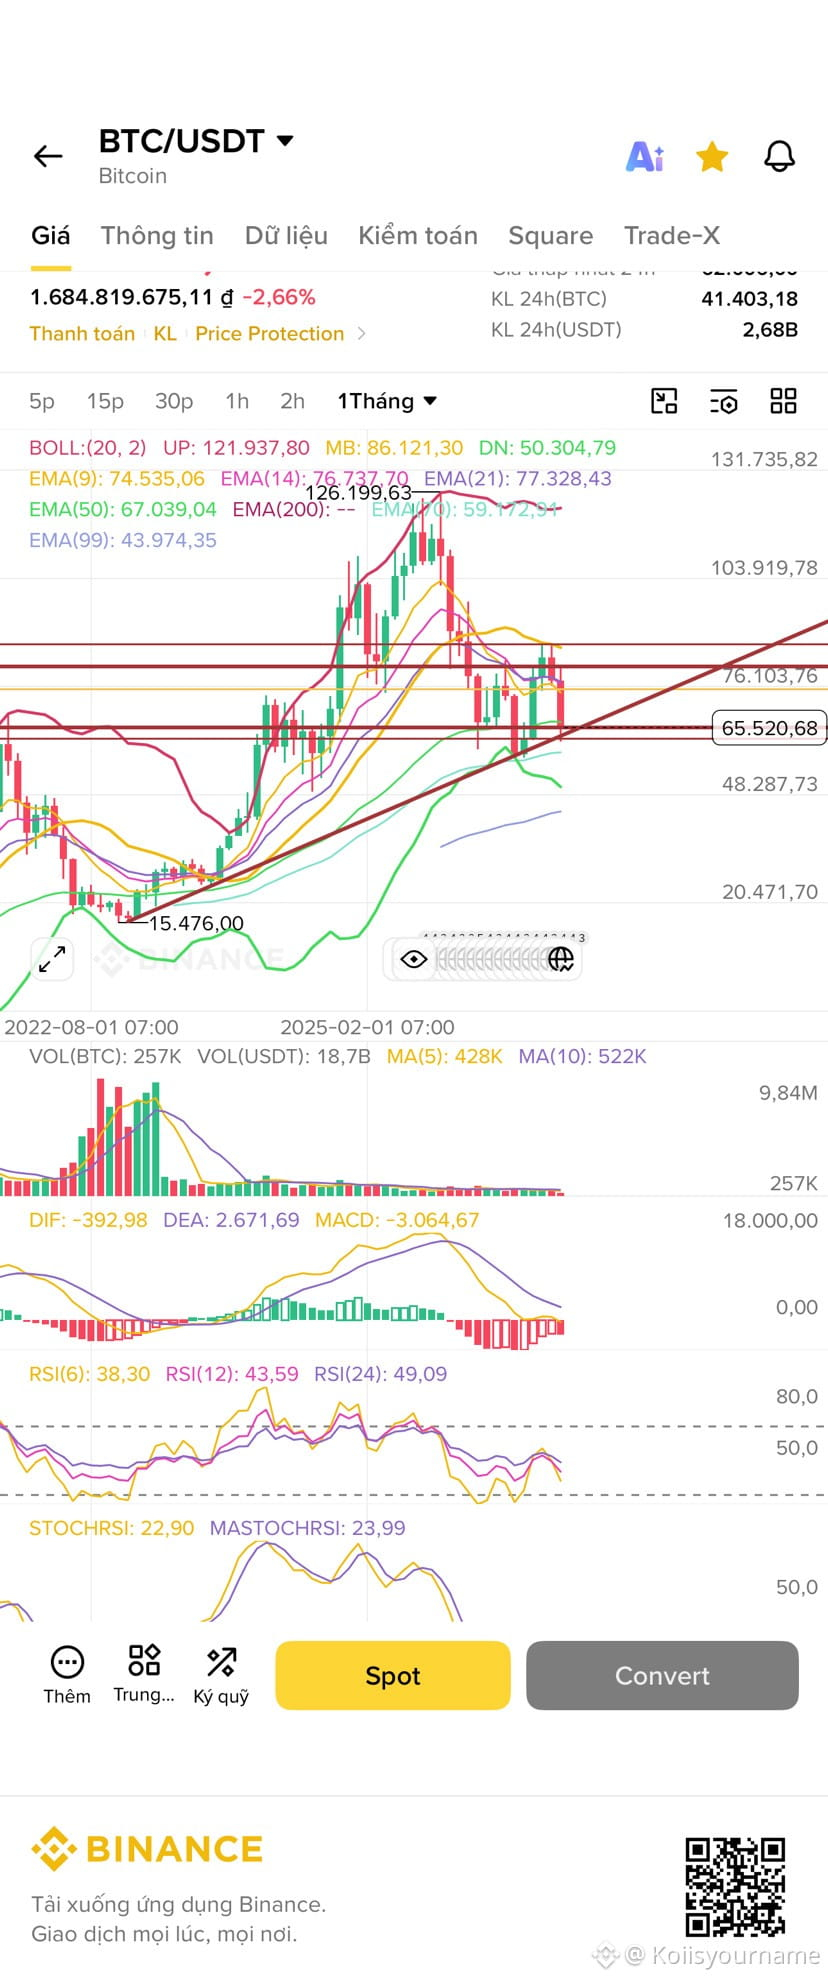
BTC is in a short-term downtrend within the 63K–57K price range after losing the 62K level last night. It is highly likely to retest the bottom, as shown in scenario 2 drawn earlier.
So the prediction of early accumulation around 63K–71K can be set aside. For now, though, the price action is very unclear and hard to predict, so the chance of being wrong is high, with plenty of sophisticated short traps. (Even technical analysis is no help if just one piece of positive news breaks—the chart will immediately change direction.)
Note: Short only for the short term in this price range. Don’t FOMO into shorts, or you could easily get caught in a short trap.
As for capital flows, they have remained negative for four consecutive days, with no signs of new buying coming into the market. Keep an eye on capital flows in these sensitive areas!
BTC is in a short-term downtrend within the 63K–57K price range after losing the 62K level last night. It is highly likely to retest the bottom, as shown in scenario 2 drawn earlier.
So the prediction of early accumulation around 63K–71K can be set aside. For now, though, the price action is very unclear and hard to predict, so the chance of being wrong is high, with plenty of sophisticated short traps. (Even technical analysis is no help if just one piece of positive news breaks—the chart will immediately change direction.)
Note: Short only for the short term in this price range. Don’t FOMO into shorts, or you could easily get caught in a short trap.
As for capital flows, they have remained negative for four consecutive days, with no signs of new buying coming into the market. Keep an eye on capital flows in these sensitive areas!


Ngao Thiết
·
--
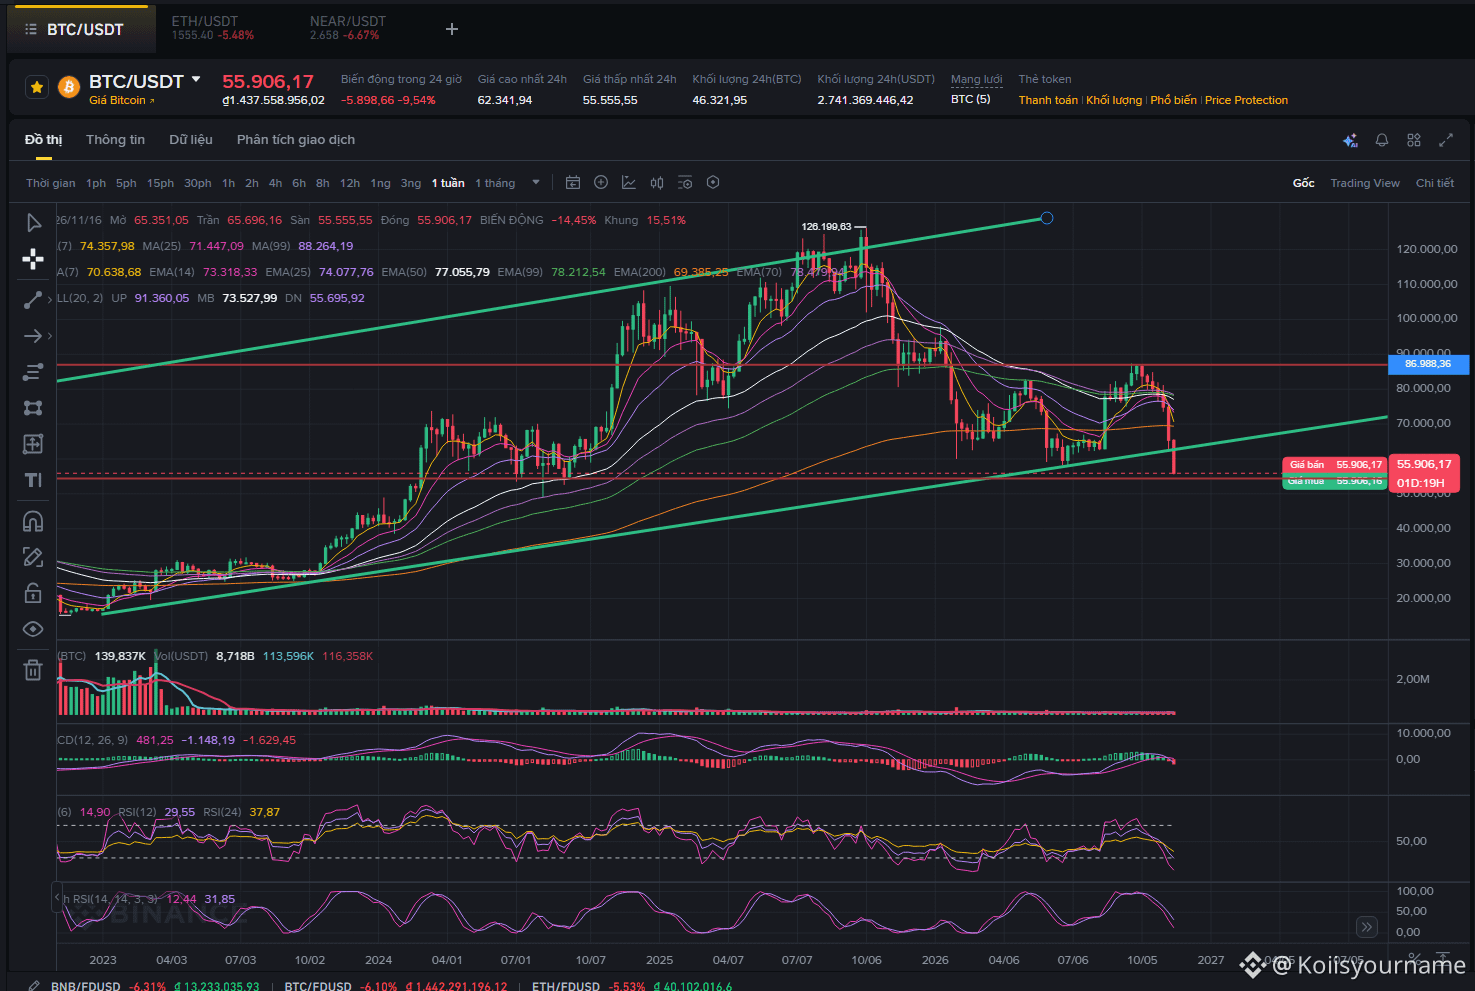
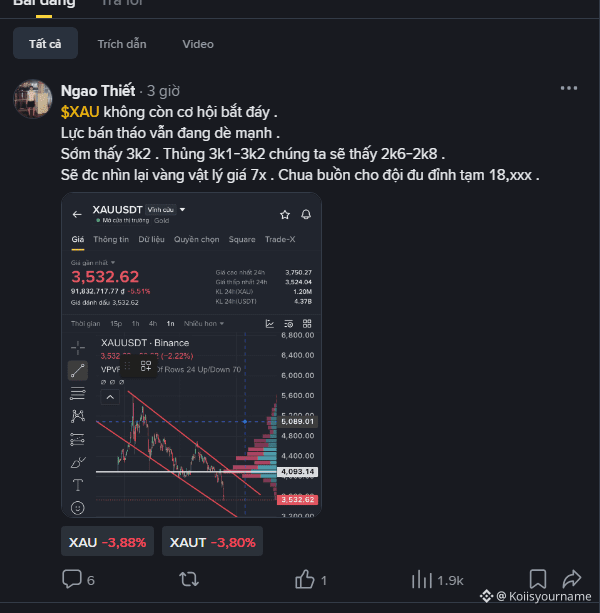
Analysis is bullshit :)) The chart looks like it was drawn by someone with zero trading experience. Just trying to impress beginners.

Koiisyourname
·
--
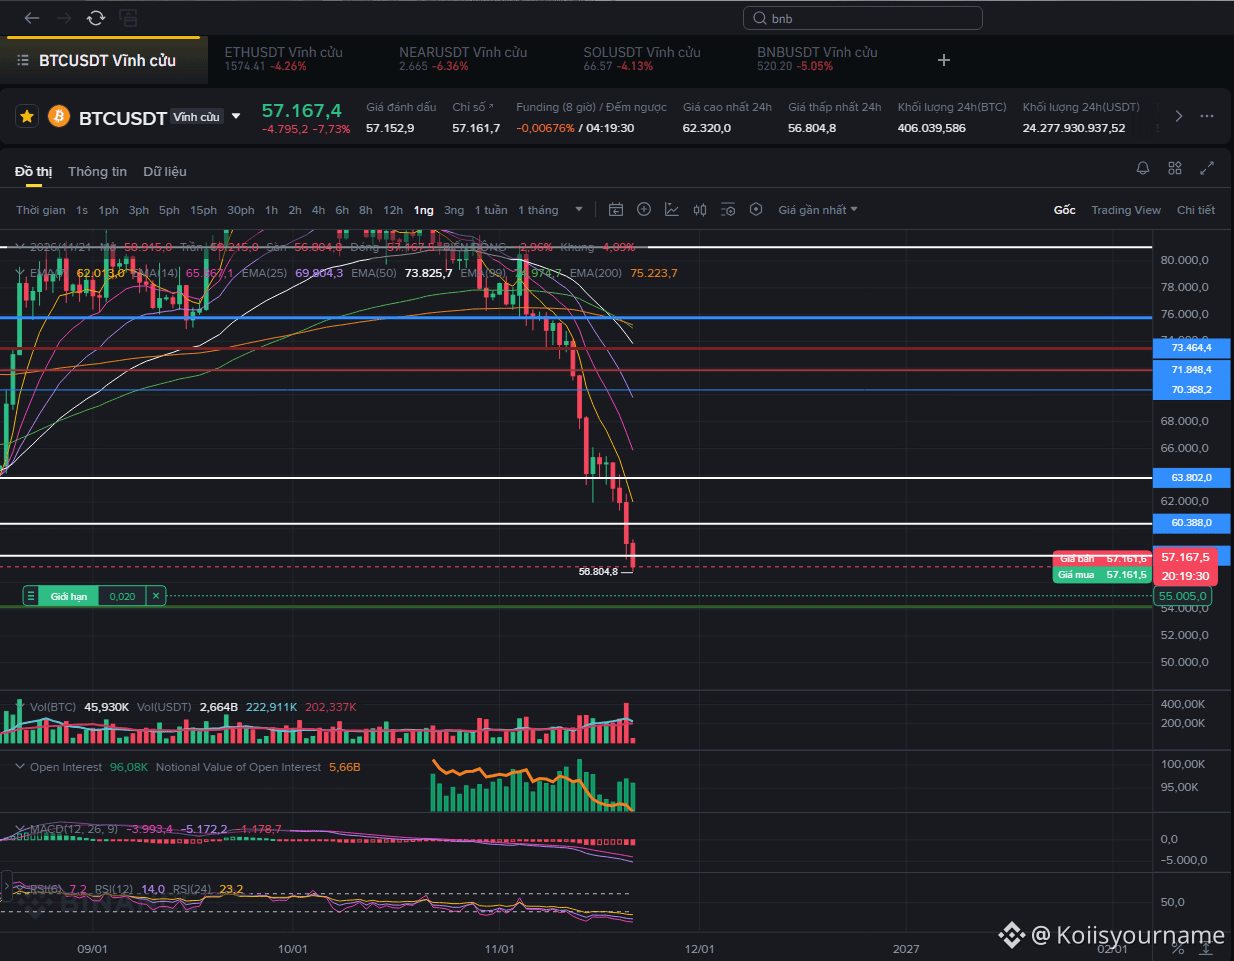
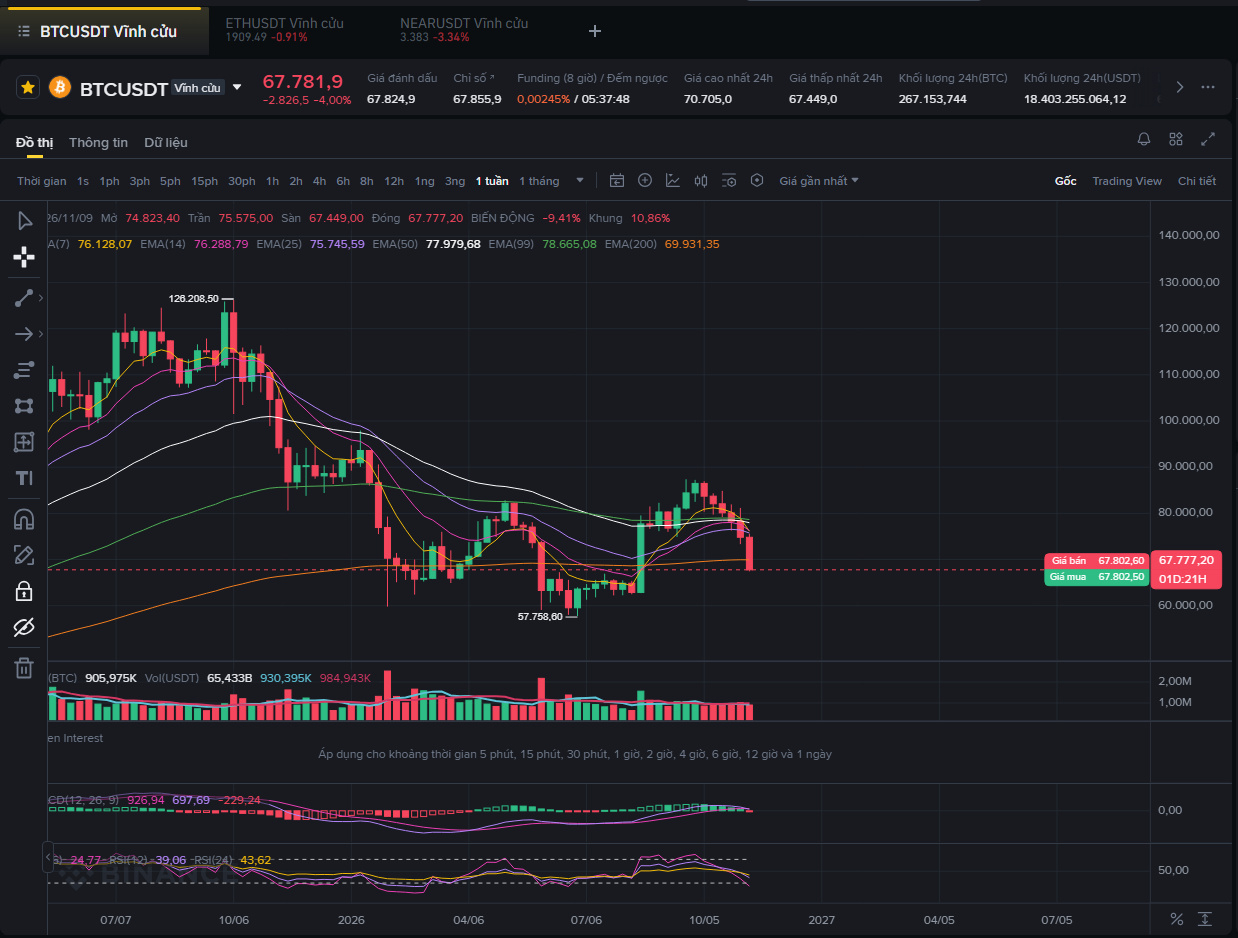
$BTC The exact range right now is 63–71, and we’re still within the accumulation zone—not in the 65–5X range yet! So many people have been asking that I had to rush to answer!
Right now, it’s just a candle with a long lower wick; a bottom hasn’t truly been confirmed yet.
That wick from Saturday night to Sunday morning could be a mass grave for everyone who went long early at 65K or above. 🤐
$BTC
Right now, it’s just a candle with a long lower wick; a bottom hasn’t truly been confirmed yet.
That wick from Saturday night to Sunday morning could be a mass grave for everyone who went long early at 65K or above. 🤐
$BTC

Koiisyourname
·
--
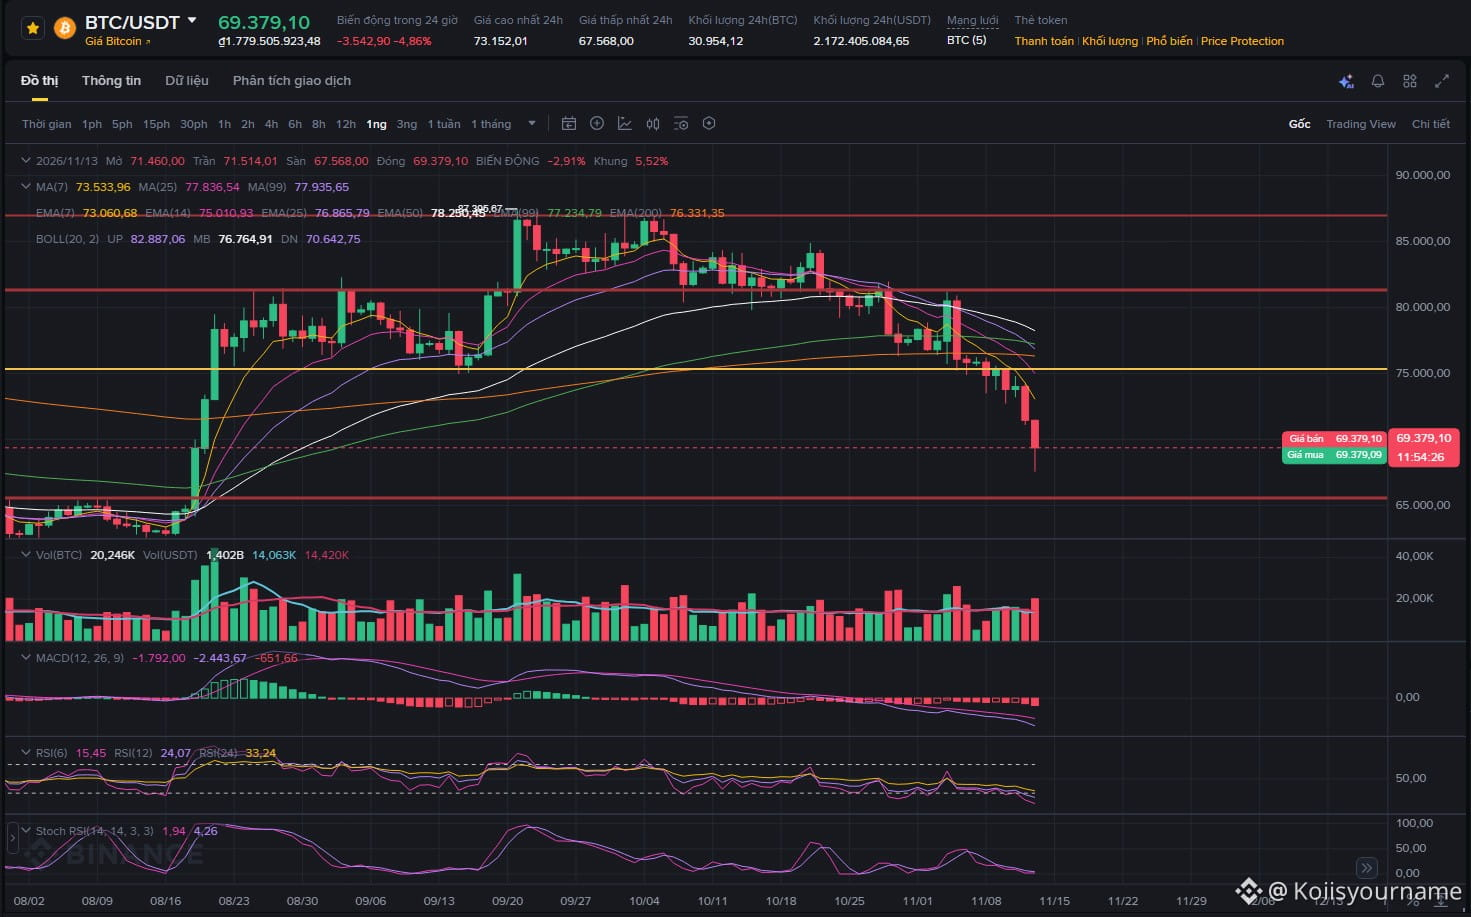
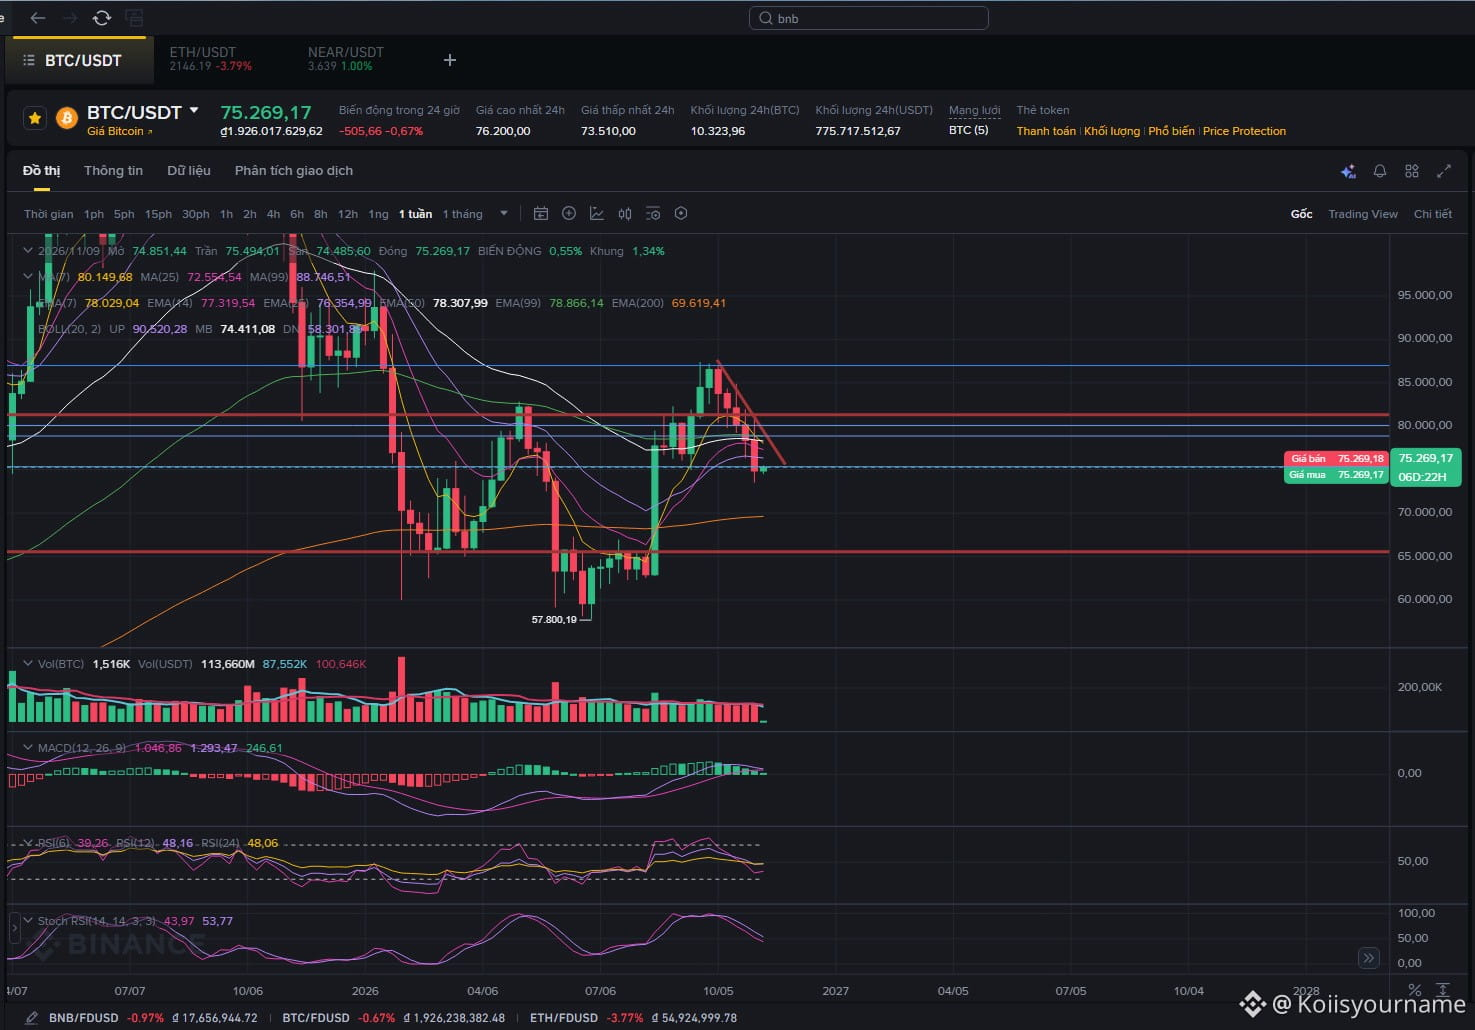
$BTC The current daily range is 76.5–80K
From what I can see, whether it continues to fall or rises, BTC will likely move sideways within this price range for at least 1–2 weeks (early November).
The candlestick pattern looks very much like a head and shoulders. When the price lost 80K on Friday, it was confirmed to be below the important daily-chart EMA50—a short-term bearish trend!
I currently think the price will rise for two reasons:
- First, a technical bounce before continuing to decline.
- Second, a bounce to retest the EMA50 once more.
One core point you should pay attention to: if the price loses the 75K level (with a daily candle closing below it), there’s a very high chance of a sharp sell-off toward 65.5K, in line with the short-term bearish pattern.
In the medium term, BTC is looking more positive than it did a few months ago. The weekly chart is showing a very strong recovery, while the monthly chart is gradually moving sideways. This gives me hope that it will bottom around 65K and recover strongly in January 2027.
From what I can see, whether it continues to fall or rises, BTC will likely move sideways within this price range for at least 1–2 weeks (early November).
The candlestick pattern looks very much like a head and shoulders. When the price lost 80K on Friday, it was confirmed to be below the important daily-chart EMA50—a short-term bearish trend!
I currently think the price will rise for two reasons:
- First, a technical bounce before continuing to decline.
- Second, a bounce to retest the EMA50 once more.
One core point you should pay attention to: if the price loses the 75K level (with a daily candle closing below it), there’s a very high chance of a sharp sell-off toward 65.5K, in line with the short-term bearish pattern.
In the medium term, BTC is looking more positive than it did a few months ago. The weekly chart is showing a very strong recovery, while the monthly chart is gradually moving sideways. This gives me hope that it will bottom around 65K and recover strongly in January 2027.

Ngắn dài
·
--
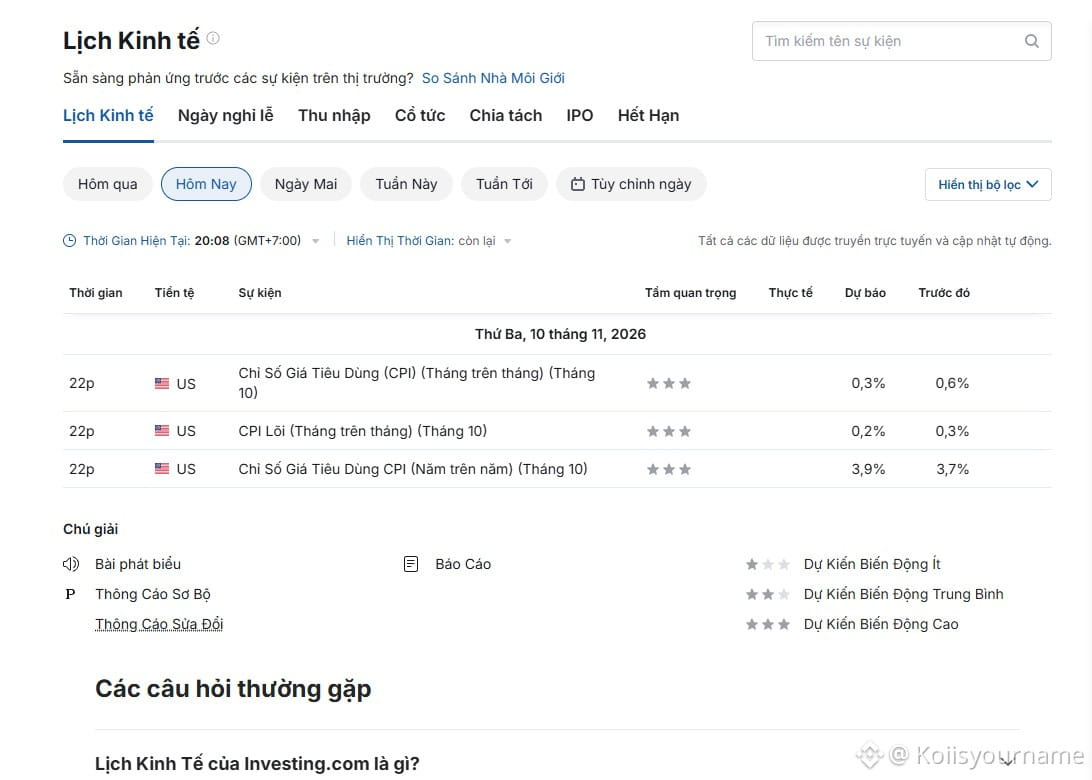
With no position, keep an eye out for a long and wait for news from Putin—the election is pretty much over :) If Trump stirs things up one last time, there’ll be a nice entry.
Koiisyourname
·
--
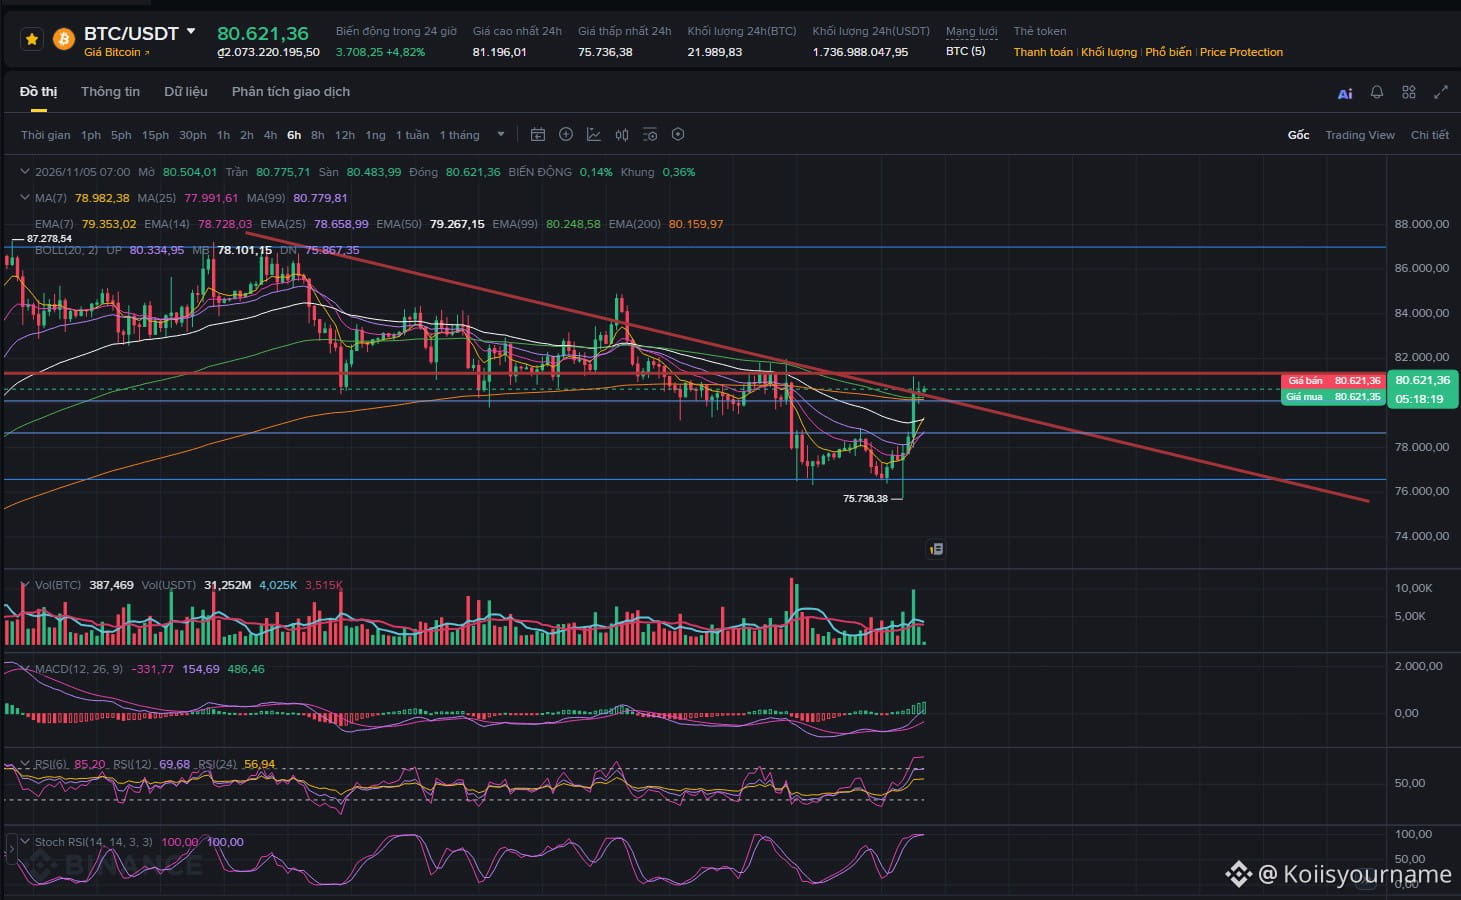
$BTC Technical analysis details for the week:
1. A double bottom formed at 76.5K with high average volume on the 4H candles, rejecting sellers at that level three times!
2. OI rose sharply in the 78K–76.5K zone, with funding at 0.1 (high) — a huge amount of longs in the swing-trading area is providing solid support for the price.
3. MACD is still negative on the smaller timeframes (4H–1D), but the WEEKLY CANDLE is still positive, so the medium-term uptrend has not been completely lost!
4. Strong support at 76.5 because this is where the weekly and monthly candle EMAs intersect.
5. Summary of indicators: Short term (1D and below) — downtrend; Medium term — uptrend; Long term — still in a downtrend.
Brief summary for this week:
- Upper range: 78.6 - 80 - 81.5
- Lower range: 76.5-75
- Good swing-trading price range: 80K-76.5
If the weekly candle closes below 75K, there's a high chance the price will drop another 10K, continuing down to 65K without stopping!
If the daily candle closes firmly above 80K and price swings between 81 and 80 for an extended period, the short-term trend could reverse upward.
- Look for shorts in the 80 - 78.5 zone
- Look for longs around 76.5
- Remember to set a stop-loss and don't go all-in!
In conclusion: The U.S. is holding an election, so there will likely be plenty of news for exchanges to use to manipulate the market. Trade carefully, everyone!
1. A double bottom formed at 76.5K with high average volume on the 4H candles, rejecting sellers at that level three times!
2. OI rose sharply in the 78K–76.5K zone, with funding at 0.1 (high) — a huge amount of longs in the swing-trading area is providing solid support for the price.
3. MACD is still negative on the smaller timeframes (4H–1D), but the WEEKLY CANDLE is still positive, so the medium-term uptrend has not been completely lost!
4. Strong support at 76.5 because this is where the weekly and monthly candle EMAs intersect.
5. Summary of indicators: Short term (1D and below) — downtrend; Medium term — uptrend; Long term — still in a downtrend.
Brief summary for this week:
- Upper range: 78.6 - 80 - 81.5
- Lower range: 76.5-75
- Good swing-trading price range: 80K-76.5
If the weekly candle closes below 75K, there's a high chance the price will drop another 10K, continuing down to 65K without stopping!
If the daily candle closes firmly above 80K and price swings between 81 and 80 for an extended period, the short-term trend could reverse upward.
- Look for shorts in the 80 - 78.5 zone
- Look for longs around 76.5
- Remember to set a stop-loss and don't go all-in!
In conclusion: The U.S. is holding an election, so there will likely be plenty of news for exchanges to use to manipulate the market. Trade carefully, everyone!
Log in to explore more content