
Mr001_
33 Posts

Mr001_
Report
Block User
Crypto Market Analyst
Reading charts. Studying trends.
Letting data speak.
1 Following
3 Followers
33 Liked
Posts
·
--
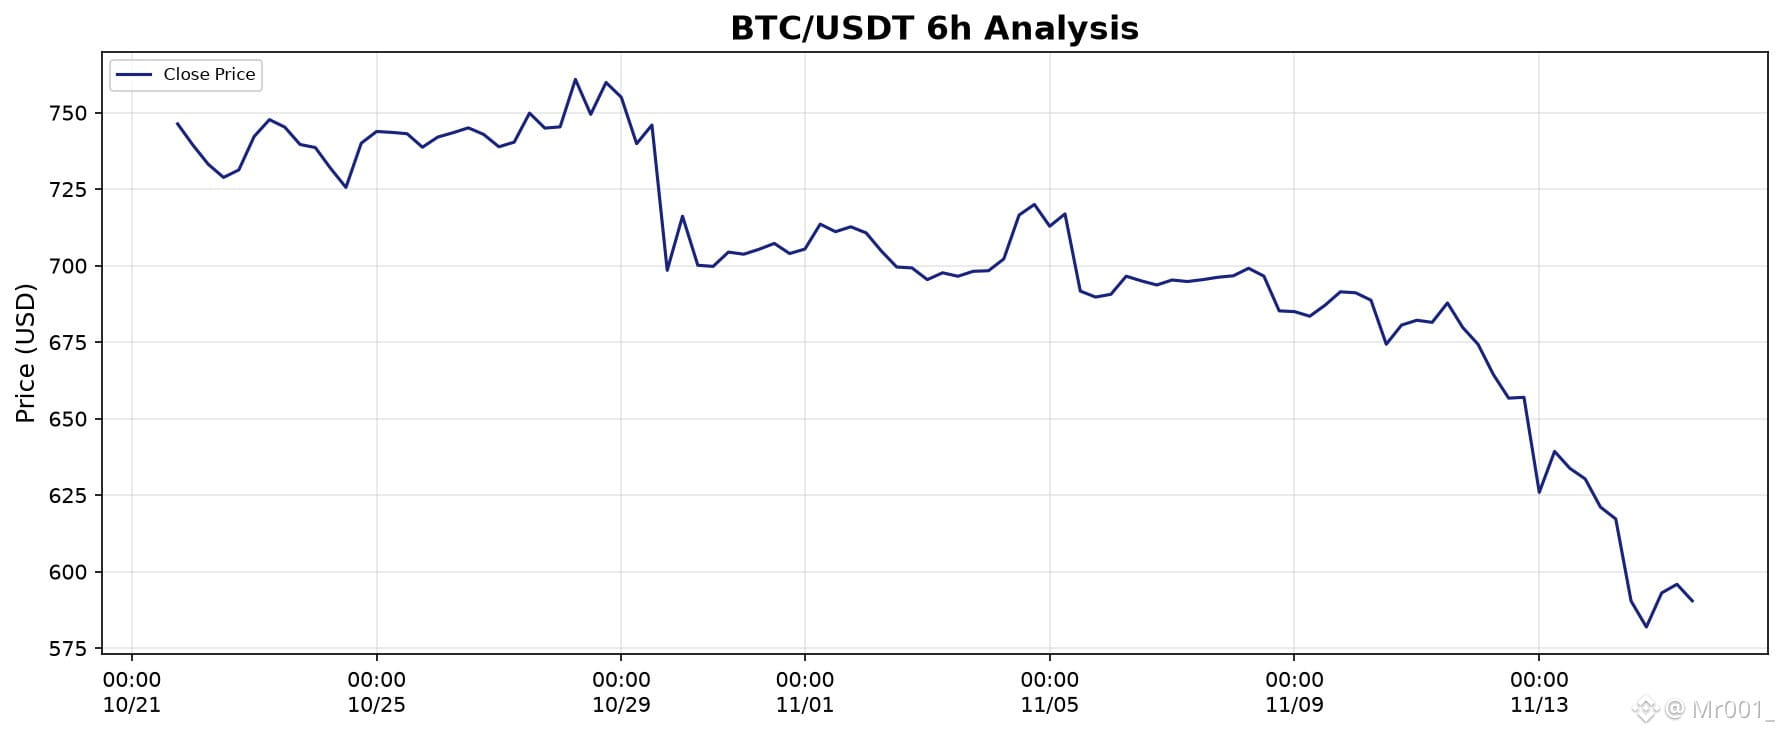
$BNB Short Analysis.
Current Price: $590.46
24h Change: +0.01%
RSI(Average of 6 hours): 25.92
Trend: Downtrend
Bias: Bearish
Resistance: $599.72
Support: $566.00
Critical Support: $590.46
Advice for traders/investors:
Wait for a bullish reversal signal before entering buy. Price holding above $590.46 signals recovery. Take profits near resistance. Only risk capital you can afford to lose.
$BNB
#Crypto #Trading #BNB #analysis
$BNB Short Analysis.
Current Price: $590.46
24h Change: +0.01%
RSI(Average of 6 hours): 25.92
Trend: Downtrend
Bias: Bearish
Resistance: $599.72
Support: $566.00
Critical Support: $590.46
Advice for traders/investors:
Wait for a bullish reversal signal before entering buy. Price holding above $590.46 signals recovery. Take profits near resistance. Only risk capital you can afford to lose.
$BNB
#Crypto #Trading #BNB #analysis
Current Price: $590.46
24h Change: +0.01%
RSI(Average of 6 hours): 25.92
Trend: Downtrend
Bias: Bearish
Resistance: $599.72
Support: $566.00
Critical Support: $590.46
Advice for traders/investors:
Wait for a bullish reversal signal before entering buy. Price holding above $590.46 signals recovery. Take profits near resistance. Only risk capital you can afford to lose.
$BNB
#Crypto #Trading #BNB #analysis
31
·
--
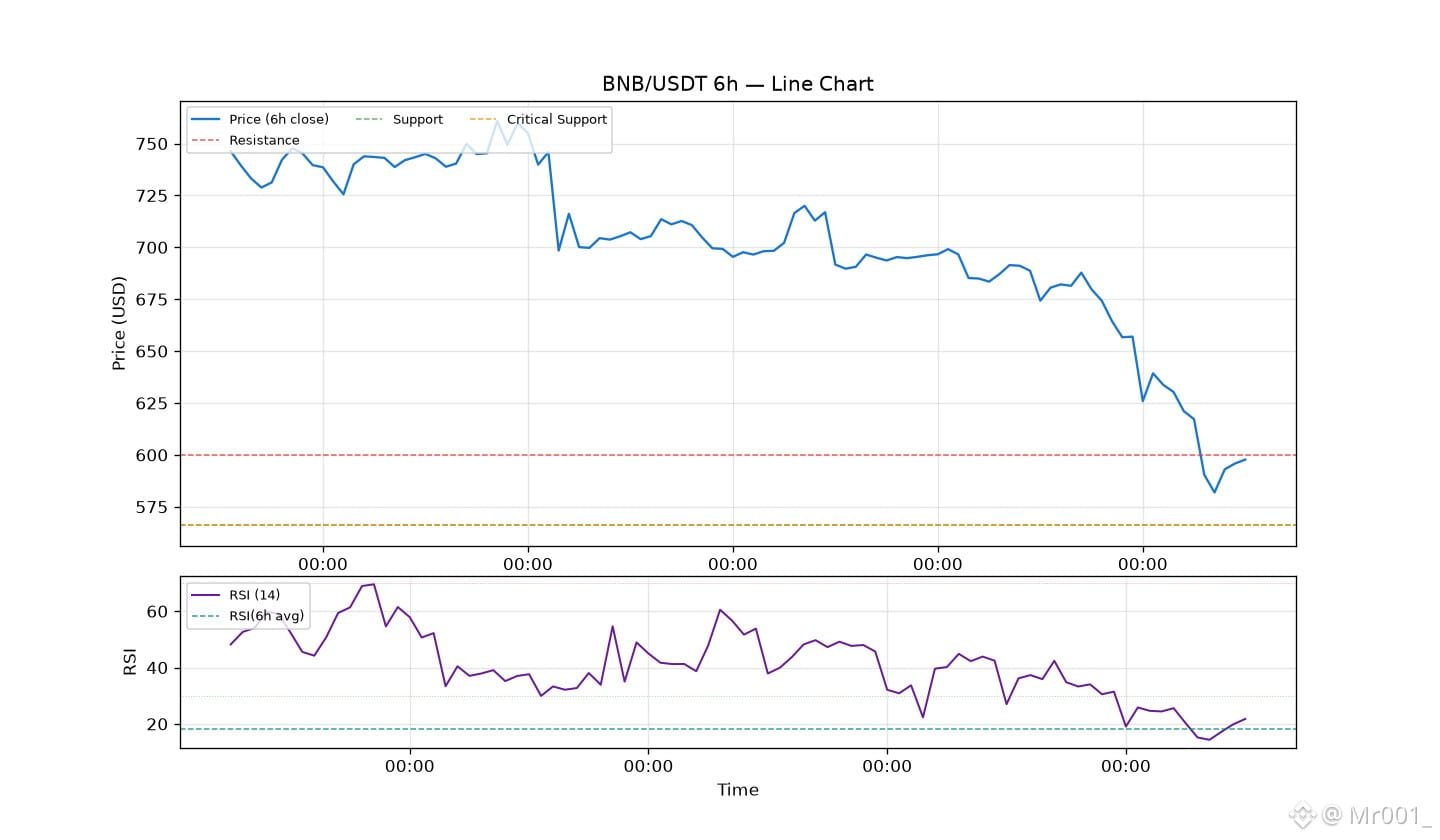
$BNB Short Analysis.
Current Price: $597.73
24h Change: +1.24%
RSI(Average of 6 hours): 18.10
Trend: Downtrend
Bias: Bearish
Resistance: $599.72
Support: $566.00
Critical Support: $566.00
Advice for traders/investors:
Wait for a bullish reversal signal before entering buy. Price holding above $566.00 signals recovery. Take profits near resistance. Only risk capital you can afford to lose.
#Crypto #Trading #BNB #analysis
#viralpost
$BNB Short Analysis.
Current Price: $597.73
24h Change: +1.24%
RSI(Average of 6 hours): 18.10
Trend: Downtrend
Bias: Bearish
Resistance: $599.72
Support: $566.00
Critical Support: $566.00
Advice for traders/investors:
Wait for a bullish reversal signal before entering buy. Price holding above $566.00 signals recovery. Take profits near resistance. Only risk capital you can afford to lose.
#Crypto #Trading #BNB #analysis
#viralpost
Current Price: $597.73
24h Change: +1.24%
RSI(Average of 6 hours): 18.10
Trend: Downtrend
Bias: Bearish
Resistance: $599.72
Support: $566.00
Critical Support: $566.00
Advice for traders/investors:
Wait for a bullish reversal signal before entering buy. Price holding above $566.00 signals recovery. Take profits near resistance. Only risk capital you can afford to lose.
#Crypto #Trading #BNB #analysis
#viralpost
1
57
·
--
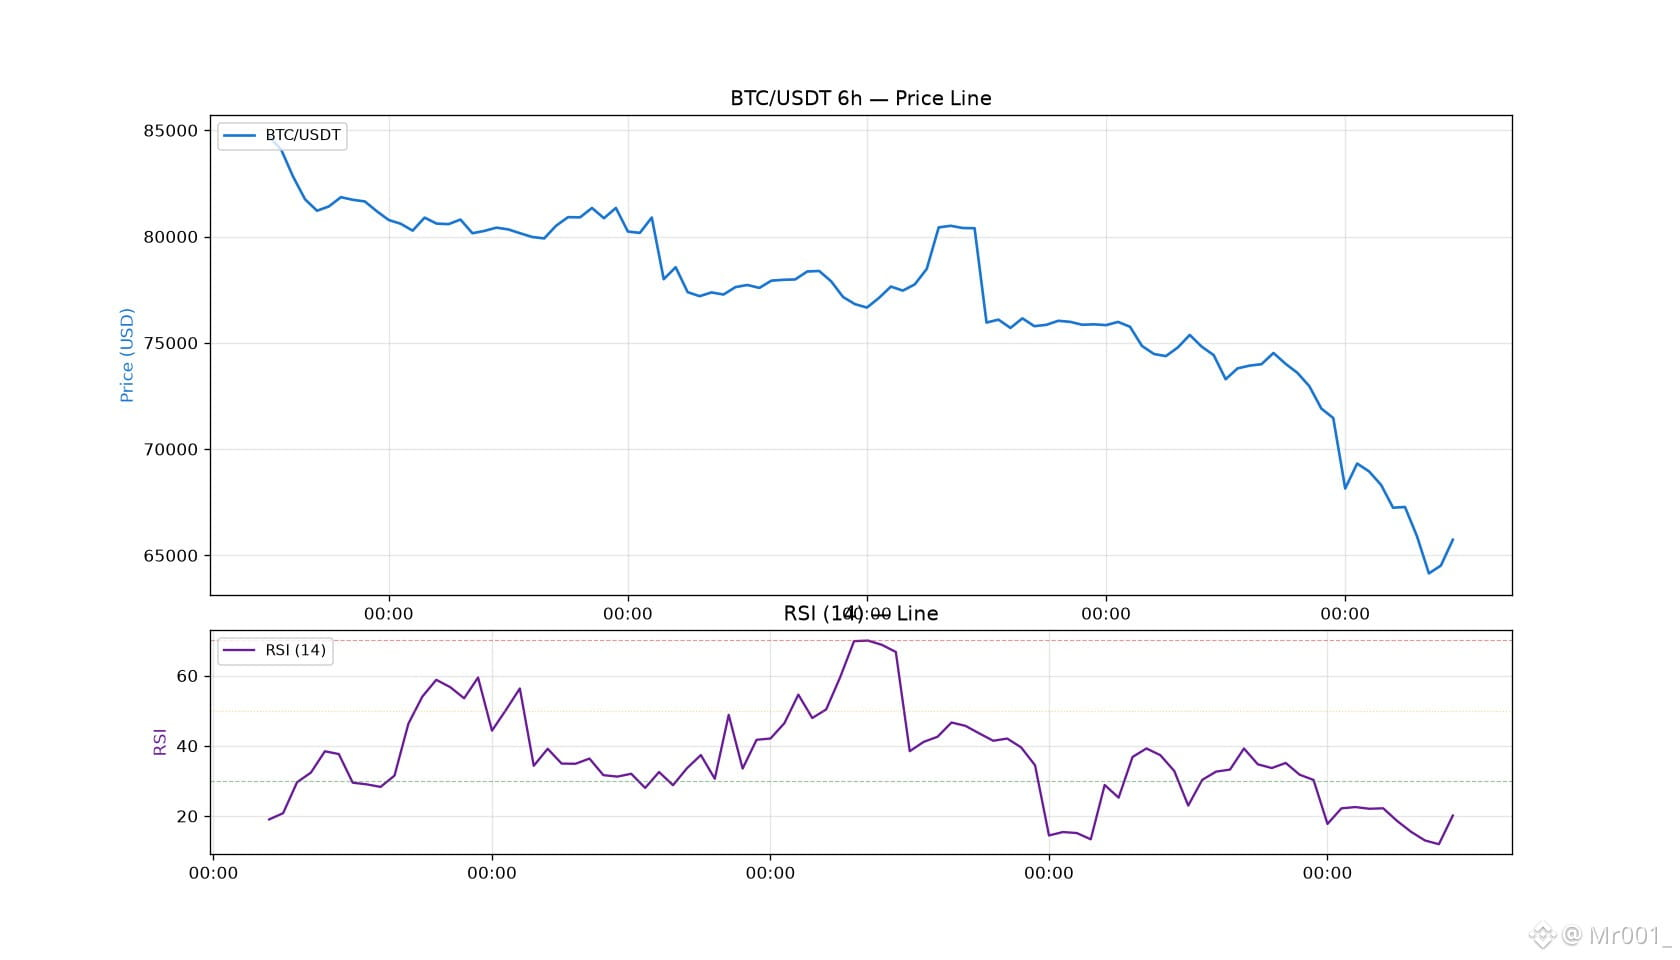
$BTC 6h Analysis
Current Price: $65,732.00
24h Change: -2.29%
RSI(Average of 6 hours): 20.12
Trend: Downtrend
Bias: Bearish
Resistance: $70,148.76
Support: $63,188.28
Critical Support: $62,006.00
Advice for traders/investors:
Wait for a bullish reversal signal before entering buy. RSI above 50 or price holding above $62,006.00 signals recovery. Take profits near resistance. Only risk capital you can afford to lose.
$BTC
#Crypto #Trading #BTC #analysis
$BTC 6h Analysis
Current Price: $65,732.00
24h Change: -2.29%
RSI(Average of 6 hours): 20.12
Trend: Downtrend
Bias: Bearish
Resistance: $70,148.76
Support: $63,188.28
Critical Support: $62,006.00
Advice for traders/investors:
Wait for a bullish reversal signal before entering buy. RSI above 50 or price holding above $62,006.00 signals recovery. Take profits near resistance. Only risk capital you can afford to lose.
$BTC
#Crypto #Trading #BTC #analysis
Current Price: $65,732.00
24h Change: -2.29%
RSI(Average of 6 hours): 20.12
Trend: Downtrend
Bias: Bearish
Resistance: $70,148.76
Support: $63,188.28
Critical Support: $62,006.00
Advice for traders/investors:
Wait for a bullish reversal signal before entering buy. RSI above 50 or price holding above $62,006.00 signals recovery. Take profits near resistance. Only risk capital you can afford to lose.
$BTC
#Crypto #Trading #BTC #analysis
1
119
·
--
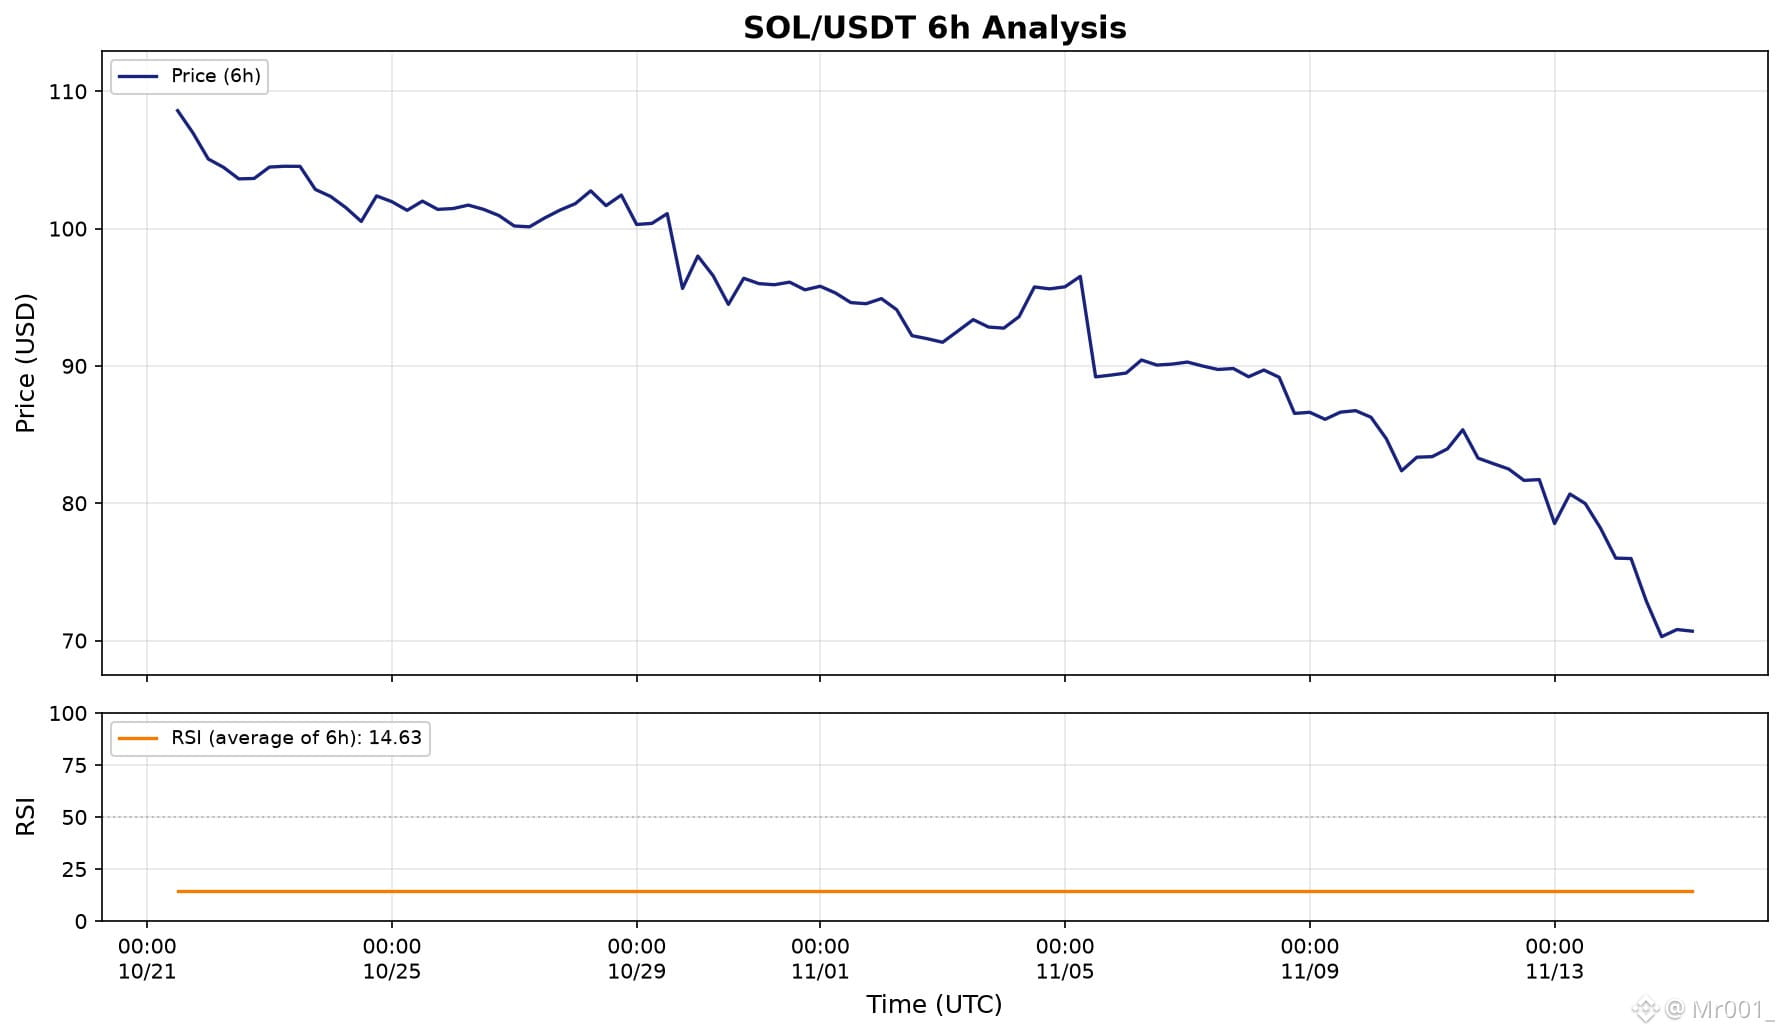
$SOL 6h Analysis Time 12:00 to 11:59 UTC
Current Price: $70.68
24h Change: -6.96%
RSI(Average of 6 hours): 14.63
Trend: Downtrend
Bias: Bearish
Resistance: $76.06
Support: $67.41
Critical Support: $70.68
Advice for traders/investors:
Wait for a bullish reversal signal before entering buy. RSI above 50 or price holding above $70.68 signals recovery. Take profits near resistance. Only risk capital you can afford to lose.
$SOL
#Crypto #Trading #SOL #analysis
$SOL 6h Analysis Time 12:00 to 11:59 UTC
Current Price: $70.68
24h Change: -6.96%
RSI(Average of 6 hours): 14.63
Trend: Downtrend
Bias: Bearish
Resistance: $76.06
Support: $67.41
Critical Support: $70.68
Advice for traders/investors:
Wait for a bullish reversal signal before entering buy. RSI above 50 or price holding above $70.68 signals recovery. Take profits near resistance. Only risk capital you can afford to lose.
$SOL
#Crypto #Trading #SOL #analysis
Current Price: $70.68
24h Change: -6.96%
RSI(Average of 6 hours): 14.63
Trend: Downtrend
Bias: Bearish
Resistance: $76.06
Support: $67.41
Critical Support: $70.68
Advice for traders/investors:
Wait for a bullish reversal signal before entering buy. RSI above 50 or price holding above $70.68 signals recovery. Take profits near resistance. Only risk capital you can afford to lose.
$SOL
#Crypto #Trading #SOL #analysis
1
107
·
--
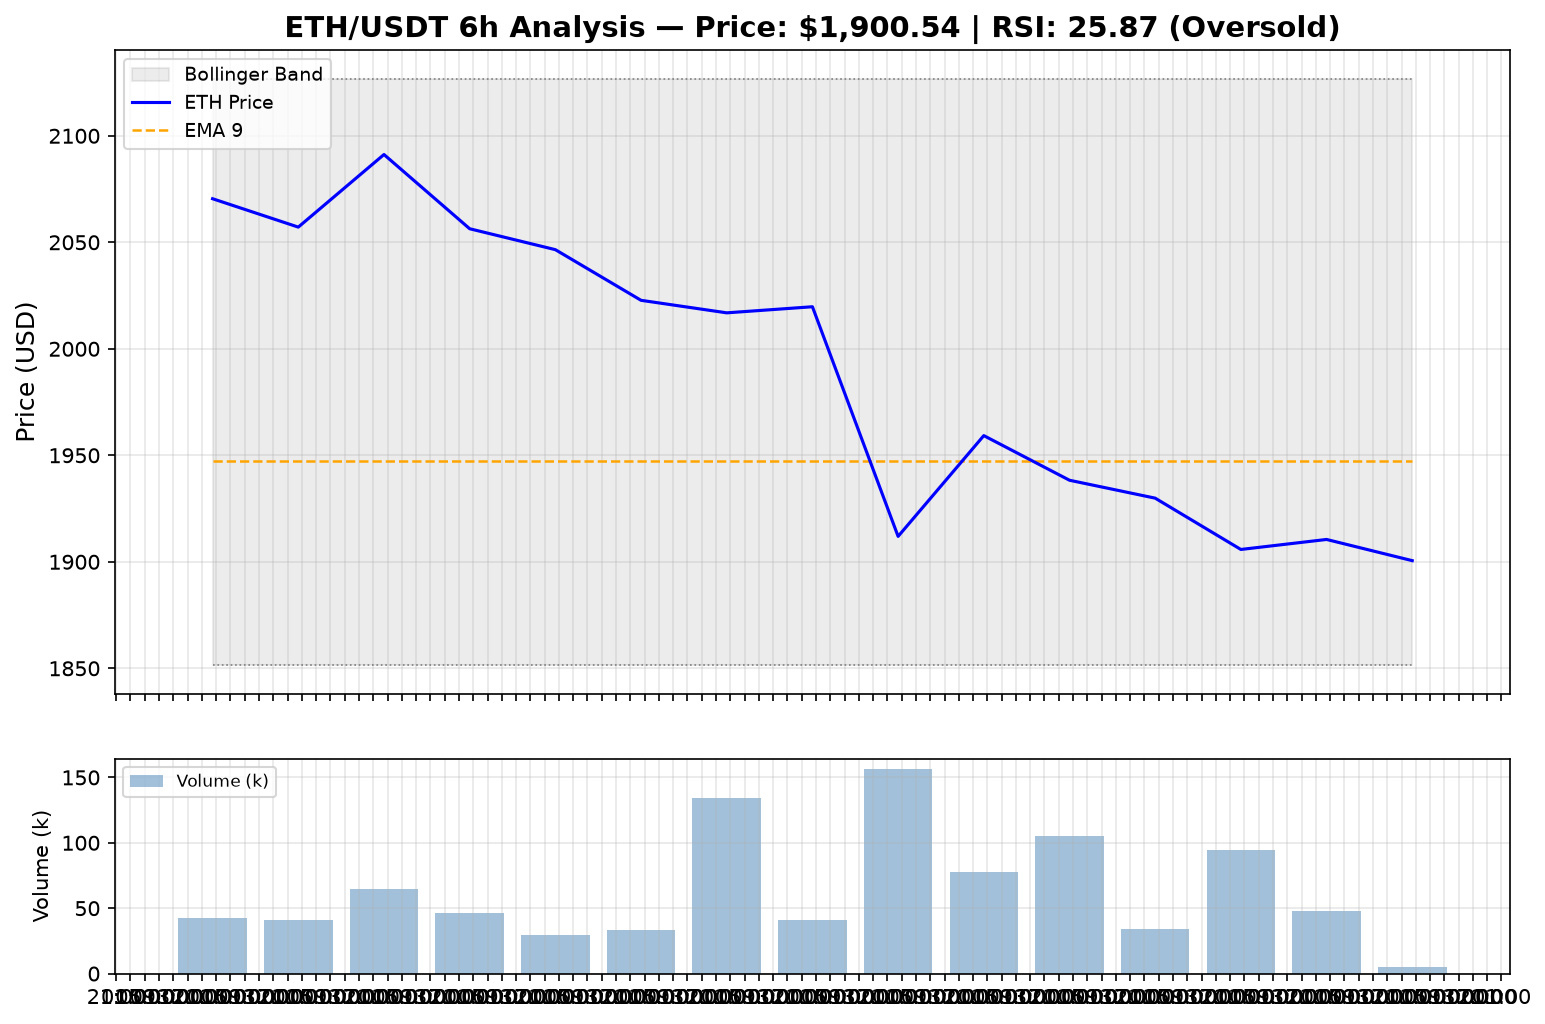
$ETH 6h Analysis Time 12:50 to 18:50
Current Price: $1,904.53
24h Change: -1.74%
RSI: 25.87
Trend: Downtrend
Bias: Bearish
Resistance: $1,956.50
Support: $1,878.00
Critical Support: $1,903.02
Advice for traders/investors:
Wait for a bullish reversal signal before entering long. RSI above 50 or price holding above $1,903 signals recovery. Take profits near resistance. Only risk capital you can afford to lose.
#Crypto #Trading #ETH #Binance
$ETH 6h Analysis Time 12:50 to 18:50
Current Price: $1,904.53
24h Change: -1.74%
RSI: 25.87
Trend: Downtrend
Bias: Bearish
Resistance: $1,956.50
Support: $1,878.00
Critical Support: $1,903.02
Advice for traders/investors:
Wait for a bullish reversal signal before entering long. RSI above 50 or price holding above $1,903 signals recovery. Take profits near resistance. Only risk capital you can afford to lose.
#Crypto #Trading #ETH #Binance
Current Price: $1,904.53
24h Change: -1.74%
RSI: 25.87
Trend: Downtrend
Bias: Bearish
Resistance: $1,956.50
Support: $1,878.00
Critical Support: $1,903.02
Advice for traders/investors:
Wait for a bullish reversal signal before entering long. RSI above 50 or price holding above $1,903 signals recovery. Take profits near resistance. Only risk capital you can afford to lose.
#Crypto #Trading #ETH #Binance
1
50
·
--
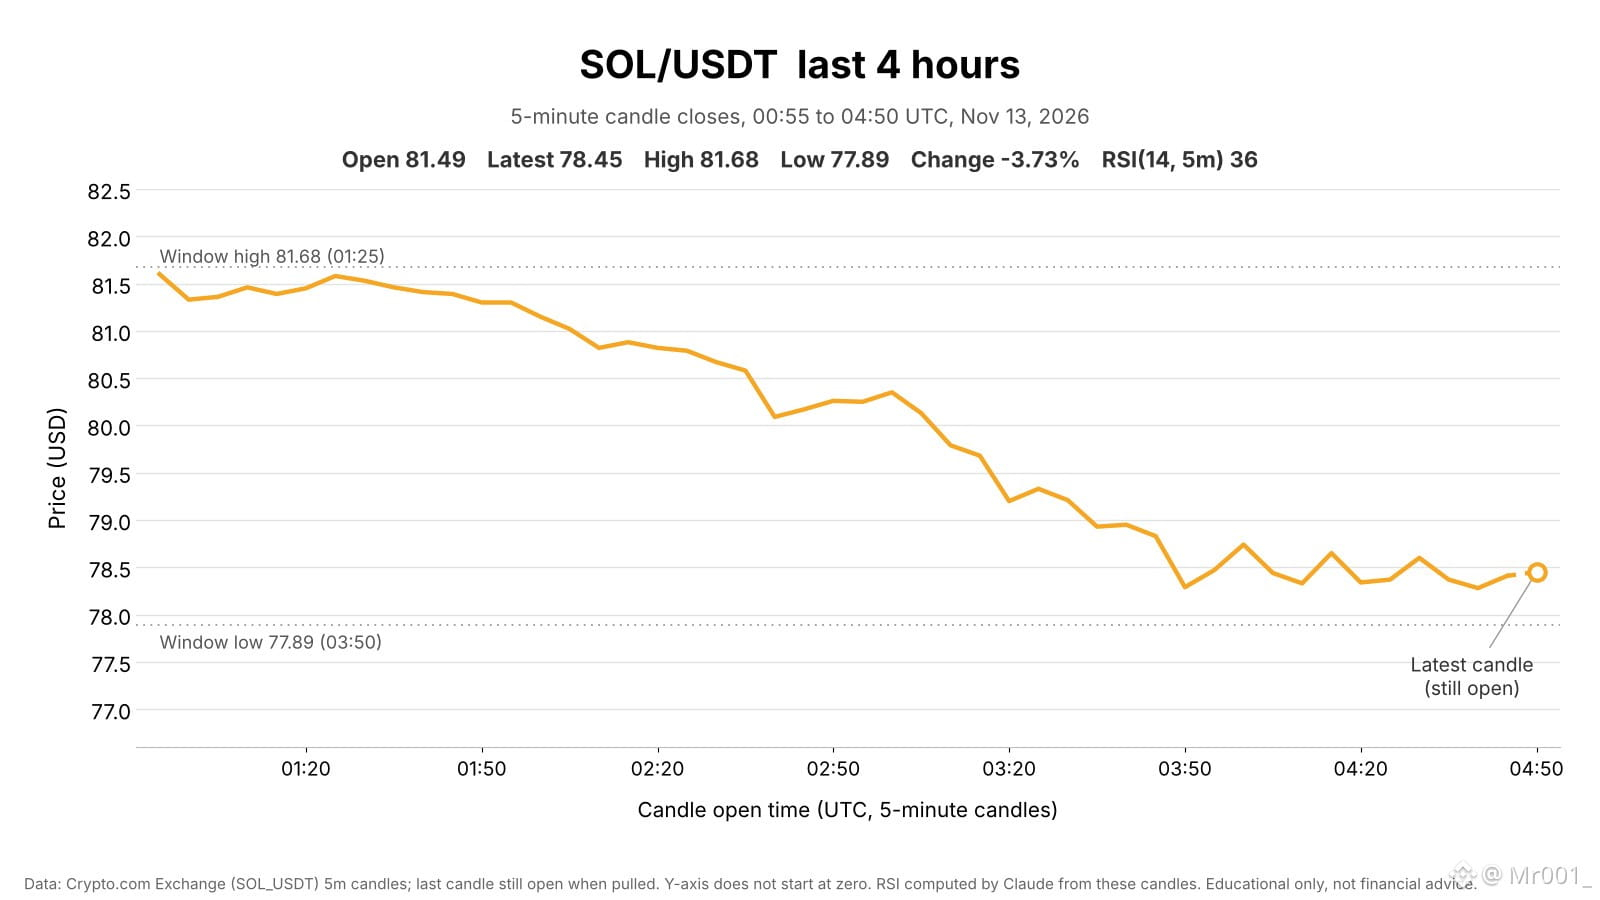
$SOL slides 3.7% to a 50-day low, then stalls near $78.4
Last 4 hours, Nov 13 00:55 – 04:50 UTC
$SOL is at $78.45, down 3.73% from $81.49. High $81.68, low $77.89 (4.87% range). Price held $81.0–$81.6 until ~02:05, slid to $79.2 by 03:20, hit the $77.89 low at 03:50 on the window's heaviest volume, then stalled at $78.3–$79.3.
📊 Market context
▪ BTC -3.31% over the same window. SOL lagged BTC by 0.42 pts.
▪ SOL is -4.0% since today's 00:00 UTC open ($81.72) and -17.9% since the Nov 5 open ($95.61), against BTC's -14.6%. Its $77.89 low is the lowest in the 50 days of daily data (since Sep 25).
📈 Volume
▪ 4h volume on Crypto.com ~$3.9M: 2.68x the 7-day average 4h bar ($1.5M) and 3.30x the median ($1.2M). The 03:50 candle was 8% of it.
🔎 Technicals & levels
▪ RSI(14, 5m) 36. On 4h bars RSI is 20 and price is below its 20-bar average ($83.40). On daily bars RSI is 20 and price is below its 20-day average ($93.09).
▪ Resistance: $81.68 (window high), $83.93 (Nov 12 high)
▪ Support: $77.89 (window low, a 50-day low)
🗓 News & Catalysts
▪ DTCC plans to bring tokenized securities to Solana in late 2027, making it the fifth network on its tokenization roadmap (per Unchained and Cointelegraph).
▪ Spout Finance added USDC loans on Solana using Ondo tokenized equities (per COINTURK).
#solana #AnthropicRejectsIPODelayValuationinQuestion #analysis
{spot}(SOLUSDT)
$SOL slides 3.7% to a 50-day low, then stalls near $78.4
Last 4 hours, Nov 13 00:55 – 04:50 UTC
$SOL is at $78.45, down 3.73% from $81.49. High $81.68, low $77.89 (4.87% range). Price held $81.0–$81.6 until ~02:05, slid to $79.2 by 03:20, hit the $77.89 low at 03:50 on the window's heaviest volume, then stalled at $78.3–$79.3.
📊 Market context
▪ BTC -3.31% over the same window. SOL lagged BTC by 0.42 pts.
▪ SOL is -4.0% since today's 00:00 UTC open ($81.72) and -17.9% since the Nov 5 open ($95.61), against BTC's -14.6%. Its $77.89 low is the lowest in the 50 days of daily data (since Sep 25).
📈 Volume
▪ 4h volume on Crypto.com ~$3.9M: 2.68x the 7-day average 4h bar ($1.5M) and 3.30x the median ($1.2M). The 03:50 candle was 8% of it.
🔎 Technicals & levels
▪ RSI(14, 5m) 36. On 4h bars RSI is 20 and price is below its 20-bar average ($83.40). On daily bars RSI is 20 and price is below its 20-day average ($93.09).
▪ Resistance: $81.68 (window high), $83.93 (Nov 12 high)
▪ Support: $77.89 (window low, a 50-day low)
🗓 News & Catalysts
▪ DTCC plans to bring tokenized securities to Solana in late 2027, making it the fifth network on its tokenization roadmap (per Unchained and Cointelegraph).
▪ Spout Finance added USDC loans on Solana using Ondo tokenized equities (per COINTURK).
#solana #AnthropicRejectsIPODelayValuationinQuestion #analysis
Last 4 hours, Nov 13 00:55 – 04:50 UTC
$SOL is at $78.45, down 3.73% from $81.49. High $81.68, low $77.89 (4.87% range). Price held $81.0–$81.6 until ~02:05, slid to $79.2 by 03:20, hit the $77.89 low at 03:50 on the window's heaviest volume, then stalled at $78.3–$79.3.
📊 Market context
▪ BTC -3.31% over the same window. SOL lagged BTC by 0.42 pts.
▪ SOL is -4.0% since today's 00:00 UTC open ($81.72) and -17.9% since the Nov 5 open ($95.61), against BTC's -14.6%. Its $77.89 low is the lowest in the 50 days of daily data (since Sep 25).
📈 Volume
▪ 4h volume on Crypto.com ~$3.9M: 2.68x the 7-day average 4h bar ($1.5M) and 3.30x the median ($1.2M). The 03:50 candle was 8% of it.
🔎 Technicals & levels
▪ RSI(14, 5m) 36. On 4h bars RSI is 20 and price is below its 20-bar average ($83.40). On daily bars RSI is 20 and price is below its 20-day average ($93.09).
▪ Resistance: $81.68 (window high), $83.93 (Nov 12 high)
▪ Support: $77.89 (window low, a 50-day low)
🗓 News & Catalysts
▪ DTCC plans to bring tokenized securities to Solana in late 2027, making it the fifth network on its tokenization roadmap (per Unchained and Cointelegraph).
▪ Spout Finance added USDC loans on Solana using Ondo tokenized equities (per COINTURK).
#solana #AnthropicRejectsIPODelayValuationinQuestion #analysis
128
·
--
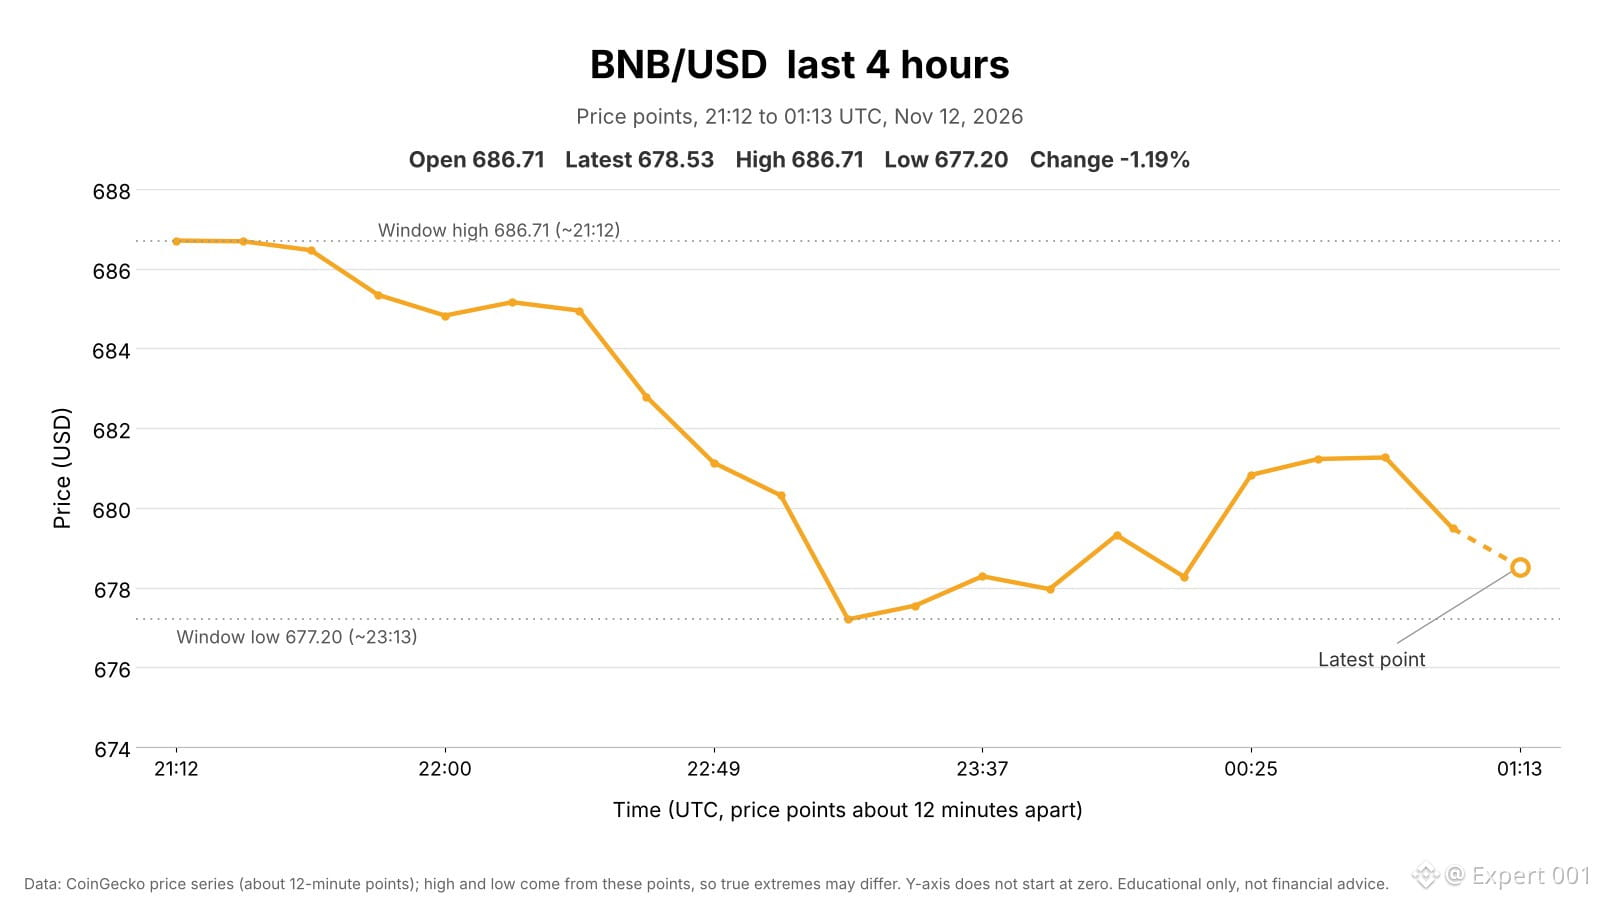
$BNB slides 1.4% to $677, recovers to $681, then slips back
Last 4 hours, Nov 11 21:12 – Nov 12 01:13 UTC
$BNB is at $678.53, down 1.19% from $686.71. High $686.71 (the window's first point), low $677.20 (1.40% range). Price slid to $677.20 by ~23:13, recovered to $681.26 by ~00:49, then slipped back to $678.53.
📊 Market context
▪ BTC -1.28% over the same window. BNB beat BTC by 0.08 pts.
▪ BNB is -0.04% over 24h (BTC +0.30%) and -5.65% over 7 days.
🔎 Levels
▪ Resistance: $686.71 (window high), $687.59 (24h high, Nov 11 ~18:36)
▪ Support: $677.20 (window low), $676.95 (24h low, Nov 11 ~06:57), $670.58 (7-day low, Nov 10 ~16:46)
🗓 News & Catalysts
▪ Nomura's Laser Digital helped launch a Saudi SME credit vault on BNB Chain targeting a $100M raise (per PANews, The Block and Crypto Briefing).
▪ Coindoo published a piece on fake USDT on BNB Chain.#BNB走势 #viralpost #analysis #cryptouniverseofficial
{spot}(BNBUSDT)
$BNB slides 1.4% to $677, recovers to $681, then slips back
Last 4 hours, Nov 11 21:12 – Nov 12 01:13 UTC
$BNB is at $678.53, down 1.19% from $686.71. High $686.71 (the window's first point), low $677.20 (1.40% range). Price slid to $677.20 by ~23:13, recovered to $681.26 by ~00:49, then slipped back to $678.53.
📊 Market context
▪ BTC -1.28% over the same window. BNB beat BTC by 0.08 pts.
▪ BNB is -0.04% over 24h (BTC +0.30%) and -5.65% over 7 days.
🔎 Levels
▪ Resistance: $686.71 (window high), $687.59 (24h high, Nov 11 ~18:36)
▪ Support: $677.20 (window low), $676.95 (24h low, Nov 11 ~06:57), $670.58 (7-day low, Nov 10 ~16:46)
🗓 News & Catalysts
▪ Nomura's Laser Digital helped launch a Saudi SME credit vault on BNB Chain targeting a $100M raise (per PANews, The Block and Crypto Briefing).
▪ Coindoo published a piece on fake USDT on BNB Chain.#BNB走势 #viralpost #analysis #cryptouniverseofficial
Last 4 hours, Nov 11 21:12 – Nov 12 01:13 UTC
$BNB is at $678.53, down 1.19% from $686.71. High $686.71 (the window's first point), low $677.20 (1.40% range). Price slid to $677.20 by ~23:13, recovered to $681.26 by ~00:49, then slipped back to $678.53.
📊 Market context
▪ BTC -1.28% over the same window. BNB beat BTC by 0.08 pts.
▪ BNB is -0.04% over 24h (BTC +0.30%) and -5.65% over 7 days.
🔎 Levels
▪ Resistance: $686.71 (window high), $687.59 (24h high, Nov 11 ~18:36)
▪ Support: $677.20 (window low), $676.95 (24h low, Nov 11 ~06:57), $670.58 (7-day low, Nov 10 ~16:46)
🗓 News & Catalysts
▪ Nomura's Laser Digital helped launch a Saudi SME credit vault on BNB Chain targeting a $100M raise (per PANews, The Block and Crypto Briefing).
▪ Coindoo published a piece on fake USDT on BNB Chain.#BNB走势 #viralpost #analysis #cryptouniverseofficial
1
125
·
--
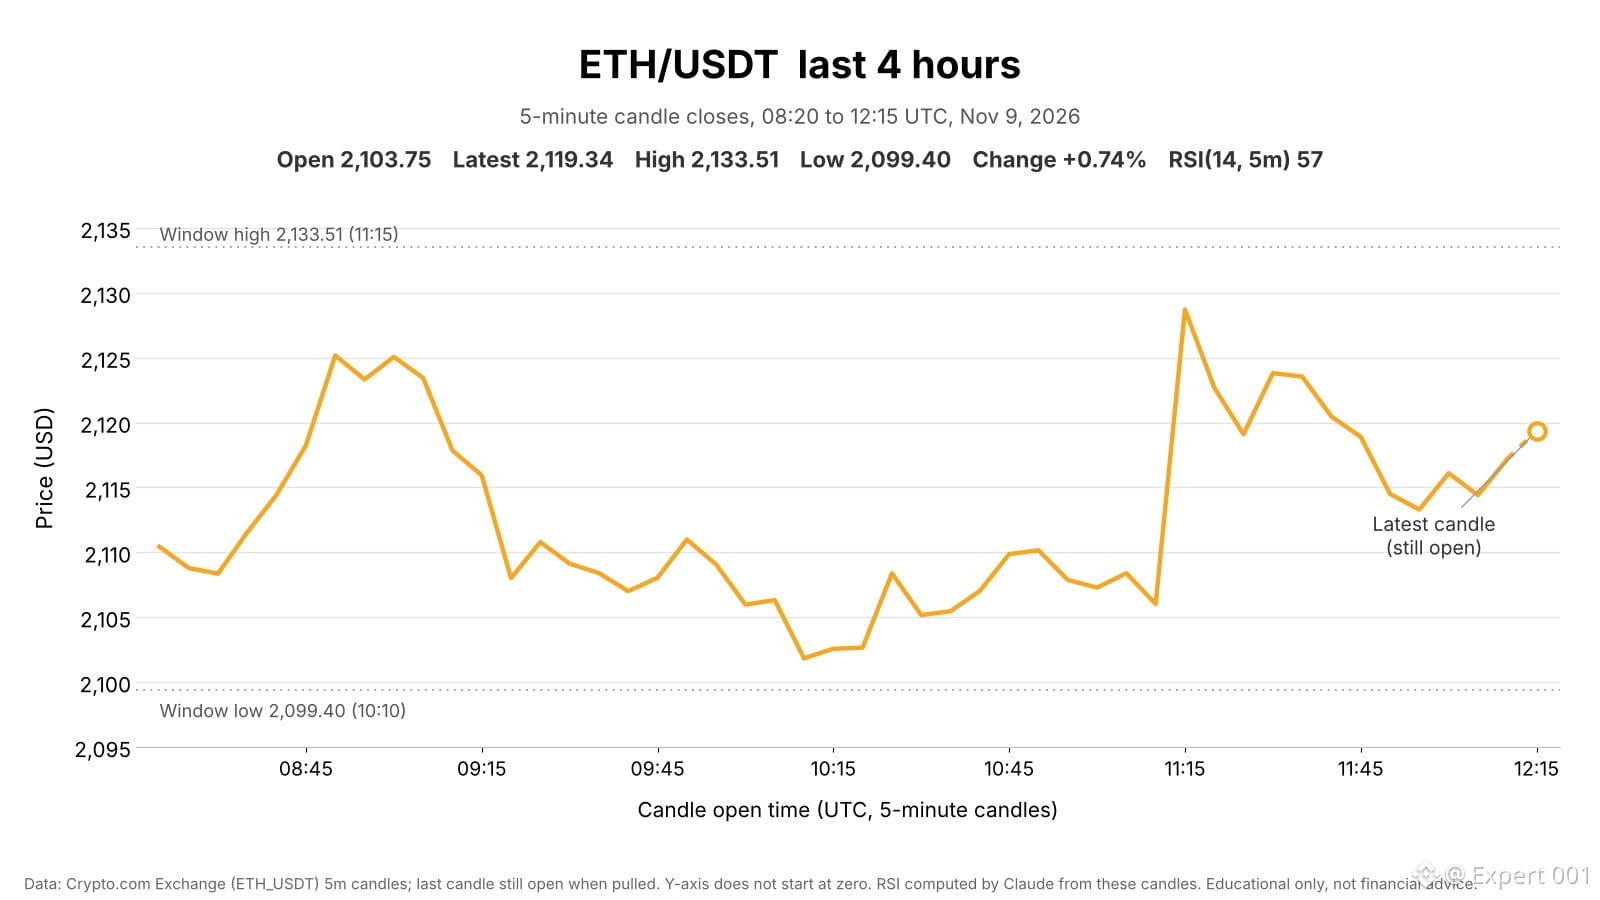
$ETH jumps 1% at 11:15, then holds above $2,110
Last 4 hours, Nov 9 08:20 – 12:15 UTC
ETH is at $2,119.34, up 0.74% from $2,103.75. High $2,133.51, low $2,099.40 (1.62% range). Price rose to $2,125 by 08:50, slid to $2,102 by 10:10, jumped to $2,129 in the 11:15 candle on the window's heaviest volume, then held $2,113–$2,124.
📊 Market context
▪ BTC +0.50% over the same 4h. ETH beat BTC by 0.24 pts.
▪ ETH fell 5.0% on Nov 8 (BTC -1.3%), with a flush to $2,060 in the 20:00–24:00 UTC candle. It is down 12.6% since the Nov 5 open ($2,424.65), against BTC's 7.4%.
▪ US spot ETH ETFs: $93.2M net outflow on Friday, $365.3M for the week, a sixth straight negative week (per The Block).
▪ CMC Fear & Greed (Nov 7): 31 (Fear).
📈 Volume
▪ 4h volume on Crypto.com ~$7.4M: 0.90x the 7-day average 4h bar ($8.2M, which includes the Nov 8 flush and the Nov 5–6 sell-off) and 1.39x the median ($5.3M). The 11:15 candle was 7% of it.
🔎 Technicals & levels
▪ RSI(14, 5m) 57. On 4h bars RSI is 28 and price is below its 20-bar average ($2,215). On daily bars RSI is 32 and price is below its 20-day average ($2,312).
▪ Resistance: $2,133.51 (window high), $2,160.55 (Nov 9 high)
▪ Support: $2,099.40 (window low), $2,082.95 (Nov 9 low)
🗓 News & Catalysts
▪ Ankr's Ethereum bridge exploit drained $303K after an Optimism deposit was reused (per Crypto.news).
▪ Raycash, a Zama spinoff, launched a privacy stablecoin payment app on Ethereum (per PANews).
▪ Next: Fed's Bowman speaks (Nov 9, 13:40 UTC), US CPI (Nov 10, 13:30 UTC).
#CPITestsDecemberRateOutlook #ETH #viralpost #analysis #cryptouniverseofficial
{spot}(ETHUSDT)
$ETH jumps 1% at 11:15, then holds above $2,110
Last 4 hours, Nov 9 08:20 – 12:15 UTC
ETH is at $2,119.34, up 0.74% from $2,103.75. High $2,133.51, low $2,099.40 (1.62% range). Price rose to $2,125 by 08:50, slid to $2,102 by 10:10, jumped to $2,129 in the 11:15 candle on the window's heaviest volume, then held $2,113–$2,124.
📊 Market context
▪ BTC +0.50% over the same 4h. ETH beat BTC by 0.24 pts.
▪ ETH fell 5.0% on Nov 8 (BTC -1.3%), with a flush to $2,060 in the 20:00–24:00 UTC candle. It is down 12.6% since the Nov 5 open ($2,424.65), against BTC's 7.4%.
▪ US spot ETH ETFs: $93.2M net outflow on Friday, $365.3M for the week, a sixth straight negative week (per The Block).
▪ CMC Fear & Greed (Nov 7): 31 (Fear).
📈 Volume
▪ 4h volume on Crypto.com ~$7.4M: 0.90x the 7-day average 4h bar ($8.2M, which includes the Nov 8 flush and the Nov 5–6 sell-off) and 1.39x the median ($5.3M). The 11:15 candle was 7% of it.
🔎 Technicals & levels
▪ RSI(14, 5m) 57. On 4h bars RSI is 28 and price is below its 20-bar average ($2,215). On daily bars RSI is 32 and price is below its 20-day average ($2,312).
▪ Resistance: $2,133.51 (window high), $2,160.55 (Nov 9 high)
▪ Support: $2,099.40 (window low), $2,082.95 (Nov 9 low)
🗓 News & Catalysts
▪ Ankr's Ethereum bridge exploit drained $303K after an Optimism deposit was reused (per Crypto.news).
▪ Raycash, a Zama spinoff, launched a privacy stablecoin payment app on Ethereum (per PANews).
▪ Next: Fed's Bowman speaks (Nov 9, 13:40 UTC), US CPI (Nov 10, 13:30 UTC).
#CPITestsDecemberRateOutlook #ETH #viralpost #analysis #cryptouniverseofficial
Last 4 hours, Nov 9 08:20 – 12:15 UTC
ETH is at $2,119.34, up 0.74% from $2,103.75. High $2,133.51, low $2,099.40 (1.62% range). Price rose to $2,125 by 08:50, slid to $2,102 by 10:10, jumped to $2,129 in the 11:15 candle on the window's heaviest volume, then held $2,113–$2,124.
📊 Market context
▪ BTC +0.50% over the same 4h. ETH beat BTC by 0.24 pts.
▪ ETH fell 5.0% on Nov 8 (BTC -1.3%), with a flush to $2,060 in the 20:00–24:00 UTC candle. It is down 12.6% since the Nov 5 open ($2,424.65), against BTC's 7.4%.
▪ US spot ETH ETFs: $93.2M net outflow on Friday, $365.3M for the week, a sixth straight negative week (per The Block).
▪ CMC Fear & Greed (Nov 7): 31 (Fear).
📈 Volume
▪ 4h volume on Crypto.com ~$7.4M: 0.90x the 7-day average 4h bar ($8.2M, which includes the Nov 8 flush and the Nov 5–6 sell-off) and 1.39x the median ($5.3M). The 11:15 candle was 7% of it.
🔎 Technicals & levels
▪ RSI(14, 5m) 57. On 4h bars RSI is 28 and price is below its 20-bar average ($2,215). On daily bars RSI is 32 and price is below its 20-day average ($2,312).
▪ Resistance: $2,133.51 (window high), $2,160.55 (Nov 9 high)
▪ Support: $2,099.40 (window low), $2,082.95 (Nov 9 low)
🗓 News & Catalysts
▪ Ankr's Ethereum bridge exploit drained $303K after an Optimism deposit was reused (per Crypto.news).
▪ Raycash, a Zama spinoff, launched a privacy stablecoin payment app on Ethereum (per PANews).
▪ Next: Fed's Bowman speaks (Nov 9, 13:40 UTC), US CPI (Nov 10, 13:30 UTC).
#CPITestsDecemberRateOutlook #ETH #viralpost #analysis #cryptouniverseofficial
1
85
·
--
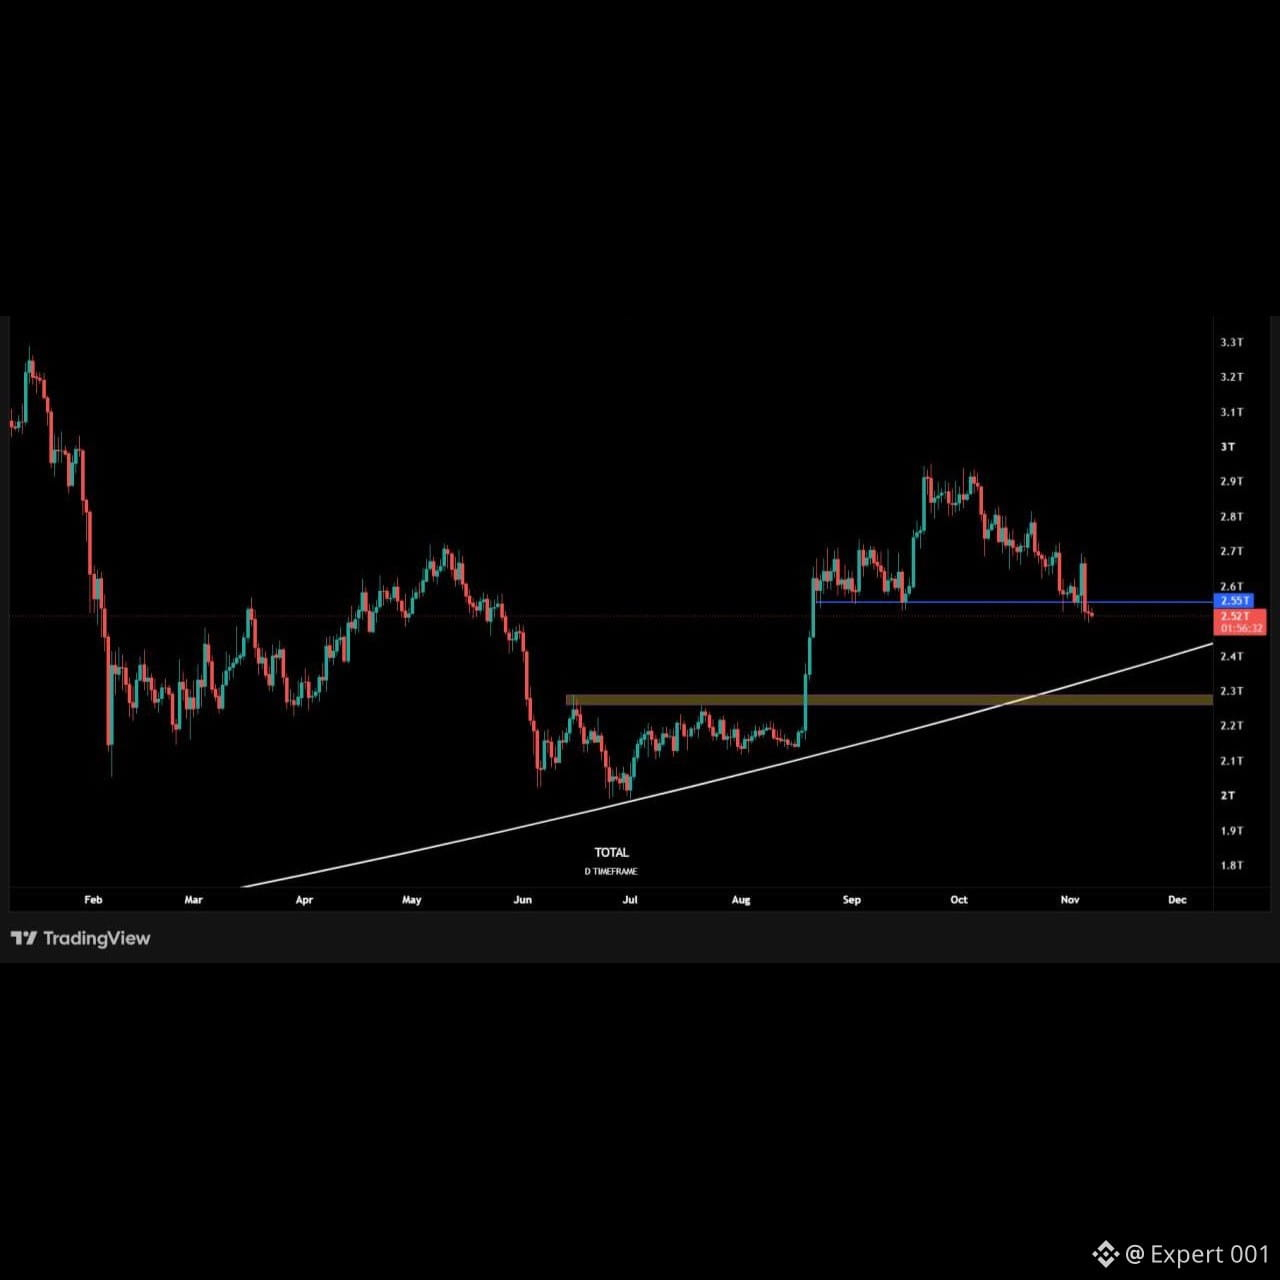
Crypto Total Market Cap has found acceptance below $2.55T. If this level is not reclaimed as soon as possible, we can expect lower prices.
TOTAL 1D
#cryptouniverseofficial #JobsReportRaisesHikeOdds #viralpost #analysis
Crypto Total Market Cap has found acceptance below $2.55T. If this level is not reclaimed as soon as possible, we can expect lower prices.
TOTAL 1D
#cryptouniverseofficial #JobsReportRaisesHikeOdds #viralpost #analysis
TOTAL 1D
#cryptouniverseofficial #JobsReportRaisesHikeOdds #viralpost #analysis
1
88
·
--
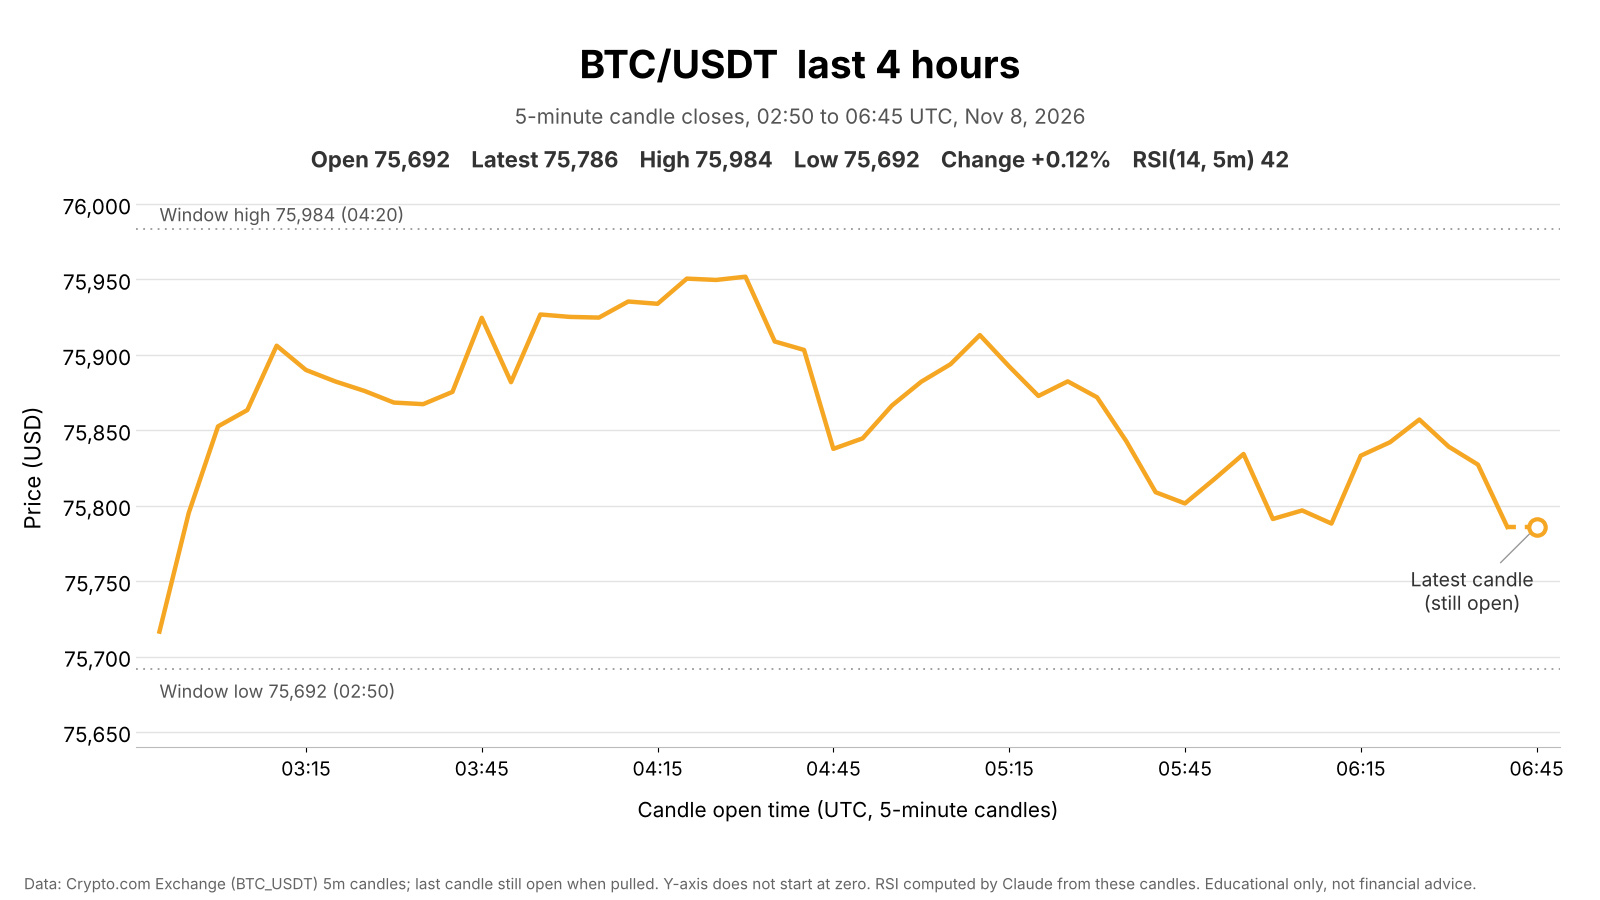
$BTC climbs off the 02:50 low, then fades toward $75.8K
Last 4 hours, Nov 8 02:50 – 06:45 UTC
$BTC is at $75,786, up 0.12% from $75,692. High $75,984, low $75,692 (0.39% range). Price climbed on heavy volume between 02:55 and 03:15, peaked near $75,950 around 04:20–04:30, then faded back toward $75,790.
📊 Market context
▪
BTC is down 2.2% since Nov 1 and 5.9% since the Nov 5 open ($80,507).
▪ US spot BTC ETFs: $411.9M net outflow on Friday, $1.28B for the week, a second straight negative week that turned 2026 flows negative (per The Block).
▪ CMC Fear & Greed (Nov 7): 31 (Fear).
📈 Volume
▪ 4h volume on Crypto.com ~$2.1M: 0.12x the 7-day average 4h bar ($17.1M, skewed by the Nov 5–6 sell-off) and 0.20x the median ($10.2M). The 02:55 candle was 7% of it.
🔎 Technicals & levels
▪ RSI(14, 5m) 42. On 4h bars RSI is 41 and price is below its 20-bar average ($76,846). On daily bars RSI is 38 and price is below its 20-day average ($79,444).
▪ Resistance: $75,984 (window high), $76,252 (Nov 7 high)
▪ Support: $75,692 (window low), $75,550 (Nov 7 low)
🗓 News & Catalysts
▪ EU set up a dedicated crypto task force to crack down on Russian sanctions evasion (per PANews).
▪ A Blockchain Reporter piece argues BTC's 64-day Coinbase discount mostly reflects a USDT basis rather than US selling.
▪ Next: China CPI/PPI (Nov 9, 01:30 UTC), Fed's Bowman speaks (Nov 9, 13:40 UTC), US CPI (Nov 10, 13:30 UTC).
#BTC #JobsReportRaisesHikeOdds #viralpost #analysis #cryptouniverseofficial
$BTC climbs off the 02:50 low, then fades toward $75.8K
Last 4 hours, Nov 8 02:50 – 06:45 UTC
$BTC is at $75,786, up 0.12% from $75,692. High $75,984, low $75,692 (0.39% range). Price climbed on heavy volume between 02:55 and 03:15, peaked near $75,950 around 04:20–04:30, then faded back toward $75,790.
📊 Market context
▪
BTC is down 2.2% since Nov 1 and 5.9% since the Nov 5 open ($80,507).
▪ US spot BTC ETFs: $411.9M net outflow on Friday, $1.28B for the week, a second straight negative week that turned 2026 flows negative (per The Block).
▪ CMC Fear & Greed (Nov 7): 31 (Fear).
📈 Volume
▪ 4h volume on Crypto.com ~$2.1M: 0.12x the 7-day average 4h bar ($17.1M, skewed by the Nov 5–6 sell-off) and 0.20x the median ($10.2M). The 02:55 candle was 7% of it.
🔎 Technicals & levels
▪ RSI(14, 5m) 42. On 4h bars RSI is 41 and price is below its 20-bar average ($76,846). On daily bars RSI is 38 and price is below its 20-day average ($79,444).
▪ Resistance: $75,984 (window high), $76,252 (Nov 7 high)
▪ Support: $75,692 (window low), $75,550 (Nov 7 low)
🗓 News & Catalysts
▪ EU set up a dedicated crypto task force to crack down on Russian sanctions evasion (per PANews).
▪ A Blockchain Reporter piece argues BTC's 64-day Coinbase discount mostly reflects a USDT basis rather than US selling.
▪ Next: China CPI/PPI (Nov 9, 01:30 UTC), Fed's Bowman speaks (Nov 9, 13:40 UTC), US CPI (Nov 10, 13:30 UTC).
#BTC #JobsReportRaisesHikeOdds #viralpost #analysis #cryptouniverseofficial
Last 4 hours, Nov 8 02:50 – 06:45 UTC
$BTC is at $75,786, up 0.12% from $75,692. High $75,984, low $75,692 (0.39% range). Price climbed on heavy volume between 02:55 and 03:15, peaked near $75,950 around 04:20–04:30, then faded back toward $75,790.
📊 Market context
▪
BTC is down 2.2% since Nov 1 and 5.9% since the Nov 5 open ($80,507).
▪ US spot BTC ETFs: $411.9M net outflow on Friday, $1.28B for the week, a second straight negative week that turned 2026 flows negative (per The Block).
▪ CMC Fear & Greed (Nov 7): 31 (Fear).
📈 Volume
▪ 4h volume on Crypto.com ~$2.1M: 0.12x the 7-day average 4h bar ($17.1M, skewed by the Nov 5–6 sell-off) and 0.20x the median ($10.2M). The 02:55 candle was 7% of it.
🔎 Technicals & levels
▪ RSI(14, 5m) 42. On 4h bars RSI is 41 and price is below its 20-bar average ($76,846). On daily bars RSI is 38 and price is below its 20-day average ($79,444).
▪ Resistance: $75,984 (window high), $76,252 (Nov 7 high)
▪ Support: $75,692 (window low), $75,550 (Nov 7 low)
🗓 News & Catalysts
▪ EU set up a dedicated crypto task force to crack down on Russian sanctions evasion (per PANews).
▪ A Blockchain Reporter piece argues BTC's 64-day Coinbase discount mostly reflects a USDT basis rather than US selling.
▪ Next: China CPI/PPI (Nov 9, 01:30 UTC), Fed's Bowman speaks (Nov 9, 13:40 UTC), US CPI (Nov 10, 13:30 UTC).
#BTC #JobsReportRaisesHikeOdds #viralpost #analysis #cryptouniverseofficial
1
97
·
--
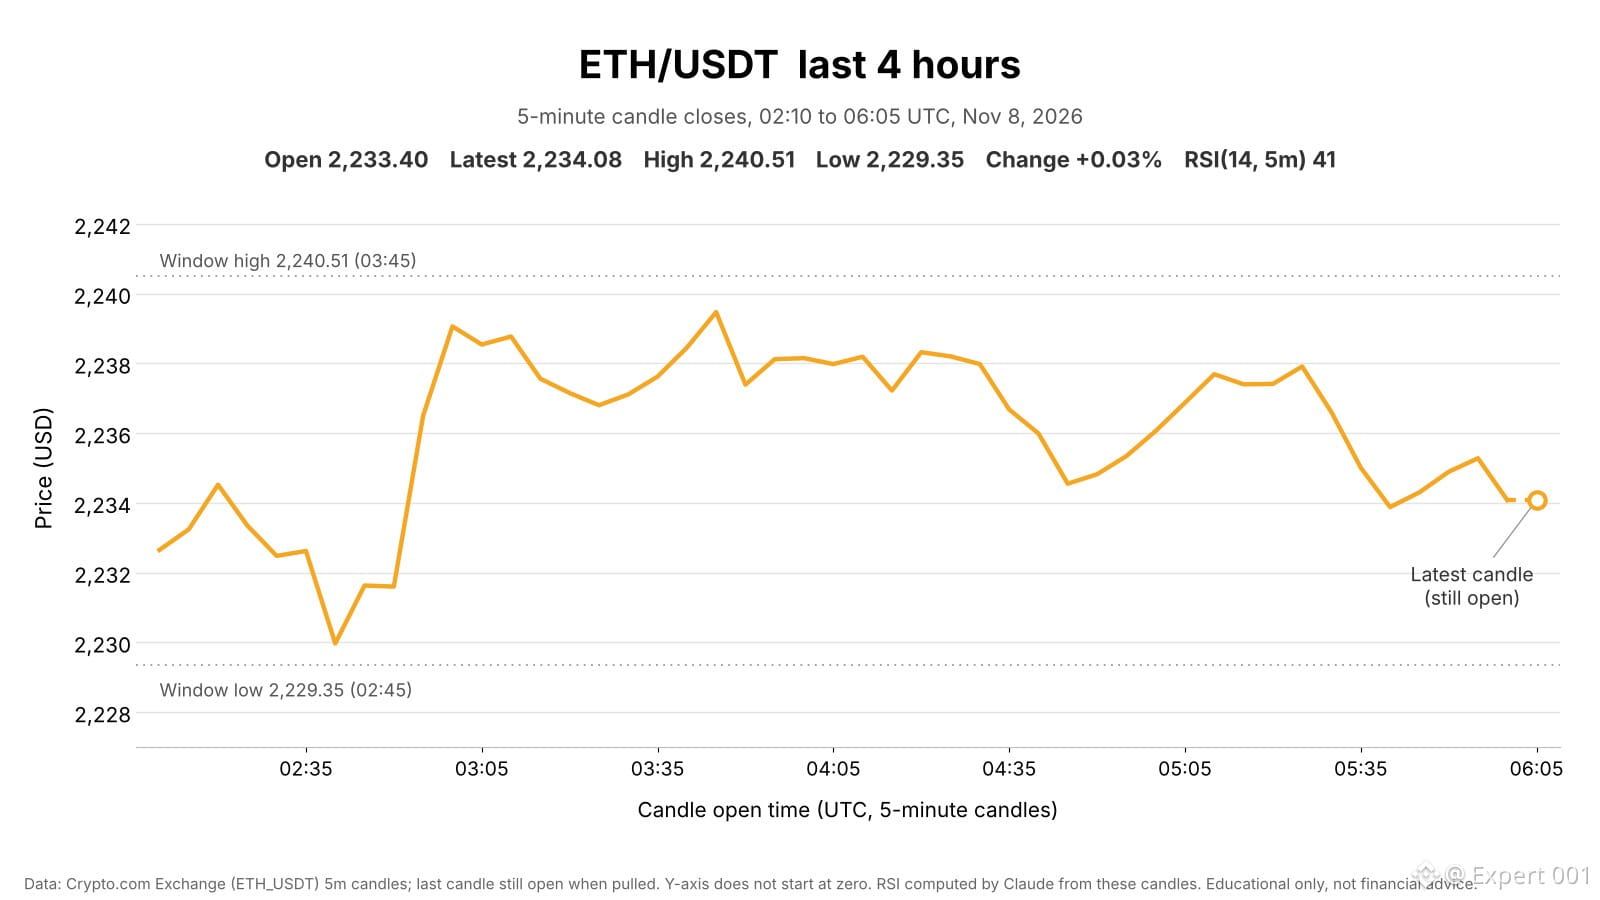
$ETH round-trips: dips to $2,229, jumps to $2,239, ends flat
Last 4 hours, Nov 8 02:10 – 06:05 UTC
ETH is at $2,234.08, up 0.03% from $2,233.40. High $2,240.51, low $2,229.35 (0.50% range). Price dipped to the low at 02:45, jumped to ~$2,239 by 03:00 on the window's heaviest volume, then drifted back to $2,234.
📊 Market context
▪ BTC +0.08% over the same 4h. ETH lagged by 0.05 pts.
▪ US spot ETH ETFs: $93.2M net outflow on Friday, $365.3M for the week, a sixth straight negative week (per The Block).
▪ CMC Fear & Greed (Nov 7): 31 (Fear).
📈 Volume
▪ 4h volume on Crypto.com ~$1.5M: 0.21x the 7-day average 4h bar ($7.4M, skewed by the Nov 5–6 sell-off) and 0.33x the median ($4.7M). The 02:55 candle was 8% of it.
🔎 Technicals & levels
▪ RSI(14, 5m) 41. On 4h bars RSI is 42 and price is below its 20-bar average ($2,277). On daily bars RSI is 39 and price is below its 20-day average ($2,326).
▪ Resistance: $2,240.51 (window high), $2,251.39 (Nov 7 high)
▪ Support: $2,229.35 (window low), $2,222.51 (Nov 7 low)
🗓 News & Catalysts
▪ Amundi put a European equity fund share class on Ethereum (per NewsBTC).
▪ Next: China CPI/PPI (Nov 9, 01:30 UTC), Fed's Bowman speaks (Nov 9, 13:40 UTC), US CPI (Nov 10, 13:30 UTC).
#JobsReportRaisesHikeOdds #viralpost
{spot}(ETHUSDT)
#Ethereum #analysis
$ETH round-trips: dips to $2,229, jumps to $2,239, ends flat
Last 4 hours, Nov 8 02:10 – 06:05 UTC
ETH is at $2,234.08, up 0.03% from $2,233.40. High $2,240.51, low $2,229.35 (0.50% range). Price dipped to the low at 02:45, jumped to ~$2,239 by 03:00 on the window's heaviest volume, then drifted back to $2,234.
📊 Market context
▪ BTC +0.08% over the same 4h. ETH lagged by 0.05 pts.
▪ US spot ETH ETFs: $93.2M net outflow on Friday, $365.3M for the week, a sixth straight negative week (per The Block).
▪ CMC Fear & Greed (Nov 7): 31 (Fear).
📈 Volume
▪ 4h volume on Crypto.com ~$1.5M: 0.21x the 7-day average 4h bar ($7.4M, skewed by the Nov 5–6 sell-off) and 0.33x the median ($4.7M). The 02:55 candle was 8% of it.
🔎 Technicals & levels
▪ RSI(14, 5m) 41. On 4h bars RSI is 42 and price is below its 20-bar average ($2,277). On daily bars RSI is 39 and price is below its 20-day average ($2,326).
▪ Resistance: $2,240.51 (window high), $2,251.39 (Nov 7 high)
▪ Support: $2,229.35 (window low), $2,222.51 (Nov 7 low)
🗓 News & Catalysts
▪ Amundi put a European equity fund share class on Ethereum (per NewsBTC).
▪ Next: China CPI/PPI (Nov 9, 01:30 UTC), Fed's Bowman speaks (Nov 9, 13:40 UTC), US CPI (Nov 10, 13:30 UTC).
#JobsReportRaisesHikeOdds #viralpost
#Ethereum #analysis
Last 4 hours, Nov 8 02:10 – 06:05 UTC
ETH is at $2,234.08, up 0.03% from $2,233.40. High $2,240.51, low $2,229.35 (0.50% range). Price dipped to the low at 02:45, jumped to ~$2,239 by 03:00 on the window's heaviest volume, then drifted back to $2,234.
📊 Market context
▪ BTC +0.08% over the same 4h. ETH lagged by 0.05 pts.
▪ US spot ETH ETFs: $93.2M net outflow on Friday, $365.3M for the week, a sixth straight negative week (per The Block).
▪ CMC Fear & Greed (Nov 7): 31 (Fear).
📈 Volume
▪ 4h volume on Crypto.com ~$1.5M: 0.21x the 7-day average 4h bar ($7.4M, skewed by the Nov 5–6 sell-off) and 0.33x the median ($4.7M). The 02:55 candle was 8% of it.
🔎 Technicals & levels
▪ RSI(14, 5m) 41. On 4h bars RSI is 42 and price is below its 20-bar average ($2,277). On daily bars RSI is 39 and price is below its 20-day average ($2,326).
▪ Resistance: $2,240.51 (window high), $2,251.39 (Nov 7 high)
▪ Support: $2,229.35 (window low), $2,222.51 (Nov 7 low)
🗓 News & Catalysts
▪ Amundi put a European equity fund share class on Ethereum (per NewsBTC).
▪ Next: China CPI/PPI (Nov 9, 01:30 UTC), Fed's Bowman speaks (Nov 9, 13:40 UTC), US CPI (Nov 10, 13:30 UTC).
#JobsReportRaisesHikeOdds #viralpost
#Ethereum #analysis
1
122
·
--
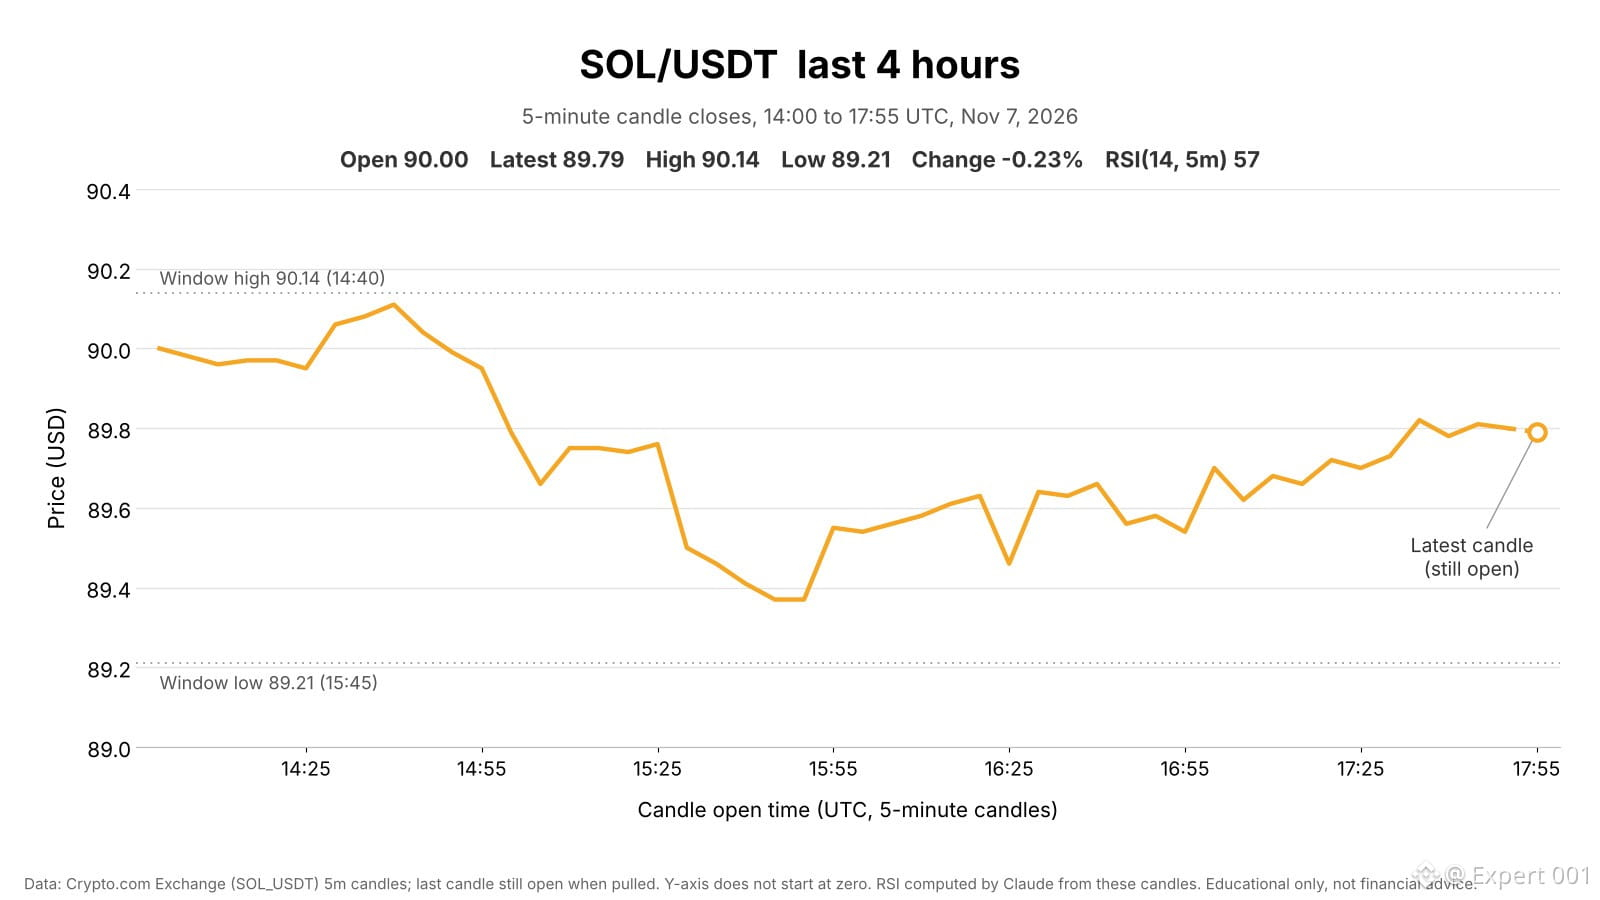
$SOL slips to $89.4, then regains about half
Last 4 hours, Nov 7 14:00 – 17:55 UTC
SOL is at $89.79, down 0.23% from $90.00. High $90.14, low $89.21 (1.04% range). Price held $89.95–$90.11 until ~15:00, slid to $89.37 by 15:45 (the window's heaviest volume), then regained about half of the drop.
📊 Market context
▪ Total crypto market cap -0.17% in 4h, BTC -0.12%. SOL lagged BTC by 0.12 pts.
▪ SOL -6.6% over 7 days, -5.1% this week after three straight weekly declines. It trails BTC by 4.4 pts over 7 days and 10.1 pts over 30 days.
▪ CMC Fear & Greed (daily): 31 (Fear), down from 61 a month ago.
▪ US spot SOL ETFs: $26.3M net outflow last week, nearly all on Friday, five straight negative weeks totaling $165.4M (per The Block).
📈 Volume
▪ 4h volume on Crypto.com ~$0.54M: 0.33x the 7-day average 4h bar ($1.6M, skewed by the Nov 5–6 sell-off) and 0.45x the median ($1.2M). The 15:45 candle was 11% of it.
🔎 Technicals & levels
▪ RSI(14, 5m) 57. On 4h bars RSI is 37.6 and price is below its 20-bar average ($91.85). On daily bars price is below its 20-day ($98.86) and 50-day ($108.16) averages.
▪ Resistance: $90.14 (window high, also the nearest 4h resistance per CMC)
▪ Support: $89.21 (window low), $88.48 (4h bars, per CMC)
🗓 News & Catalysts
▪ Samsung Wallet's USDC account on Solana went live Nov 2 for eligible US Galaxy users (per a Solana Foundation update, via TradingView News).
▪ Next: China CPI/PPI (Nov 9, 01:30 UTC), Fed's Bowman speaks (Nov 9, 13:40 UTC), US CPI (Nov 10, 13:30 UTC).
#solana #viralpost #cryptouniverseofficial #JobsReportRaisesHikeOdds #analysis
{spot}(SOLUSDT)
$SOL slips to $89.4, then regains about half
Last 4 hours, Nov 7 14:00 – 17:55 UTC
SOL is at $89.79, down 0.23% from $90.00. High $90.14, low $89.21 (1.04% range). Price held $89.95–$90.11 until ~15:00, slid to $89.37 by 15:45 (the window's heaviest volume), then regained about half of the drop.
📊 Market context
▪ Total crypto market cap -0.17% in 4h, BTC -0.12%. SOL lagged BTC by 0.12 pts.
▪ SOL -6.6% over 7 days, -5.1% this week after three straight weekly declines. It trails BTC by 4.4 pts over 7 days and 10.1 pts over 30 days.
▪ CMC Fear & Greed (daily): 31 (Fear), down from 61 a month ago.
▪ US spot SOL ETFs: $26.3M net outflow last week, nearly all on Friday, five straight negative weeks totaling $165.4M (per The Block).
📈 Volume
▪ 4h volume on Crypto.com ~$0.54M: 0.33x the 7-day average 4h bar ($1.6M, skewed by the Nov 5–6 sell-off) and 0.45x the median ($1.2M). The 15:45 candle was 11% of it.
🔎 Technicals & levels
▪ RSI(14, 5m) 57. On 4h bars RSI is 37.6 and price is below its 20-bar average ($91.85). On daily bars price is below its 20-day ($98.86) and 50-day ($108.16) averages.
▪ Resistance: $90.14 (window high, also the nearest 4h resistance per CMC)
▪ Support: $89.21 (window low), $88.48 (4h bars, per CMC)
🗓 News & Catalysts
▪ Samsung Wallet's USDC account on Solana went live Nov 2 for eligible US Galaxy users (per a Solana Foundation update, via TradingView News).
▪ Next: China CPI/PPI (Nov 9, 01:30 UTC), Fed's Bowman speaks (Nov 9, 13:40 UTC), US CPI (Nov 10, 13:30 UTC).
#solana #viralpost #cryptouniverseofficial #JobsReportRaisesHikeOdds #analysis
Last 4 hours, Nov 7 14:00 – 17:55 UTC
SOL is at $89.79, down 0.23% from $90.00. High $90.14, low $89.21 (1.04% range). Price held $89.95–$90.11 until ~15:00, slid to $89.37 by 15:45 (the window's heaviest volume), then regained about half of the drop.
📊 Market context
▪ Total crypto market cap -0.17% in 4h, BTC -0.12%. SOL lagged BTC by 0.12 pts.
▪ SOL -6.6% over 7 days, -5.1% this week after three straight weekly declines. It trails BTC by 4.4 pts over 7 days and 10.1 pts over 30 days.
▪ CMC Fear & Greed (daily): 31 (Fear), down from 61 a month ago.
▪ US spot SOL ETFs: $26.3M net outflow last week, nearly all on Friday, five straight negative weeks totaling $165.4M (per The Block).
📈 Volume
▪ 4h volume on Crypto.com ~$0.54M: 0.33x the 7-day average 4h bar ($1.6M, skewed by the Nov 5–6 sell-off) and 0.45x the median ($1.2M). The 15:45 candle was 11% of it.
🔎 Technicals & levels
▪ RSI(14, 5m) 57. On 4h bars RSI is 37.6 and price is below its 20-bar average ($91.85). On daily bars price is below its 20-day ($98.86) and 50-day ($108.16) averages.
▪ Resistance: $90.14 (window high, also the nearest 4h resistance per CMC)
▪ Support: $89.21 (window low), $88.48 (4h bars, per CMC)
🗓 News & Catalysts
▪ Samsung Wallet's USDC account on Solana went live Nov 2 for eligible US Galaxy users (per a Solana Foundation update, via TradingView News).
▪ Next: China CPI/PPI (Nov 9, 01:30 UTC), Fed's Bowman speaks (Nov 9, 13:40 UTC), US CPI (Nov 10, 13:30 UTC).
#solana #viralpost #cryptouniverseofficial #JobsReportRaisesHikeOdds #analysis
1
56
·
--
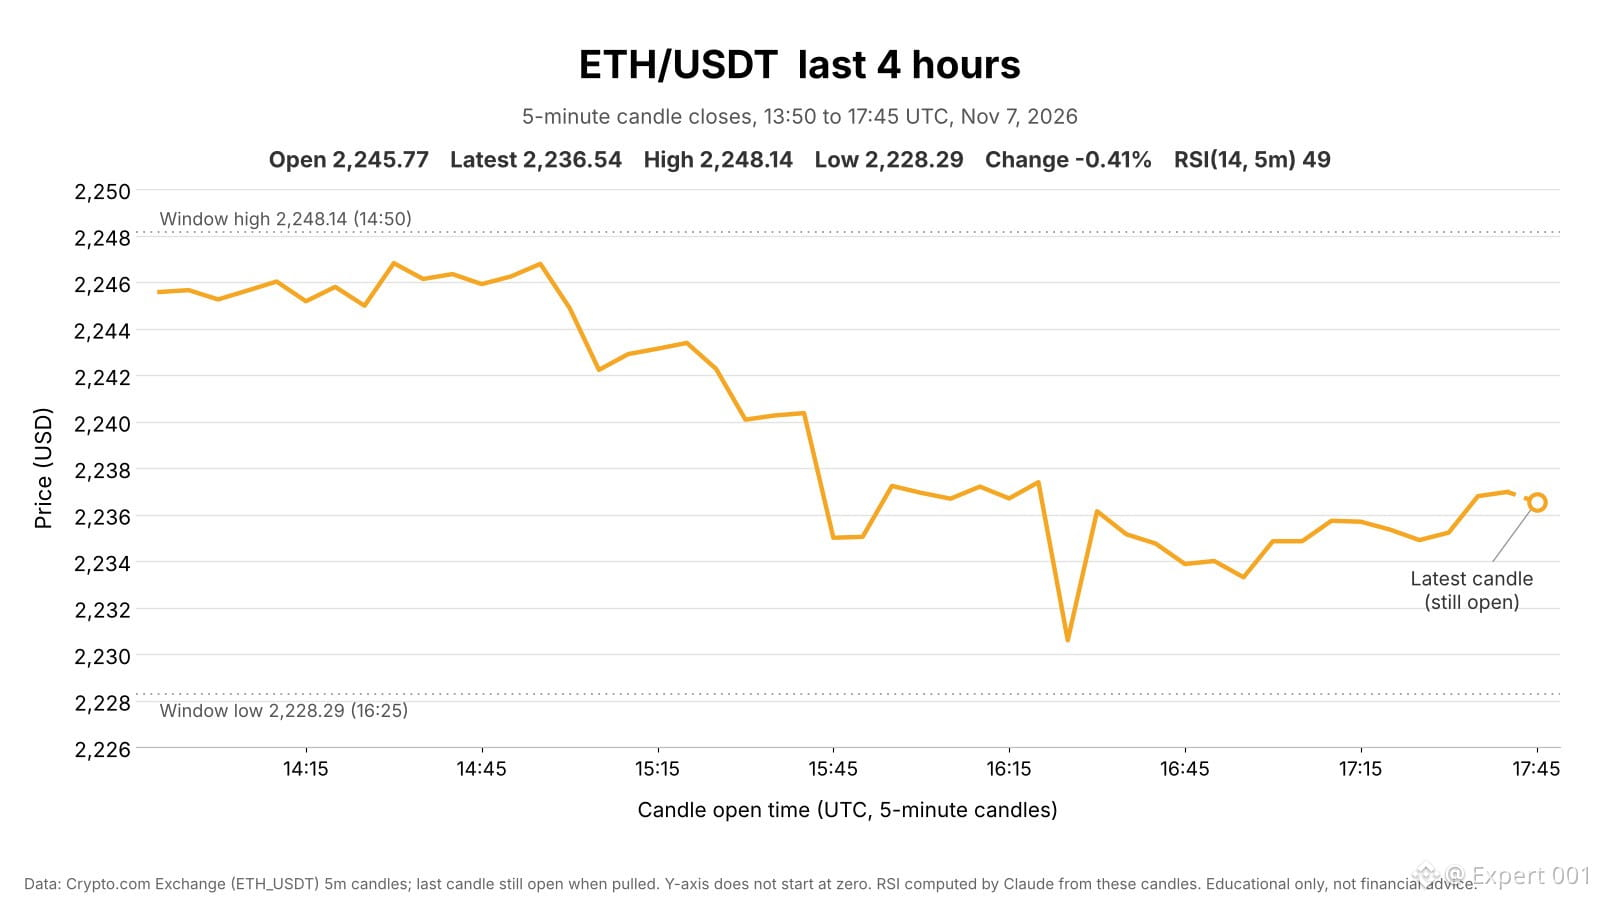
$ETH steps down in two legs, then holds near $2,236
Last 4 hours, Nov 7 13:50 – 17:45 UTC
ETH is at $2,236.54, down 0.41% from $2,245.77. High $2,248.14, low $2,228.29 (0.89% range). Price held $2,245–$2,247 until ~14:55, slid to $2,235 by 15:45 on heavy volume, dipped to the low at 16:25, then held $2,233–$2,237.
📊 Market context
▪ Total crypto market cap -0.16% in 4h, BTC -0.13%. ETH lagged BTC by 0.24 pts.
▪ ETH +0.7% over 24h, -0.8% over 7 days. CMC Fear & Greed (daily): 31 (Fear), down from 61 a month ago.
▪ US spot ETH ETFs: $93.3M net outflow on the latest settled day, $365.2M over five sessions.
📈 Volume
▪ 4h volume on Crypto.com ~$2.1M: 0.29x the 7-day average 4h bar ($7.4M, skewed by the Nov 5–6 sell-off) and 0.46x the median ($4.7M). The 15:45 candle alone was 15% of it.
🔎 Technicals & levels
▪ RSI(14, 5m) 49. On 1h bars RSI is 41 and price is below its 20-bar average ($2,240.74). On 4h bars price is below its 20-bar average ($2,295.92).
▪ Resistance: $2,243.74 (session high, per CMC), $2,248.14 (window high)
▪ Support: $2,228.94 (4h bars, tested twice, per CMC), $2,228.29 (window low)
🗓 News & Catalysts
▪ Ethereum developers postponed the next Glamsterdam hard-fork step on the Hoodi testnet over gas-accounting compatibility issues, with no new date set (per TradingView News).
▪ Arkham data cited by U.Today shows whales buying more than $42M of ETH.
▪ Next: China CPI/PPI (Nov 9, 01:30 UTC), Fed's Bowman speaks (Nov 9, 13:40 UTC), US CPI (Nov 10, 13:30 UTC).#JobsReportRaisesHikeOdds #ETH #analysis #cryptouniverseofficial #viralpost
{spot}(ETHUSDT)
$ETH steps down in two legs, then holds near $2,236
Last 4 hours, Nov 7 13:50 – 17:45 UTC
ETH is at $2,236.54, down 0.41% from $2,245.77. High $2,248.14, low $2,228.29 (0.89% range). Price held $2,245–$2,247 until ~14:55, slid to $2,235 by 15:45 on heavy volume, dipped to the low at 16:25, then held $2,233–$2,237.
📊 Market context
▪ Total crypto market cap -0.16% in 4h, BTC -0.13%. ETH lagged BTC by 0.24 pts.
▪ ETH +0.7% over 24h, -0.8% over 7 days. CMC Fear & Greed (daily): 31 (Fear), down from 61 a month ago.
▪ US spot ETH ETFs: $93.3M net outflow on the latest settled day, $365.2M over five sessions.
📈 Volume
▪ 4h volume on Crypto.com ~$2.1M: 0.29x the 7-day average 4h bar ($7.4M, skewed by the Nov 5–6 sell-off) and 0.46x the median ($4.7M). The 15:45 candle alone was 15% of it.
🔎 Technicals & levels
▪ RSI(14, 5m) 49. On 1h bars RSI is 41 and price is below its 20-bar average ($2,240.74). On 4h bars price is below its 20-bar average ($2,295.92).
▪ Resistance: $2,243.74 (session high, per CMC), $2,248.14 (window high)
▪ Support: $2,228.94 (4h bars, tested twice, per CMC), $2,228.29 (window low)
🗓 News & Catalysts
▪ Ethereum developers postponed the next Glamsterdam hard-fork step on the Hoodi testnet over gas-accounting compatibility issues, with no new date set (per TradingView News).
▪ Arkham data cited by U.Today shows whales buying more than $42M of ETH.
▪ Next: China CPI/PPI (Nov 9, 01:30 UTC), Fed's Bowman speaks (Nov 9, 13:40 UTC), US CPI (Nov 10, 13:30 UTC).#JobsReportRaisesHikeOdds #ETH #analysis #cryptouniverseofficial #viralpost
Last 4 hours, Nov 7 13:50 – 17:45 UTC
ETH is at $2,236.54, down 0.41% from $2,245.77. High $2,248.14, low $2,228.29 (0.89% range). Price held $2,245–$2,247 until ~14:55, slid to $2,235 by 15:45 on heavy volume, dipped to the low at 16:25, then held $2,233–$2,237.
📊 Market context
▪ Total crypto market cap -0.16% in 4h, BTC -0.13%. ETH lagged BTC by 0.24 pts.
▪ ETH +0.7% over 24h, -0.8% over 7 days. CMC Fear & Greed (daily): 31 (Fear), down from 61 a month ago.
▪ US spot ETH ETFs: $93.3M net outflow on the latest settled day, $365.2M over five sessions.
📈 Volume
▪ 4h volume on Crypto.com ~$2.1M: 0.29x the 7-day average 4h bar ($7.4M, skewed by the Nov 5–6 sell-off) and 0.46x the median ($4.7M). The 15:45 candle alone was 15% of it.
🔎 Technicals & levels
▪ RSI(14, 5m) 49. On 1h bars RSI is 41 and price is below its 20-bar average ($2,240.74). On 4h bars price is below its 20-bar average ($2,295.92).
▪ Resistance: $2,243.74 (session high, per CMC), $2,248.14 (window high)
▪ Support: $2,228.94 (4h bars, tested twice, per CMC), $2,228.29 (window low)
🗓 News & Catalysts
▪ Ethereum developers postponed the next Glamsterdam hard-fork step on the Hoodi testnet over gas-accounting compatibility issues, with no new date set (per TradingView News).
▪ Arkham data cited by U.Today shows whales buying more than $42M of ETH.
▪ Next: China CPI/PPI (Nov 9, 01:30 UTC), Fed's Bowman speaks (Nov 9, 13:40 UTC), US CPI (Nov 10, 13:30 UTC).#JobsReportRaisesHikeOdds #ETH #analysis #cryptouniverseofficial #viralpost
1
99
·
--
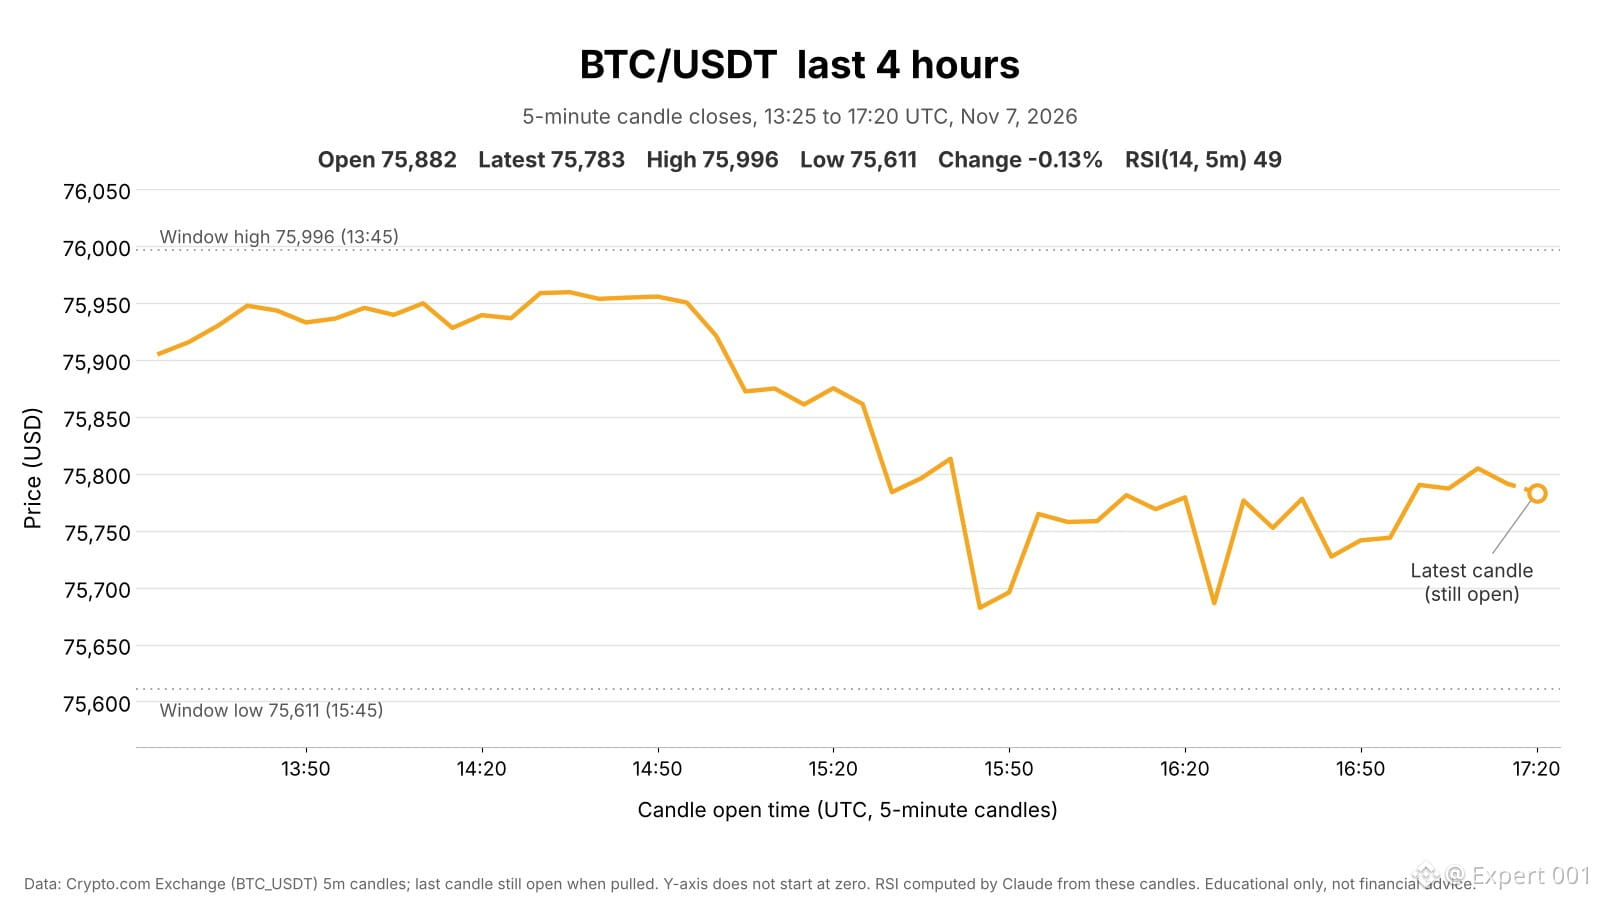
$BTC slips, then holds near $75.8K after a 15:45 flush
Last 4 hours, Nov 7 13:25 – 17:20 UTC
BTC is at $75,783, down 0.13% from $75,882. High $75,996, low $75,611 (0.51% range). Price held near $75,950 until ~14:55, slid into 15:45 (low $75,611 on the window's heaviest volume), then ranged $75,690–$75,805.
📊 Market context
▪ Total crypto market cap -0.43% over 24h. BTC -2.4% over 7 days, -6.3% over 30 days.
▪ CMC Fear & Greed (daily): 31 (Fear), down from 61 a month ago.
▪ US spot BTC ETFs: $411.9M net outflow on Nov 6 (second straight outflow day), $1.28B over five days.
📈 Volume & derivatives
▪ 4h volume on Crypto.com ~$3.8M: 0.22x the 7-day average 4h bar ($17.2M, skewed by the Nov 5–6 sell-off) and 0.37x the median ($10.2M). The 15:45 candle alone was 12% of it.
▪ BTC liquidations ~$1.72M in 4h, almost all longs ($1.67M).
🔎 Technicals & levels
▪ RSI(14, 5m) 49. On 4h bars RSI is 39 with lower highs. On daily bars RSI is 38, price is below its 20-day and 50-day averages and above its 200-day, 1.2% above its 30-day low.
▪ Resistance: $75,996 (window high), $76,470 (2 touches on 4h structure, per CMC)
▪ Support: $75,611 (window low), $74,795 (30-day low, per CMC)
🗓 News & Catalysts
▪ Next: China CPI/PPI (Nov 9, 01:30 UTC), Fed's Bowman speaks (Nov 9, 13:40 UTC), US CPI (Nov 10, 13:30 UTC).
▪ Russia finalized retail trading of BTC, ETH and USDT from Nov 17, with a $3,700 annual purchase limit. Strive bought 15,124 BTC in October (per CMC Community).
#JobsReportRaisesHikeOdds #viralpost #BTC走势分析 #analysis #cryptouniverseofficial
{spot}(BTCUSDT)
$BTC slips, then holds near $75.8K after a 15:45 flush
Last 4 hours, Nov 7 13:25 – 17:20 UTC
BTC is at $75,783, down 0.13% from $75,882. High $75,996, low $75,611 (0.51% range). Price held near $75,950 until ~14:55, slid into 15:45 (low $75,611 on the window's heaviest volume), then ranged $75,690–$75,805.
📊 Market context
▪ Total crypto market cap -0.43% over 24h. BTC -2.4% over 7 days, -6.3% over 30 days.
▪ CMC Fear & Greed (daily): 31 (Fear), down from 61 a month ago.
▪ US spot BTC ETFs: $411.9M net outflow on Nov 6 (second straight outflow day), $1.28B over five days.
📈 Volume & derivatives
▪ 4h volume on Crypto.com ~$3.8M: 0.22x the 7-day average 4h bar ($17.2M, skewed by the Nov 5–6 sell-off) and 0.37x the median ($10.2M). The 15:45 candle alone was 12% of it.
▪ BTC liquidations ~$1.72M in 4h, almost all longs ($1.67M).
🔎 Technicals & levels
▪ RSI(14, 5m) 49. On 4h bars RSI is 39 with lower highs. On daily bars RSI is 38, price is below its 20-day and 50-day averages and above its 200-day, 1.2% above its 30-day low.
▪ Resistance: $75,996 (window high), $76,470 (2 touches on 4h structure, per CMC)
▪ Support: $75,611 (window low), $74,795 (30-day low, per CMC)
🗓 News & Catalysts
▪ Next: China CPI/PPI (Nov 9, 01:30 UTC), Fed's Bowman speaks (Nov 9, 13:40 UTC), US CPI (Nov 10, 13:30 UTC).
▪ Russia finalized retail trading of BTC, ETH and USDT from Nov 17, with a $3,700 annual purchase limit. Strive bought 15,124 BTC in October (per CMC Community).
#JobsReportRaisesHikeOdds #viralpost #BTC走势分析 #analysis #cryptouniverseofficial
Last 4 hours, Nov 7 13:25 – 17:20 UTC
BTC is at $75,783, down 0.13% from $75,882. High $75,996, low $75,611 (0.51% range). Price held near $75,950 until ~14:55, slid into 15:45 (low $75,611 on the window's heaviest volume), then ranged $75,690–$75,805.
📊 Market context
▪ Total crypto market cap -0.43% over 24h. BTC -2.4% over 7 days, -6.3% over 30 days.
▪ CMC Fear & Greed (daily): 31 (Fear), down from 61 a month ago.
▪ US spot BTC ETFs: $411.9M net outflow on Nov 6 (second straight outflow day), $1.28B over five days.
📈 Volume & derivatives
▪ 4h volume on Crypto.com ~$3.8M: 0.22x the 7-day average 4h bar ($17.2M, skewed by the Nov 5–6 sell-off) and 0.37x the median ($10.2M). The 15:45 candle alone was 12% of it.
▪ BTC liquidations ~$1.72M in 4h, almost all longs ($1.67M).
🔎 Technicals & levels
▪ RSI(14, 5m) 49. On 4h bars RSI is 39 with lower highs. On daily bars RSI is 38, price is below its 20-day and 50-day averages and above its 200-day, 1.2% above its 30-day low.
▪ Resistance: $75,996 (window high), $76,470 (2 touches on 4h structure, per CMC)
▪ Support: $75,611 (window low), $74,795 (30-day low, per CMC)
🗓 News & Catalysts
▪ Next: China CPI/PPI (Nov 9, 01:30 UTC), Fed's Bowman speaks (Nov 9, 13:40 UTC), US CPI (Nov 10, 13:30 UTC).
▪ Russia finalized retail trading of BTC, ETH and USDT from Nov 17, with a $3,700 annual purchase limit. Strive bought 15,124 BTC in October (per CMC Community).
#JobsReportRaisesHikeOdds #viralpost #BTC走势分析 #analysis #cryptouniverseofficial
1
104
·
--
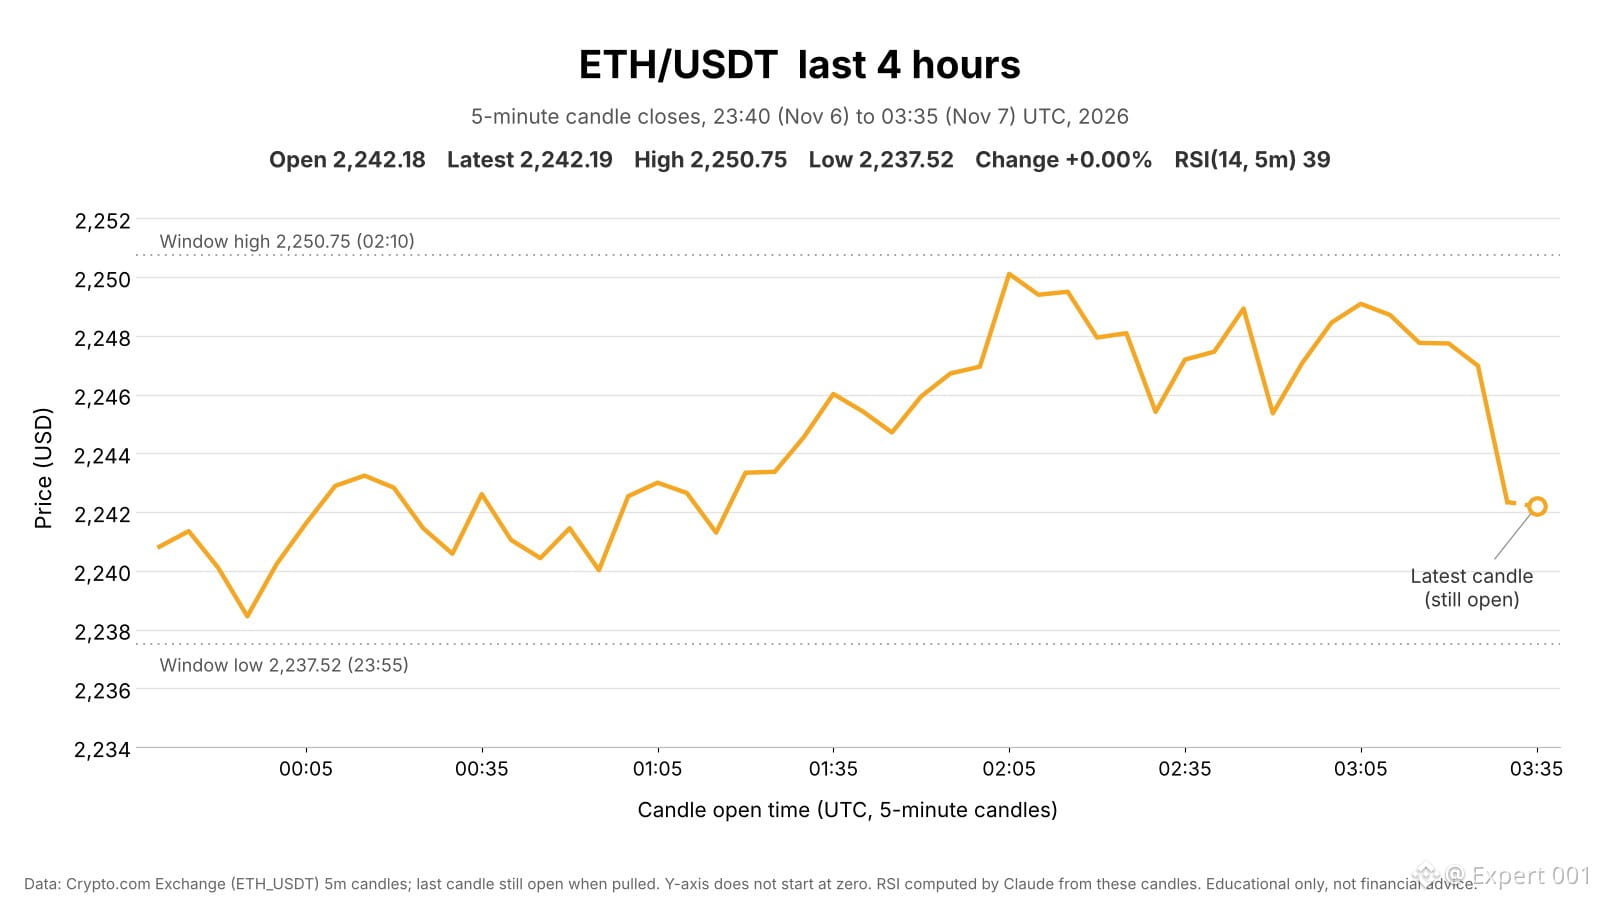
Last 4 hours, Nov 6 23:40 – Nov 7 03:35 UTC
$ETH is at $2,242.19, flat from $2,242.18 (+0.00%). High $2,250.75, low $2,237.52 (0.59% range). Price climbed from the 23:55 low to the 02:10 high, then faded back to where it started.
📊 Market context
▪ Total crypto market cap -0.08% in 4h, BTC -0.21%, Layer 1 tokens -0.67% (median). ETH beat BTC by 0.3 pts.
▪ ETH +0.5% over 24h, -1.5% this week after three straight weekly losses. CMC Fear & Greed (daily): 32 (Fear), down from 61 a month ago.
▪ US spot ETH ETFs: $3.6M net outflow on the latest settled day, $275.5M over five sessions.
📈 Volume & derivatives
▪ 4h volume on Crypto.com ~$2.1M: 0.28x the 7-day average 4h bar ($7.5M, skewed by the Nov 5 sell-off) and 0.44x the median ($4.7M).
▪ Open interest $28.3B (+0.16%), funding 0.0069% per interval (normal), liquidations 0.0% of OI. Perp net taker flow was -$17.8M vs +$0.5M in spot, so sellers led in perps.
🔎 Technicals & levels
▪ RSI(14, 5m) 39. On 4h bars RSI is 40.6 and price is below its 20-bar average ($2,303.05). On daily bars price is below its 20-day ($2,331.98) and 50-day ($2,498.67) averages and above its 200-day.
▪ Resistance: $2,252.96 (4h bars, per CMC), $2,250.75 (window high)
▪ Support: $2,237.52 (window low), $2,228.94 (4h bars, per CMC)
🗓 News & Catalysts
▪ Next: China CPI/PPI (Nov 9, 01:30 UTC), Fed's Bowman speaks (Nov 9, 13:40 UTC), US CPI (Nov 10, 13:30 UTC).#JobsReportRaisesHikeOdds #ETH #analysis #cryptouniverseofficial #viralpost
{spot}(ETHUSDT)
Last 4 hours, Nov 6 23:40 – Nov 7 03:35 UTC
$ETH is at $2,242.19, flat from $2,242.18 (+0.00%). High $2,250.75, low $2,237.52 (0.59% range). Price climbed from the 23:55 low to the 02:10 high, then faded back to where it started.
📊 Market context
▪ Total crypto market cap -0.08% in 4h, BTC -0.21%, Layer 1 tokens -0.67% (median). ETH beat BTC by 0.3 pts.
▪ ETH +0.5% over 24h, -1.5% this week after three straight weekly losses. CMC Fear & Greed (daily): 32 (Fear), down from 61 a month ago.
▪ US spot ETH ETFs: $3.6M net outflow on the latest settled day, $275.5M over five sessions.
📈 Volume & derivatives
▪ 4h volume on Crypto.com ~$2.1M: 0.28x the 7-day average 4h bar ($7.5M, skewed by the Nov 5 sell-off) and 0.44x the median ($4.7M).
▪ Open interest $28.3B (+0.16%), funding 0.0069% per interval (normal), liquidations 0.0% of OI. Perp net taker flow was -$17.8M vs +$0.5M in spot, so sellers led in perps.
🔎 Technicals & levels
▪ RSI(14, 5m) 39. On 4h bars RSI is 40.6 and price is below its 20-bar average ($2,303.05). On daily bars price is below its 20-day ($2,331.98) and 50-day ($2,498.67) averages and above its 200-day.
▪ Resistance: $2,252.96 (4h bars, per CMC), $2,250.75 (window high)
▪ Support: $2,237.52 (window low), $2,228.94 (4h bars, per CMC)
🗓 News & Catalysts
▪ Next: China CPI/PPI (Nov 9, 01:30 UTC), Fed's Bowman speaks (Nov 9, 13:40 UTC), US CPI (Nov 10, 13:30 UTC).#JobsReportRaisesHikeOdds #ETH #analysis #cryptouniverseofficial #viralpost
$ETH is at $2,242.19, flat from $2,242.18 (+0.00%). High $2,250.75, low $2,237.52 (0.59% range). Price climbed from the 23:55 low to the 02:10 high, then faded back to where it started.
📊 Market context
▪ Total crypto market cap -0.08% in 4h, BTC -0.21%, Layer 1 tokens -0.67% (median). ETH beat BTC by 0.3 pts.
▪ ETH +0.5% over 24h, -1.5% this week after three straight weekly losses. CMC Fear & Greed (daily): 32 (Fear), down from 61 a month ago.
▪ US spot ETH ETFs: $3.6M net outflow on the latest settled day, $275.5M over five sessions.
📈 Volume & derivatives
▪ 4h volume on Crypto.com ~$2.1M: 0.28x the 7-day average 4h bar ($7.5M, skewed by the Nov 5 sell-off) and 0.44x the median ($4.7M).
▪ Open interest $28.3B (+0.16%), funding 0.0069% per interval (normal), liquidations 0.0% of OI. Perp net taker flow was -$17.8M vs +$0.5M in spot, so sellers led in perps.
🔎 Technicals & levels
▪ RSI(14, 5m) 39. On 4h bars RSI is 40.6 and price is below its 20-bar average ($2,303.05). On daily bars price is below its 20-day ($2,331.98) and 50-day ($2,498.67) averages and above its 200-day.
▪ Resistance: $2,252.96 (4h bars, per CMC), $2,250.75 (window high)
▪ Support: $2,237.52 (window low), $2,228.94 (4h bars, per CMC)
🗓 News & Catalysts
▪ Next: China CPI/PPI (Nov 9, 01:30 UTC), Fed's Bowman speaks (Nov 9, 13:40 UTC), US CPI (Nov 10, 13:30 UTC).#JobsReportRaisesHikeOdds #ETH #analysis #cryptouniverseofficial #viralpost
2
1
89
·
--
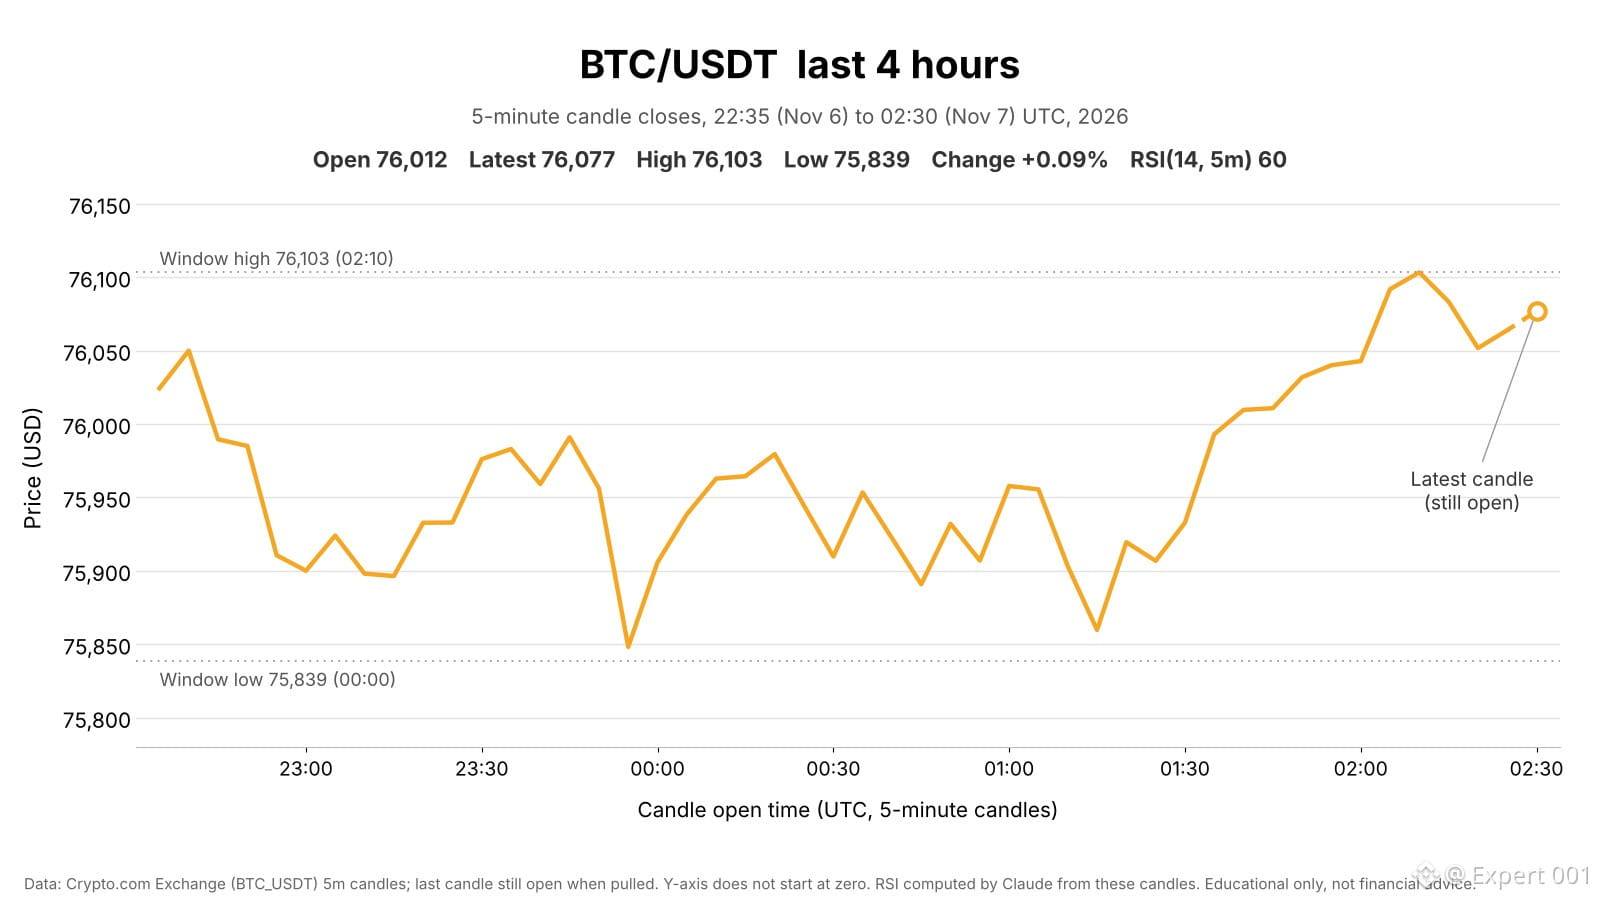
$BTC drifts sideways near $76K
Last 4 hours, Nov 6 22:35 – Nov 7 02:30 UTC
BTC is at $76,077, up 0.09% from $76,012. High $76,103, low $75,839 (0.35% range). Price dipped to the low at 00:00, climbed into 02:10 and held near the high.
📊 Market context
▪ Total crypto market cap +0.04% in 4h. Nasdaq 100 proxy +0.04%, S&P 500 +0.02%, gold -0.01%, US dollar +0.12%. US stocks are closed for the weekend.
▪ BTC is down 1.6% over 7 days. CMC Fear & Greed (daily): 32 (Fear), down from 61 a month ago.
▪ US spot BTC ETFs: $8.9M net outflow on Nov 6 (10 of 12 funds reported), $878.7M over five days.
📈 Volume & derivatives
▪ 4h volume on Crypto.com ~$4.6M: 0.26x the 7-day average 4h bar ($17.8M, skewed by the Nov 5–6 sell-off) and 0.41x the median ($11.3M).
▪ Open interest -0.1%, funding +0.006% and stable, liquidations negligible (0.0% of OI). Sellers were the more aggressive side in spot and perps.
🔎 Technicals & levels
▪ RSI(14, 5m) 60. On 4h bars RSI is 38 and price is below its 20-bar average ($77,585). On 1h bars price is back above its 20-bar average ($75,771). On daily bars price is below its 20-day ($79,644) and 50-day ($81,975) averages.
▪ Resistance: $76,271 (rejected price 3x on 4h bars, per CMC), $76,103 (window high)
▪ Support: $75,839 (window low), $75,628 (4h bars, per CMC)
🗓 News & Catalysts
▪ Next: China CPI/PPI (Nov 9, 01:30 UTC), Fed's Bowman speaks (Nov 9, 13:40 UTC), US CPI (Nov 10, 13:30 UTC).
▪ Russia's central bank finalized retail trading of BTC, ETH and USDT from Nov 17, with a $3,700 annual purchase limit (per CMC).
Crypto.com, CoinMarketCap. Not financial advice.#JobsReportRaisesHikeOdds #BTC走势分析 #analysis #cryptouniverseofficial
{spot}(BTCUSDT)
$BTC drifts sideways near $76K
Last 4 hours, Nov 6 22:35 – Nov 7 02:30 UTC
BTC is at $76,077, up 0.09% from $76,012. High $76,103, low $75,839 (0.35% range). Price dipped to the low at 00:00, climbed into 02:10 and held near the high.
📊 Market context
▪ Total crypto market cap +0.04% in 4h. Nasdaq 100 proxy +0.04%, S&P 500 +0.02%, gold -0.01%, US dollar +0.12%. US stocks are closed for the weekend.
▪ BTC is down 1.6% over 7 days. CMC Fear & Greed (daily): 32 (Fear), down from 61 a month ago.
▪ US spot BTC ETFs: $8.9M net outflow on Nov 6 (10 of 12 funds reported), $878.7M over five days.
📈 Volume & derivatives
▪ 4h volume on Crypto.com ~$4.6M: 0.26x the 7-day average 4h bar ($17.8M, skewed by the Nov 5–6 sell-off) and 0.41x the median ($11.3M).
▪ Open interest -0.1%, funding +0.006% and stable, liquidations negligible (0.0% of OI). Sellers were the more aggressive side in spot and perps.
🔎 Technicals & levels
▪ RSI(14, 5m) 60. On 4h bars RSI is 38 and price is below its 20-bar average ($77,585). On 1h bars price is back above its 20-bar average ($75,771). On daily bars price is below its 20-day ($79,644) and 50-day ($81,975) averages.
▪ Resistance: $76,271 (rejected price 3x on 4h bars, per CMC), $76,103 (window high)
▪ Support: $75,839 (window low), $75,628 (4h bars, per CMC)
🗓 News & Catalysts
▪ Next: China CPI/PPI (Nov 9, 01:30 UTC), Fed's Bowman speaks (Nov 9, 13:40 UTC), US CPI (Nov 10, 13:30 UTC).
▪ Russia's central bank finalized retail trading of BTC, ETH and USDT from Nov 17, with a $3,700 annual purchase limit (per CMC).
Crypto.com, CoinMarketCap. Not financial advice.#JobsReportRaisesHikeOdds #BTC走势分析 #analysis #cryptouniverseofficial
Last 4 hours, Nov 6 22:35 – Nov 7 02:30 UTC
BTC is at $76,077, up 0.09% from $76,012. High $76,103, low $75,839 (0.35% range). Price dipped to the low at 00:00, climbed into 02:10 and held near the high.
📊 Market context
▪ Total crypto market cap +0.04% in 4h. Nasdaq 100 proxy +0.04%, S&P 500 +0.02%, gold -0.01%, US dollar +0.12%. US stocks are closed for the weekend.
▪ BTC is down 1.6% over 7 days. CMC Fear & Greed (daily): 32 (Fear), down from 61 a month ago.
▪ US spot BTC ETFs: $8.9M net outflow on Nov 6 (10 of 12 funds reported), $878.7M over five days.
📈 Volume & derivatives
▪ 4h volume on Crypto.com ~$4.6M: 0.26x the 7-day average 4h bar ($17.8M, skewed by the Nov 5–6 sell-off) and 0.41x the median ($11.3M).
▪ Open interest -0.1%, funding +0.006% and stable, liquidations negligible (0.0% of OI). Sellers were the more aggressive side in spot and perps.
🔎 Technicals & levels
▪ RSI(14, 5m) 60. On 4h bars RSI is 38 and price is below its 20-bar average ($77,585). On 1h bars price is back above its 20-bar average ($75,771). On daily bars price is below its 20-day ($79,644) and 50-day ($81,975) averages.
▪ Resistance: $76,271 (rejected price 3x on 4h bars, per CMC), $76,103 (window high)
▪ Support: $75,839 (window low), $75,628 (4h bars, per CMC)
🗓 News & Catalysts
▪ Next: China CPI/PPI (Nov 9, 01:30 UTC), Fed's Bowman speaks (Nov 9, 13:40 UTC), US CPI (Nov 10, 13:30 UTC).
▪ Russia's central bank finalized retail trading of BTC, ETH and USDT from Nov 17, with a $3,700 annual purchase limit (per CMC).
Crypto.com, CoinMarketCap. Not financial advice.#JobsReportRaisesHikeOdds #BTC走势分析 #analysis #cryptouniverseofficial
1
109
·
--
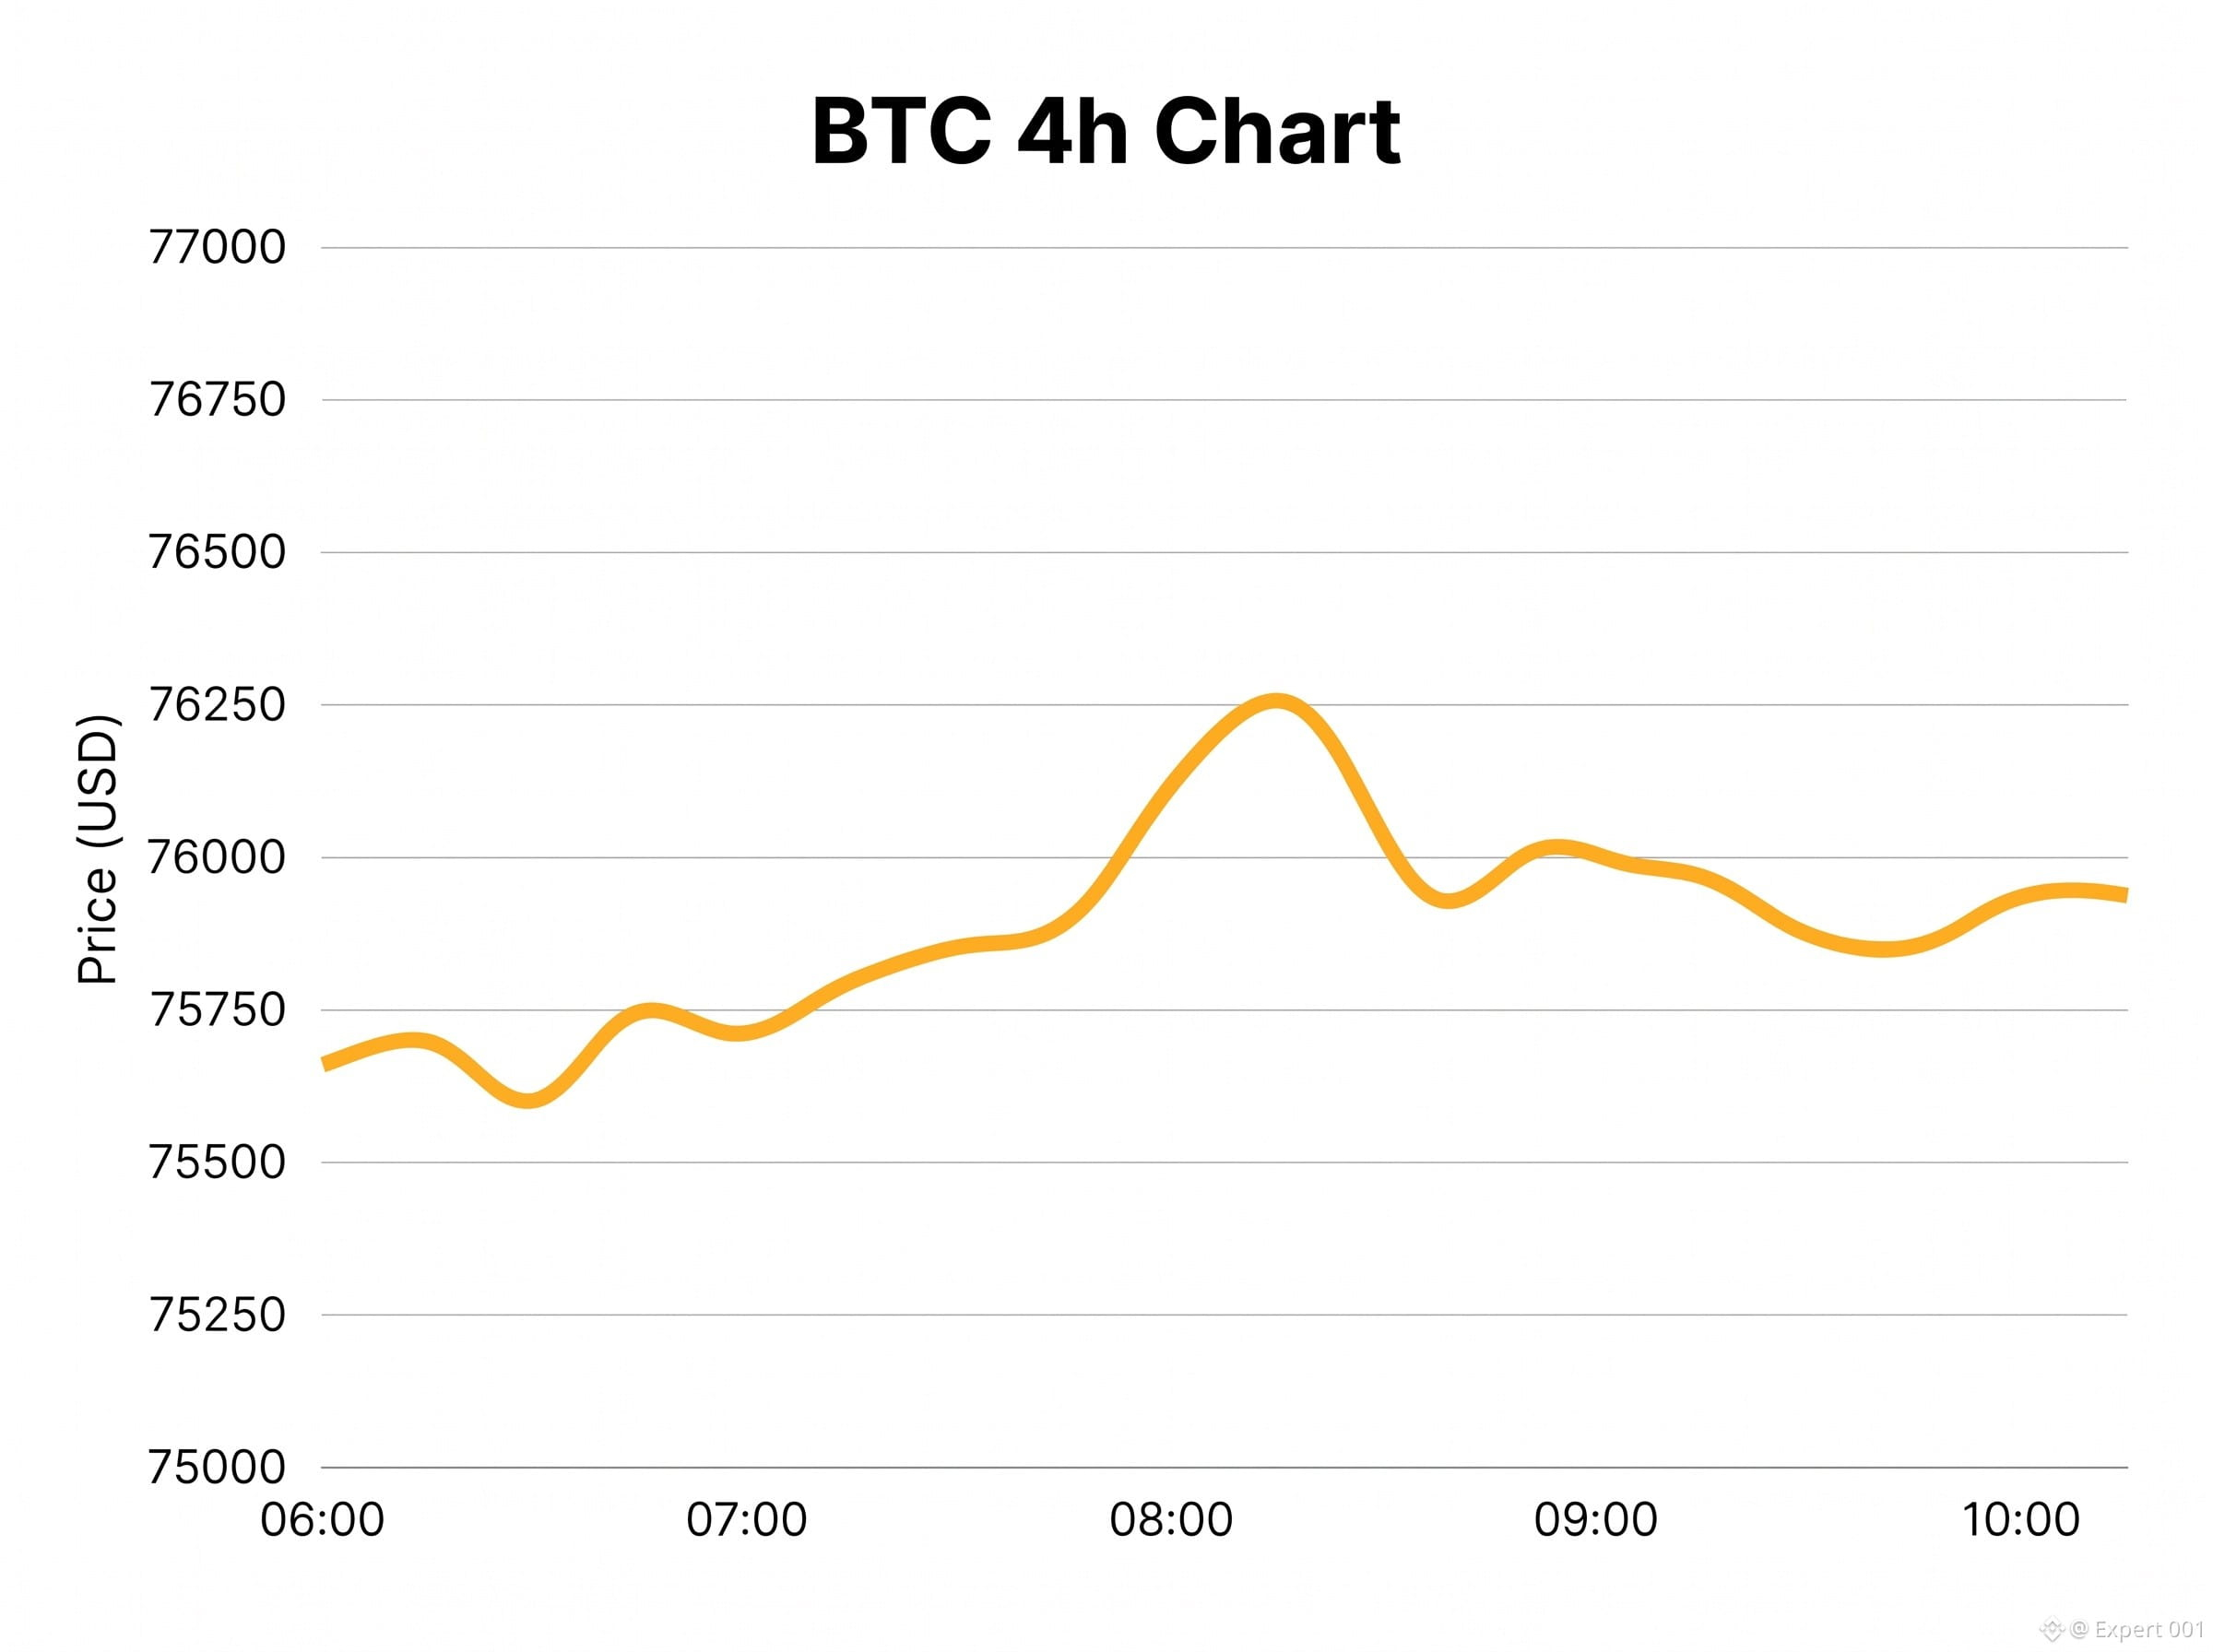
$BTC Bitcoin has given back most of the recent gains and is currently trading near the mid-$75,000s.
After the strong push above $80k on Nov 4–5, price reversed hard and is now testing the same support zone that held earlier in the week. The rejection from the $80k–$81k area was sharp.
Key points:
Short-term structure has weakened again after the failed breakout attempt.
Momentum has flipped negative on the 4h chart. Price is back inside the previous consolidation range.
Levels:
--Resistance: $77,500 – $78,500 then $80,000
--Support: $75,200 – $74,800 Critical support: $74,000
Bias:
Short-term bearish while below $78k. Holding the $75k zone keeps the broader recovery intact. A clean break below $75k would open the door for a deeper retest of the late-October lows.
#USStocksSlipandCryptoMarketUnderBroadPressure #bitcoin #analysis #BTC走势分析 #BinanceReopensWithdrawalsForMoreAssets
{spot}(BTCUSDT)
$BTC Bitcoin has given back most of the recent gains and is currently trading near the mid-$75,000s.
After the strong push above $80k on Nov 4–5, price reversed hard and is now testing the same support zone that held earlier in the week. The rejection from the $80k–$81k area was sharp.
Key points:
Short-term structure has weakened again after the failed breakout attempt.
Momentum has flipped negative on the 4h chart. Price is back inside the previous consolidation range.
Levels:
--Resistance: $77,500 – $78,500 then $80,000
--Support: $75,200 – $74,800 Critical support: $74,000
Bias:
Short-term bearish while below $78k. Holding the $75k zone keeps the broader recovery intact. A clean break below $75k would open the door for a deeper retest of the late-October lows.
#USStocksSlipandCryptoMarketUnderBroadPressure #bitcoin #analysis #BTC走势分析 #BinanceReopensWithdrawalsForMoreAssets
After the strong push above $80k on Nov 4–5, price reversed hard and is now testing the same support zone that held earlier in the week. The rejection from the $80k–$81k area was sharp.
Key points:
Short-term structure has weakened again after the failed breakout attempt.
Momentum has flipped negative on the 4h chart. Price is back inside the previous consolidation range.
Levels:
--Resistance: $77,500 – $78,500 then $80,000
--Support: $75,200 – $74,800 Critical support: $74,000
Bias:
Short-term bearish while below $78k. Holding the $75k zone keeps the broader recovery intact. A clean break below $75k would open the door for a deeper retest of the late-October lows.
#USStocksSlipandCryptoMarketUnderBroadPressure #bitcoin #analysis #BTC走势分析 #BinanceReopensWithdrawalsForMoreAssets
1
115
·
--
$SOL
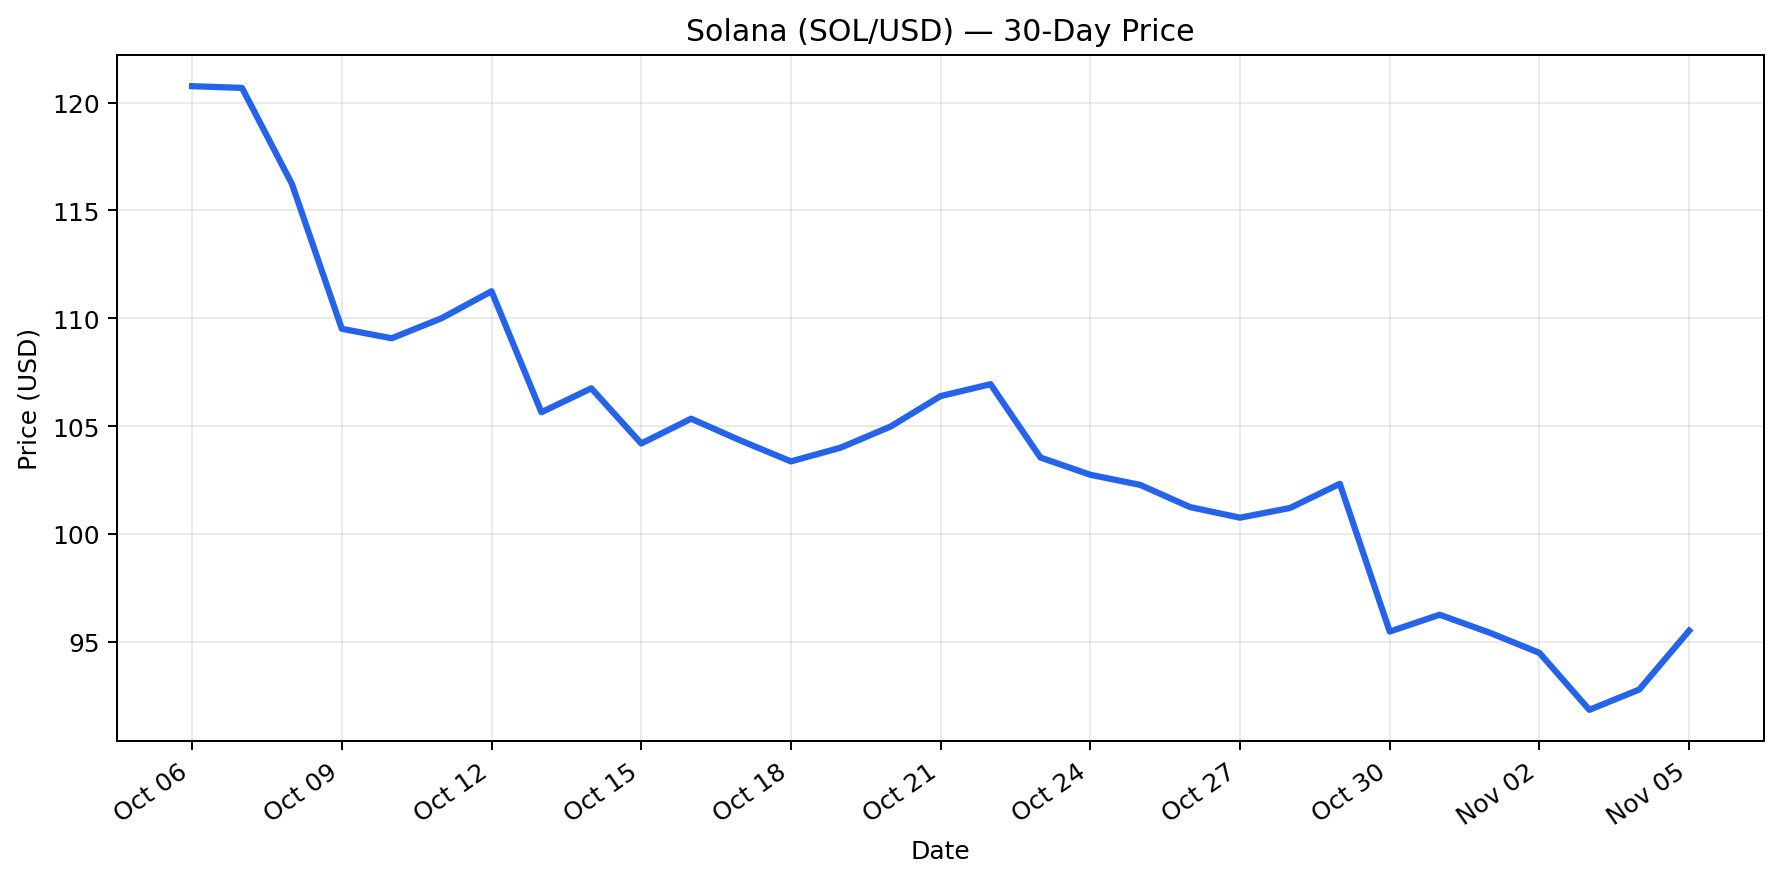
Solana is trading near $96.45, reflecting a significant correction over the past 30 days. SOL has declined approximately 20.2%, falling from around $120.79 in early October. Despite a recent short-term recovery, the broader trend remains bearish.
The latest market activity shows a rebound from the recent low near $91.88, suggesting buyers are attempting to establish support. However, the recovery has not yet confirmed a sustained trend reversal.
Key factors influencing SOL include broader cryptocurrency market sentiment, Bitcoin's price direction, liquidity conditions, and demand for Solana's ecosystem. Network adoption, DeFi activity, transaction demand, and upcoming protocol developments may also influence investor confidence. Macroeconomic conditions, particularly interest-rate expectations and risk appetite, remain important external factors.
Outlook: SOL remains vulnerable to further downside unless it reclaims important resistance levels with stronger trading volume. A sustained move above $100–$105 could improve short-term momentum, while failure to hold the $90–$92 area may expose lower support levels.
Recommendation:
Investors should monitor confirmation of a trend reversal before increasing exposure. Risk management remains essential given cryptocurrency volatility.#BinanceReopensWithdrawalsForMoreAssets #Tip #analysis #solana #USMidterms-WhatAreMarketsExpecting?
{spot}(SOLUSDT)
$SOL
Solana is trading near $96.45, reflecting a significant correction over the past 30 days. SOL has declined approximately 20.2%, falling from around $120.79 in early October. Despite a recent short-term recovery, the broader trend remains bearish.
The latest market activity shows a rebound from the recent low near $91.88, suggesting buyers are attempting to establish support. However, the recovery has not yet confirmed a sustained trend reversal.
Key factors influencing SOL include broader cryptocurrency market sentiment, Bitcoin's price direction, liquidity conditions, and demand for Solana's ecosystem. Network adoption, DeFi activity, transaction demand, and upcoming protocol developments may also influence investor confidence. Macroeconomic conditions, particularly interest-rate expectations and risk appetite, remain important external factors.
Outlook: SOL remains vulnerable to further downside unless it reclaims important resistance levels with stronger trading volume. A sustained move above $100–$105 could improve short-term momentum, while failure to hold the $90–$92 area may expose lower support levels.
Recommendation:
Investors should monitor confirmation of a trend reversal before increasing exposure. Risk management remains essential given cryptocurrency volatility.#BinanceReopensWithdrawalsForMoreAssets #Tip #analysis #solana #USMidterms-WhatAreMarketsExpecting?
Solana is trading near $96.45, reflecting a significant correction over the past 30 days. SOL has declined approximately 20.2%, falling from around $120.79 in early October. Despite a recent short-term recovery, the broader trend remains bearish.
The latest market activity shows a rebound from the recent low near $91.88, suggesting buyers are attempting to establish support. However, the recovery has not yet confirmed a sustained trend reversal.
Key factors influencing SOL include broader cryptocurrency market sentiment, Bitcoin's price direction, liquidity conditions, and demand for Solana's ecosystem. Network adoption, DeFi activity, transaction demand, and upcoming protocol developments may also influence investor confidence. Macroeconomic conditions, particularly interest-rate expectations and risk appetite, remain important external factors.
Outlook: SOL remains vulnerable to further downside unless it reclaims important resistance levels with stronger trading volume. A sustained move above $100–$105 could improve short-term momentum, while failure to hold the $90–$92 area may expose lower support levels.
Recommendation:
Investors should monitor confirmation of a trend reversal before increasing exposure. Risk management remains essential given cryptocurrency volatility.#BinanceReopensWithdrawalsForMoreAssets #Tip #analysis #solana #USMidterms-WhatAreMarketsExpecting?
1
51
·
--
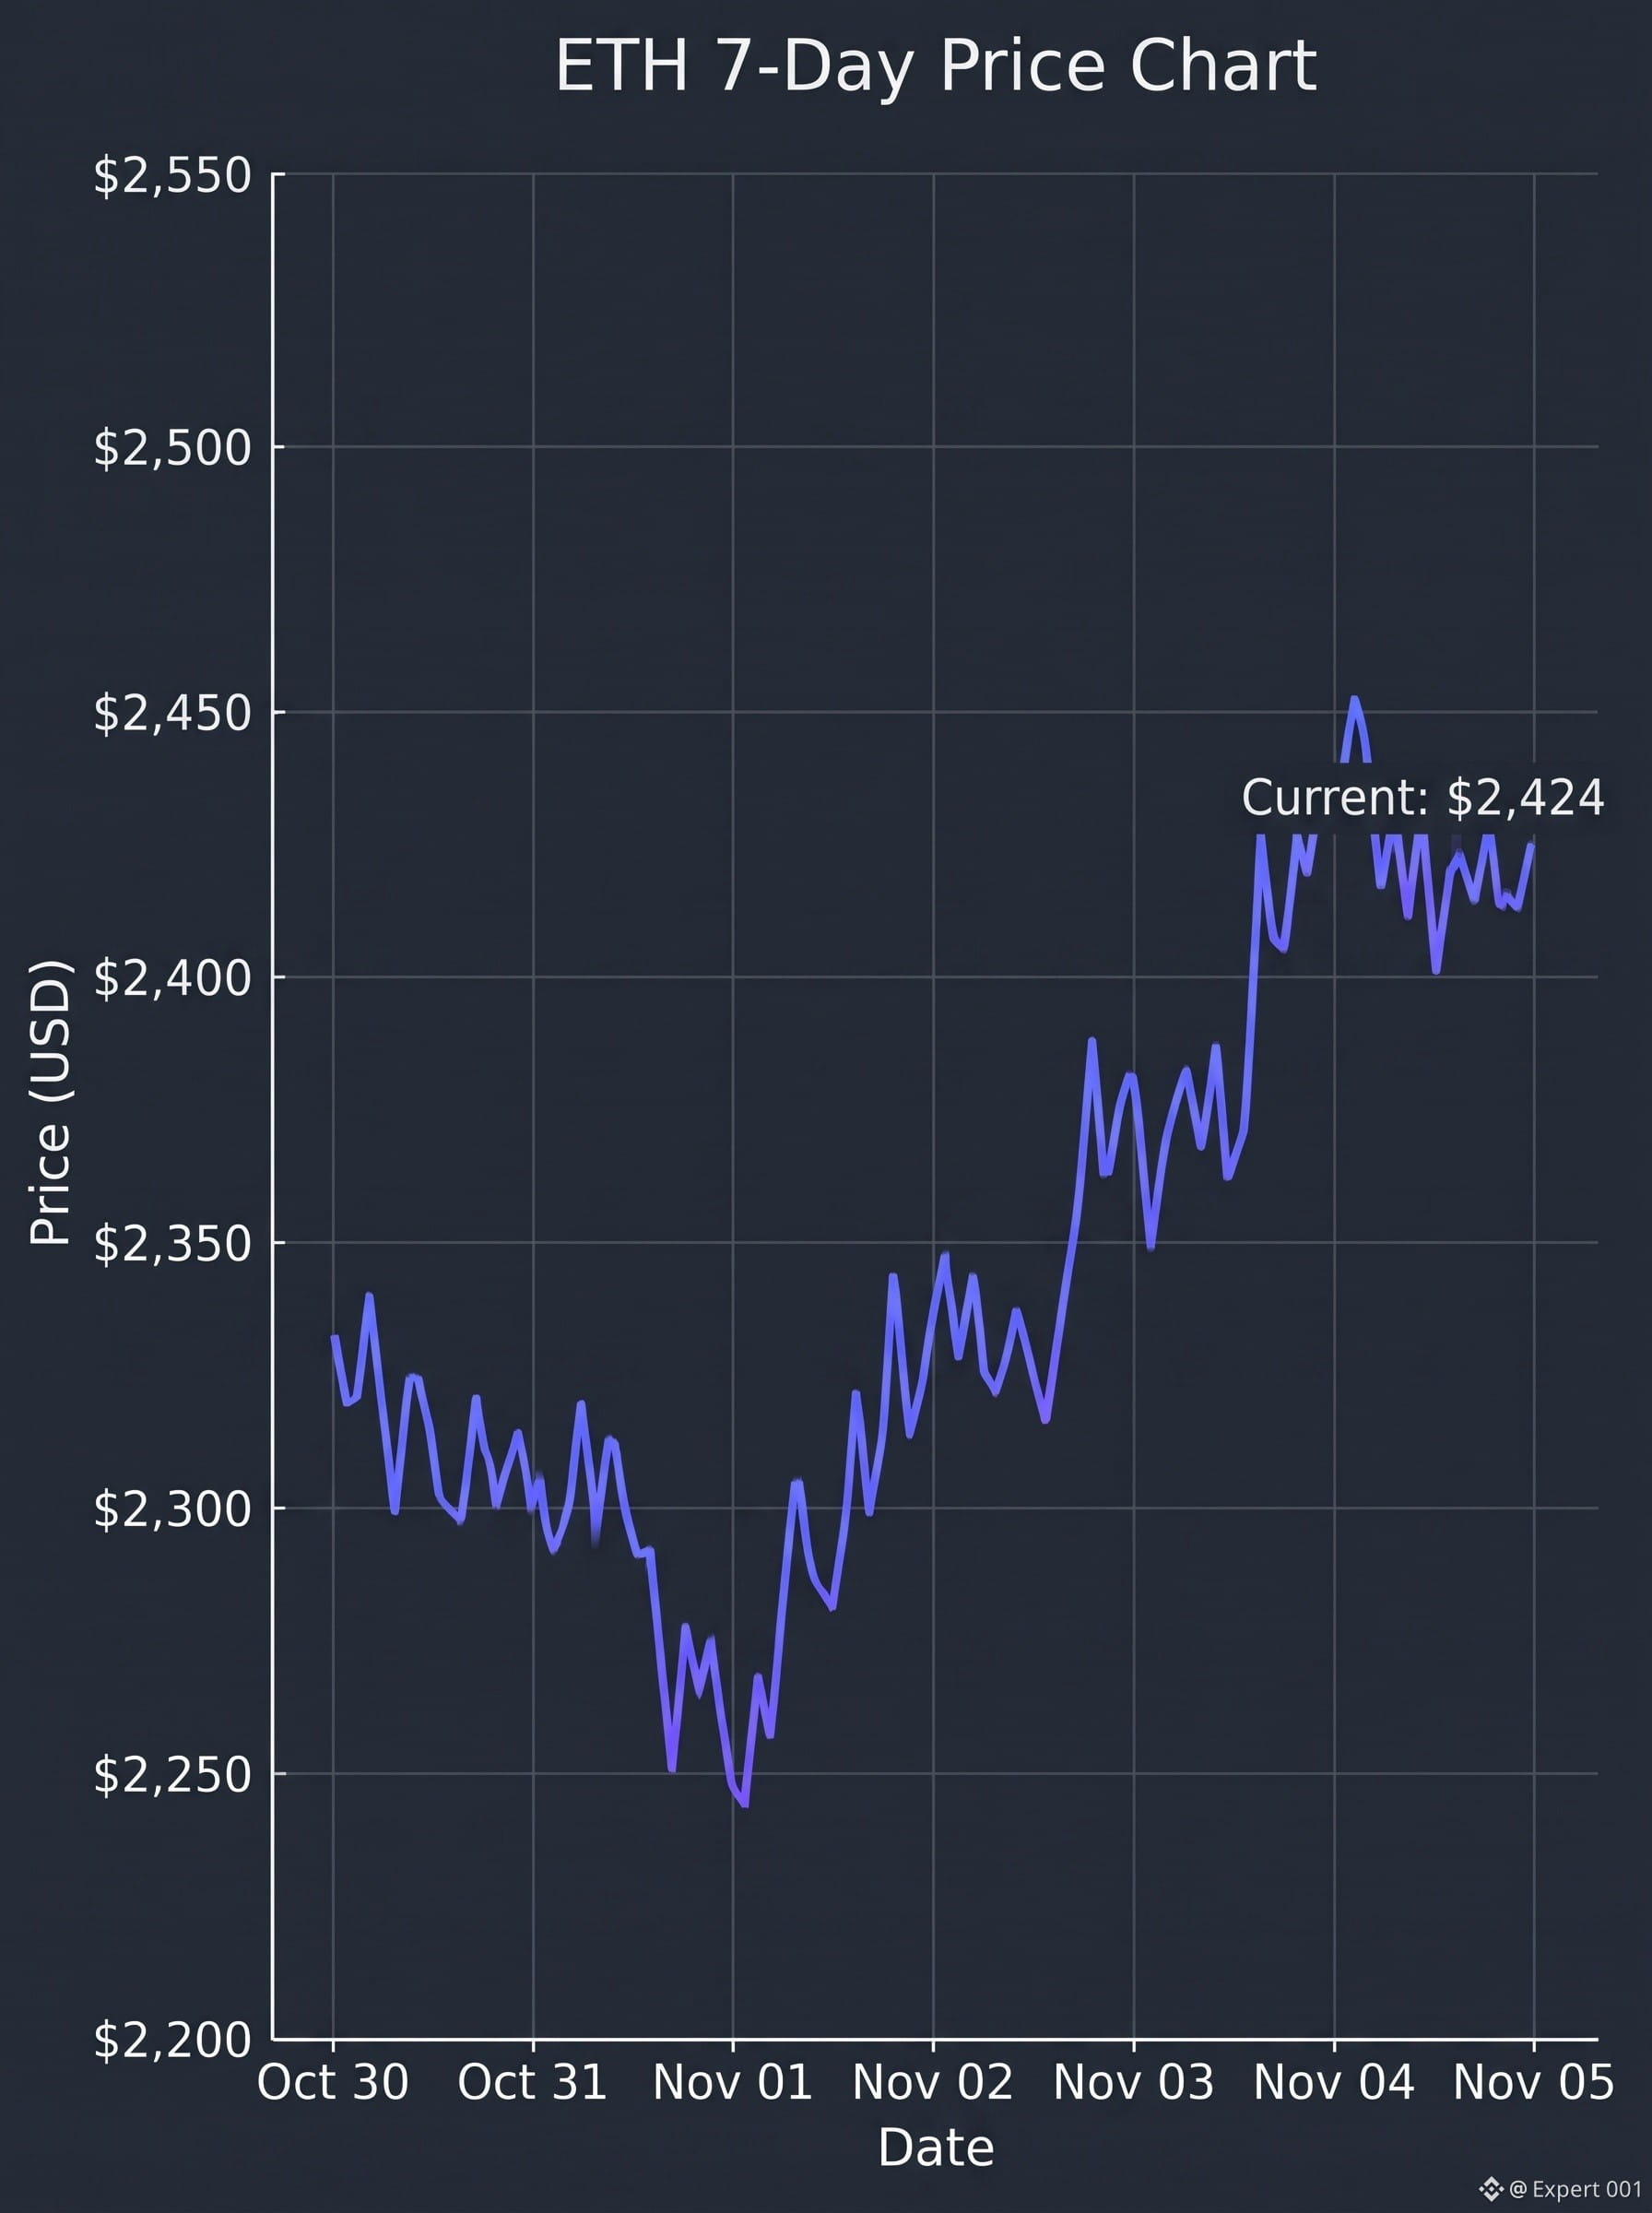
$ETH Ethereum (ETH) – Quick Market Snapshot
As of November 5, 2026
Key Metrics:
--Current Price: $2,424.24 USD
--24-Hour Price Change: +4.52%
--Market Capitalization: $296.22 Billion USD
{spot}(ETHUSDT)
Market Developments & Outlook:
$ETH Ethereum (ETH) has experienced a notable upward trajectory over the past week, mirroring a broader cryptocurrency market recovery. Bullish momentum has driven the asset back above the $2,400 threshold, propelled by short liquidations and a rise in risk appetite following stabilization in global macroeconomic backdrops.
Fundamentally, the network is advancing through its 2026 roadmap, which centers on two major protocol upgrades designed to improve scalability and validator efficiency. The first of these, "Glamsterdam," scheduled for the first half of 2026, aims to improve execution speeds and proposer-builder separation without breaking Ethereum Virtual Machine (EVM) compatibility. Following this, the "Hegota" upgrade, planned for the second half of 2026, is expected to introduce state-expiry or data-handling optimizations like Verkle Trees. These continuous updates are designed to alleviate long-term state growth, enhance node sustainability, and lower execution barriers, making the network increasingly predictable for developers. On-chain utility remains robust, heavily bolstered by Ethereum's integration with scaling and settlement layers like Polygon’s AggLayer, which seek to resolve liquidity fragmentation across Web3
#viralpost #ETH #BinanceReopensWithdrawalsForMoreAssets #analysis #Binance
$ETH Ethereum (ETH) – Quick Market Snapshot
As of November 5, 2026
Key Metrics:
--Current Price: $2,424.24 USD
--24-Hour Price Change: +4.52%
--Market Capitalization: $296.22 Billion USD
Market Developments & Outlook:
$ETH Ethereum (ETH) has experienced a notable upward trajectory over the past week, mirroring a broader cryptocurrency market recovery. Bullish momentum has driven the asset back above the $2,400 threshold, propelled by short liquidations and a rise in risk appetite following stabilization in global macroeconomic backdrops.
Fundamentally, the network is advancing through its 2026 roadmap, which centers on two major protocol upgrades designed to improve scalability and validator efficiency. The first of these, "Glamsterdam," scheduled for the first half of 2026, aims to improve execution speeds and proposer-builder separation without breaking Ethereum Virtual Machine (EVM) compatibility. Following this, the "Hegota" upgrade, planned for the second half of 2026, is expected to introduce state-expiry or data-handling optimizations like Verkle Trees. These continuous updates are designed to alleviate long-term state growth, enhance node sustainability, and lower execution barriers, making the network increasingly predictable for developers. On-chain utility remains robust, heavily bolstered by Ethereum's integration with scaling and settlement layers like Polygon’s AggLayer, which seek to resolve liquidity fragmentation across Web3
#viralpost #ETH #BinanceReopensWithdrawalsForMoreAssets #analysis #Binance
As of November 5, 2026
Key Metrics:
--Current Price: $2,424.24 USD
--24-Hour Price Change: +4.52%
--Market Capitalization: $296.22 Billion USD
Market Developments & Outlook:
$ETH Ethereum (ETH) has experienced a notable upward trajectory over the past week, mirroring a broader cryptocurrency market recovery. Bullish momentum has driven the asset back above the $2,400 threshold, propelled by short liquidations and a rise in risk appetite following stabilization in global macroeconomic backdrops.
Fundamentally, the network is advancing through its 2026 roadmap, which centers on two major protocol upgrades designed to improve scalability and validator efficiency. The first of these, "Glamsterdam," scheduled for the first half of 2026, aims to improve execution speeds and proposer-builder separation without breaking Ethereum Virtual Machine (EVM) compatibility. Following this, the "Hegota" upgrade, planned for the second half of 2026, is expected to introduce state-expiry or data-handling optimizations like Verkle Trees. These continuous updates are designed to alleviate long-term state growth, enhance node sustainability, and lower execution barriers, making the network increasingly predictable for developers. On-chain utility remains robust, heavily bolstered by Ethereum's integration with scaling and settlement layers like Polygon’s AggLayer, which seek to resolve liquidity fragmentation across Web3
#viralpost #ETH #BinanceReopensWithdrawalsForMoreAssets #analysis #Binance
1
37
·
--
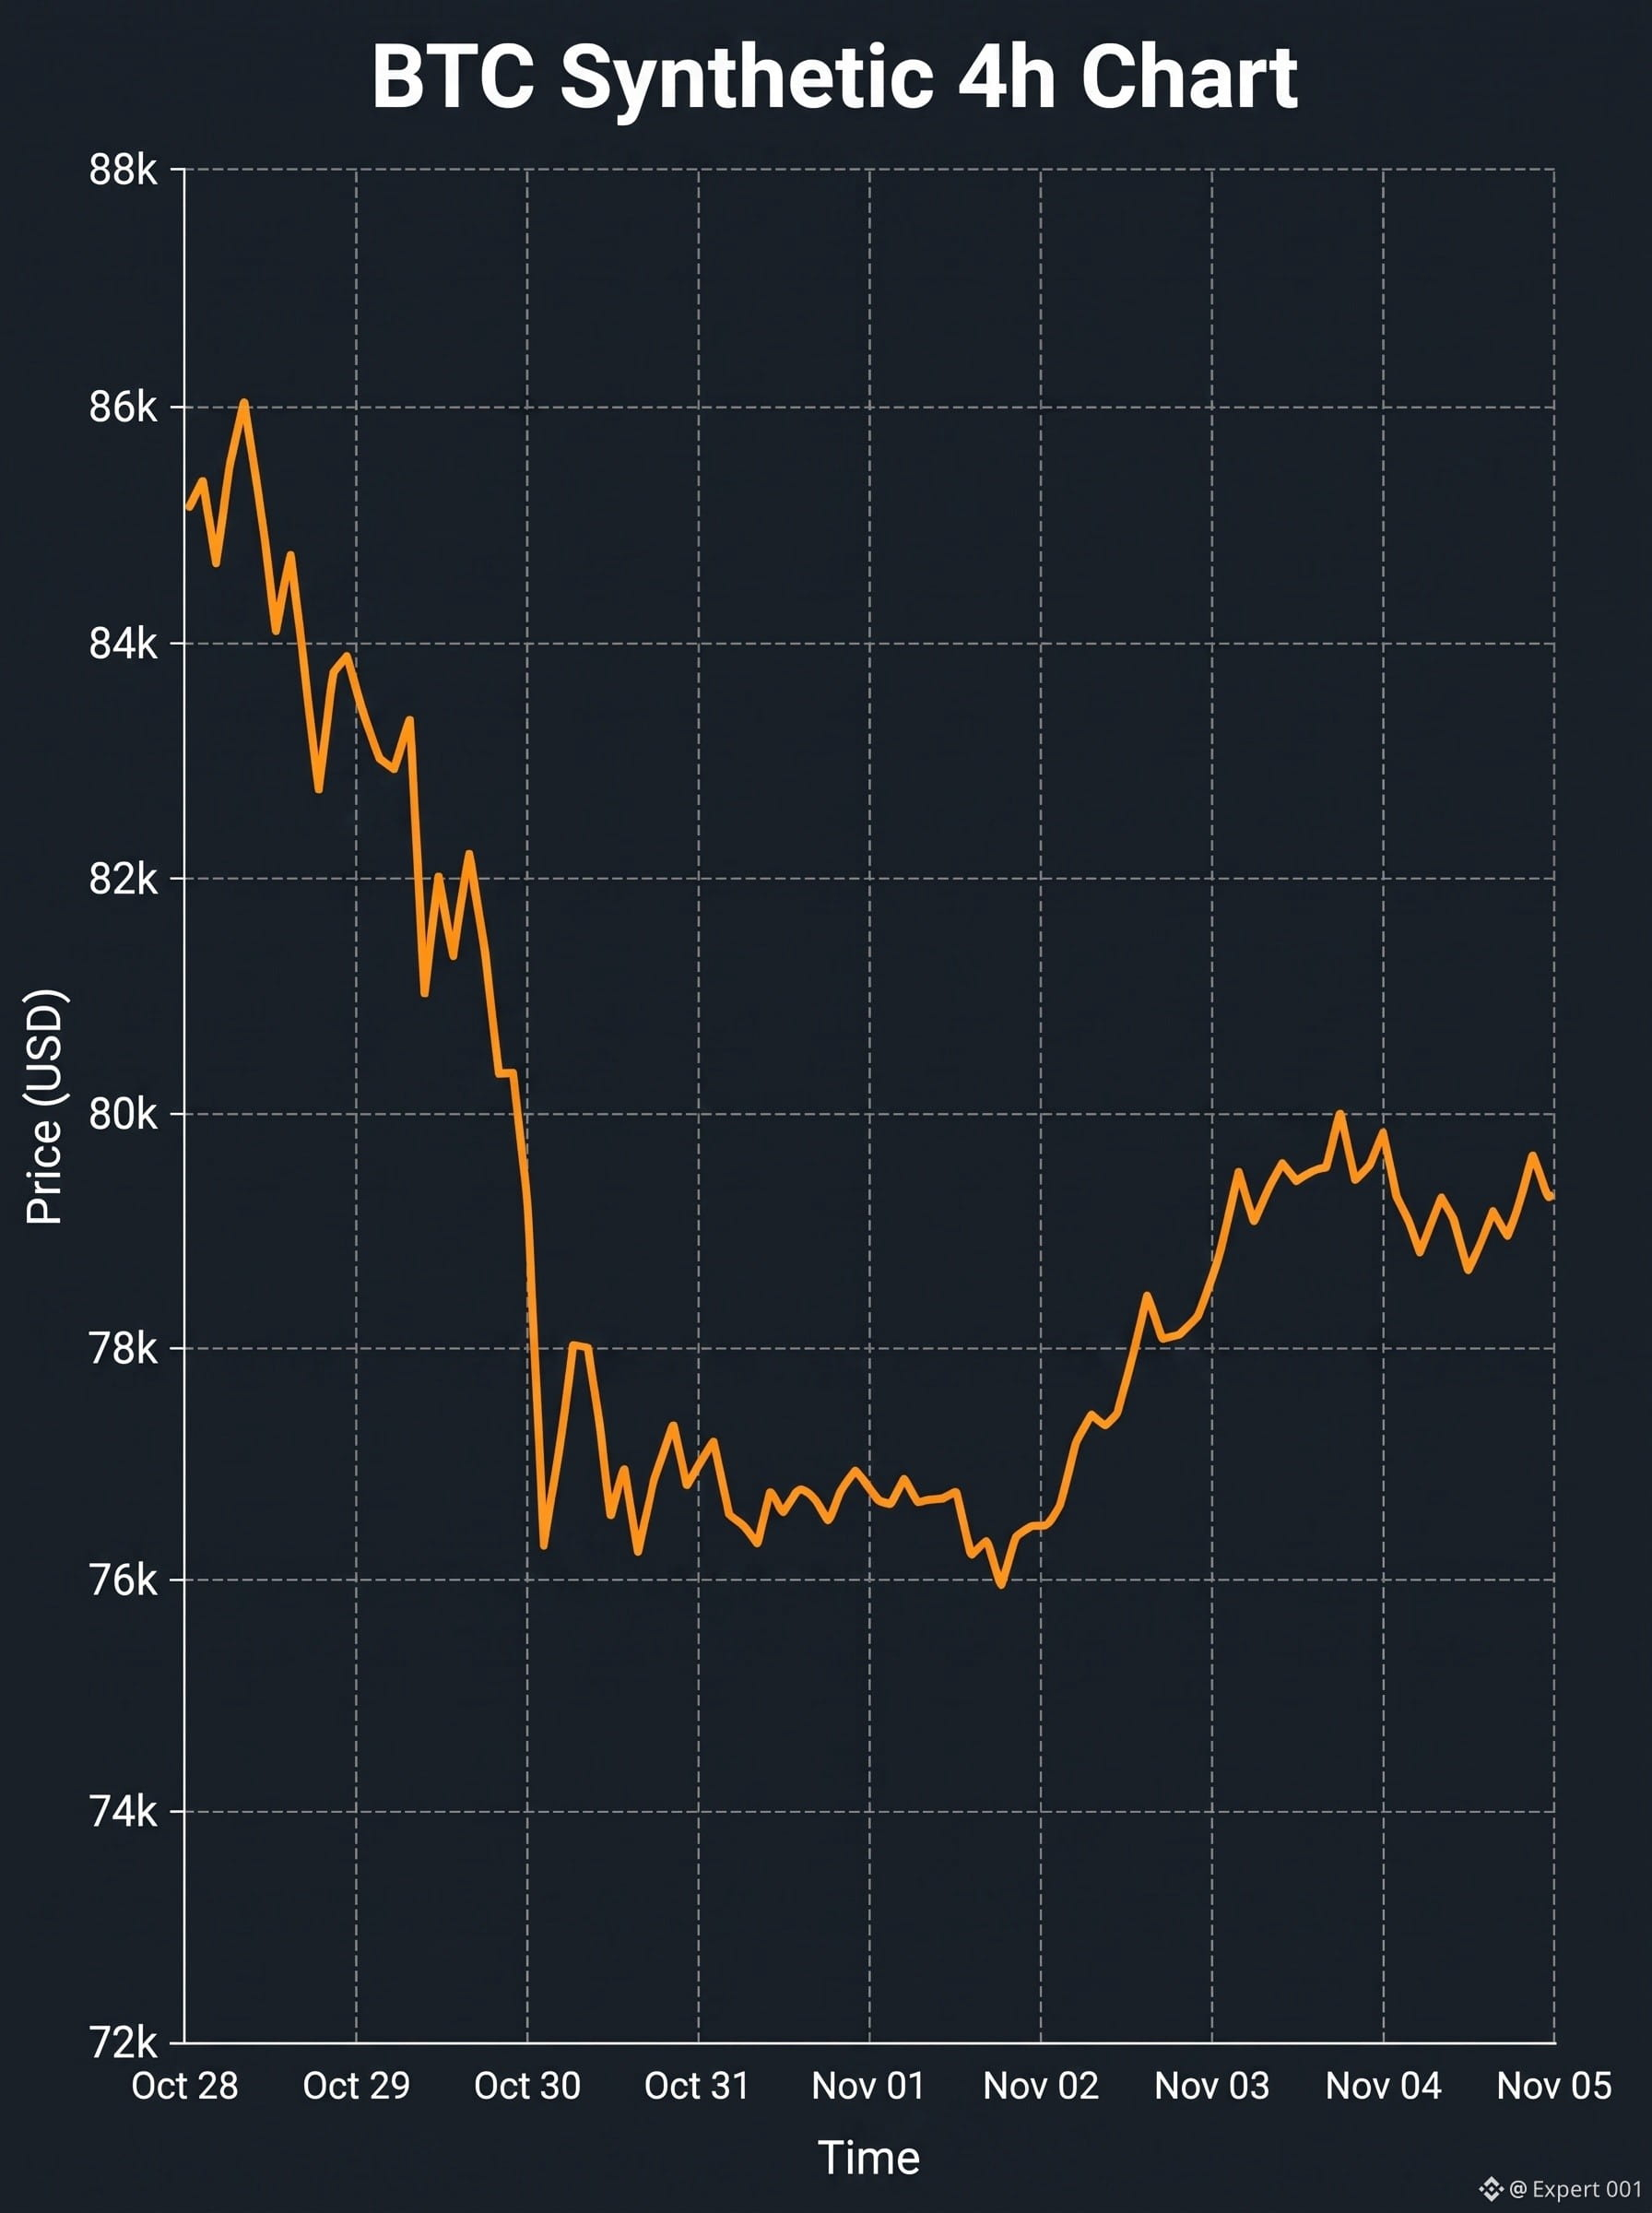
$BTC Bitcoin has also joined the recovery and is currently trading near the high-$780s / low-$79,000s.
After bottoming in the mid-$76,000s earlier in the week, BTC has bounced in line with the broader market. The move higher has been steady but still sits below the late-October highs near $82,000–$84,000.
Key points:
--Short-term structure has improved with higher lows forming.
--Momentum is turning positive but remains below key moving averages on higher timeframes. --The recovery looks constructive so far.
Levels:
--Resistance: $79,424 – $80,000 then $81,850
--Support: $77,646 – $76,000
--Critical support: $74,434
Bias:
Short-term mildly bullish while holding above $76,000. A break and hold above $80,000 would strengthen the case for a move back toward the prior highs. Loss of $76,000 would put the bounce at risk.
#viralpost #cryptouniverseofficial #analysis #BTC走势分析 #BinanceReopensWithdrawalsForMoreAssets
{spot}(BTCUSDT)
$BTC Bitcoin has also joined the recovery and is currently trading near the high-$780s / low-$79,000s.
After bottoming in the mid-$76,000s earlier in the week, BTC has bounced in line with the broader market. The move higher has been steady but still sits below the late-October highs near $82,000–$84,000.
Key points:
--Short-term structure has improved with higher lows forming.
--Momentum is turning positive but remains below key moving averages on higher timeframes. --The recovery looks constructive so far.
Levels:
--Resistance: $79,424 – $80,000 then $81,850
--Support: $77,646 – $76,000
--Critical support: $74,434
Bias:
Short-term mildly bullish while holding above $76,000. A break and hold above $80,000 would strengthen the case for a move back toward the prior highs. Loss of $76,000 would put the bounce at risk.
#viralpost #cryptouniverseofficial #analysis #BTC走势分析 #BinanceReopensWithdrawalsForMoreAssets
After bottoming in the mid-$76,000s earlier in the week, BTC has bounced in line with the broader market. The move higher has been steady but still sits below the late-October highs near $82,000–$84,000.
Key points:
--Short-term structure has improved with higher lows forming.
--Momentum is turning positive but remains below key moving averages on higher timeframes. --The recovery looks constructive so far.
Levels:
--Resistance: $79,424 – $80,000 then $81,850
--Support: $77,646 – $76,000
--Critical support: $74,434
Bias:
Short-term mildly bullish while holding above $76,000. A break and hold above $80,000 would strengthen the case for a move back toward the prior highs. Loss of $76,000 would put the bounce at risk.
#viralpost #cryptouniverseofficial #analysis #BTC走势分析 #BinanceReopensWithdrawalsForMoreAssets
1
51
Log in to explore more content
Join global crypto users on Binance Square
⚡️ Get latest and useful information about crypto.
💬 Trusted by the world’s largest crypto exchange.
👍 Discover real insights from verified creators.
Email / Phone number
Trending Topics
CryptoSelloffTriggersMultipleWhaleLiquidations
202,742 views
1,867 Discussing
Crypto Liquidations Top $2B in 24 Hours as 329,000 Traders Are Wiped Out
Binance News
·40 Likes
·58.1k views
USSpotXRPETFsSeeLargestWeeklyOutflowIn8Months
173,521 views
1,602 Discussing
WillFOMCMinutesReinforceRateHikeExpectations?
53,815 views
787 Discussing