
0xPAo_Bit
97 Posts

0xPAo_Bit
🧣:0xPAo 推特:0xPAo.Bit

BNB Holder
Occasional Trader
4.2 Years
14 Following
680 Followers
72 Liked
Posts
All
Quotes
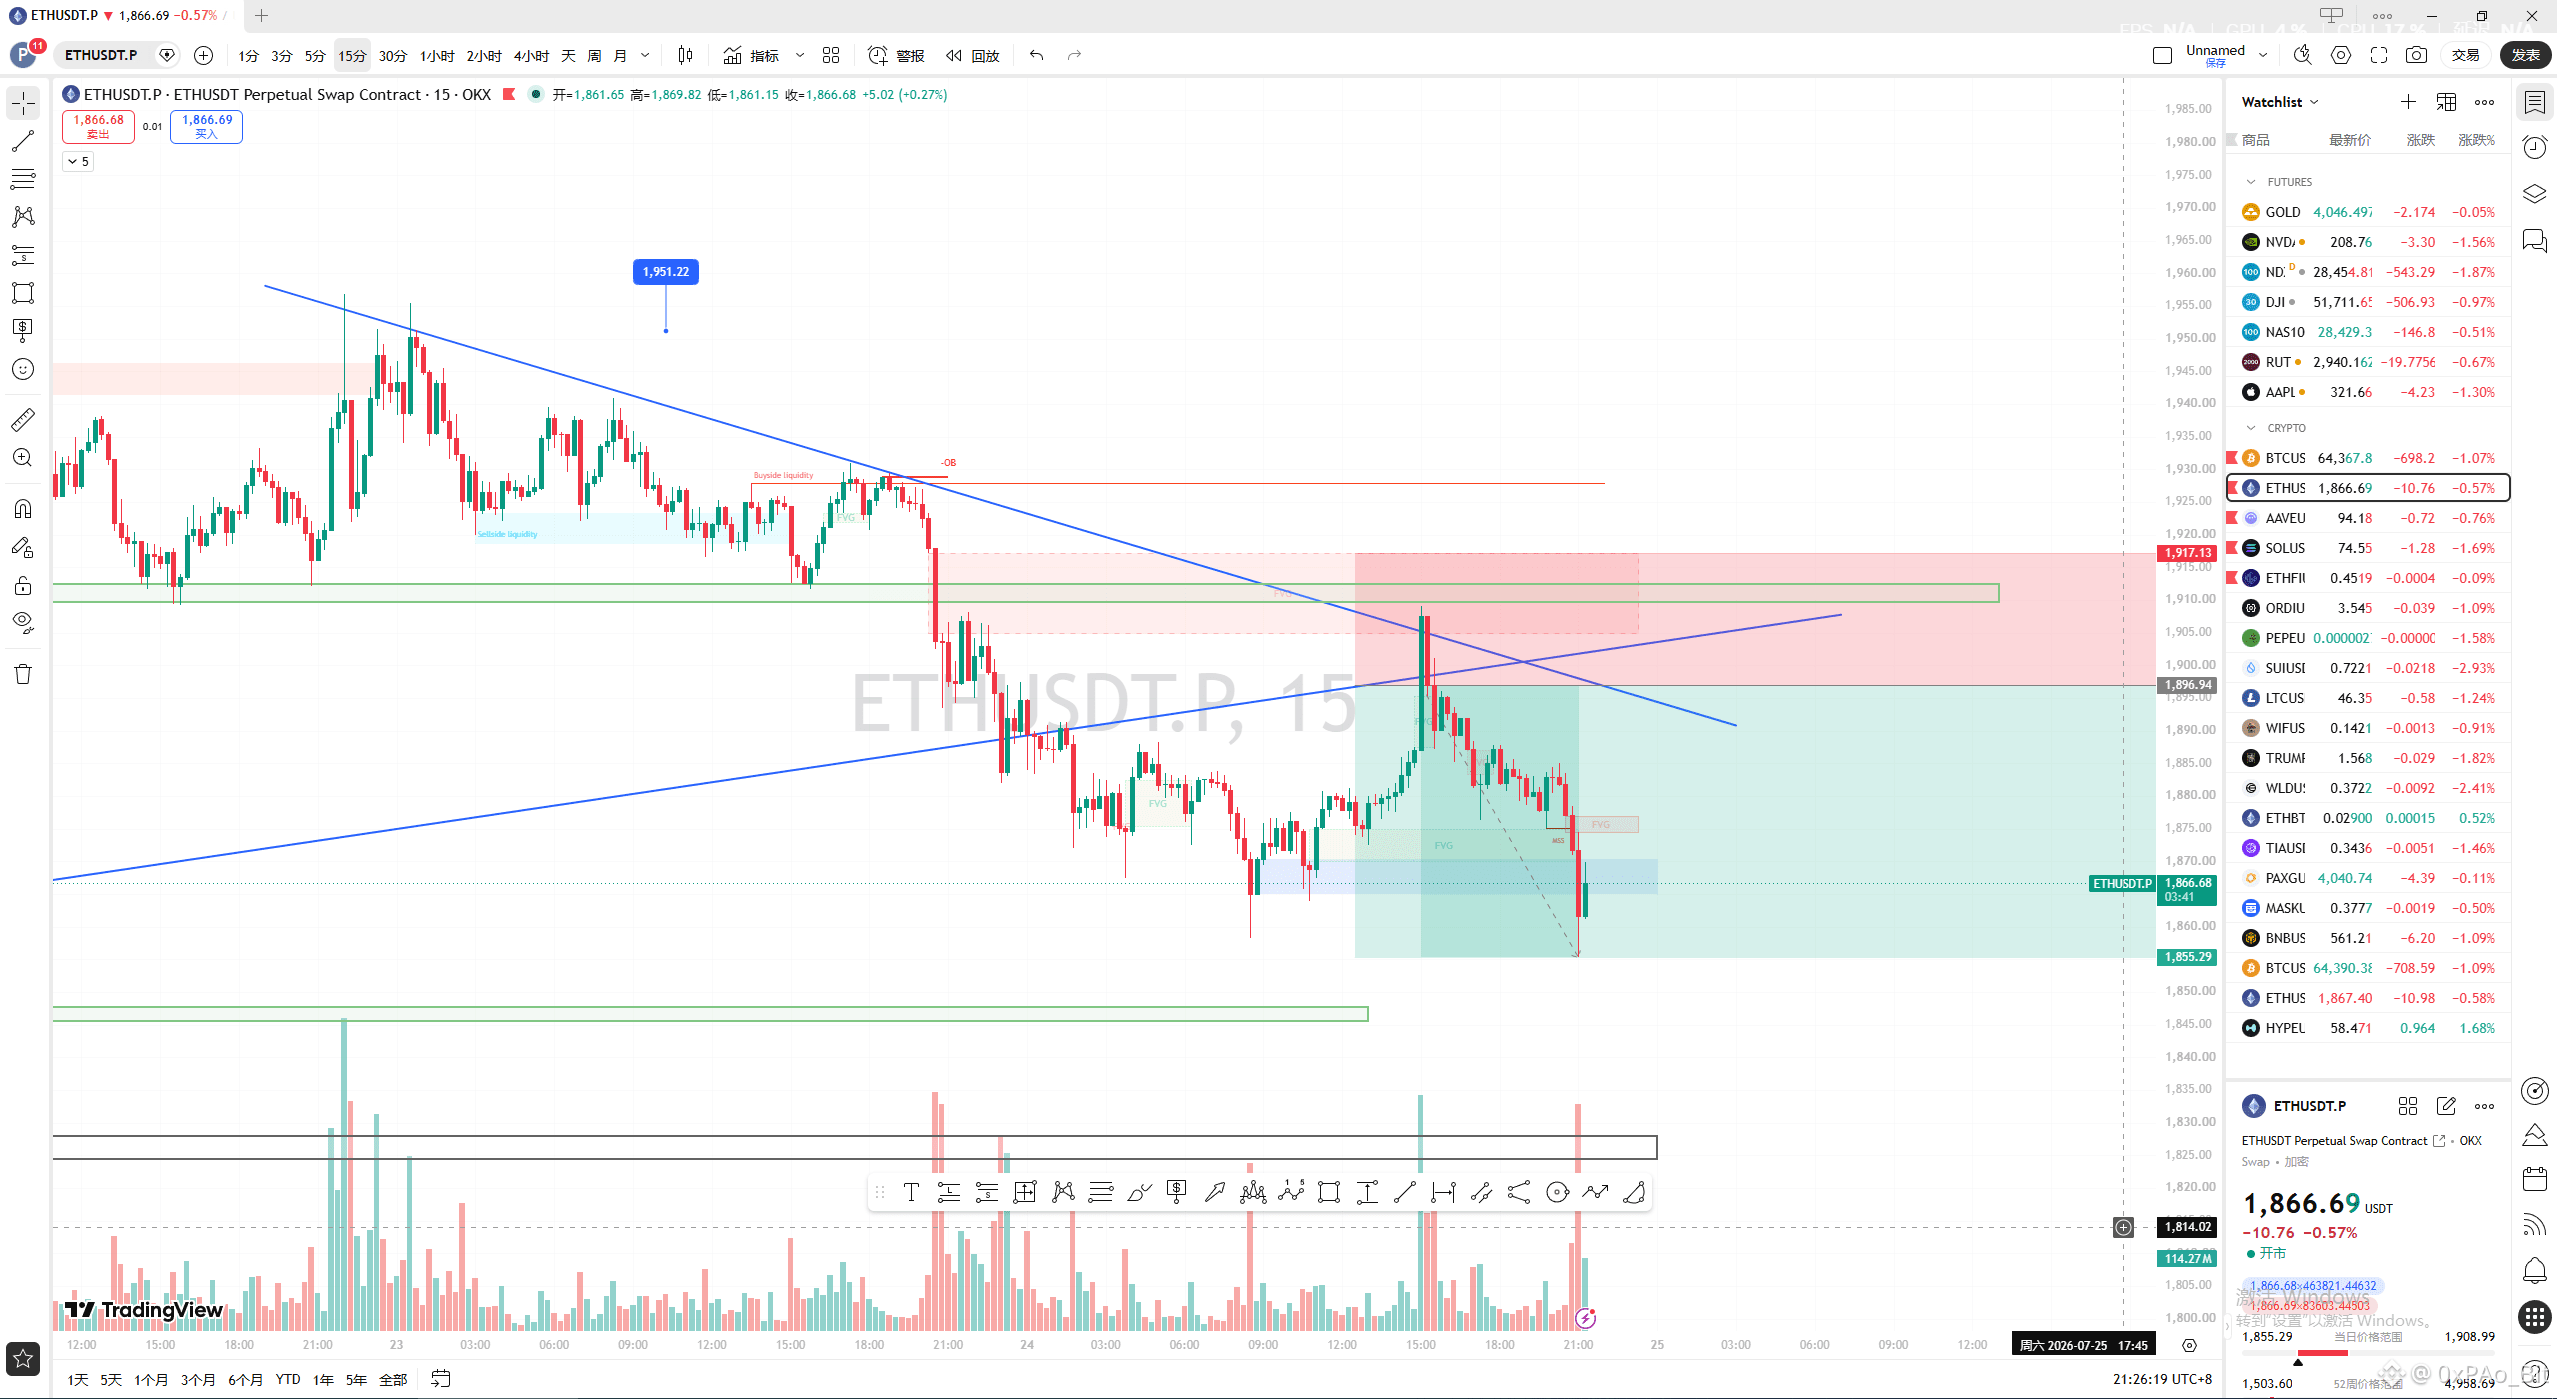
$ETH perfectly reaches the first take-profit
0xPAo_Bit
·
--
📊 0xPAo_Bit|#BTC #Ethereum Daily Market Structure Analysis (July 24)
One-sentence summary:
Yesterday successfully broke below the key structure level, validating the bearish thesis; today focus on the strength of the rebound—if the rebound fails to break resistance, the bears still hold the upper hand.
📖 Yesterday’s Trade Recap
The core idea provided yesterday was very clear:
Once a key structure breaks, trade in that direction without guessing early.
ETH ultimately broke the key structure, the bears continued, and the market completed the first phase of the decline as expected.
This also once again confirms one thing:
Making money in trading isn’t about predicting—it’s about trading after confirmation.
🔵 ETH
Current structure:
On the 4-hour timeframe, it leans toward forming a Bear Flag. The current price has already broken below the lower edge of the flag, so the short-term bearish structure is dominant.
If the subsequent rebound cannot reclaim the prior broken zone, then the Bear Flag structure remains valid.
📉 Bearish Plan
Watch how price behaves after rebounding into the resistance zone.
If:
✅ the 1-hour rebound is rejected;
✅ a new BOS (Break of Structure) occurs downward;
✅ MSS (Market Structure Shift) appears on the 15-minute timeframe;
then continue looking for short opportunities following the trend.
🎯 First target: 1851
🎯 Second target: 1826
📈 Bullish Plan
If price reclaims the inside of the Bear Flag and completes a 1-hour close confirmation, then abandon the bearish thesis.
Wait for a new bullish structure to form before participating.
🟠 BTC
Current structure:
BTC is still moving within the rising wedge.
It has already arrived near the end of the wedge, and a direction choice is expected soon.
Break above the wedge’s upper boundary—keep looking for longs;
Break below the lower boundary—be alert for a deeper correction.
Until direction is confirmed, it’s not recommended to place bets early.
⚠️ Risk Warning
Right now, both ETH and BTC are trading near key structural areas.
The biggest risk at this position isn’t getting the direction wrong—it’s entering too early.
Patience and waiting for candlestick confirmation are often more important than grabbing the very first candle.
🎯 Key Idea for Today
$ETH Wait for a pullback to short. 1H close—if within the flag, the shorts are invalid.
$BTC steadily improve along the rising wedge; currently it’s hitting a watershed point—65.5K needs attention!!!! It’s the long/short boundary line within the structure.
"A real trader doesn’t trade every day—it's waiting every day for the opportunity that belongs to them."
— 0xPAo_Bit
One-sentence summary:
Yesterday successfully broke below the key structure level, validating the bearish thesis; today focus on the strength of the rebound—if the rebound fails to break resistance, the bears still hold the upper hand.
📖 Yesterday’s Trade Recap
The core idea provided yesterday was very clear:
Once a key structure breaks, trade in that direction without guessing early.
ETH ultimately broke the key structure, the bears continued, and the market completed the first phase of the decline as expected.
This also once again confirms one thing:
Making money in trading isn’t about predicting—it’s about trading after confirmation.
🔵 ETH
Current structure:
On the 4-hour timeframe, it leans toward forming a Bear Flag. The current price has already broken below the lower edge of the flag, so the short-term bearish structure is dominant.
If the subsequent rebound cannot reclaim the prior broken zone, then the Bear Flag structure remains valid.
📉 Bearish Plan
Watch how price behaves after rebounding into the resistance zone.
If:
✅ the 1-hour rebound is rejected;
✅ a new BOS (Break of Structure) occurs downward;
✅ MSS (Market Structure Shift) appears on the 15-minute timeframe;
then continue looking for short opportunities following the trend.
🎯 First target: 1851
🎯 Second target: 1826
📈 Bullish Plan
If price reclaims the inside of the Bear Flag and completes a 1-hour close confirmation, then abandon the bearish thesis.
Wait for a new bullish structure to form before participating.
🟠 BTC
Current structure:
BTC is still moving within the rising wedge.
It has already arrived near the end of the wedge, and a direction choice is expected soon.
Break above the wedge’s upper boundary—keep looking for longs;
Break below the lower boundary—be alert for a deeper correction.
Until direction is confirmed, it’s not recommended to place bets early.
⚠️ Risk Warning
Right now, both ETH and BTC are trading near key structural areas.
The biggest risk at this position isn’t getting the direction wrong—it’s entering too early.
Patience and waiting for candlestick confirmation are often more important than grabbing the very first candle.
🎯 Key Idea for Today
$ETH Wait for a pullback to short. 1H close—if within the flag, the shorts are invalid.
$BTC steadily improve along the rising wedge; currently it’s hitting a watershed point—65.5K needs attention!!!! It’s the long/short boundary line within the structure.
"A real trader doesn’t trade every day—it's waiting every day for the opportunity that belongs to them."
— 0xPAo_Bit
Breakout on increasing volume; an upward consolidation continuation, sustained acceleration! The cavalry rules!
0xPAo_Bit
·
--
Bullish📊 0xPAo_Bit|Daily Market Structure Analysis (July 15)
🚨One-sentence summary:
BTC has broken out of the consolidation range, and the bulls still hold the upper hand; ETH is in an upward continuation phase—consider selling into strength and buying the dips in the short term, while waiting for a directional decision.
Real trading is not predicting the next candlestick—it’s identifying which stage the market is in and executing the strategy that belongs to that stage.
🟠 BTC
Current structure
Daily: Uptrend continues
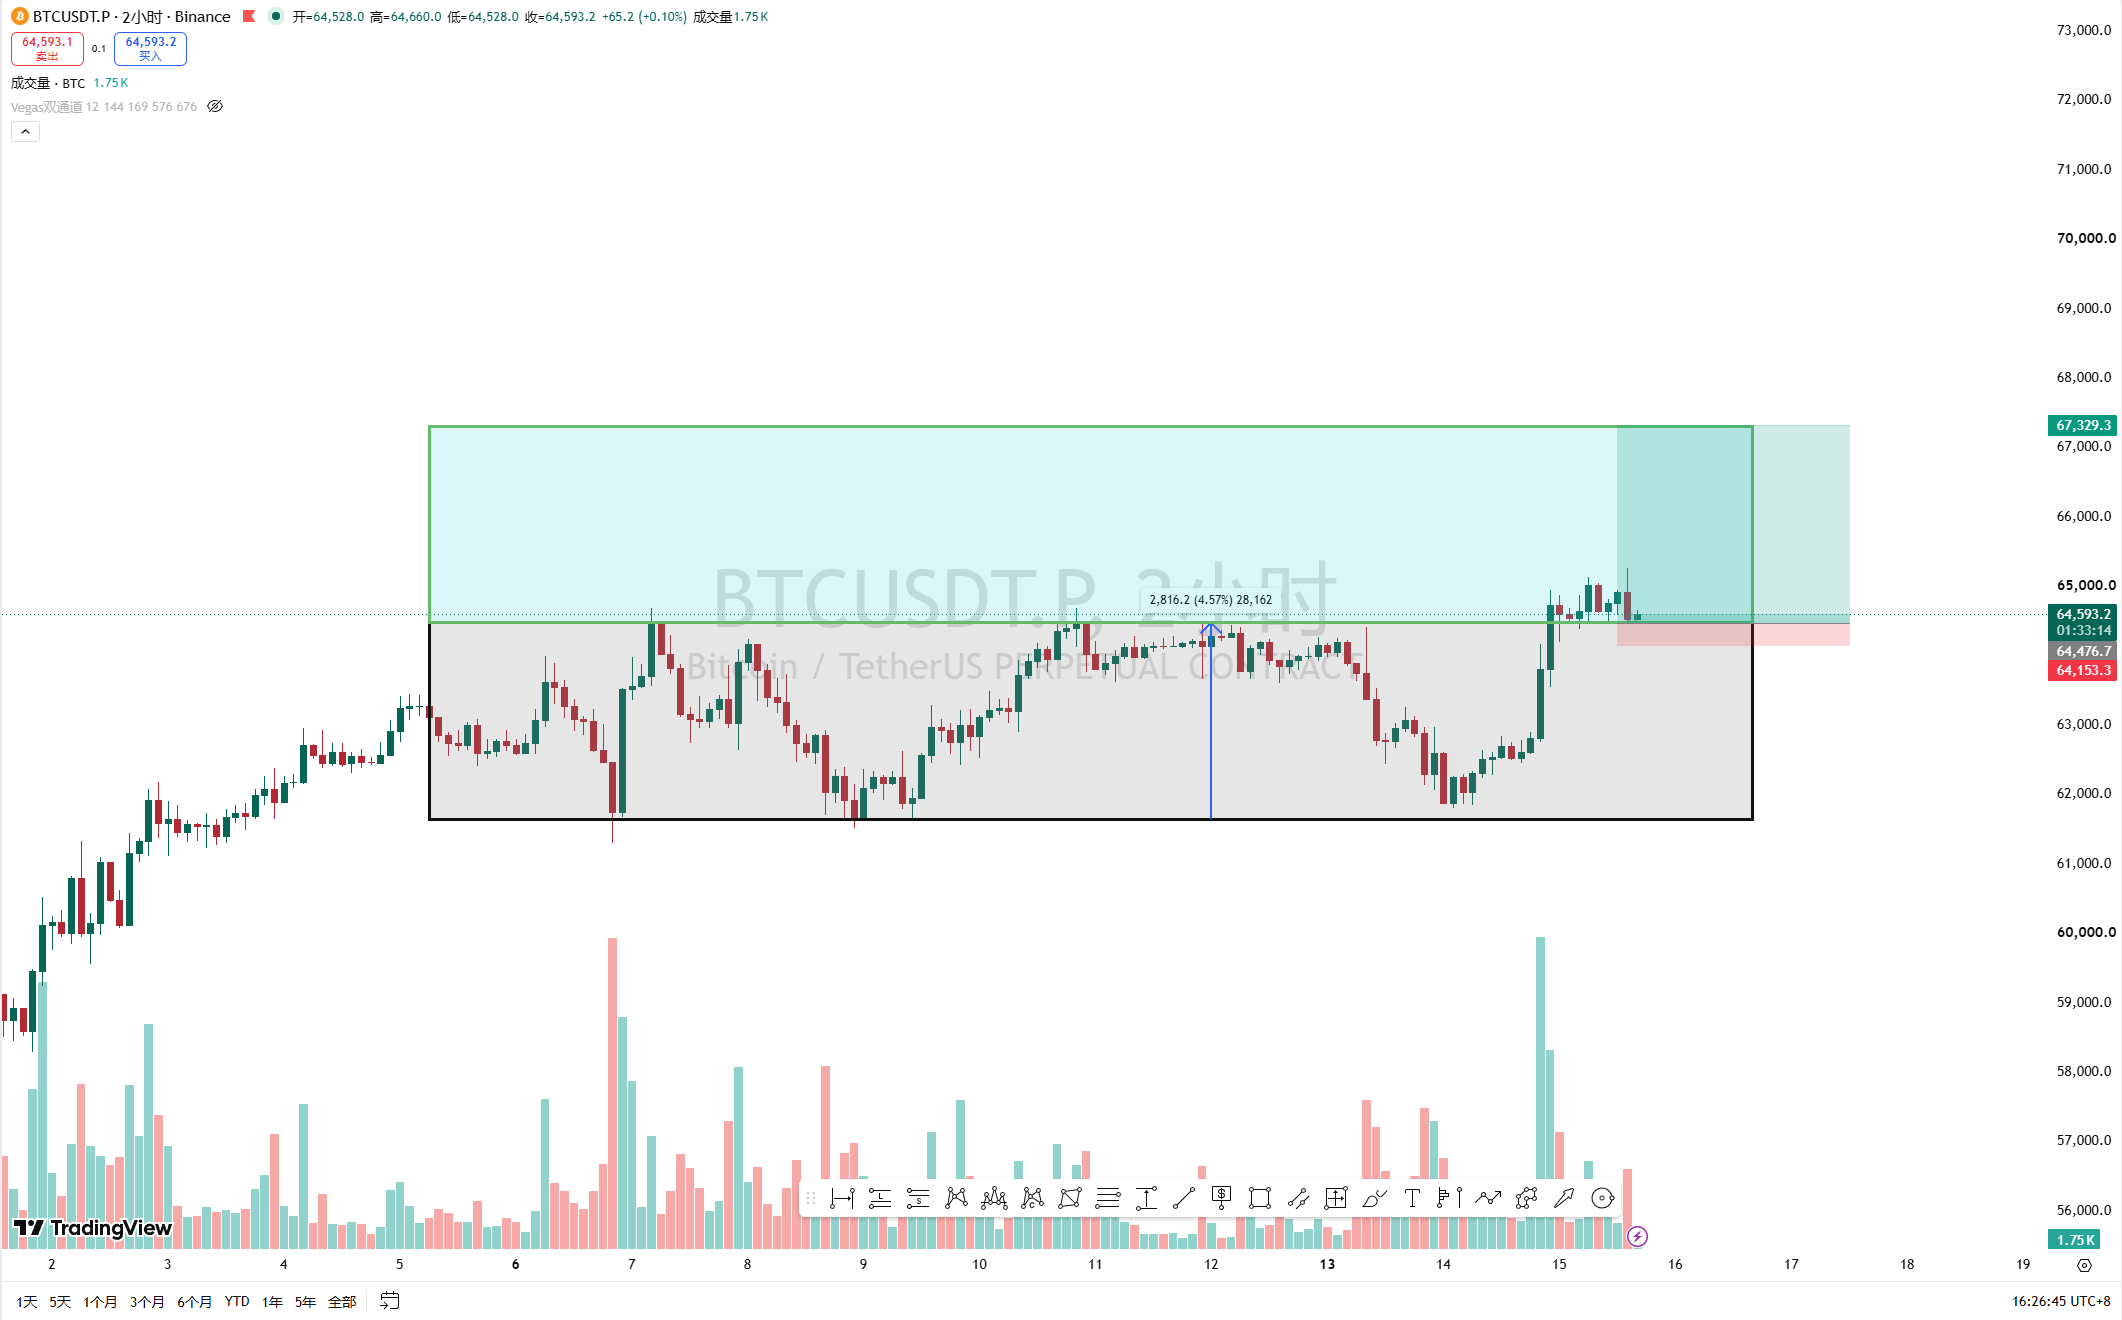
4H: Breakout from a consolidation platform
2H: After the breakout, it hasn’t pulled back; buy-side absorption is evident
Key levels
🟢 Support: 64,450-64,600
🔴 Resistance: 67,300-67,500
Today’s plan
$BTC has already completed the upward breakout from the consolidation range. The current price action has not fallen back into the box, indicating the breakout is still valid for now and the bulls remain in control.
Using equal-width box measurement:
The consolidation range projects a 1:1 extension target around 67.5K.
As long as price continues to trade above the breakout platform, the bias remains to go long with the trend.
If later there is a pullback toward around 64.5K and it finds support, it can still be treated as a trend-following long opportunity.
🔵 ETH
Current structure
Daily: Upward repair
4H: Upward continuation consolidation
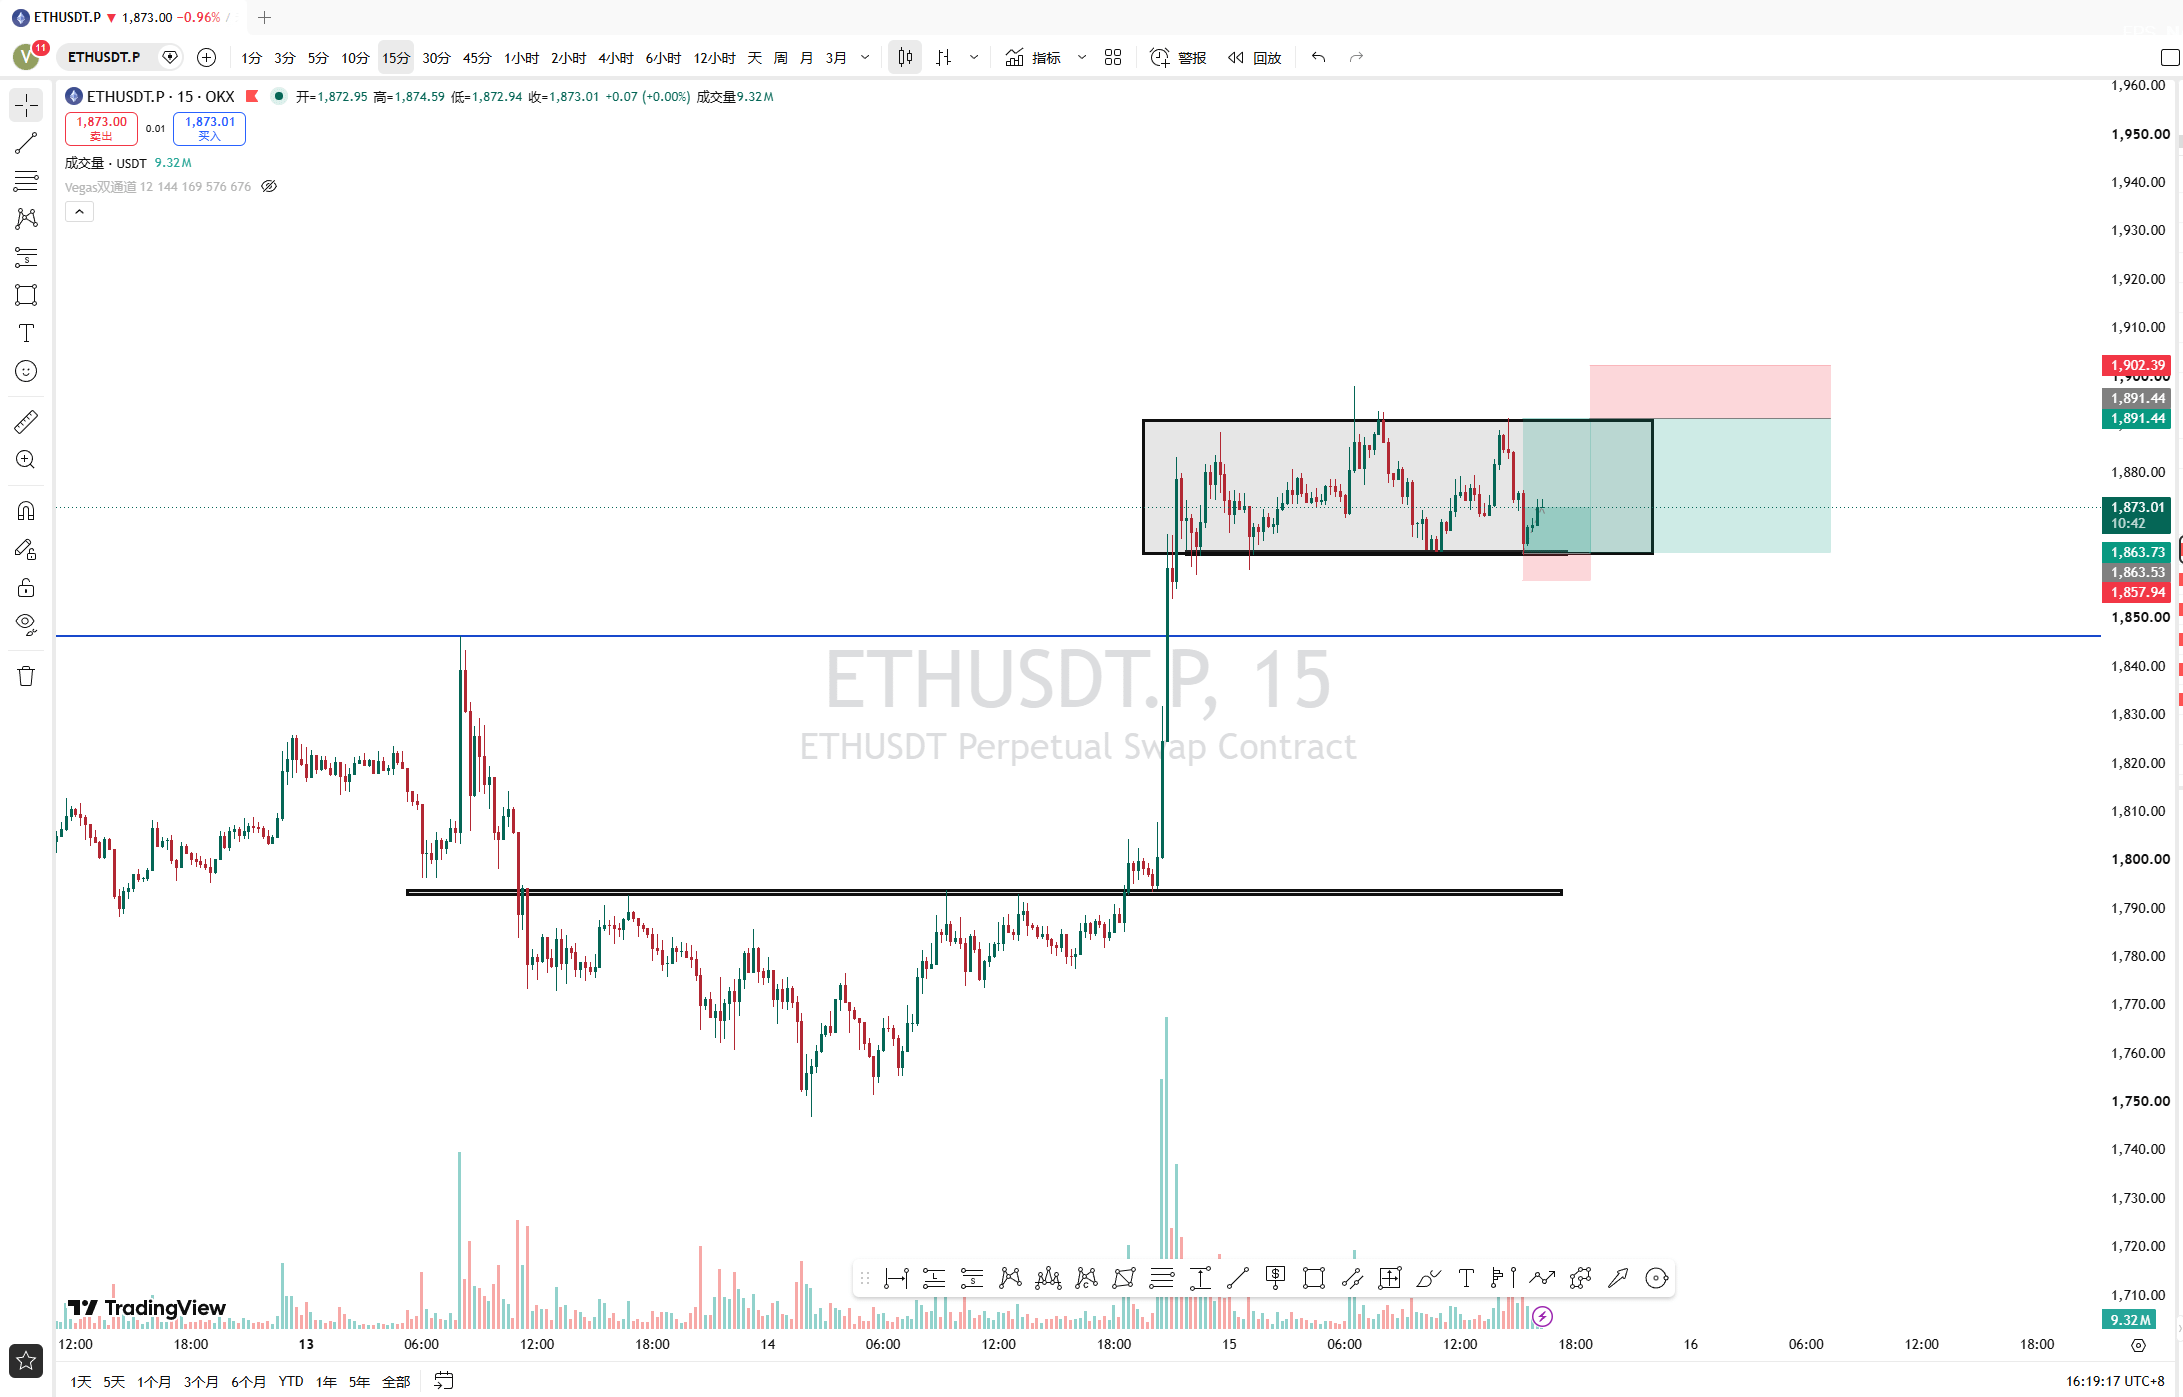
It is currently in a boxed range (choppy) phase
Key levels
🟢 Support: 1860-1865
🔴 Resistance: 1890-1900
Today’s plan
$ETH after a fast surge did not continue with a volume breakout; instead, it has been repeatedly oscillating between 1860 and 1890. After multiple dips, buy-side absorption has shown up each time, which aligns more with an upward continuation pattern.
At this stage, the market has not chosen its final direction.
Therefore, the trading strategy is very clear:
✅ Near 1860, look for dip-buying opportunities.
✅ Near 1890, look for selling into strength or short opportunities.
Wait until there is a true breakout from the box, then follow the move.
📌 Today’s core view
The pace of BTC and ETH has started to diverge today.
BTC:
It is a trend move after a breakout.
Idea:
Go long with the trend—don’t easily guess the top.
ETH:
It is a consolidation/continuation phase after an upward move.
Idea:
Before the box breaks out, sell into strength and buy dips.
For real trend trading, you need to wait for directional confirmation—not chase and cut losses in the middle of the range.
⚠️ Risk warning
If BTC falls back into the breakout box again, be cautious of a false breakout and reassess the bullish structure.
If ETH breaks out of 1890 effectively, the upward continuation is confirmed; if it breaks below 1860, the short-term consolidation structure fails and you need to reassess bearish opportunities.
🚨One-sentence summary:
BTC has broken out of the consolidation range, and the bulls still hold the upper hand; ETH is in an upward continuation phase—consider selling into strength and buying the dips in the short term, while waiting for a directional decision.
Real trading is not predicting the next candlestick—it’s identifying which stage the market is in and executing the strategy that belongs to that stage.
🟠 BTC
Current structure
Daily: Uptrend continues
4H: Breakout from a consolidation platform
2H: After the breakout, it hasn’t pulled back; buy-side absorption is evident
Key levels
🟢 Support: 64,450-64,600
🔴 Resistance: 67,300-67,500
Today’s plan
$BTC has already completed the upward breakout from the consolidation range. The current price action has not fallen back into the box, indicating the breakout is still valid for now and the bulls remain in control.
Using equal-width box measurement:
The consolidation range projects a 1:1 extension target around 67.5K.
As long as price continues to trade above the breakout platform, the bias remains to go long with the trend.
If later there is a pullback toward around 64.5K and it finds support, it can still be treated as a trend-following long opportunity.
🔵 ETH
Current structure
Daily: Upward repair
4H: Upward continuation consolidation
It is currently in a boxed range (choppy) phase
Key levels
🟢 Support: 1860-1865
🔴 Resistance: 1890-1900
Today’s plan
$ETH after a fast surge did not continue with a volume breakout; instead, it has been repeatedly oscillating between 1860 and 1890. After multiple dips, buy-side absorption has shown up each time, which aligns more with an upward continuation pattern.
At this stage, the market has not chosen its final direction.
Therefore, the trading strategy is very clear:
✅ Near 1860, look for dip-buying opportunities.
✅ Near 1890, look for selling into strength or short opportunities.
Wait until there is a true breakout from the box, then follow the move.
📌 Today’s core view
The pace of BTC and ETH has started to diverge today.
BTC:
It is a trend move after a breakout.
Idea:
Go long with the trend—don’t easily guess the top.
ETH:
It is a consolidation/continuation phase after an upward move.
Idea:
Before the box breaks out, sell into strength and buy dips.
For real trend trading, you need to wait for directional confirmation—not chase and cut losses in the middle of the range.
⚠️ Risk warning
If BTC falls back into the breakout box again, be cautious of a false breakout and reassess the bullish structure.
If ETH breaks out of 1890 effectively, the upward continuation is confirmed; if it breaks below 1860, the short-term consolidation structure fails and you need to reassess bearish opportunities.
📊 0xPAo_Bit|Daily Market Structure Analysis (July 8)
One-sentence summary: Bulls retest key support—breaking it confirms continuation of the downtrend. If support holds, there’s still a chance for a second push higher.
🟠 BTC
Current structure
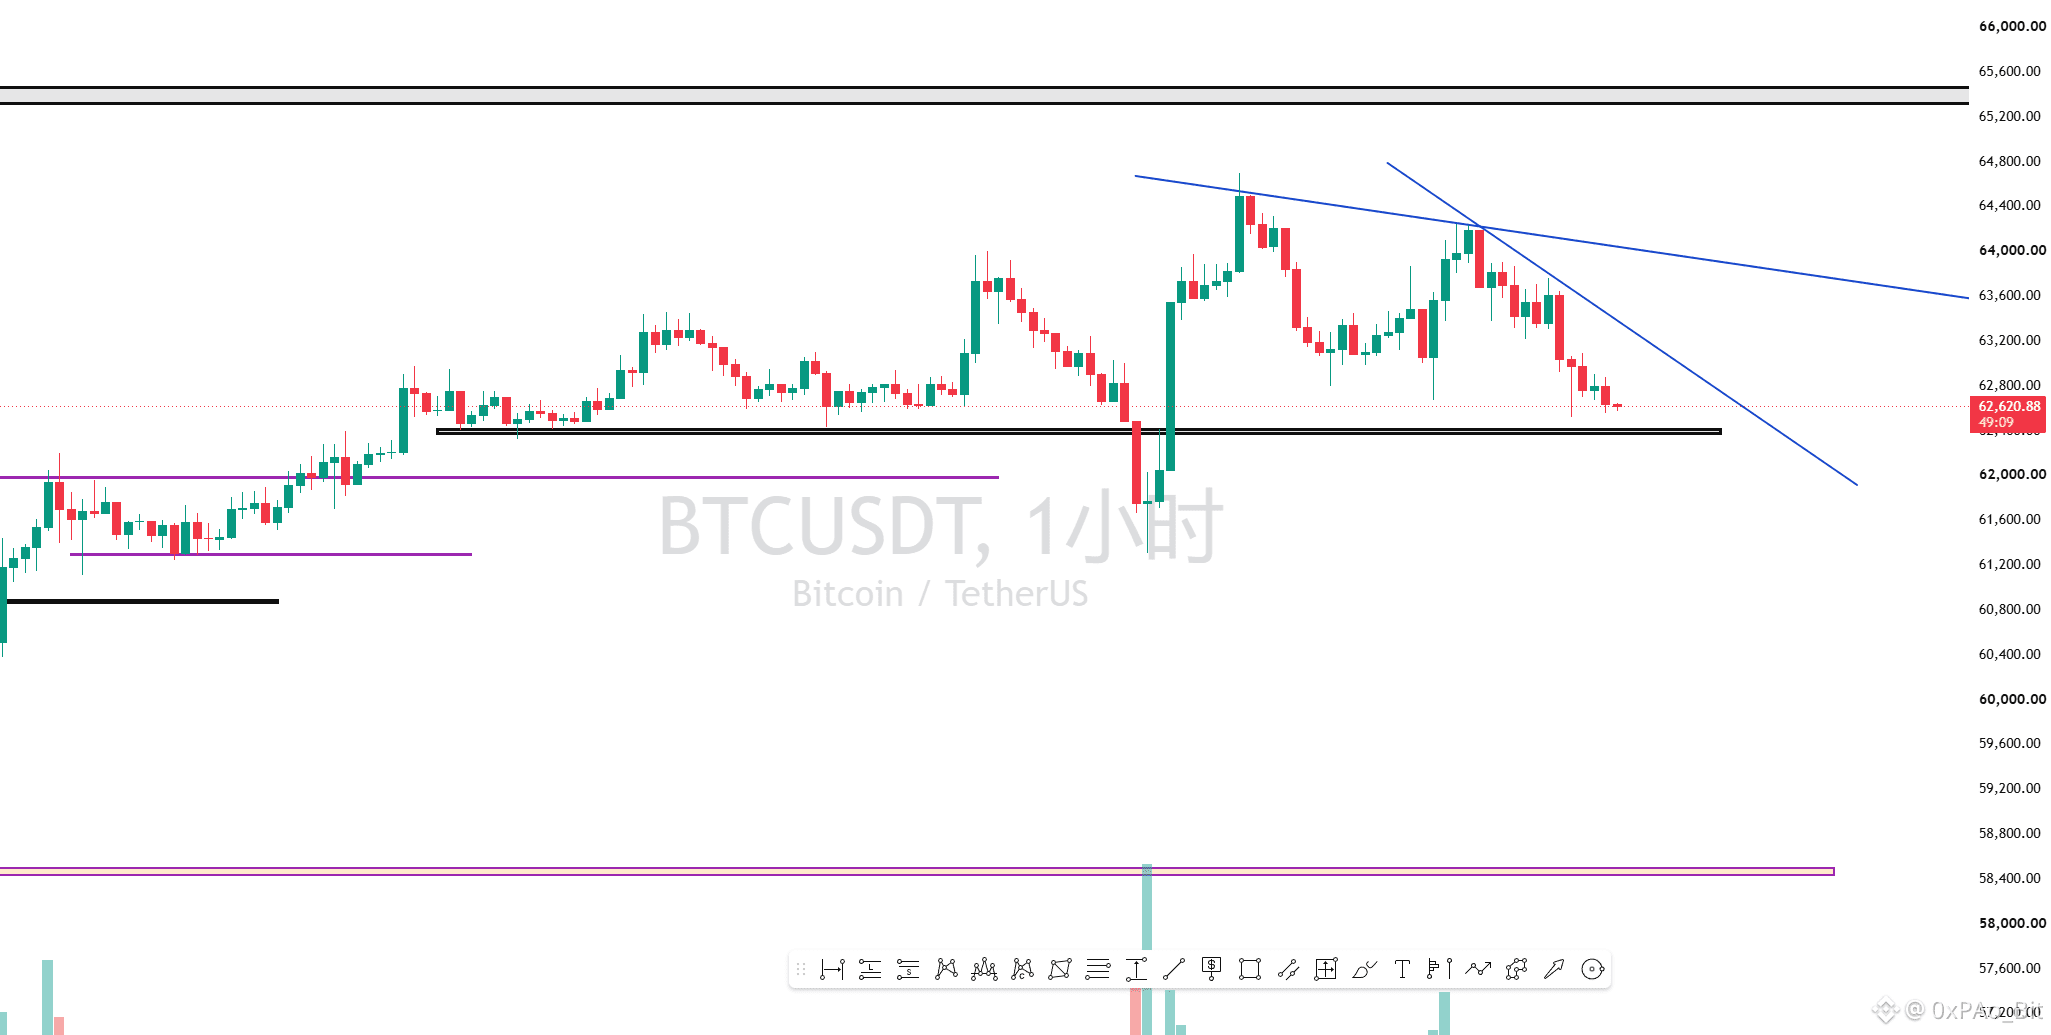
Daily: The rebound repair structure remains intact.
4H: A pullback correction after the rise.
1H: Pullback to key support—waiting for direction selection.
Key levels
🟢 Support: 62,180-62,250
🔴 Resistance: 63,200
Trading plan for today:
Price is currently retesting the former breakout level (support/resistance flip zone).
If on the 1H chart it reclaims 62,180 and a reversal candlestick appears, short-term rebound opportunities are still worth watching.
If the 1H closes meaningfully below 62,180, the upward structure fails and bears may further test liquidity near 61,000.
My thinking:
As long as support doesn’t break, don’t chase shorts.
If support breaks, follow the move and short in trend.
🔵 ETH
Current structure
Daily: During bottom repair.
4H: First pullback within the uptrend.
1H: Testing key support.
Key levels:
🟢 Support: 1747-1750
🟠 Secondary support: 1720-1725
🔴 Resistance: 1780-1800
Trading plan for today:
1747-1750 is the support/resistance flip level after this round’s rise, and also the most important 1H structural area right now.
This is the true dividing line between bulls and bears!
If support holds effectively, there’s still a chance the market retests 1780 and even 1800 in the short term.
If the 1H closes meaningfully below 1750, the uptrend structure ends and bears may further test the 1720 area, even down toward 1680.
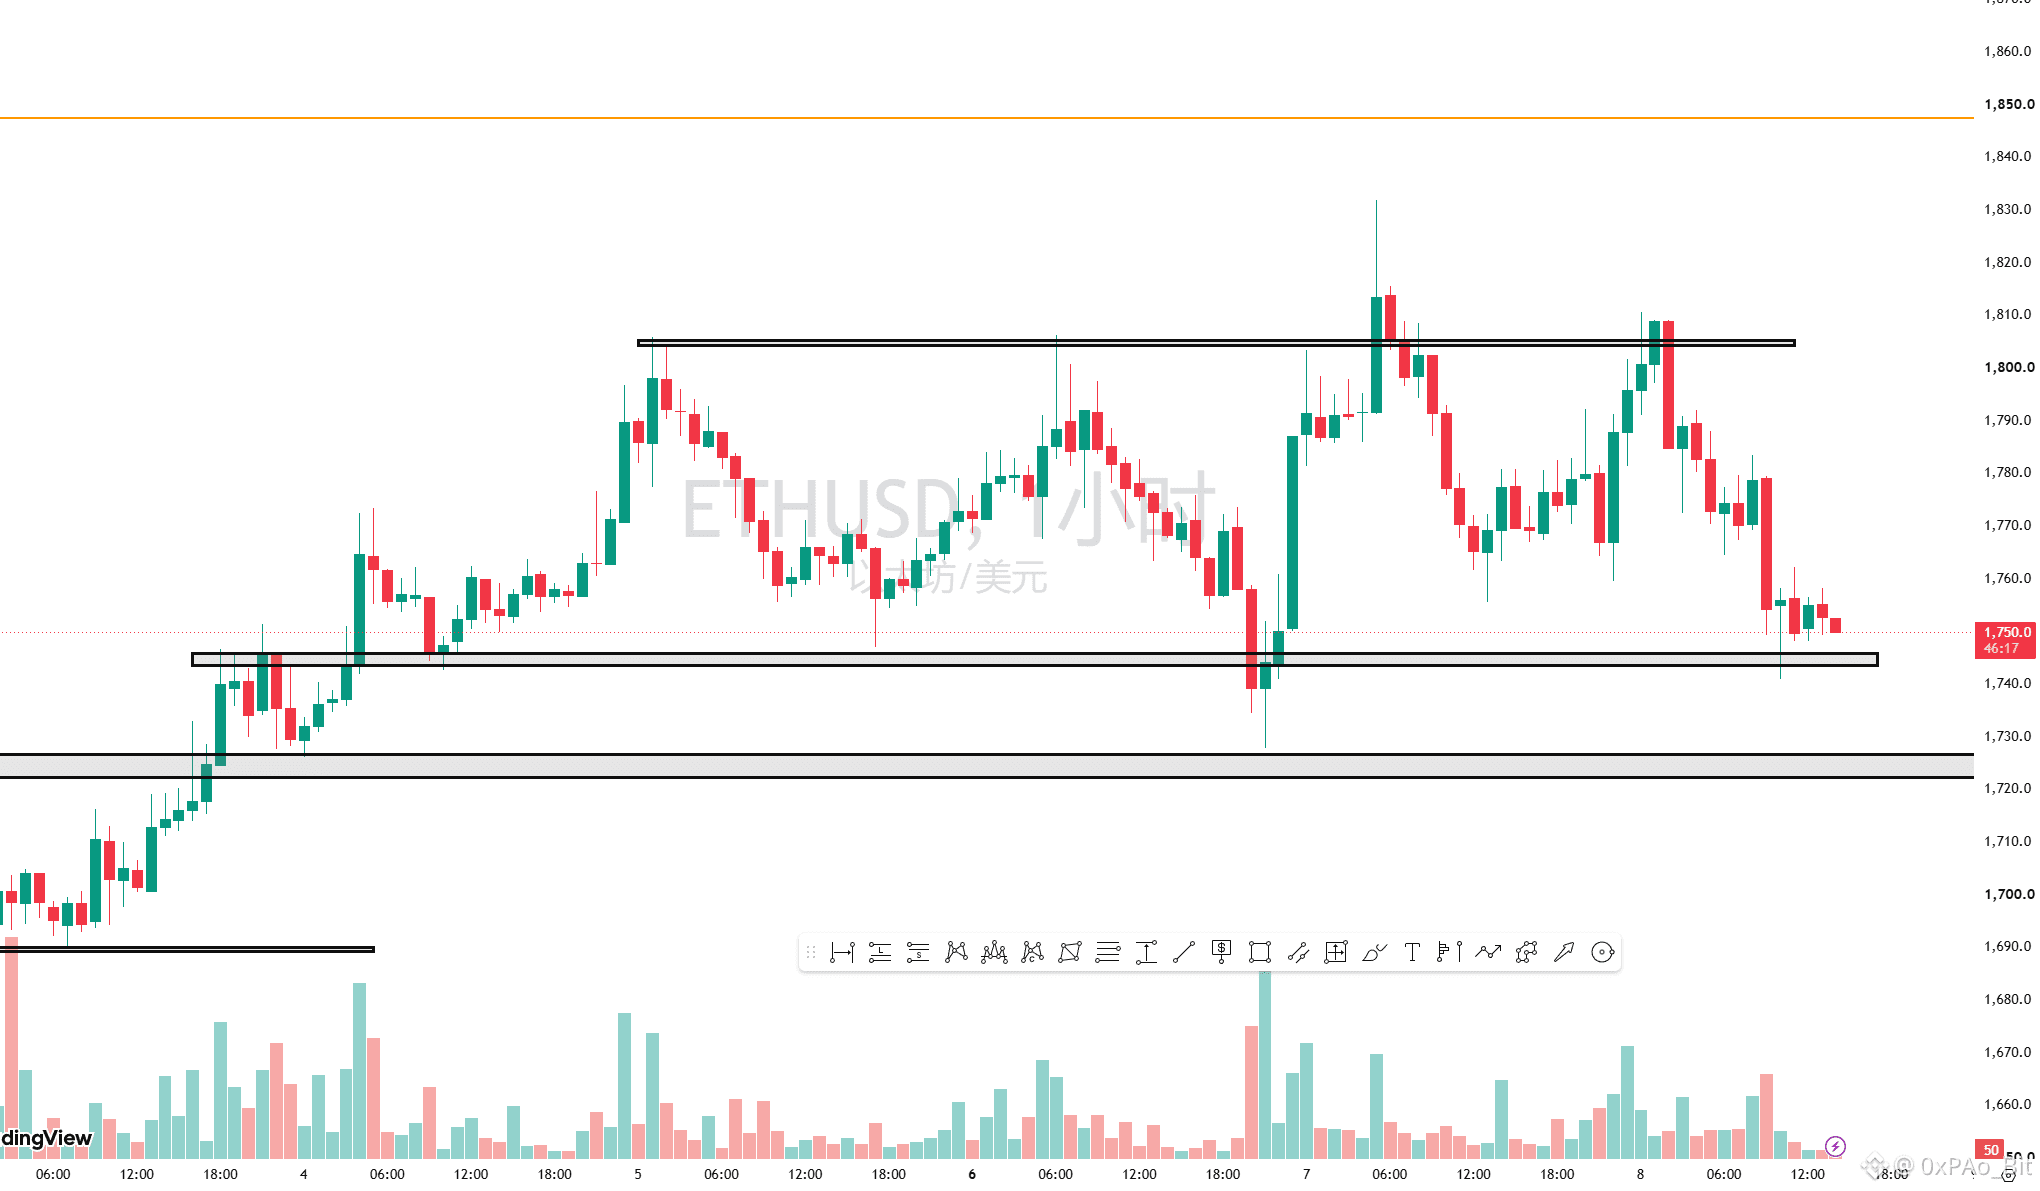
My thinking: I currently hold a short position from 1801, and added to it at 1760.
Since price has already arrived at the hour-level support zone, I’m not chasing shorts here.
If support shows a stop-the-fall signal, watch for a short-term rebound opportunity. If 1750 confirms a breakdown, then continue setting up shorts in line with the trend.
📌 Today’s core view
The market isn’t in a one-way trend right now—it’s in a structure validation phase.
In the next few hours, there’s no need to guess direction. Just watch two key levels:
✅ BTC: 62,180
✅ ETH: 1747-1750
Hold support and look for rebounds; break support and follow the trend to short.
Truly stable profits in trading don’t come from betting anywhere—you follow after the market has made its choice.
0xPAo_Bit:
The market won’t reward predictions; it rewards those who respect structure.
One-sentence summary: Bulls retest key support—breaking it confirms continuation of the downtrend. If support holds, there’s still a chance for a second push higher.
🟠 BTC
Current structure
Daily: The rebound repair structure remains intact.
4H: A pullback correction after the rise.
1H: Pullback to key support—waiting for direction selection.
Key levels
🟢 Support: 62,180-62,250
🔴 Resistance: 63,200
Trading plan for today:
Price is currently retesting the former breakout level (support/resistance flip zone).
If on the 1H chart it reclaims 62,180 and a reversal candlestick appears, short-term rebound opportunities are still worth watching.
If the 1H closes meaningfully below 62,180, the upward structure fails and bears may further test liquidity near 61,000.
My thinking:
As long as support doesn’t break, don’t chase shorts.
If support breaks, follow the move and short in trend.
🔵 ETH
Current structure
Daily: During bottom repair.
4H: First pullback within the uptrend.
1H: Testing key support.
Key levels:
🟢 Support: 1747-1750
🟠 Secondary support: 1720-1725
🔴 Resistance: 1780-1800
Trading plan for today:
1747-1750 is the support/resistance flip level after this round’s rise, and also the most important 1H structural area right now.
This is the true dividing line between bulls and bears!
If support holds effectively, there’s still a chance the market retests 1780 and even 1800 in the short term.
If the 1H closes meaningfully below 1750, the uptrend structure ends and bears may further test the 1720 area, even down toward 1680.
My thinking: I currently hold a short position from 1801, and added to it at 1760.
Since price has already arrived at the hour-level support zone, I’m not chasing shorts here.
If support shows a stop-the-fall signal, watch for a short-term rebound opportunity. If 1750 confirms a breakdown, then continue setting up shorts in line with the trend.
📌 Today’s core view
The market isn’t in a one-way trend right now—it’s in a structure validation phase.
In the next few hours, there’s no need to guess direction. Just watch two key levels:
✅ BTC: 62,180
✅ ETH: 1747-1750
Hold support and look for rebounds; break support and follow the trend to short.
Truly stable profits in trading don’t come from betting anywhere—you follow after the market has made its choice.
0xPAo_Bit:
The market won’t reward predictions; it rewards those who respect structure.
Don't chase the trades today: BTC is consolidating, and ETH is deciding on its direction
The second coin is in a descending channel, with a small structure flip appearing. Are you still holding onto your position?
💥 On June 19, here comes the market analysis for $BTC $ETH !
⚠️ Current market in a nutshell:
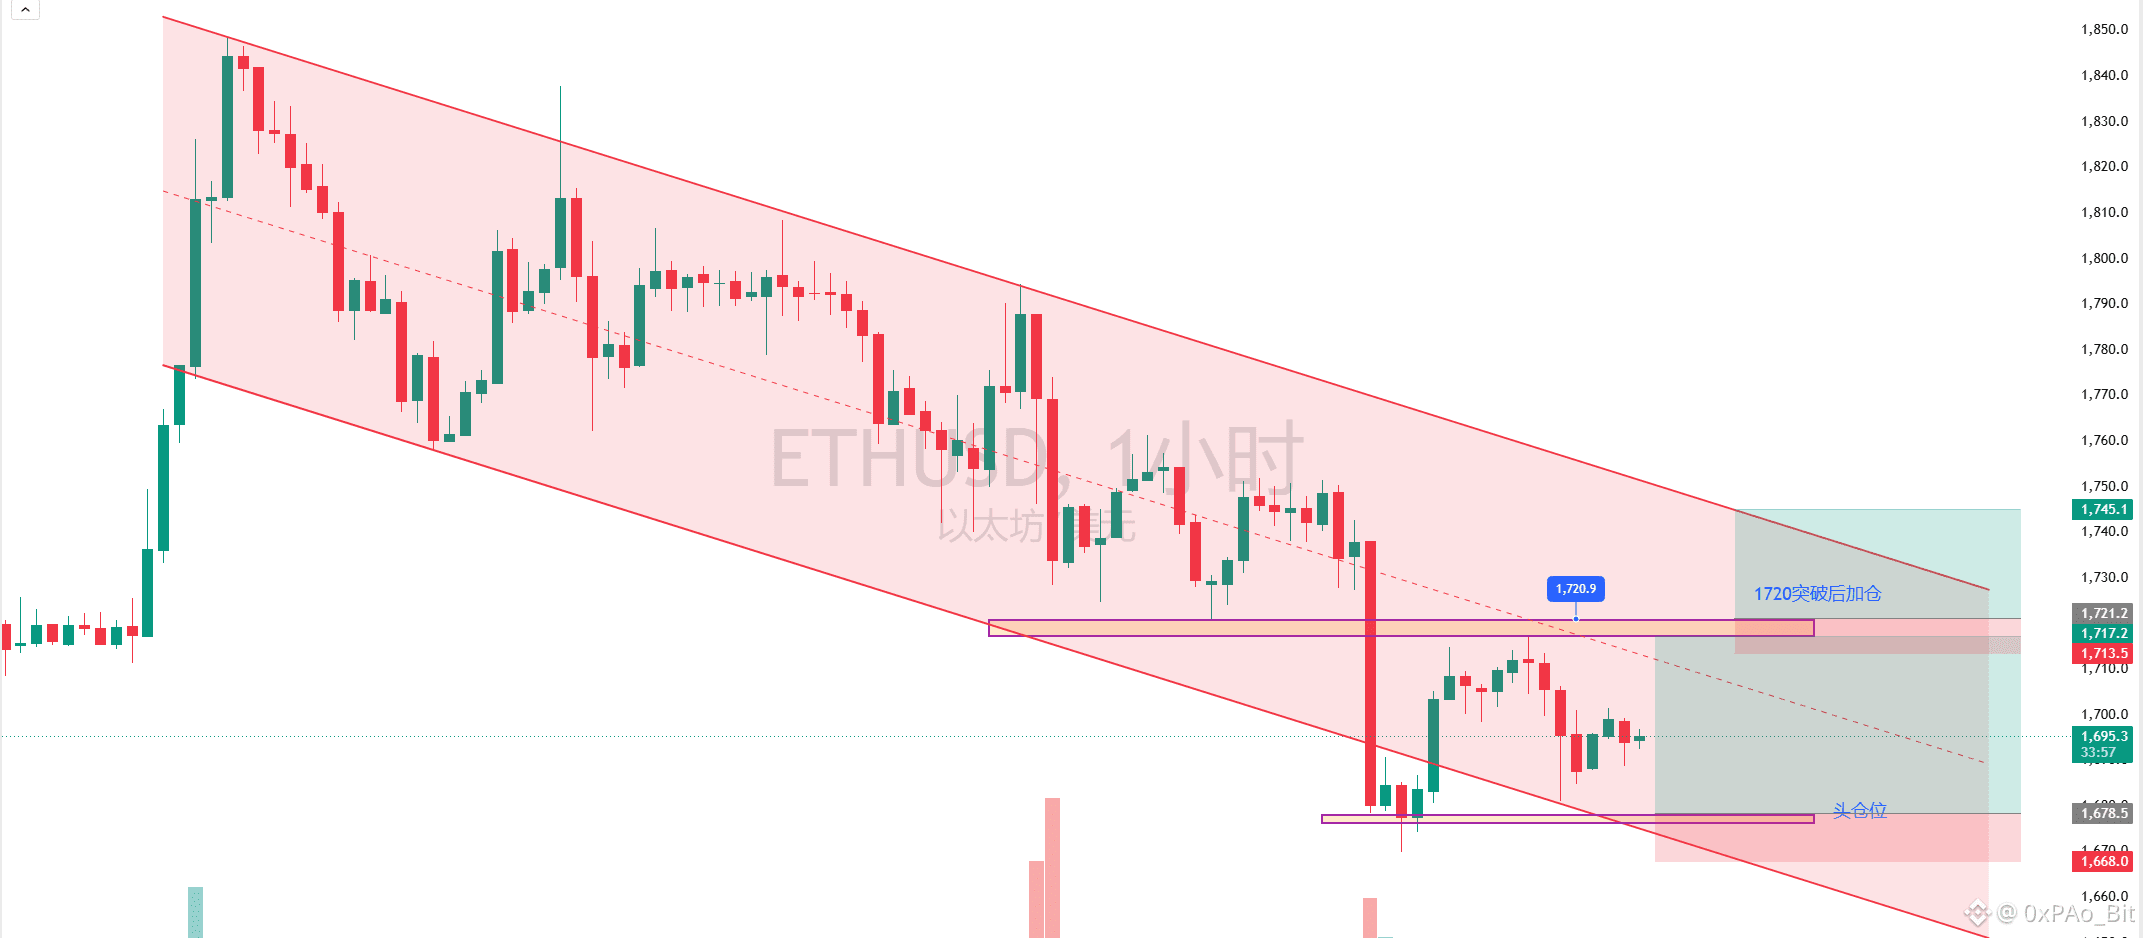
📌 BTC is in a consolidation phase, while ETH is battling at the trend line, with bulls and bears entering a "critical divergence day"
The 1720-1725 range is crucial because it's the confirmation phase after breaking the descending trend line (key decision point)
🟢 Bullish conditions:
If it retraces and doesn't break below the 1680-1700 support, re-establish above 1725+ with higher highs and higher lows
👉 Target: 1750 1780
🔴 Bearish conditions:
If it falls back below 1680, the false breakout confirms and continues the downward channel
👉 Target: 1650 1610
🎯 ETH core takeaway:
📌 This is a watershed day for "false breakouts vs true breakouts"
Now onto BTC
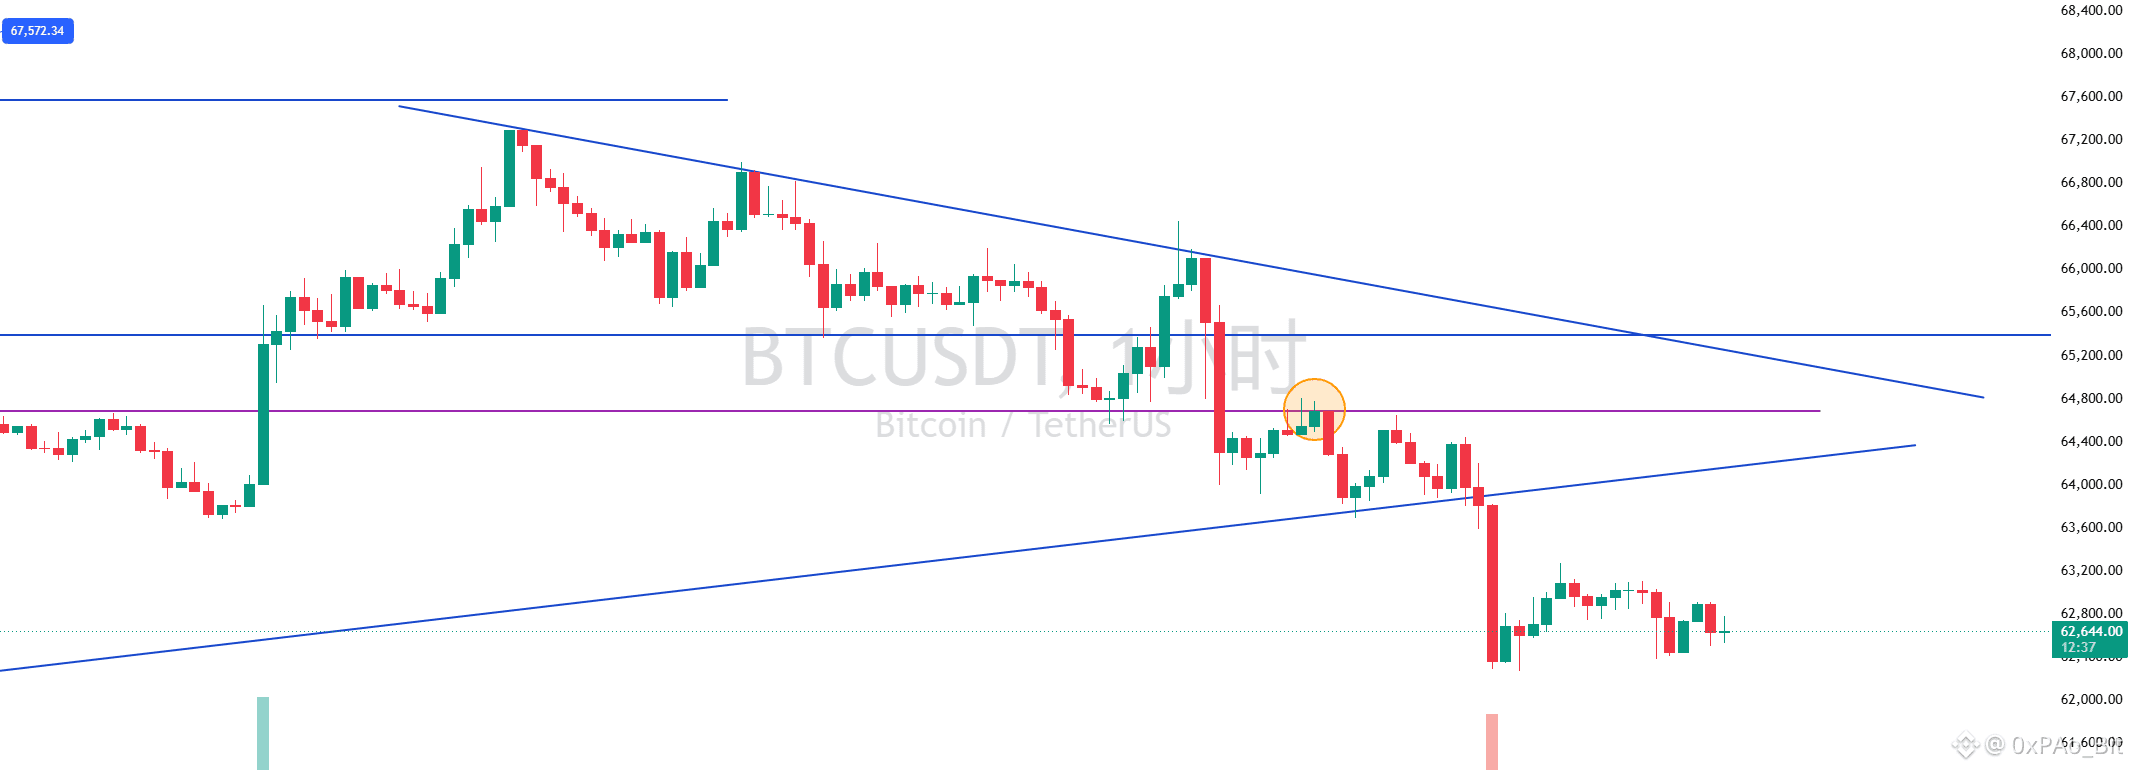
The big coin is still in a consolidation range, with significant resistance above and repeated tests of support below,
👉 Essentially: 📌 This is not a trending market, but rather a "accumulation + shakeout phase"
🎯 BTC conclusion:
📌 "Consolidation unbroken, direction undecided, waiting for a breakout confirmation"
#日内交易 #趋势分析
The second coin is in a descending channel, with a small structure flip appearing. Are you still holding onto your position?
💥 On June 19, here comes the market analysis for $BTC $ETH !
⚠️ Current market in a nutshell:
📌 BTC is in a consolidation phase, while ETH is battling at the trend line, with bulls and bears entering a "critical divergence day"
The 1720-1725 range is crucial because it's the confirmation phase after breaking the descending trend line (key decision point)
🟢 Bullish conditions:
If it retraces and doesn't break below the 1680-1700 support, re-establish above 1725+ with higher highs and higher lows
👉 Target: 1750 1780
🔴 Bearish conditions:
If it falls back below 1680, the false breakout confirms and continues the downward channel
👉 Target: 1650 1610
🎯 ETH core takeaway:
📌 This is a watershed day for "false breakouts vs true breakouts"
Now onto BTC
The big coin is still in a consolidation range, with significant resistance above and repeated tests of support below,
👉 Essentially: 📌 This is not a trending market, but rather a "accumulation + shakeout phase"
🎯 BTC conclusion:
📌 "Consolidation unbroken, direction undecided, waiting for a breakout confirmation"
#日内交易 #趋势分析
Dan, I also want to charge forward a bit.


Crypto交易员朱一旦
·
--
A Late Night Phone Call with Yan Chi
Brothers, hello everyone, I am trader Zhu Yidan. I chatted with @颜驰Bit for more than an hour last night. The main point was discussing our views on the market. We are particularly consistent in our opinion that the interest rate cut in September will not lead to a surge; instead, it will be a case of buying the rumor and selling the fact, turning a favorable situation into a bearish one.
Some traders and media are calling for 50bps, but if it ultimately turns out to be only 25bps, it will be interpreted in the short term as 'not exceeding expectations'. This discrepancy can easily trigger arbitrage and short-term profit-taking, which often leads to a short-term pullback for BTC/ETF due to this 'news realization'.
Some traders and media are calling for 50bps, but if it ultimately turns out to be only 25bps, it will be interpreted in the short term as 'not exceeding expectations'. This discrepancy can easily trigger arbitrage and short-term profit-taking, which often leads to a short-term pullback for BTC/ETF due to this 'news realization'.

Remember not to follow the order!
0xPAo_Bit
·
--
"The Master of Fraud Detection Day 3"
Today's teacher has switched from long to short
Ultimate narrow stop loss
I've found that being a connector in this group is really fun hhhhh
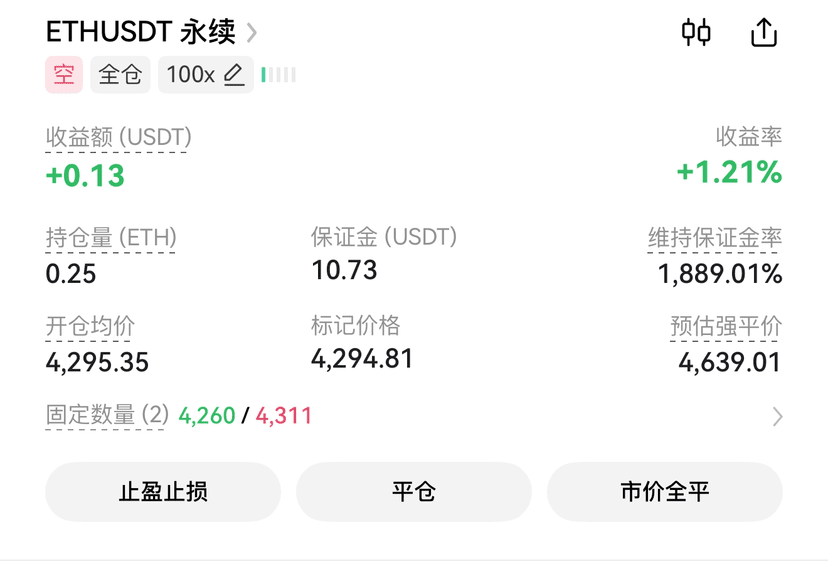
After watching for a few days, this teacher's trading system is truly "profound and inscrutable" #ETH #BTC $ETH
Today's teacher has switched from long to short
Ultimate narrow stop loss
I've found that being a connector in this group is really fun hhhhh
After watching for a few days, this teacher's trading system is truly "profound and inscrutable" #ETH #BTC $ETH

Log in to explore more content