
Jaguemo27
192 Posts

Jaguemo27
Report
Block User
Open Trade
High-Frequency Trader
5.2 Years
208 Following
113 Followers
97 Liked
Posts
Portfolio
All
Quotes
·
--
*Heads up, community. Don't let yourselves be fooled.*
There are people recommending that you open a Short or Long position without analysis, levels, an SL, or any rationale.
They're not doing it to help. They're doing it because they're stuck and need you to enter a position in their favor so they can get out. Or because they profit when you lose.
They tell you "get in now" even though it goes against the trend and what the chart is showing.
It happened to me at first. I followed someone else into a trade and lost. Then I understood.
*Don't copy anyone else's trades.* Analyze, research, and educate yourselves, just as I did, because otherwise you'll lose by blindly following what other people tell you. Check the trend, EMAs, RSI, support, resistance, and your SL.
If someone recommends that you enter a trade but doesn't show you their analysis, don't trust them.
And if you need advice, help, or want to make a better decision, I'm happy to help. Ask me. Good night to everyone in my lovely community #BinanceSquareTips
Your money is your responsibility.
#BinanceSquare #BTC #AKE
*Heads up, community. Don't let yourselves be fooled.*
There are people recommending that you open a Short or Long position without analysis, levels, an SL, or any rationale.
They're not doing it to help. They're doing it because they're stuck and need you to enter a position in their favor so they can get out. Or because they profit when you lose.
They tell you "get in now" even though it goes against the trend and what the chart is showing.
It happened to me at first. I followed someone else into a trade and lost. Then I understood.
*Don't copy anyone else's trades.* Analyze, research, and educate yourselves, just as I did, because otherwise you'll lose by blindly following what other people tell you. Check the trend, EMAs, RSI, support, resistance, and your SL.
If someone recommends that you enter a trade but doesn't show you their analysis, don't trust them.
And if you need advice, help, or want to make a better decision, I'm happy to help. Ask me. Good night to everyone in my lovely community #BinanceSquareTips
Your money is your responsibility.
#BinanceSquare #BTC #AKE
There are people recommending that you open a Short or Long position without analysis, levels, an SL, or any rationale.
They're not doing it to help. They're doing it because they're stuck and need you to enter a position in their favor so they can get out. Or because they profit when you lose.
They tell you "get in now" even though it goes against the trend and what the chart is showing.
It happened to me at first. I followed someone else into a trade and lost. Then I understood.
*Don't copy anyone else's trades.* Analyze, research, and educate yourselves, just as I did, because otherwise you'll lose by blindly following what other people tell you. Check the trend, EMAs, RSI, support, resistance, and your SL.
If someone recommends that you enter a trade but doesn't show you their analysis, don't trust them.
And if you need advice, help, or want to make a better decision, I'm happy to help. Ask me. Good night to everyone in my lovely community #BinanceSquareTips
Your money is your responsibility.
#BinanceSquare #BTC #AKE
27
·
--
$XRP
*Title:* $XRP holding above $0.89. Is a test of $0.98 coming?
*Body:*
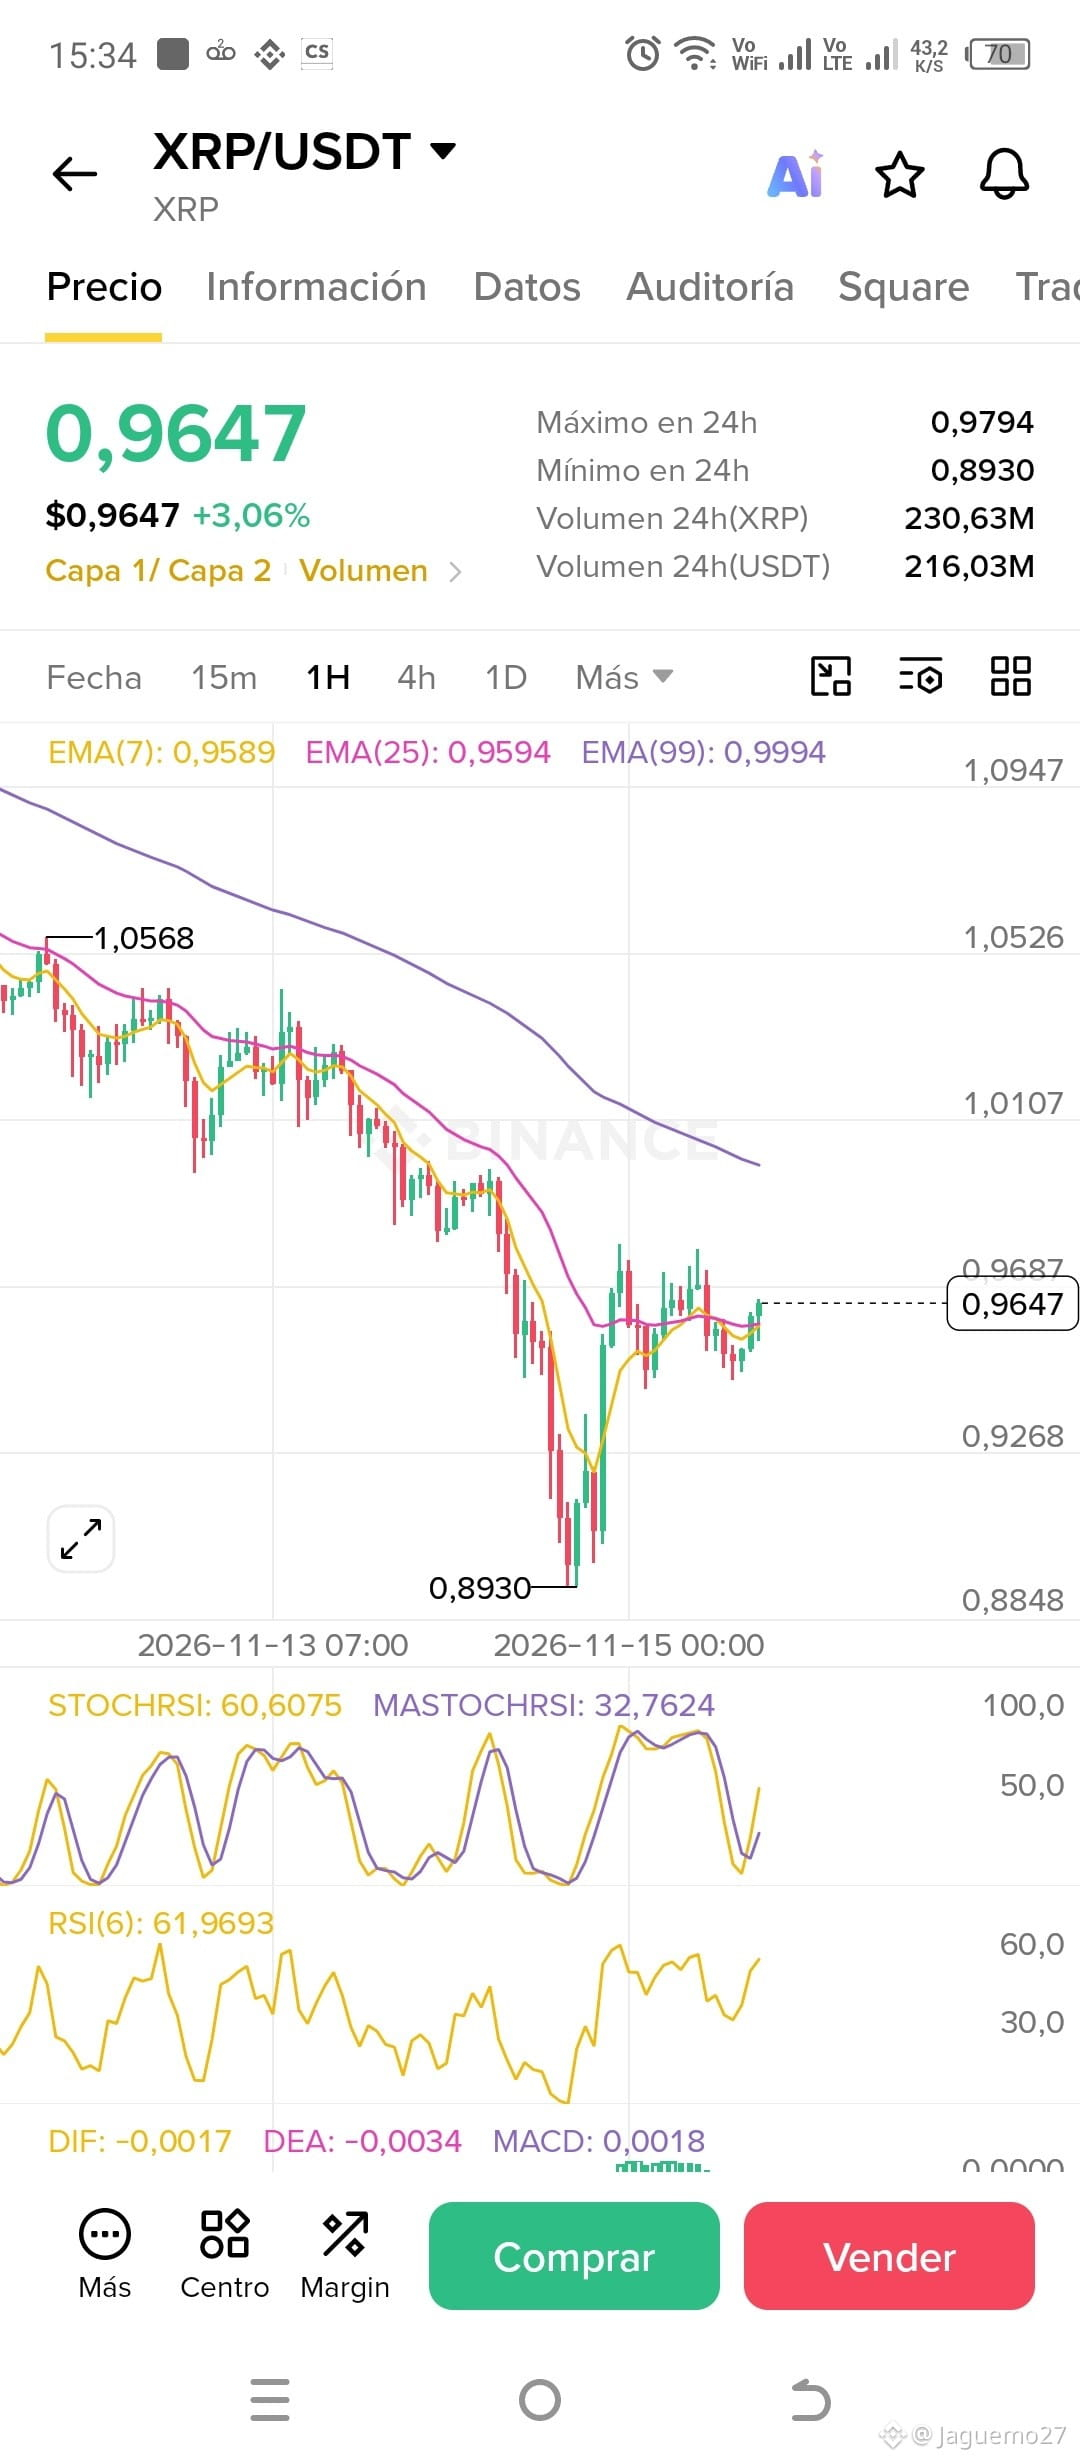
XRP at $0.9640, up 3%. After hitting a 24-hour low of $0.8930, it has held above $0.94 for more than 12 hours.
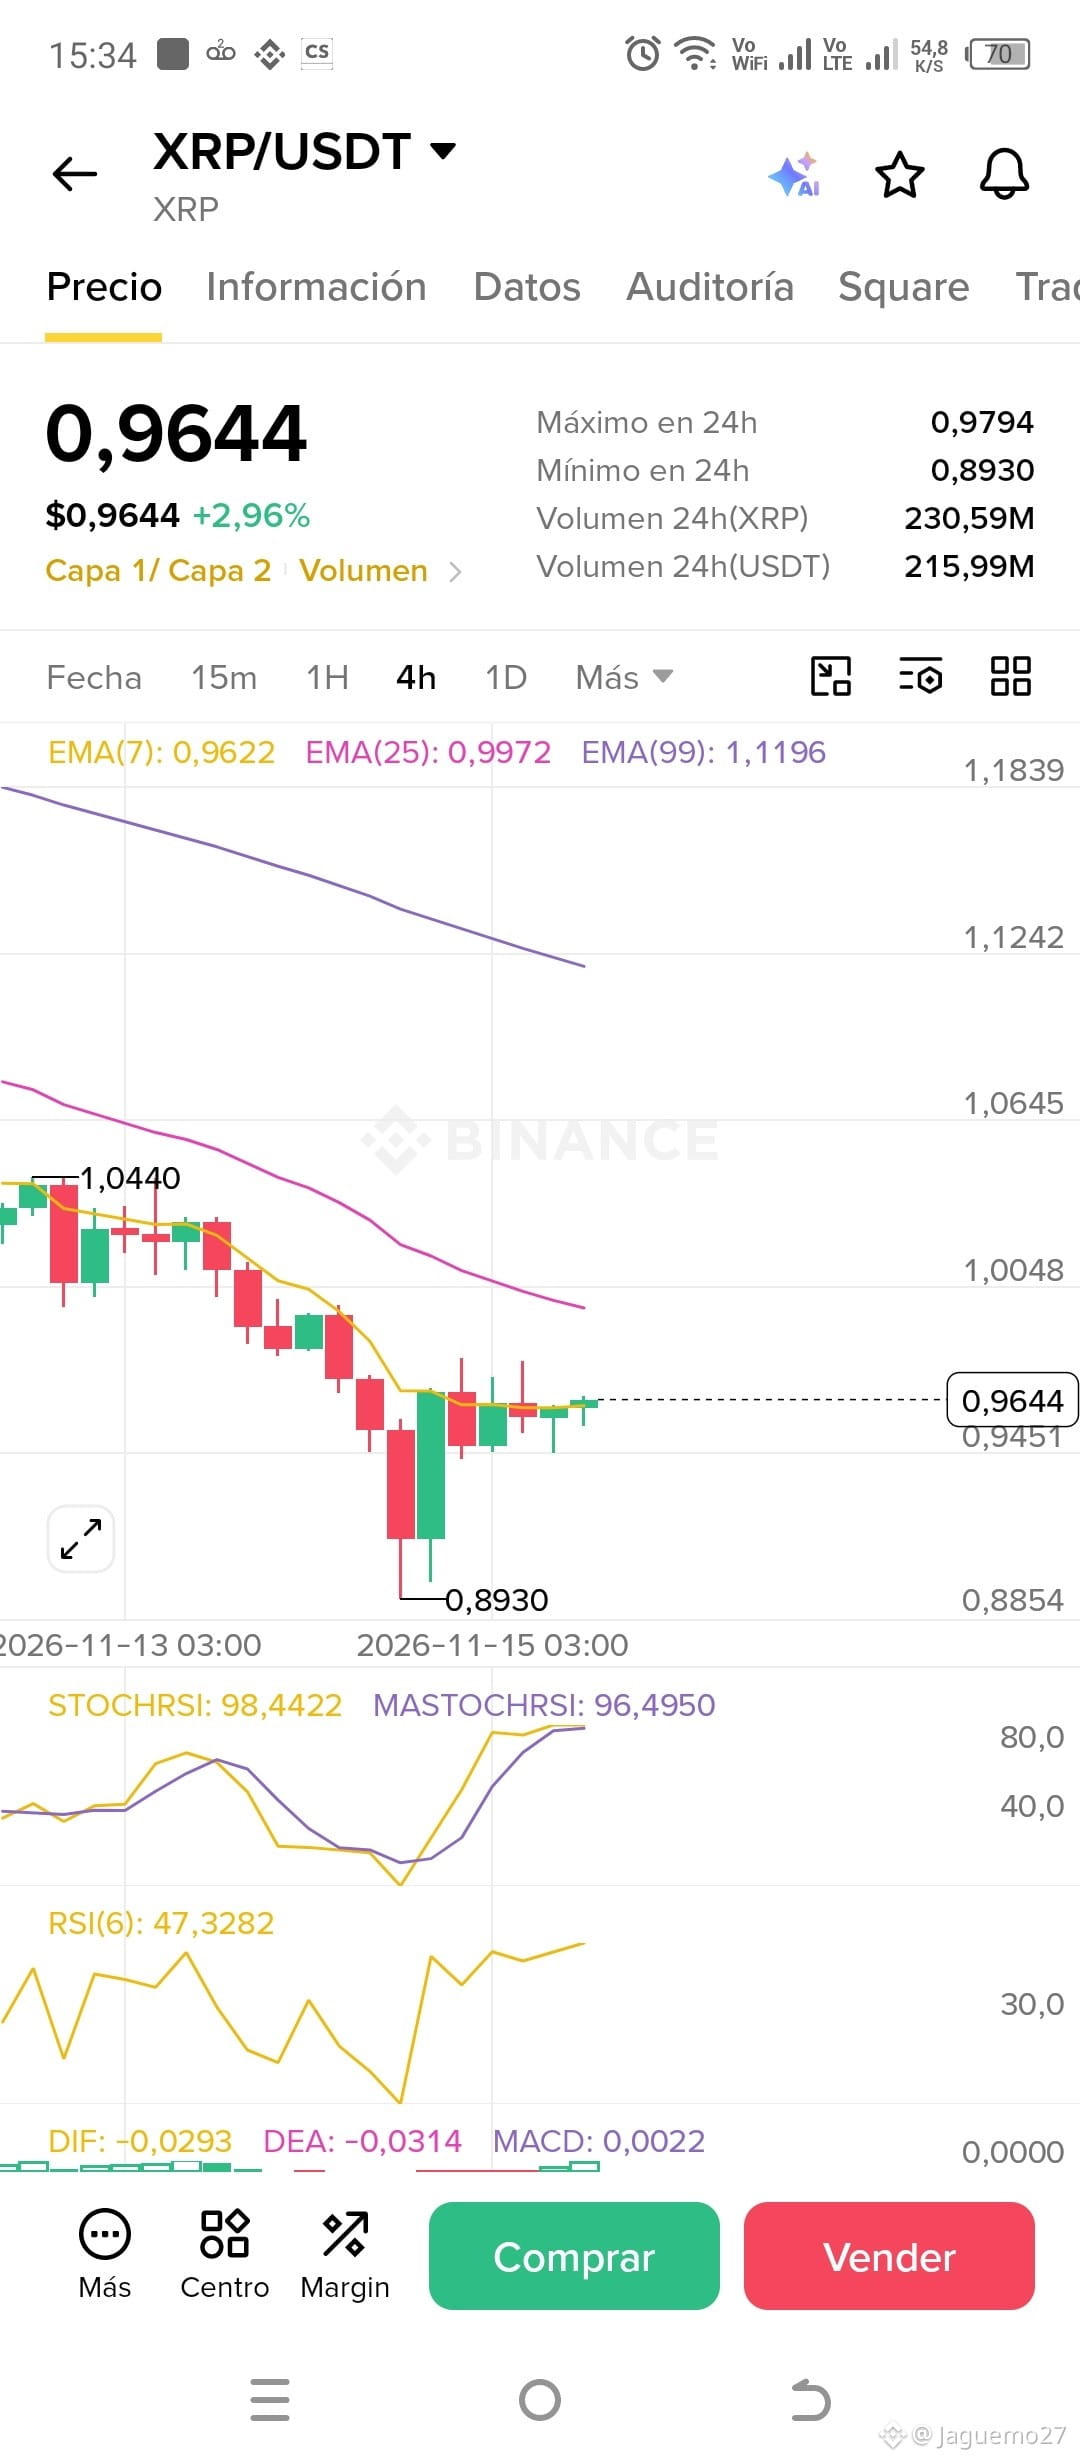
On the 1H and 15m charts, it's now above the EMA 7, 25, and 99. MACD is positive and RSI is at 62. On the 4H chart, it's still bearish, so this is a breather, not a confirmed reversal.
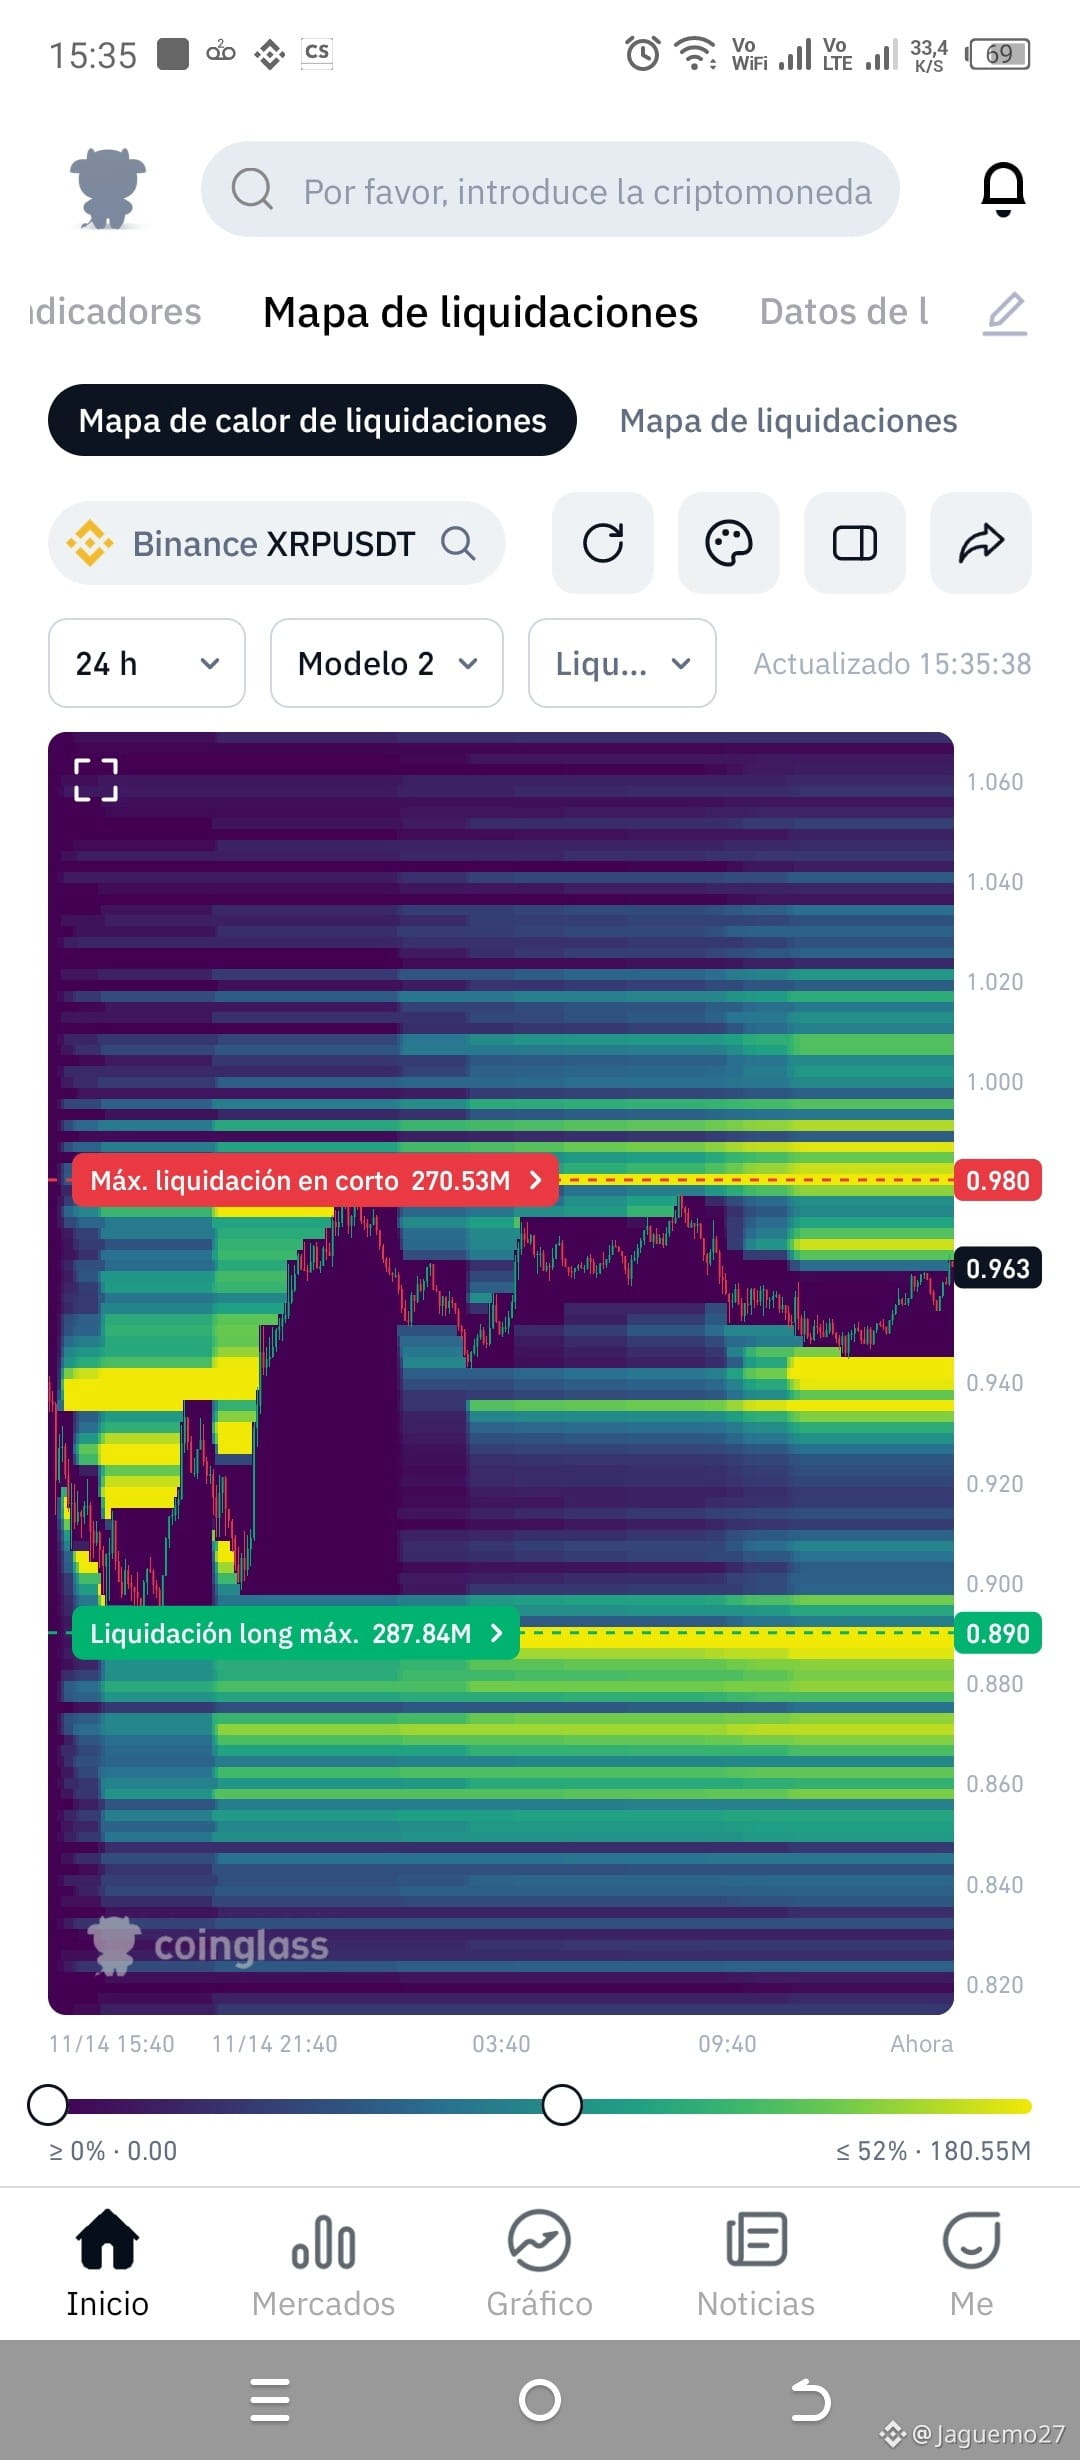
The key is in Coinglass's liquidation map:
Largest short liquidation: $270M at $0.98
Largest long liquidation: $287M at $0.89
Price is right by the magnet above. If it breaks $0.98, shorts will be liquidated and it could head for $1.00. If it loses $0.89, it could drop to $0.86.
This isn't the time to go crazy with leverage. It's time for Grid and to protect your capital. Whoever held on like that 50X BTC guy is $60,000 away from being liquidated.
What do you think: will it break $0.98 or go back to $0.89?
#XRP #BTC #BinanceSquare
---
$XRP
*Title:* $XRP holding above $0.89. Is a test of $0.98 coming?
*Body:*
XRP at $0.9640, up 3%. After hitting a 24-hour low of $0.8930, it has held above $0.94 for more than 12 hours.
On the 1H and 15m charts, it's now above the EMA 7, 25, and 99. MACD is positive and RSI is at 62. On the 4H chart, it's still bearish, so this is a breather, not a confirmed reversal.
The key is in Coinglass's liquidation map:
Largest short liquidation: $270M at $0.98
Largest long liquidation: $287M at $0.89
Price is right by the magnet above. If it breaks $0.98, shorts will be liquidated and it could head for $1.00. If it loses $0.89, it could drop to $0.86.
This isn't the time to go crazy with leverage. It's time for Grid and to protect your capital. Whoever held on like that 50X BTC guy is $60,000 away from being liquidated.
What do you think: will it break $0.98 or go back to $0.89?
#XRP #BTC #BinanceSquare
---
*Title:* $XRP holding above $0.89. Is a test of $0.98 coming?
*Body:*
XRP at $0.9640, up 3%. After hitting a 24-hour low of $0.8930, it has held above $0.94 for more than 12 hours.
On the 1H and 15m charts, it's now above the EMA 7, 25, and 99. MACD is positive and RSI is at 62. On the 4H chart, it's still bearish, so this is a breather, not a confirmed reversal.
The key is in Coinglass's liquidation map:
Largest short liquidation: $270M at $0.98
Largest long liquidation: $287M at $0.89
Price is right by the magnet above. If it breaks $0.98, shorts will be liquidated and it could head for $1.00. If it loses $0.89, it could drop to $0.86.
This isn't the time to go crazy with leverage. It's time for Grid and to protect your capital. Whoever held on like that 50X BTC guy is $60,000 away from being liquidated.
What do you think: will it break $0.98 or go back to $0.89?
#XRP #BTC #BinanceSquare
---
118
·
--
$LAB ---
*🐻 LAB / USDT - $0.03203 -5.77% - BIAS BEARISH*
LAB is coming from $0.04818, it has already dropped -33.5% to $0.03203.
It is below EMA99 in 15m, 1H and 4H. Downtrend confirmed.
MACD 4H: -0.00028 in red. RSI 4H: 28.44 in oversold, but without trend reversal.
Key data: Main traders are closing longs, ratio fell from 5.07 to 3.63. Open interest is rising, but with less money. Retail is entering, whales are leaving.
Levels:
Resistance: $0.03463 - $0.03608
Support: $0.02966 - $0.02870
Plan: NO long now. Wait for a break of $0.03463 or a bounce at $0.02966.
Liquidation map: Shorts at $0.0410, Longs at $0.0287. Price in the middle.
In oversold, you don't buy; you wait for confirmation.
Not financial advice.
#LAB #BinanceSquare #CryptoColombia
---
$LAB ---
*🐻 LAB / USDT - $0.03203 -5.77% - BIAS BEARISH*
LAB is coming from $0.04818, it has already dropped -33.5% to $0.03203.
It is below EMA99 in 15m, 1H and 4H. Downtrend confirmed.
MACD 4H: -0.00028 in red. RSI 4H: 28.44 in oversold, but without trend reversal.
Key data: Main traders are closing longs, ratio fell from 5.07 to 3.63. Open interest is rising, but with less money. Retail is entering, whales are leaving.
Levels:
Resistance: $0.03463 - $0.03608
Support: $0.02966 - $0.02870
Plan: NO long now. Wait for a break of $0.03463 or a bounce at $0.02966.
Liquidation map: Shorts at $0.0410, Longs at $0.0287. Price in the middle.
In oversold, you don't buy; you wait for confirmation.
Not financial advice.
#LAB #BinanceSquare #CryptoColombia
---
*🐻 LAB / USDT - $0.03203 -5.77% - BIAS BEARISH*
LAB is coming from $0.04818, it has already dropped -33.5% to $0.03203.
It is below EMA99 in 15m, 1H and 4H. Downtrend confirmed.
MACD 4H: -0.00028 in red. RSI 4H: 28.44 in oversold, but without trend reversal.
Key data: Main traders are closing longs, ratio fell from 5.07 to 3.63. Open interest is rising, but with less money. Retail is entering, whales are leaving.
Levels:
Resistance: $0.03463 - $0.03608
Support: $0.02966 - $0.02870
Plan: NO long now. Wait for a break of $0.03463 or a bounce at $0.02966.
Liquidation map: Shorts at $0.0410, Longs at $0.0287. Price in the middle.
In oversold, you don't buy; you wait for confirmation.
Not financial advice.
#LAB #BinanceSquare #CryptoColombia
---
1
380
·
--
*🚨 BTC ALERT - BEARISH*
$BTC en $65,380 after touching $62,080, a 4-month low. Extreme Fear 10/100.
*Why is it falling?*
1. The Fed will raise rates in December, with an 88.5% probability. Inflation is 0.4% and employment is strong.
2. BTC ETFs are bleeding: -$1.07B this week, -$2.35B in 2 weeks.
3. Liquidations: $2.06B in 24h, 93% were Longs.
*What should I do?*
Don’t go Long recklessly. Bearish bias until the Fed speaks Monday at 8 PM and the minutes come out Wednesday.
If BTC bounces to $65,380–$67,523, then consider going Short.
In Extreme Fear, don’t chase; wait.
#BTC #Fed #Crypto
*🚨 BTC ALERT - BEARISH*
$BTC en $65,380 after touching $62,080, a 4-month low. Extreme Fear 10/100.
*Why is it falling?*
1. The Fed will raise rates in December, with an 88.5% probability. Inflation is 0.4% and employment is strong.
2. BTC ETFs are bleeding: -$1.07B this week, -$2.35B in 2 weeks.
3. Liquidations: $2.06B in 24h, 93% were Longs.
*What should I do?*
Don’t go Long recklessly. Bearish bias until the Fed speaks Monday at 8 PM and the minutes come out Wednesday.
If BTC bounces to $65,380–$67,523, then consider going Short.
In Extreme Fear, don’t chase; wait.
#BTC #Fed #Crypto
$BTC en $65,380 after touching $62,080, a 4-month low. Extreme Fear 10/100.
*Why is it falling?*
1. The Fed will raise rates in December, with an 88.5% probability. Inflation is 0.4% and employment is strong.
2. BTC ETFs are bleeding: -$1.07B this week, -$2.35B in 2 weeks.
3. Liquidations: $2.06B in 24h, 93% were Longs.
*What should I do?*
Don’t go Long recklessly. Bearish bias until the Fed speaks Monday at 8 PM and the minutes come out Wednesday.
If BTC bounces to $65,380–$67,523, then consider going Short.
In Extreme Fear, don’t chase; wait.
#BTC #Fed #Crypto
109
·
--
$AKE *🐻 AKE / USDT - LOST MOMENTUM - 4H ANALYSIS*
*Nov 15, 2026 - 9:12 AM COL*
*Current price: $0.010677 -11.69%*
AKE rose +865% from $0.00187 to $0.01811 in 2 days. The party is over. It's now -41% from its high.
*Why is it no longer rising?*
*1. MACD is negative on the 4H chart*
DIF: 0.0018789
DEA: 0.0019826
MACD: -0.0001037
DIF crossed below DEA. Bearish crossover confirmed. Buyers have run out of steam.
*2. Momentum is dead*
StochRSI: 22.61, falling from 90. No bounce.
RSI(6): 50.27. It still has room to fall to 30.
*3. Volume drying up*
Vol: 2.82B, compared to an average of 5.89B. No volume, no rally.
*Key levels:*
Resistance: $0.01120 - $0.01208 - $0.01300
Support: $0.00930 (EMA 99) - $0.00840 - $0.00473
*My plan:*
NO LONG. Don't catch a falling knife.
SHORT only if it bounces to $0.01120 - $0.01208
SL: $0.01300
TP1: $0.00930
TP2: $0.00840
Leverage: 3x maximum. AKE is volatile.
If it doesn't bounce, don't enter. Let it fall.
*Conclusion:* AKE formed a double top and gave back all its gains. Bearish bias on the 4H chart.
This is not financial advice. Manage your risk.
#AKE #BinanceSquare #CryptoColombia
$AKE *🐻 AKE / USDT - LOST MOMENTUM - 4H ANALYSIS*
*Nov 15, 2026 - 9:12 AM COL*
*Current price: $0.010677 -11.69%*
AKE rose +865% from $0.00187 to $0.01811 in 2 days. The party is over. It's now -41% from its high.
*Why is it no longer rising?*
*1. MACD is negative on the 4H chart*
DIF: 0.0018789
DEA: 0.0019826
MACD: -0.0001037
DIF crossed below DEA. Bearish crossover confirmed. Buyers have run out of steam.
*2. Momentum is dead*
StochRSI: 22.61, falling from 90. No bounce.
RSI(6): 50.27. It still has room to fall to 30.
*3. Volume drying up*
Vol: 2.82B, compared to an average of 5.89B. No volume, no rally.
*Key levels:*
Resistance: $0.01120 - $0.01208 - $0.01300
Support: $0.00930 (EMA 99) - $0.00840 - $0.00473
*My plan:*
NO LONG. Don't catch a falling knife.
SHORT only if it bounces to $0.01120 - $0.01208
SL: $0.01300
TP1: $0.00930
TP2: $0.00840
Leverage: 3x maximum. AKE is volatile.
If it doesn't bounce, don't enter. Let it fall.
*Conclusion:* AKE formed a double top and gave back all its gains. Bearish bias on the 4H chart.
This is not financial advice. Manage your risk.
#AKE #BinanceSquare #CryptoColombia
*Nov 15, 2026 - 9:12 AM COL*
*Current price: $0.010677 -11.69%*
AKE rose +865% from $0.00187 to $0.01811 in 2 days. The party is over. It's now -41% from its high.
*Why is it no longer rising?*
*1. MACD is negative on the 4H chart*
DIF: 0.0018789
DEA: 0.0019826
MACD: -0.0001037
DIF crossed below DEA. Bearish crossover confirmed. Buyers have run out of steam.
*2. Momentum is dead*
StochRSI: 22.61, falling from 90. No bounce.
RSI(6): 50.27. It still has room to fall to 30.
*3. Volume drying up*
Vol: 2.82B, compared to an average of 5.89B. No volume, no rally.
*Key levels:*
Resistance: $0.01120 - $0.01208 - $0.01300
Support: $0.00930 (EMA 99) - $0.00840 - $0.00473
*My plan:*
NO LONG. Don't catch a falling knife.
SHORT only if it bounces to $0.01120 - $0.01208
SL: $0.01300
TP1: $0.00930
TP2: $0.00840
Leverage: 3x maximum. AKE is volatile.
If it doesn't bounce, don't enter. Let it fall.
*Conclusion:* AKE formed a double top and gave back all its gains. Bearish bias on the 4H chart.
This is not financial advice. Manage your risk.
#AKE #BinanceSquare #CryptoColombia
330
·
--
$REZ 🦈LONG FROM THE BOTTOM - LIQUIDATION HUNT
> #REZUSDT #REZ #Renzo
>
> Current price: $0.002886 (-7.23% 24h)
> Low: $0.002741
>
> 🔍 MY ANALYSIS:
> REZ is -99% from its ATH ($0.278). I am NOT expecting new highs; this is a technical bounce trade.
>
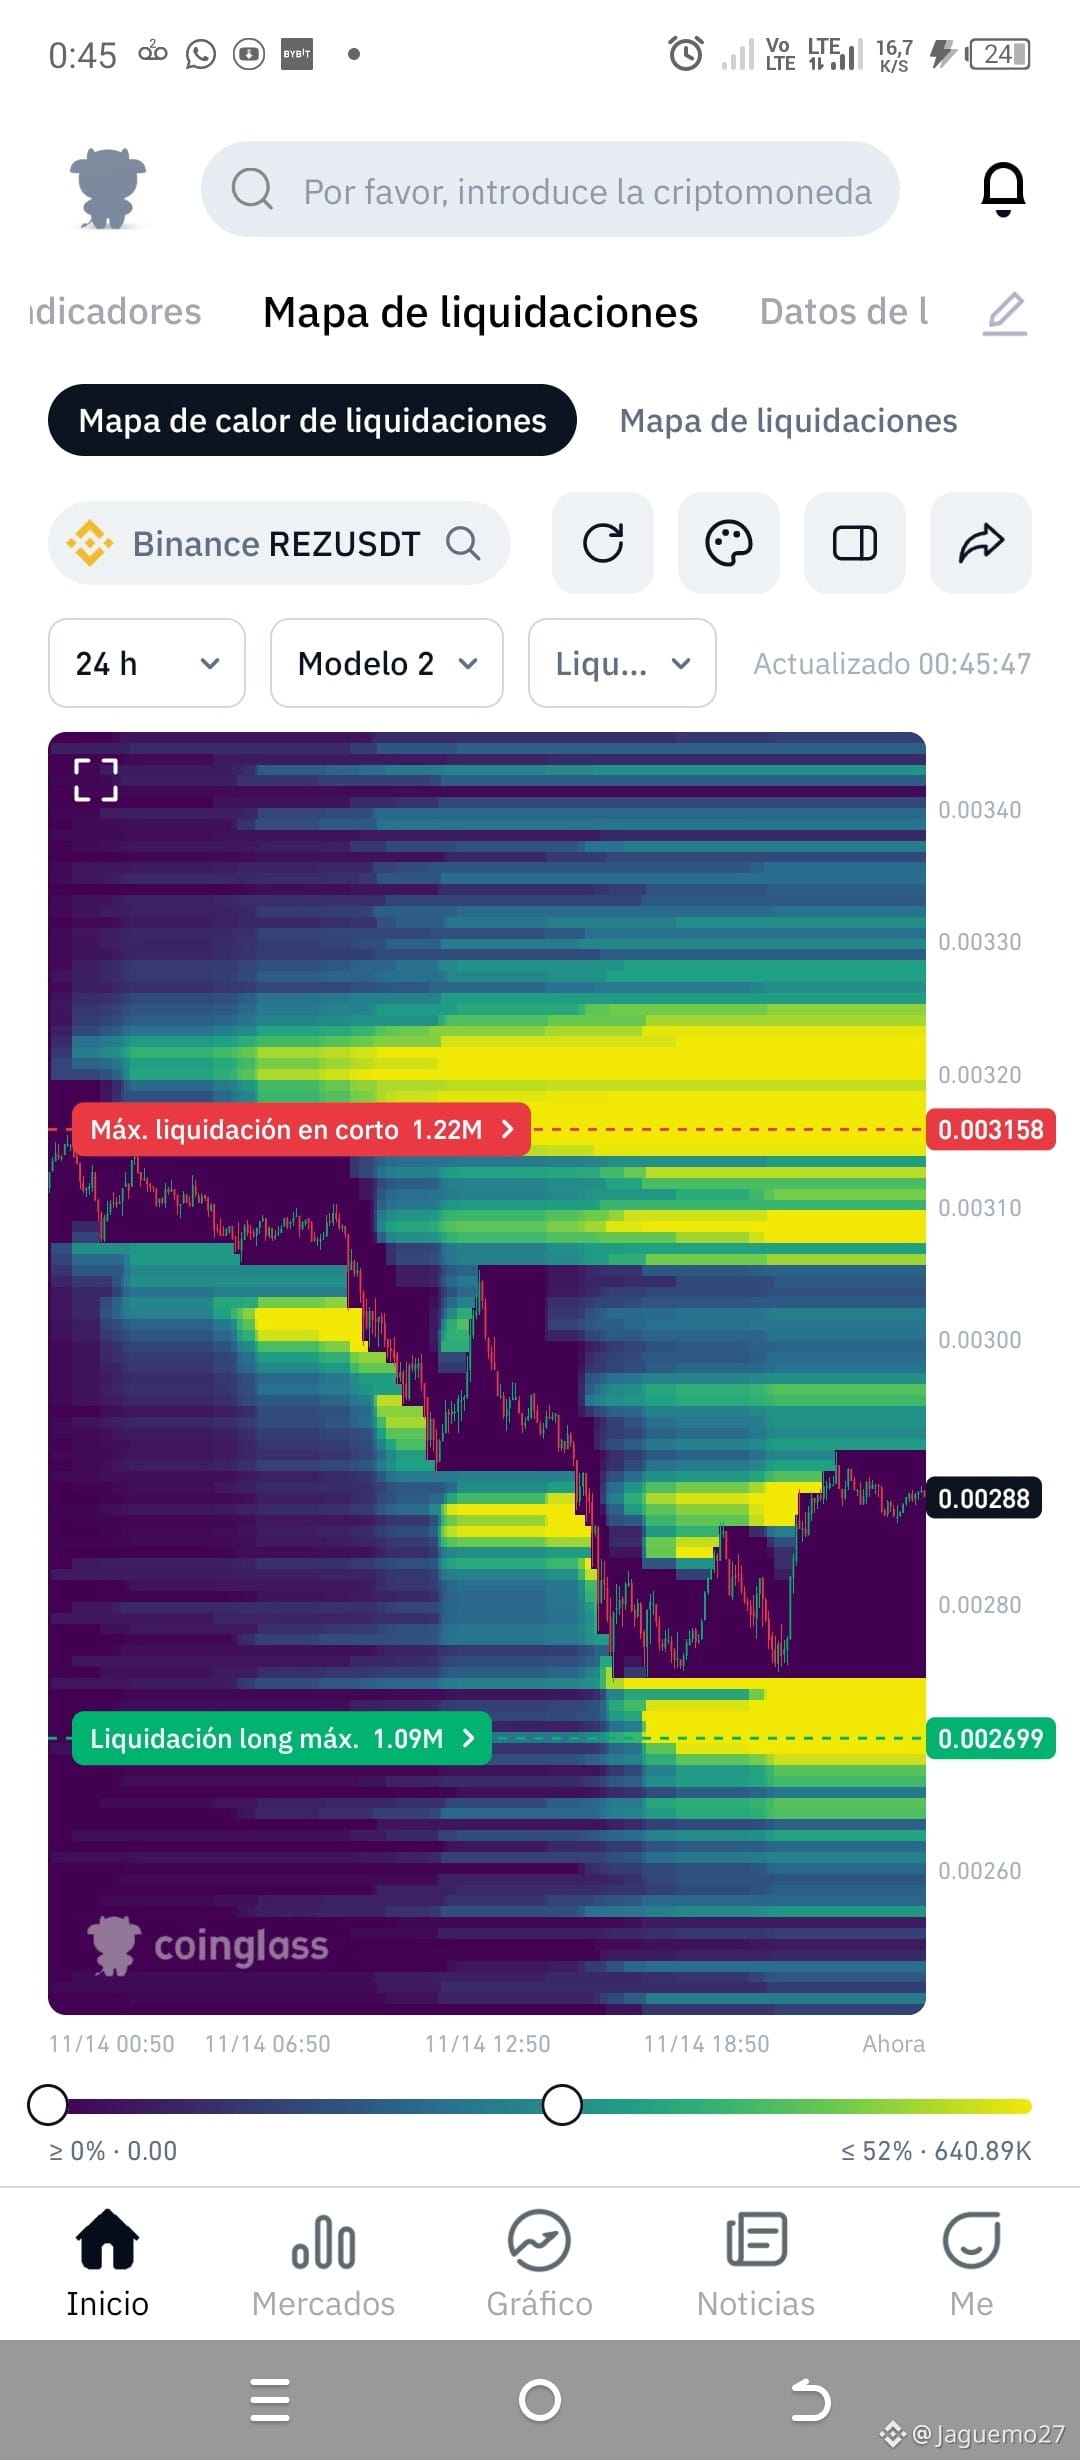
> On the 4H chart, RSI reached 17.7 (extreme oversold) and bounced. The liquidation map shows 1.22M in short liquidations at $0.003158. Price loves to seek out that liquidity.
>
> 📈 PLAN:
> Entry: $0.00272 - $0.00282
> SL: $0.00265 (below the floor)
> TP1: $0.00315 (short liquidations)
> TP2: $0.00328 (EMA99 1H)
> TP3: $0.00370 (EMA99 4H)
>
> Leverage: 3x-5x Isolated. Risk management first.
>
> ⚠️ Fundamentals: Renzo is a real Liquid Restaking project on EigenLayer, with $855M TVL in ezETH and a Binance Launchpool. But REZ is governance-only and generates no direct revenue. That's why I'm not aiming for an ATH; I'm looking for a bounce.
>
> Do you think it will climb to $0.00315, or sweep the longs at $0.00269 first? 👇
> #Crypto #BinanceSquare #Trading
$REZ 🦈LONG FROM THE BOTTOM - LIQUIDATION HUNT
> #REZUSDT #REZ #Renzo
>
> Current price: $0.002886 (-7.23% 24h)
> Low: $0.002741
>
> 🔍 MY ANALYSIS:
> REZ is -99% from its ATH ($0.278). I am NOT expecting new highs; this is a technical bounce trade.
>
> On the 4H chart, RSI reached 17.7 (extreme oversold) and bounced. The liquidation map shows 1.22M in short liquidations at $0.003158. Price loves to seek out that liquidity.
>
> 📈 PLAN:
> Entry: $0.00272 - $0.00282
> SL: $0.00265 (below the floor)
> TP1: $0.00315 (short liquidations)
> TP2: $0.00328 (EMA99 1H)
> TP3: $0.00370 (EMA99 4H)
>
> Leverage: 3x-5x Isolated. Risk management first.
>
> ⚠️ Fundamentals: Renzo is a real Liquid Restaking project on EigenLayer, with $855M TVL in ezETH and a Binance Launchpool. But REZ is governance-only and generates no direct revenue. That's why I'm not aiming for an ATH; I'm looking for a bounce.
>
> Do you think it will climb to $0.00315, or sweep the longs at $0.00269 first? 👇
> #Crypto #BinanceSquare #Trading
> #REZUSDT #REZ #Renzo
>
> Current price: $0.002886 (-7.23% 24h)
> Low: $0.002741
>
> 🔍 MY ANALYSIS:
> REZ is -99% from its ATH ($0.278). I am NOT expecting new highs; this is a technical bounce trade.
>
> On the 4H chart, RSI reached 17.7 (extreme oversold) and bounced. The liquidation map shows 1.22M in short liquidations at $0.003158. Price loves to seek out that liquidity.
>
> 📈 PLAN:
> Entry: $0.00272 - $0.00282
> SL: $0.00265 (below the floor)
> TP1: $0.00315 (short liquidations)
> TP2: $0.00328 (EMA99 1H)
> TP3: $0.00370 (EMA99 4H)
>
> Leverage: 3x-5x Isolated. Risk management first.
>
> ⚠️ Fundamentals: Renzo is a real Liquid Restaking project on EigenLayer, with $855M TVL in ezETH and a Binance Launchpool. But REZ is governance-only and generates no direct revenue. That's why I'm not aiming for an ATH; I'm looking for a bounce.
>
> Do you think it will climb to $0.00315, or sweep the longs at $0.00269 first? 👇
> #Crypto #BinanceSquare #Trading
1
226
·
--
$UAI ---
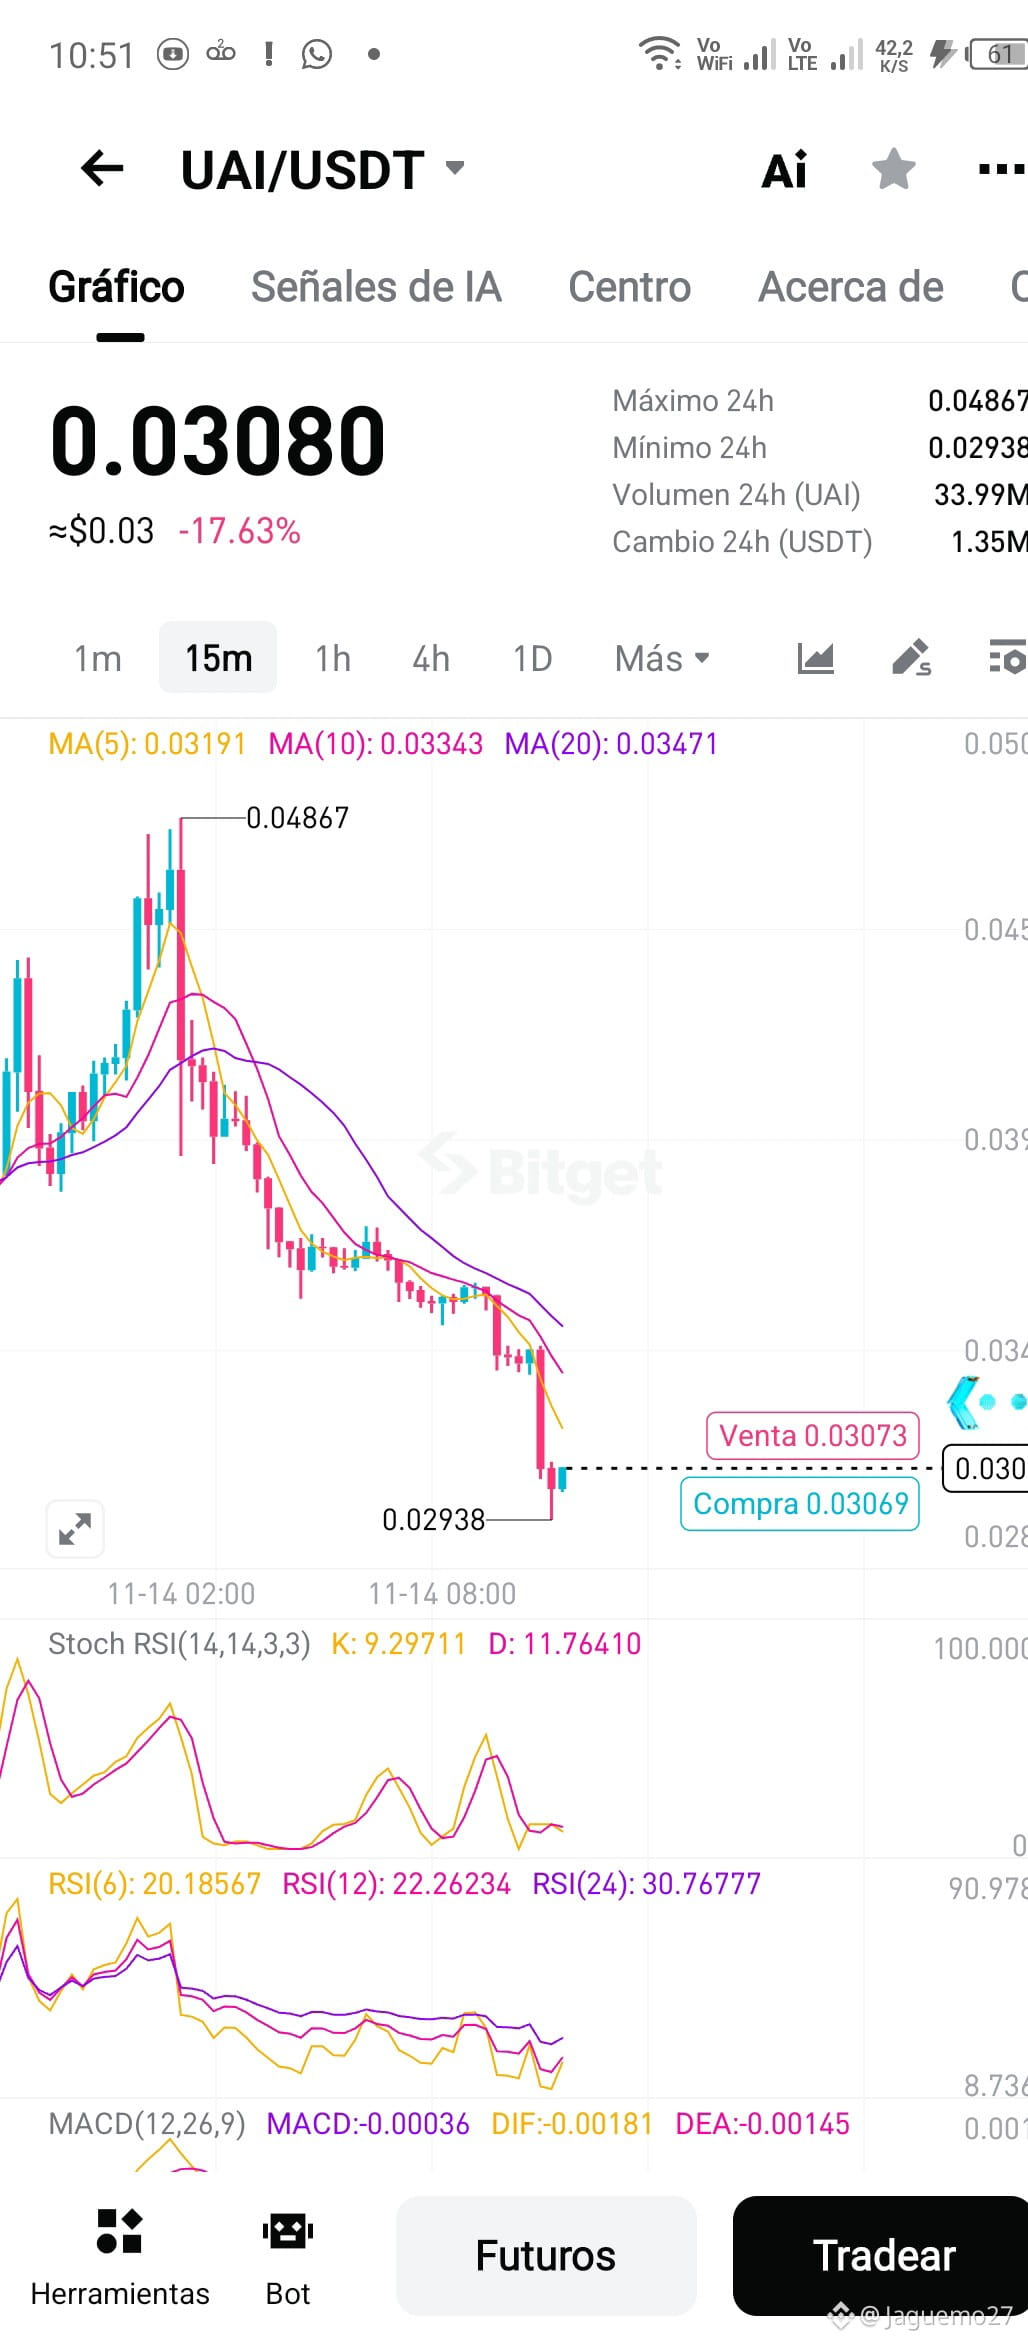
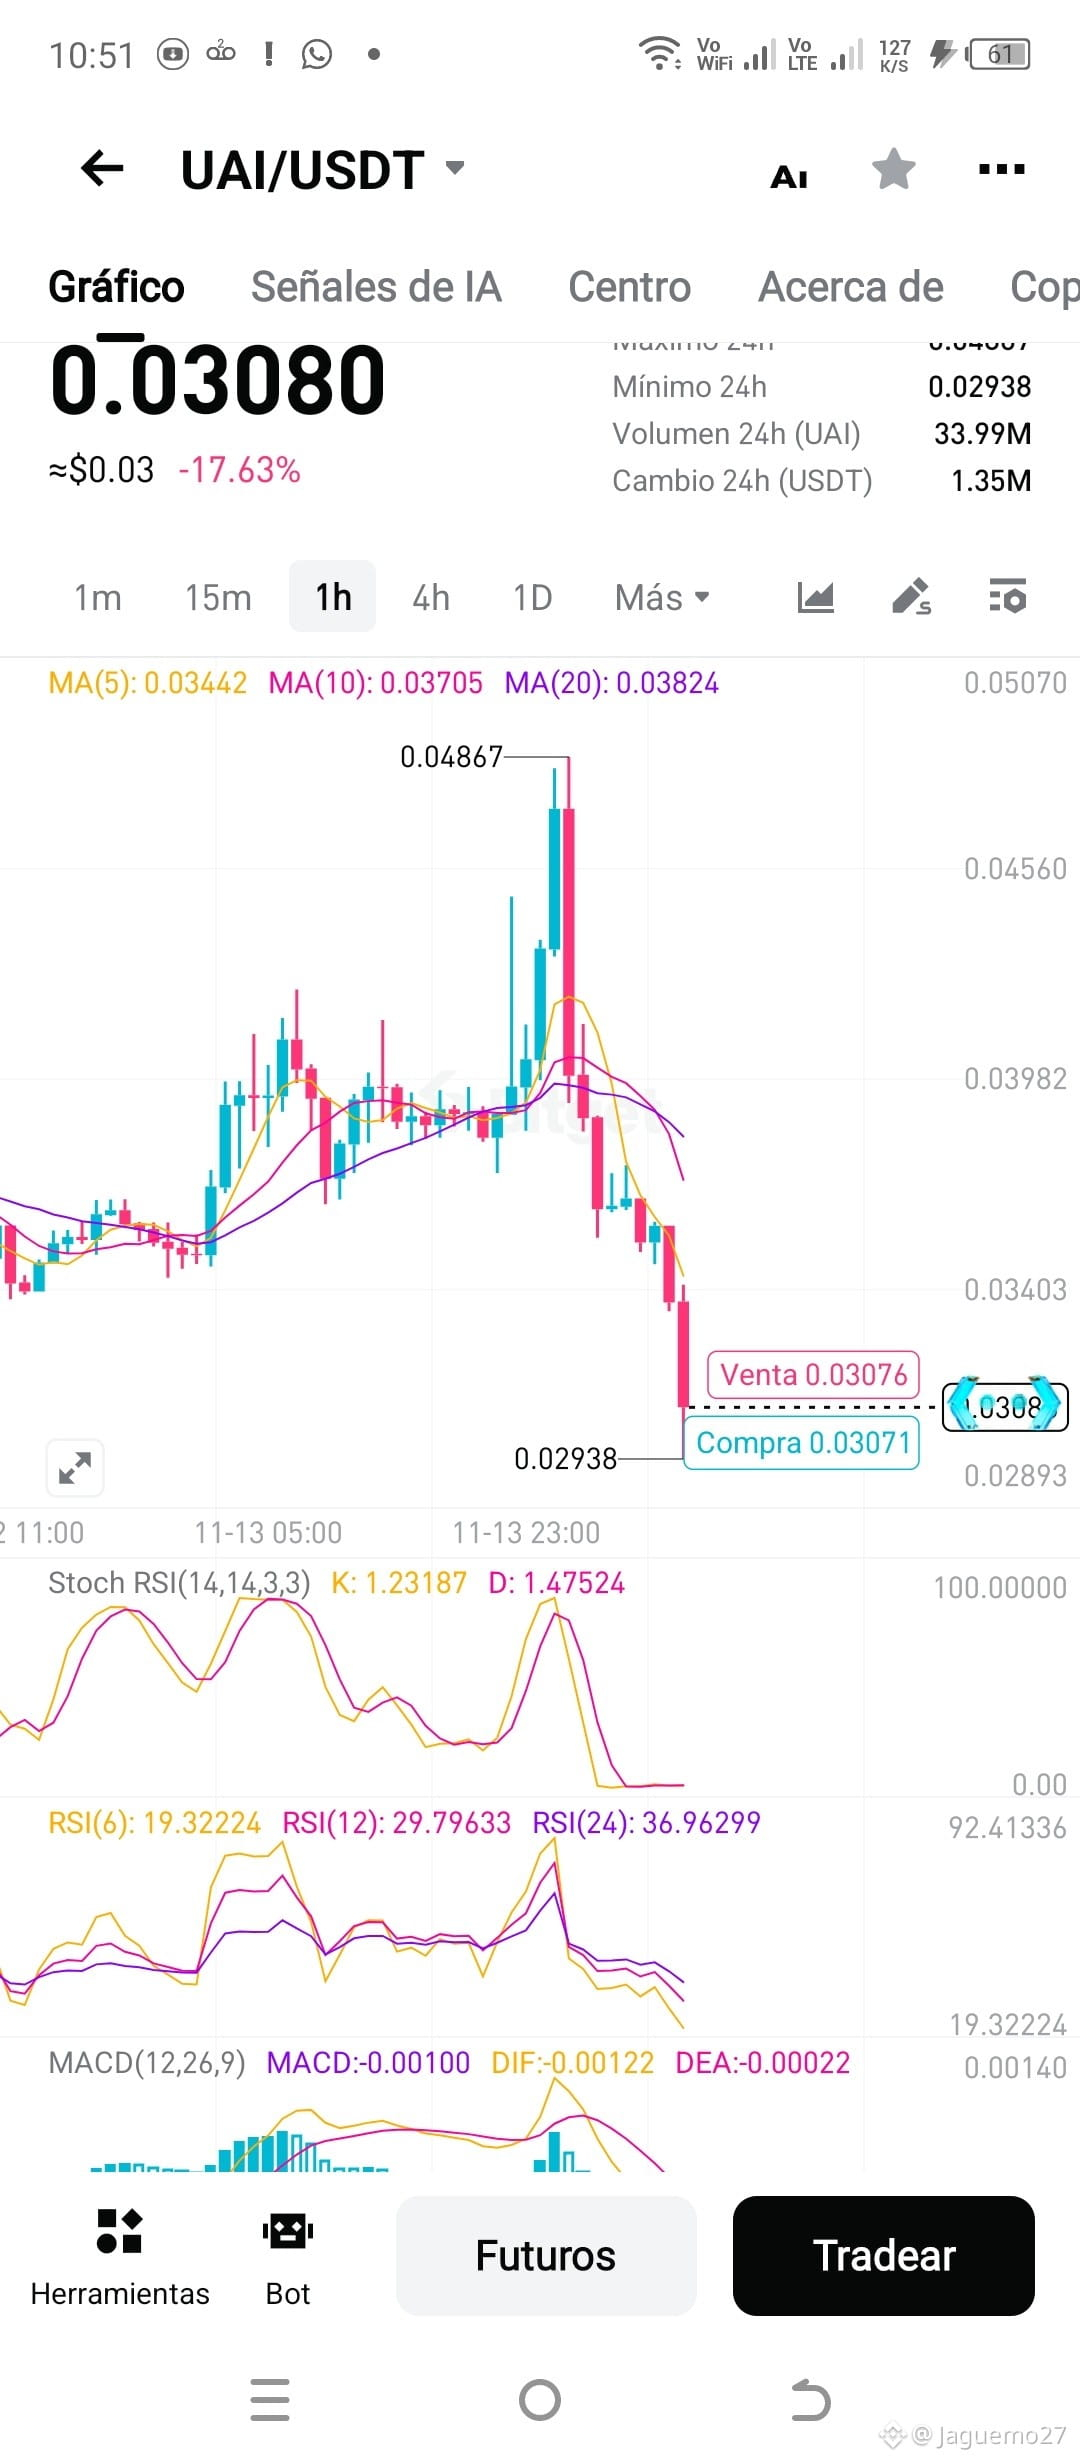
*📉 UAIUSDT | $0.0308, -17.63% | DON'T CATCH THE FALLING KNIFE*
Community, it fell from $0.0486 to $0.0293 in a matter of hours.
*Chart:*
- Price below MA(5), MA(10), and MA(20) on 15m and 1H. Completely bearish trend.
- RSI(6) at *19-20*. Extremely oversold, but oversold doesn't mean it's hit bottom.
- StochRSI at *1-9*. They sold hard.
- MACD negative at -0.001. No buying strength.
- Binance AI: still in a weak downtrend, bearish MACD.
*🎯 Position: SHORT*
*Entry:* $0.034 - $0.035$ (bounce to the moving averages)
*Stop:* $0.038$
*TP1:* $0.029$ *TP2:* $0.025$
If it recovers $0.038$ with volume, the Short is canceled.
Are you expecting a bounce, or do you think it will keep falling?
#UAI #UAIUSDT #BinanceSquare #Crypto
---
$UAI ---
*📉 UAIUSDT | $0.0308, -17.63% | DON'T CATCH THE FALLING KNIFE*
Community, it fell from $0.0486 to $0.0293 in a matter of hours.
*Chart:*
- Price below MA(5), MA(10), and MA(20) on 15m and 1H. Completely bearish trend.
- RSI(6) at *19-20*. Extremely oversold, but oversold doesn't mean it's hit bottom.
- StochRSI at *1-9*. They sold hard.
- MACD negative at -0.001. No buying strength.
- Binance AI: still in a weak downtrend, bearish MACD.
*🎯 Position: SHORT*
*Entry:* $0.034 - $0.035$ (bounce to the moving averages)
*Stop:* $0.038$
*TP1:* $0.029$ *TP2:* $0.025$
If it recovers $0.038$ with volume, the Short is canceled.
Are you expecting a bounce, or do you think it will keep falling?
#UAI #UAIUSDT #BinanceSquare #Crypto
---
*📉 UAIUSDT | $0.0308, -17.63% | DON'T CATCH THE FALLING KNIFE*
Community, it fell from $0.0486 to $0.0293 in a matter of hours.
*Chart:*
- Price below MA(5), MA(10), and MA(20) on 15m and 1H. Completely bearish trend.
- RSI(6) at *19-20*. Extremely oversold, but oversold doesn't mean it's hit bottom.
- StochRSI at *1-9*. They sold hard.
- MACD negative at -0.001. No buying strength.
- Binance AI: still in a weak downtrend, bearish MACD.
*🎯 Position: SHORT*
*Entry:* $0.034 - $0.035$ (bounce to the moving averages)
*Stop:* $0.038$
*TP1:* $0.029$ *TP2:* $0.025$
If it recovers $0.038$ with volume, the Short is canceled.
Are you expecting a bounce, or do you think it will keep falling?
#UAI #UAIUSDT #BinanceSquare #Crypto
---
142
·
--
$BTC BIG NEWS! BTC lost its 200-week moving average and funding turned negative for the first time in a month.
What happened?
Update:
- *PPI confirmed:* +0.3% month over month vs. +0.4% expected, +6.5% year over year vs. +6.6% expected. It bounced to $70,200 and was sold off; now at ∼$68,700.
- *Boston Fed's Collins today:* said that sometimes higher interest rates are needed to control inflation. This keeps the bias hawkish for December.
- *BTC fell below its 200-week moving average at ∼$68,000*, touching $67,652. This is a key level it hadn't lost since August.
- *Negative funding* for the first time in a month, a sign that shorts are dominating.
- *ETFs:* that's now 6 straight days in the red, with $1.49B in outflows between Nov. 5 and 12.
It's BEARISH for going long. Until it closes back above $70,000, the next support remains at $67,568 and then $65,000. Don't go long out of FOMO.
$BTC BIG NEWS! BTC lost its 200-week moving average and funding turned negative for the first time in a month.
What happened?
Update:
- *PPI confirmed:* +0.3% month over month vs. +0.4% expected, +6.5% year over year vs. +6.6% expected. It bounced to $70,200 and was sold off; now at ∼$68,700.
- *Boston Fed's Collins today:* said that sometimes higher interest rates are needed to control inflation. This keeps the bias hawkish for December.
- *BTC fell below its 200-week moving average at ∼$68,000*, touching $67,652. This is a key level it hadn't lost since August.
- *Negative funding* for the first time in a month, a sign that shorts are dominating.
- *ETFs:* that's now 6 straight days in the red, with $1.49B in outflows between Nov. 5 and 12.
It's BEARISH for going long. Until it closes back above $70,000, the next support remains at $67,568 and then $65,000. Don't go long out of FOMO.
What happened?
Update:
- *PPI confirmed:* +0.3% month over month vs. +0.4% expected, +6.5% year over year vs. +6.6% expected. It bounced to $70,200 and was sold off; now at ∼$68,700.
- *Boston Fed's Collins today:* said that sometimes higher interest rates are needed to control inflation. This keeps the bias hawkish for December.
- *BTC fell below its 200-week moving average at ∼$68,000*, touching $67,652. This is a key level it hadn't lost since August.
- *Negative funding* for the first time in a month, a sign that shorts are dominating.
- *ETFs:* that's now 6 straight days in the red, with $1.49B in outflows between Nov. 5 and 12.
It's BEARISH for going long. Until it closes back above $70,000, the next support remains at $67,568 and then $65,000. Don't go long out of FOMO.
1
48
·
--
$AKE
---
*🔥 MARKET SUMMARY - FRIDAY, NOV 13 - 8:35 AM*
*🇺🇸 US PPI (October):*
It was expected to come in hot: +0.4% month over month and +6.6% year over year.
It came in a little cooler than expected, so BTC bounced from $67.568 to $69.934, but the trend has NOT changed.
*₿ BTC: $69.934 (-3.77%)*
Still below $70K. It hit a low of $67.568.
If it loses $67.568, the next support is $65.000 - $66.000.
If it strongly reclaims $70.392, then we can talk about a bounce.
*📉 Rest of the market:*
BNB $646 (-1.54%)
ETH $1.975 (-1.89%)
SOL $81.89 (+0.27%)
XRP $1.04 (-0.02%)
PEPE +5%, LINK +2.35%, NEAR +6.30%, HYPE +6.44%
*⚠️ Why is the market still bearish?*
- $1.47B in liquidations over 24h, mostly Longs
- ETFs have been in the red for 6 days
- The Fed is highly likely to raise rates in December
- Annual PPI remains near a nearly 4-year high
*Conclusion:* It was just a technical bounce, not a reversal. Don't chase Longs out of FOMO. Wait for confirmation above $70.392.
---
$AKE
---
*🔥 MARKET SUMMARY - FRIDAY, NOV 13 - 8:35 AM*
*🇺🇸 US PPI (October):*
It was expected to come in hot: +0.4% month over month and +6.6% year over year.
It came in a little cooler than expected, so BTC bounced from $67.568 to $69.934, but the trend has NOT changed.
*₿ BTC: $69.934 (-3.77%)*
Still below $70K. It hit a low of $67.568.
If it loses $67.568, the next support is $65.000 - $66.000.
If it strongly reclaims $70.392, then we can talk about a bounce.
*📉 Rest of the market:*
BNB $646 (-1.54%)
ETH $1.975 (-1.89%)
SOL $81.89 (+0.27%)
XRP $1.04 (-0.02%)
PEPE +5%, LINK +2.35%, NEAR +6.30%, HYPE +6.44%
*⚠️ Why is the market still bearish?*
- $1.47B in liquidations over 24h, mostly Longs
- ETFs have been in the red for 6 days
- The Fed is highly likely to raise rates in December
- Annual PPI remains near a nearly 4-year high
*Conclusion:* It was just a technical bounce, not a reversal. Don't chase Longs out of FOMO. Wait for confirmation above $70.392.
---
---
*🔥 MARKET SUMMARY - FRIDAY, NOV 13 - 8:35 AM*
*🇺🇸 US PPI (October):*
It was expected to come in hot: +0.4% month over month and +6.6% year over year.
It came in a little cooler than expected, so BTC bounced from $67.568 to $69.934, but the trend has NOT changed.
*₿ BTC: $69.934 (-3.77%)*
Still below $70K. It hit a low of $67.568.
If it loses $67.568, the next support is $65.000 - $66.000.
If it strongly reclaims $70.392, then we can talk about a bounce.
*📉 Rest of the market:*
BNB $646 (-1.54%)
ETH $1.975 (-1.89%)
SOL $81.89 (+0.27%)
XRP $1.04 (-0.02%)
PEPE +5%, LINK +2.35%, NEAR +6.30%, HYPE +6.44%
*⚠️ Why is the market still bearish?*
- $1.47B in liquidations over 24h, mostly Longs
- ETFs have been in the red for 6 days
- The Fed is highly likely to raise rates in December
- Annual PPI remains near a nearly 4-year high
*Conclusion:* It was just a technical bounce, not a reversal. Don't chase Longs out of FOMO. Wait for confirmation above $70.392.
---
55
·
--
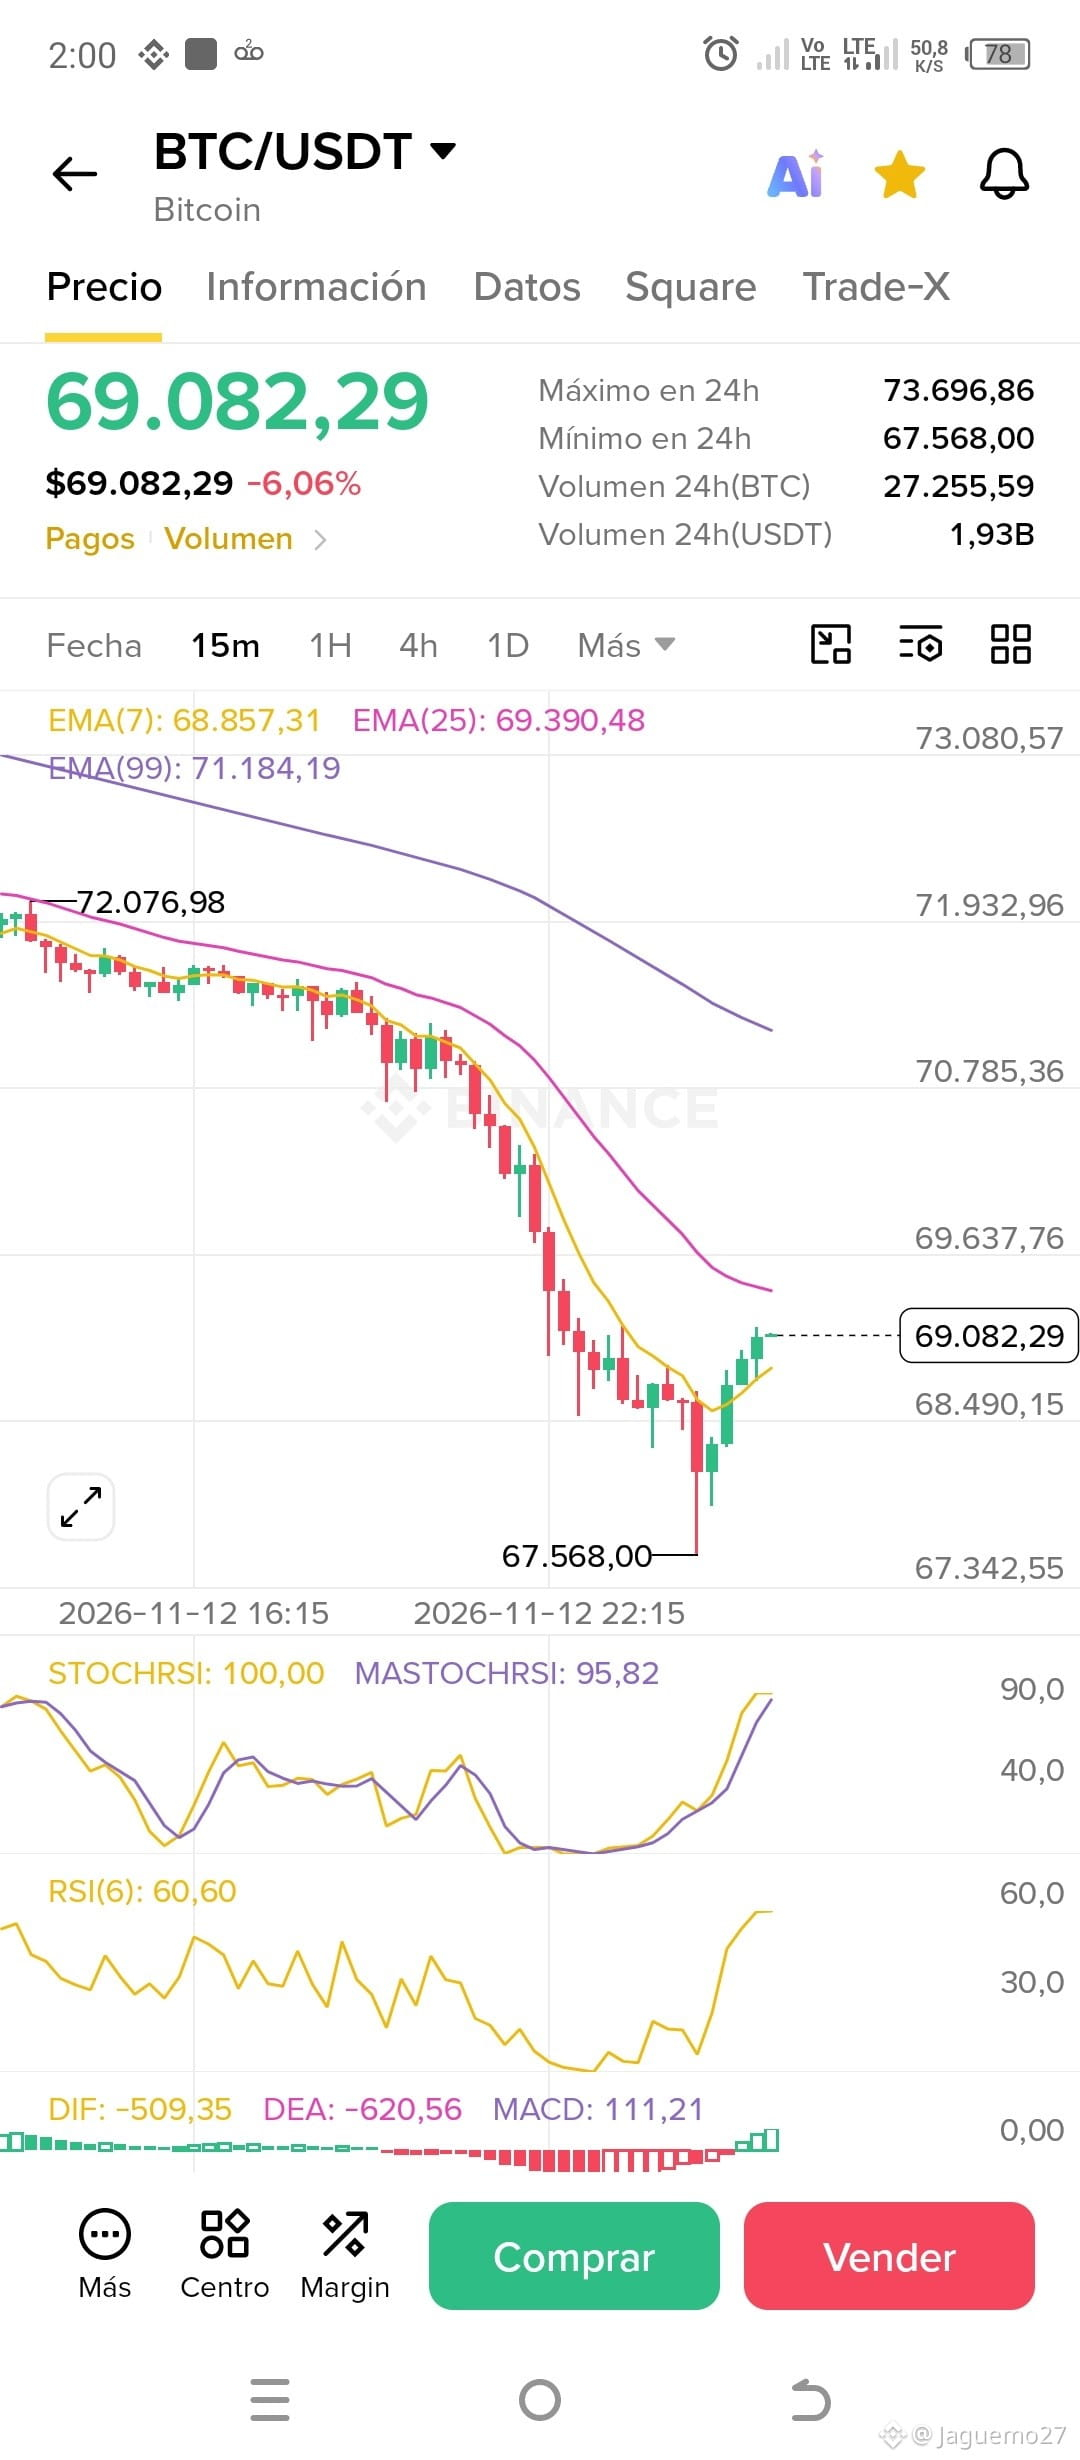
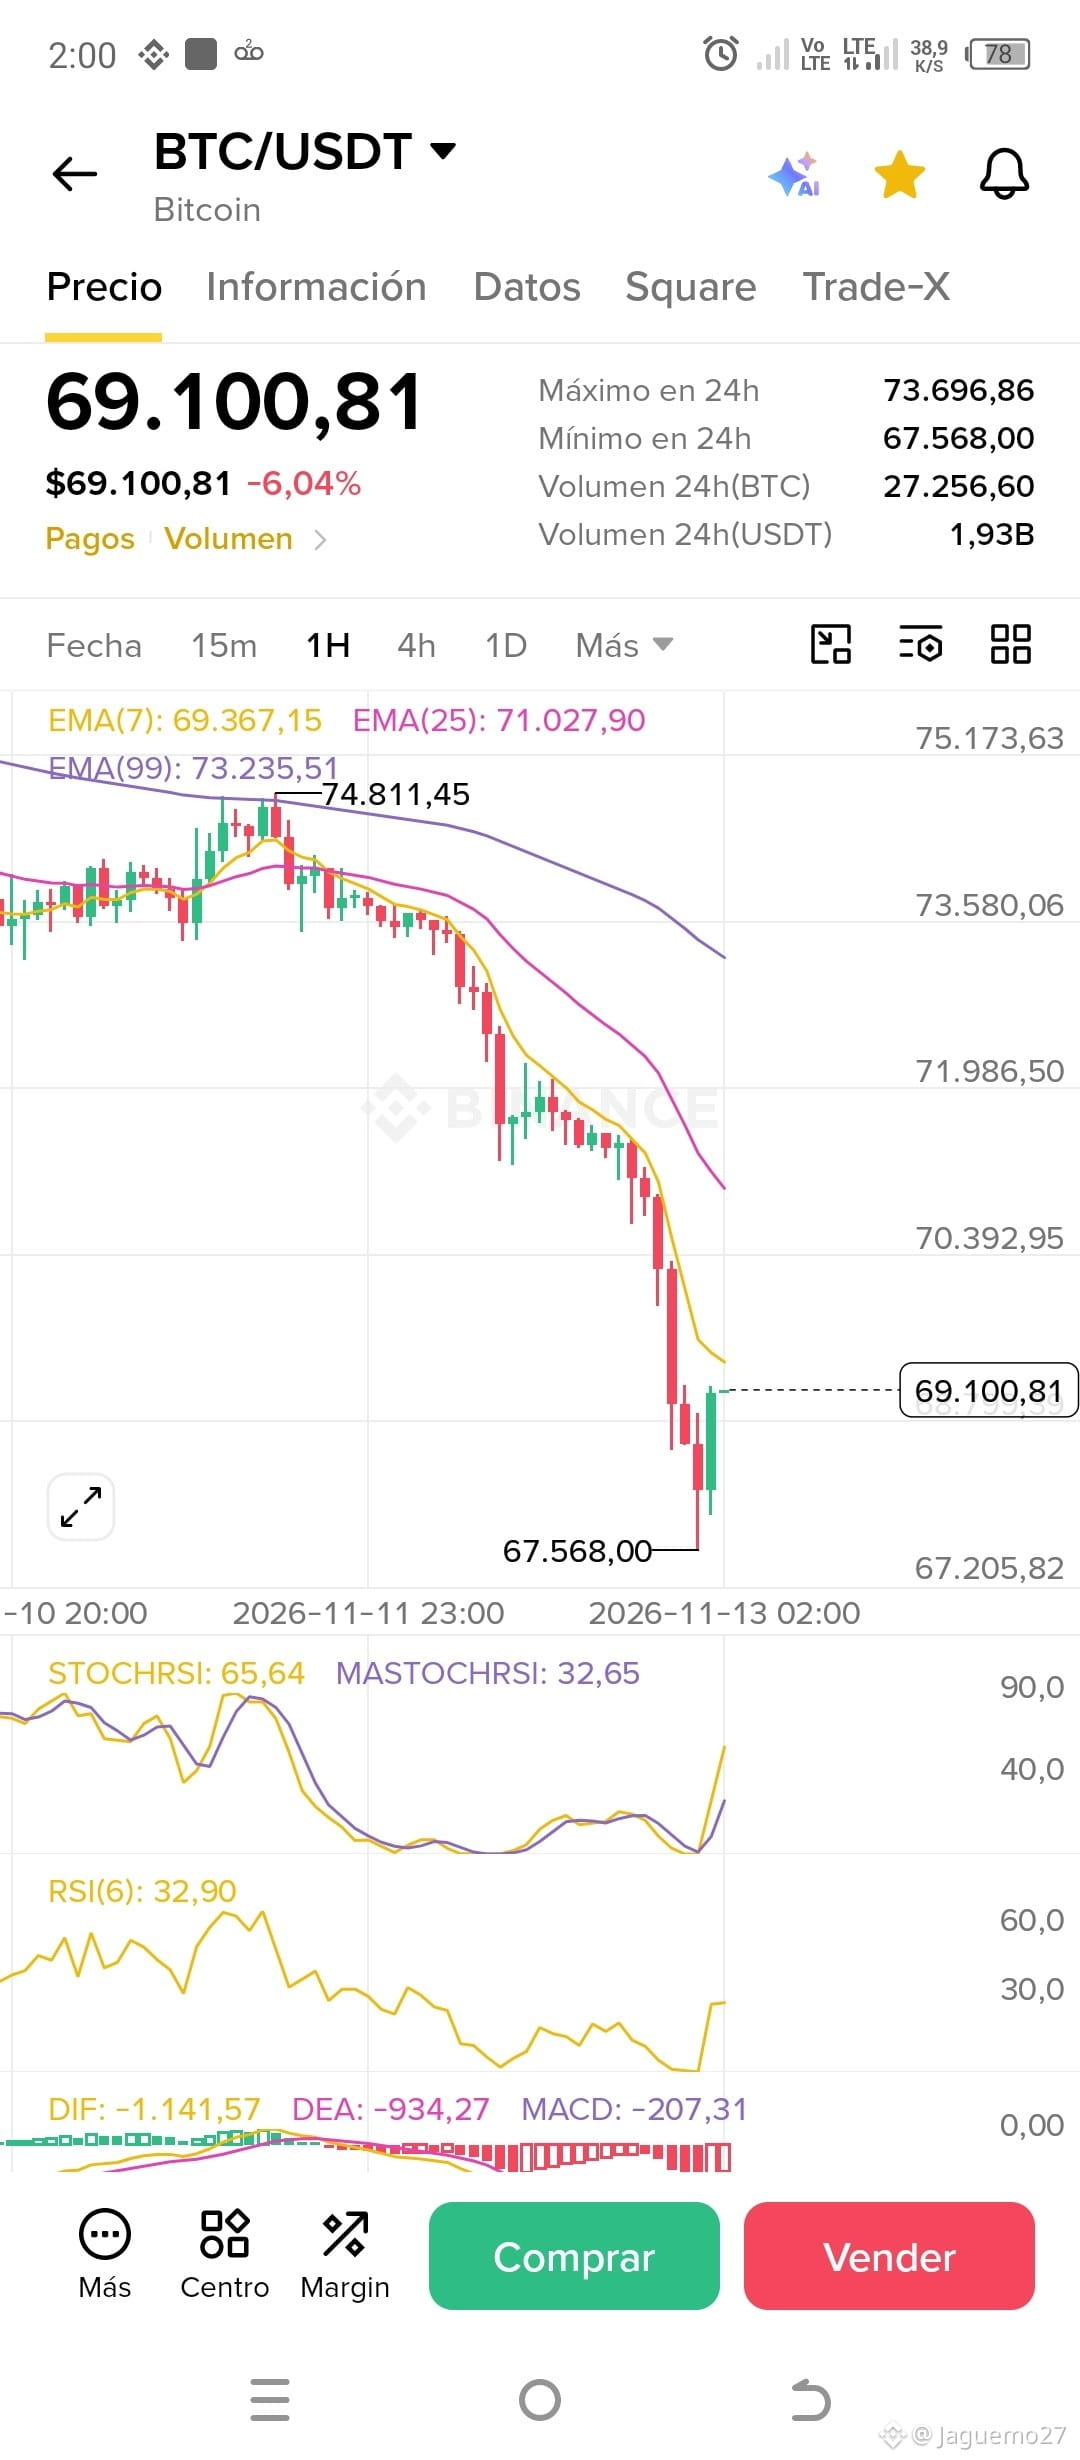
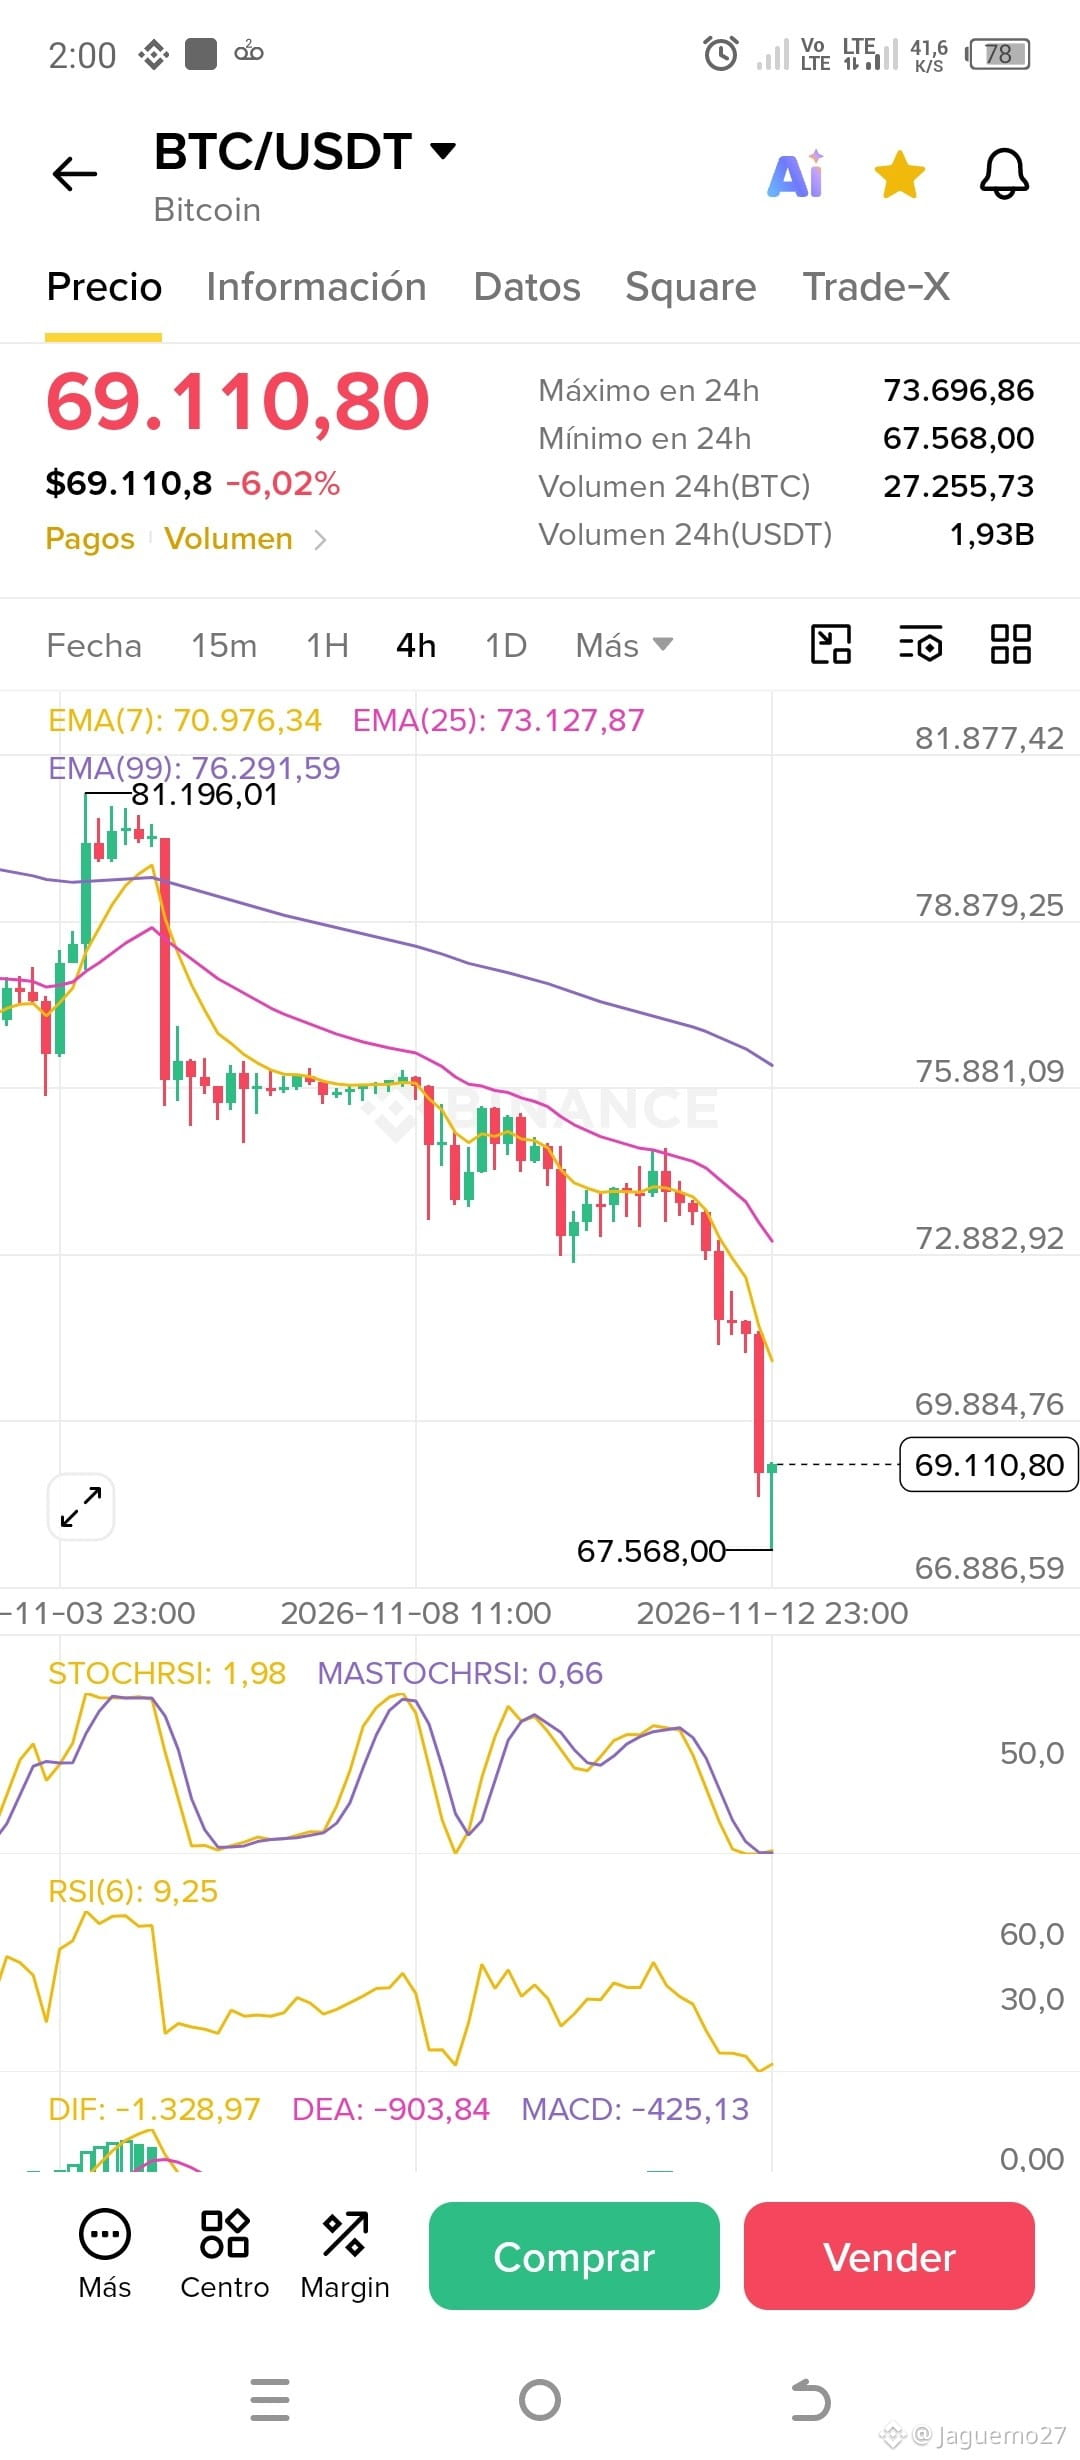
$BTC is at $69,082 - $69,110, down 6% in 24h.*
It hit a low of *$67,568* and bounced. That’s your key support now.
*What do the three charts say?*
*1. 4H - Chart 1: Sharp drop, oversold bounce*
- Price is BELOW all 3 EMAs: EMA7 70,976, EMA25 73,127, EMA99 76,291. That’s 100% bearish, chief.
- RSI(6) is at *9.25* and STOCHRSI at *1.98*. That’s extreme oversold territory. That’s why it bounced—not because the drop is over, but because it was heavily oversold.
- MACD is -425, still negative.
*2. 1H - Chart 2: Bounce in progress*
- It’s already climbed from 67,568 to 69,100. The big green candle is bounce buying.
- RSI(6) rose to *32.90*. It’s out of oversold territory and catching its breath.
- But watch out: EMA7 is at 69,367, just above the price. If it doesn’t break through, it’ll turn back down.
*3. 15m - Chart 3: The bounce is already running out of steam*
- STOCHRSI is at *100.00* and RSI(6) at *60.60*. On the 15m chart, it’s already overbought, chief.
- MACD has turned positive at +111. In other words, the short-term bounce has already happened.
- Price is right around EMA7 at 68,857, but below EMA25 at 69,390.
*Bottom line, chief:*
This is a *bounce, not a reversal.*
- *If it holds above $67,568:* It could test $69,637 and then $70,392.
- *If it loses $67,568:* It heads straight to $66,886, the next support shown on the chart.
- *If it breaks $70,392 on volume:* Then we can talk about a recovery.
Don’t chase the 15m bounce—it’s already at 100 on STOCHRSI. That’s where many people enter late and get liquidated.
$BTC is at $69,082 - $69,110, down 6% in 24h.*
It hit a low of *$67,568* and bounced. That’s your key support now.
*What do the three charts say?*
*1. 4H - Chart 1: Sharp drop, oversold bounce*
- Price is BELOW all 3 EMAs: EMA7 70,976, EMA25 73,127, EMA99 76,291. That’s 100% bearish, chief.
- RSI(6) is at *9.25* and STOCHRSI at *1.98*. That’s extreme oversold territory. That’s why it bounced—not because the drop is over, but because it was heavily oversold.
- MACD is -425, still negative.
*2. 1H - Chart 2: Bounce in progress*
- It’s already climbed from 67,568 to 69,100. The big green candle is bounce buying.
- RSI(6) rose to *32.90*. It’s out of oversold territory and catching its breath.
- But watch out: EMA7 is at 69,367, just above the price. If it doesn’t break through, it’ll turn back down.
*3. 15m - Chart 3: The bounce is already running out of steam*
- STOCHRSI is at *100.00* and RSI(6) at *60.60*. On the 15m chart, it’s already overbought, chief.
- MACD has turned positive at +111. In other words, the short-term bounce has already happened.
- Price is right around EMA7 at 68,857, but below EMA25 at 69,390.
*Bottom line, chief:*
This is a *bounce, not a reversal.*
- *If it holds above $67,568:* It could test $69,637 and then $70,392.
- *If it loses $67,568:* It heads straight to $66,886, the next support shown on the chart.
- *If it breaks $70,392 on volume:* Then we can talk about a recovery.
Don’t chase the 15m bounce—it’s already at 100 on STOCHRSI. That’s where many people enter late and get liquidated.
It hit a low of *$67,568* and bounced. That’s your key support now.
*What do the three charts say?*
*1. 4H - Chart 1: Sharp drop, oversold bounce*
- Price is BELOW all 3 EMAs: EMA7 70,976, EMA25 73,127, EMA99 76,291. That’s 100% bearish, chief.
- RSI(6) is at *9.25* and STOCHRSI at *1.98*. That’s extreme oversold territory. That’s why it bounced—not because the drop is over, but because it was heavily oversold.
- MACD is -425, still negative.
*2. 1H - Chart 2: Bounce in progress*
- It’s already climbed from 67,568 to 69,100. The big green candle is bounce buying.
- RSI(6) rose to *32.90*. It’s out of oversold territory and catching its breath.
- But watch out: EMA7 is at 69,367, just above the price. If it doesn’t break through, it’ll turn back down.
*3. 15m - Chart 3: The bounce is already running out of steam*
- STOCHRSI is at *100.00* and RSI(6) at *60.60*. On the 15m chart, it’s already overbought, chief.
- MACD has turned positive at +111. In other words, the short-term bounce has already happened.
- Price is right around EMA7 at 68,857, but below EMA25 at 69,390.
*Bottom line, chief:*
This is a *bounce, not a reversal.*
- *If it holds above $67,568:* It could test $69,637 and then $70,392.
- *If it loses $67,568:* It heads straight to $66,886, the next support shown on the chart.
- *If it breaks $70,392 on volume:* Then we can talk about a recovery.
Don’t chase the 15m bounce—it’s already at 100 on STOCHRSI. That’s where many people enter late and get liquidated.
21
Log in to explore more content
Join global crypto users on Binance Square
⚡️ Get latest and useful information about crypto.
💬 Trusted by the world’s largest crypto exchange.
👍 Discover real insights from verified creators.
Email / Phone number
Trending Topics
A Packed Week of Earnings and Data Tests Markets
71,174 views
455 Discussing
Nvidia Earnings, Fed Minutes and Anthropic IPO Set to Test AI Stocks and Crypto
Binance News
·146 Likes
·24.6k views
AnthropicIPOTestsInvestorAppetiteForAI
140,227 views
1,544 Discussing
NvidiaBoardNotConsideringHuang’sReturnasCEO
3,446 views
106 Discussing