
the introduction
Without using the right trading tools, you cannot conduct effective technical analysis. A solid trading strategy will help you avoid common mistakes, improve your risk management approach, as well as enhance your ability to identify and capitalize on investment opportunities.
For many traders, the TradingView platform is the go-to place for charting. The HTML5 web application offers a suite of technical analysis tools and is used by millions of traders to track the movements of the Forex, cryptocurrency, and traditional stock markets.
The TradingView platform offers many unique features, allowing us to track assets across multiple trading platforms as well as publish trading ideas on its social network. In this article, we will highlight the customizability feature. We will be using Pine Script, TradingView's proprietary programming language, giving us full control over the design of charts.
Let's Begin!
What is Pine Script?
Pine Script is a scripting language used to modify your charts on the TradingView platform. The platform provides you with many features to do this, but Pine Script allows you to move towards your goal. Whether you want to change the colors of price action charts or backtest a new strategy, the Pine editor will help you customize your real-time charts as you see fit.
The code is nicely documented, so be sure to check out the user guide for more information. Through this tutorial, we aim to discuss some basics and provide indicators that can be useful in trading digital currencies.
preparation
It's very easy to get started using Pine Script. Any code we write runs on TradingView's servers, so we can use the editor and develop scripts from the browser – no additional downloading or configuration required.
In this tutorial, we will create a chart for the Bitcoin/Binance USD (BTCBUSD) currency pair. If you don't already have an account, you can go ahead and create one for free (a professional subscription is also available, but not necessary for this guide).
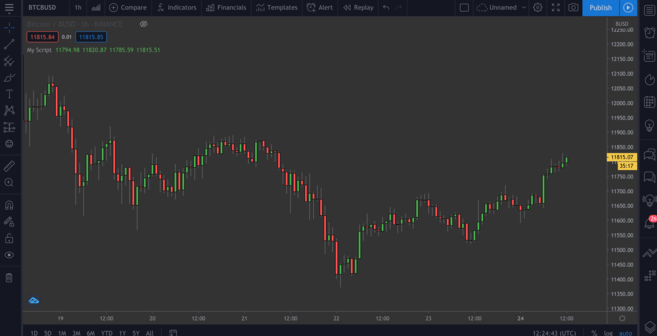
Follow this link, and you will see a chart similar to the following:
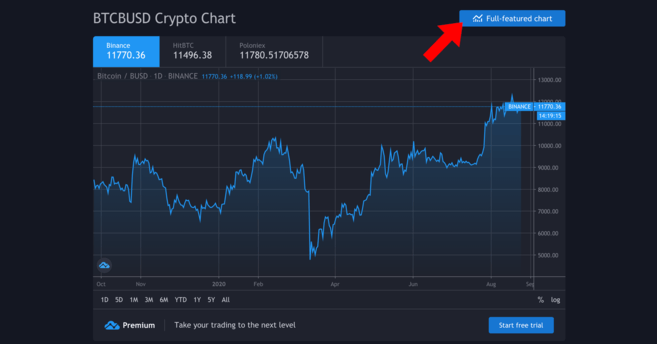
Your chart will likely be more sophisticated.
Here we would like a fully featured chart – click the button to access it. This gives us a more detailed overview and drawing tools, as well as options for drawing trend lines among other features.
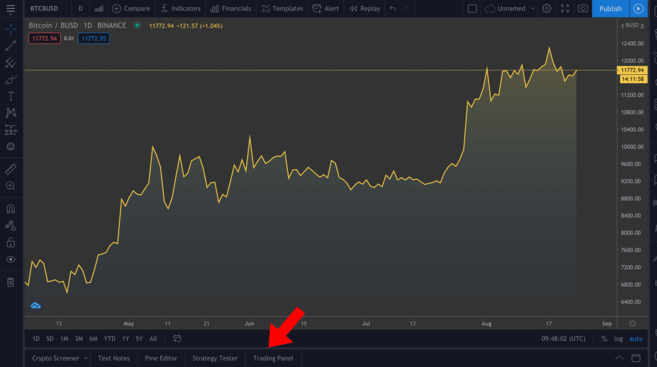
Fully featured chart. You can edit the time frame by clicking on the views above the highlighted tabs.
We will not discuss how to use the various tools available, but if you are interested in technical analysis, we highly recommend you check them out to become familiar with them. At the bottom left (highlighted in the image), you'll find a few different tabs – click on Pine Editor.
Pine Editor
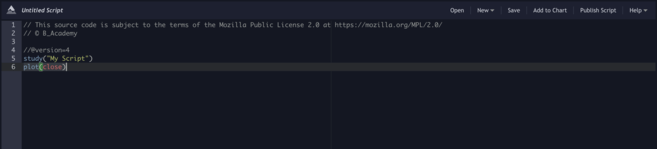
This editor offers you a set of charming features. We'll tell it what we want to do, then click Add to Chart to see our comments appear at the top. Please note that the chart may become untidy if you enter multiple comments at once, so we will remove them between examples ( right click on the chart > Remove Indicators).
You can see that we already have two lines of codes. Let's click Add to Chart to see what happens.
A second chart is added below the original chart. The new chart will represent the same data. Move your mouse over the My Script button and click the ellipsis to remove it. Let's discuss the code in more detail.
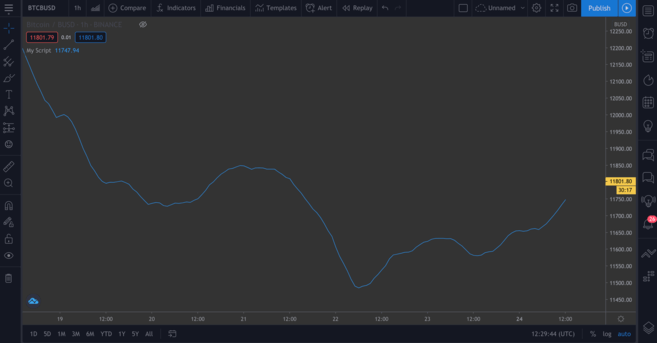
study("My Script")The first line sets up our comments. It only requires the name you want the indicator to be called ("My Script", in this case), but there are also some optional variables we can add. One such variable is overlay, which tells the platform to place the indicator on the current chart (rather than on a new sector). As you can see in the first example, it defaults to false. So, we won't see it running now, overlay=true adds the indicator to the current chart.
plot(close)This line is the instruction to plot Bitcoin's closing price. The graph gives us a line chart, but we can also display price action and bar charts, as we will see in a moment.
Now let's try the following:
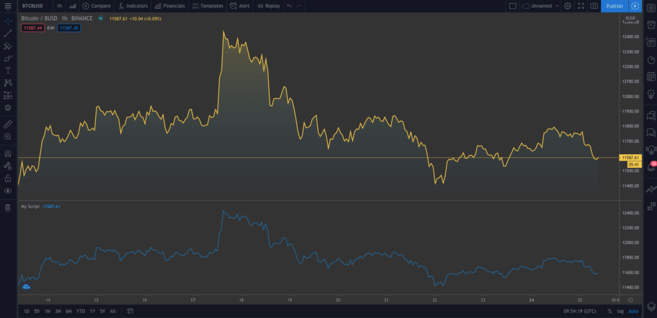
//@version=4 study("My Script", overlay=true) plot(open, color=color.purple)Once you add this symbol, you should see a second chart (it looks like the original chart has shifted to the right side). All we did was plot the opening price instead. Since the current day's open price is the previous day's closing price, it makes sense for them to have a similar shape.
Good! Let's get rid of the existing comments (remember we do this by right-clicking and pressing Remove Indicators). Move your mouse over BTC/BUSD and then click the Hide button to delete the current chart as well.
Many traders prefer price action charts as they give us more information than a simple drawing like we just did. Let's add them below.
//@version=4 study("My Script", overlay=true) plotcandle(open, high, low, close)A good start, but the lack of color makes it a bit dull. Ideally, we should have red candles when the open price is greater than the close price during a specific time frame, and green candles when the close price exceeds the open price. We will add a line above the candle plot() property:
//@version=4 study("My Script", overlay=true) colors = open >= close ? color.red : color.green plotcandle(open, high, low, close)This happens in every price action chart as well as checking whether the opening price is greater than or equal to the closing price. In this case, it means that prices have fallen over a specific period, so the price action chart will be colored red. Otherwise, it will be colored green. Modify the drawcandle() function to enter the color scheme:
//@version=4 study("My Script", overlay=true) colors = open >= close ? color.red : color.green plotcandle(open, high, low, close, color=colors)Remove existing indicators if you have not already removed them, and add this indicator to the chart. We should have something that represents a normal price action chart.
amazing!
Drawing moving averages (MA)
We have some basics below. Let's move on to the first custom indicator – the Exponential Moving Average or EMA. It is a valuable tool that allows us to eliminate market distractions and make it easier to understand market movements.
The exponential moving average is slightly different from the simple moving average (SMA), as this average focuses on the most recent data. It tends to react to sudden movements and is usually used in short-term trades (day trading, for example).
Simple Moving Average (SMA)
We might also draw a simple moving average, so we should compare them later. Add this line to your script:
plot(sma(close, 10))This represents the average of the previous 10 days. Adjust the number in parentheses to see how much the curve changes when different periods are taken into account.
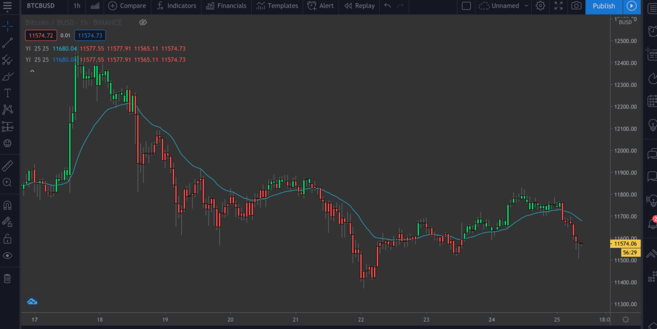
The simple moving average is based on the previous 10 days.
Exponential Moving Average (EMA)
The Exponential Moving Average may be a little difficult to understand, but don't worry. Let us consider the equation in detail:
EMA = (Close - Previous Day’s EMA) * Multiplier - Previous Day’s EMASo what does that tell us? Well, each day's new moving average is calculated based on the previous day's moving average. The multiplier is the “data weight” over the most recent period, and is calculated by the following equation:
Multiplier = 2 / (Length of EMA + 1)For simple moving averages, we need to determine how long the exponential moving average will last. In terms of structure, the exponential moving average plot is similar to the simple moving average plot. Draw it next to the simple moving average so you can compare them:
//@version=4 study("My Script", overlay=true) plot(sma(close, 10)) plot(ema(close,10))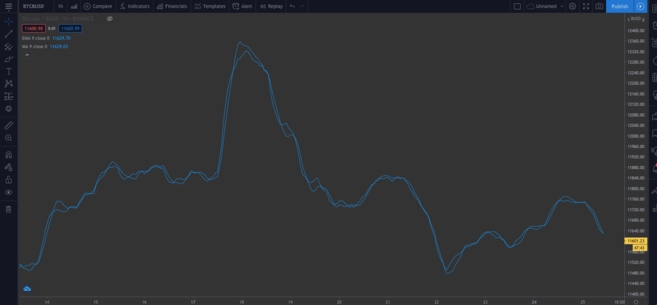
You can see a slight difference between the two types of moving averages.
➠ Do you want to start trading cryptocurrencies? Buy Bitcoins on Binance!
Embedded scripts
We've hand-written the code so far so you're familiar with it. But let's offer something that will help save time, especially if writing more complex scripts, and we don't want to do it from scratch.
Click the New button located at the top right of your editor. You'll see a drop-down menu with all the different types of technical indicators. Click on Exponential Moving Average to see the source code for the Exponential Moving Average indicator.
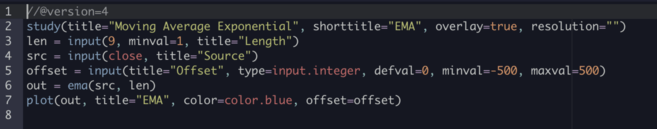
Then add it to the chart.
This is different from our own codes – you will notice the input() properties. It is great for use as you can click on this box…
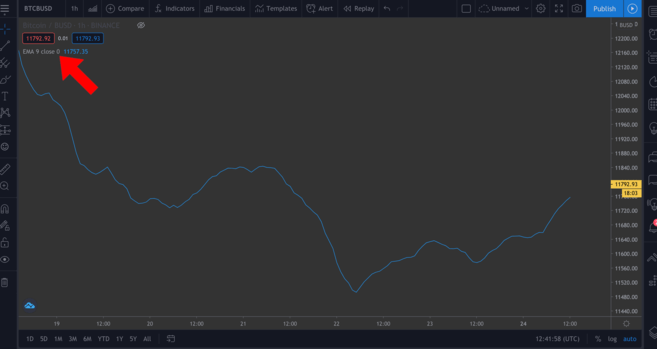
You can also change some of the values in the pop-up window easily by clicking on the settings wheel.
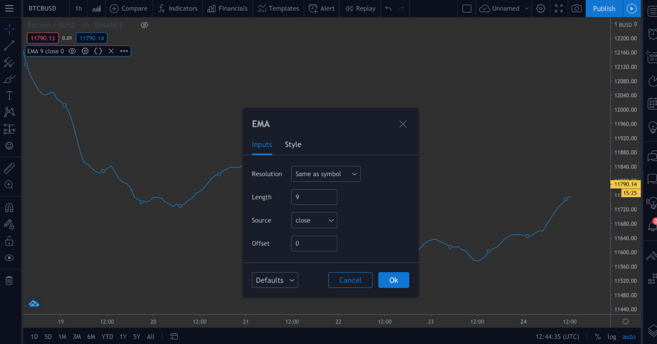
We will add two input() properties in the following script to demonstrate how to do this.
Relative Strength Index (RSI) chart
The Relative Strength Index (RSI) is one of the basic indicators in technical analysis. It is known as a momentum indicator, which means it measures the rate at which assets are bought and sold. Rating on a scale ranging from 0 to 100, the RSI score attempts to tell investors whether an asset is overbought or oversold. Typically, an asset is considered oversold if its score is less than or equal to 30, and it is considered overbought if its score is greater than or equal to 70.
If you go to New > RSI Strategy, you can see this for yourself. The RSI is measured over 14 periods (i.e. 14 hours or 14 days), but you have the freedom to adjust this setting to suit your own strategy.
Add that to the chart. You should now see some arrows (identified by the enter.strategy() property in the code). RsiLE indicates potential buying opportunities for the asset as it may become in an oversold zone. While RsiSE highlights the potential selling points of the asset when it is in the overbought zone. Please note that, like all indicators, they should not be relied upon as definitive evidence of rising or falling prices.
Perform a backtest
There is a way that allows us to test custom indicators. Although past performance is no guarantee of future results, the process of backtesting scripts gives us an idea of how effective they are at receiving signals.
Below is an example of a simple script. We will create a simple strategy to enter a long trade when the price of Bitcoin falls below $11,000 and exit the trade when the price exceeds $11,300. Thus, we can know how profitable this strategy has been historically.
//@version=4 strategy("ToDaMoon", overlay=true) enter = input(11000) exit = input(11300) price = close if (price <= enter) strategy.entry("BuyTheDip", strategy.long, comment="BuyTheDip") if (price >= exit) strategy.close_all(comment="SellTheNews")Here we have defined the entry and exit points as variables – both are inputs, which means we can change them on the chart later. We have also set a price variable, which records the closing price for each period. Thus, there is something logical about using if statements. If the bracketed part is true, the indented block will be activated. Otherwise, it will be skipped.
Also, if the price falls or is equal to the desired entry price, the expression will be evaluated as true, and we will open a buy trade. Once the price equals or exceeds the required exit price, the second block will be activated, as well as closing all open trades.
We will add comments to the chart using arrows to indicate entry and exit points, so we have named these points in the comments frame (in this example, “Buy Dip” and “Sell on News”). Copy the symbol and add it to the chart.
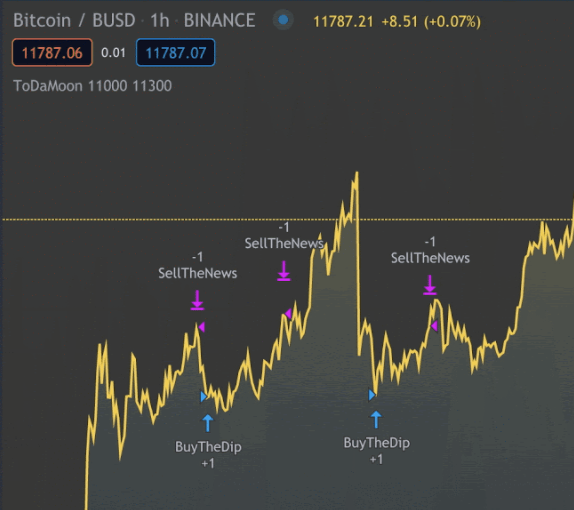
You can now see the indicators on the chart. You may need to zoom out to take a look.
TradingView applies your rules to older data. You will also notice a transition from the Pine editor to the Strategy Tester tab. This allows you to see an overview of potential profits, a list of trades and their respective performance.
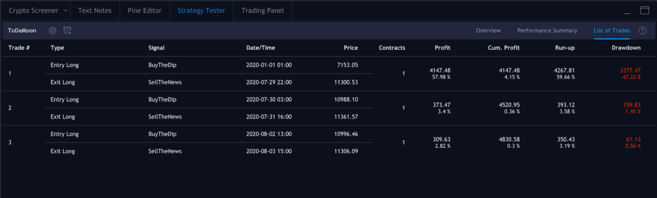
Trades we entered and exited.
Link items together
It's time to write our own program using some of the concepts described so far. We will combine both the Exponential Moving Average and the RSI using their value in order to color the price action charts and gain conceivable insight.
This should not be construed as financial advice – as there is no objectively defined correct way to use this indicator. Similar to all other indicators, this indicator should be used in conjunction with other tools to develop your investment strategy.
Let's start working on the new script. Remove all indicators from the chart, and hide the BTC/BUSD chart, too, so that we have a blank chart to start working with.
Let's start by defining the study. You can use any name you want, just make sure to set overlay=true.
study(title="Binance Academy Script", overlay=true)Remember the exponential moving average equation we talked about earlier. We need to provide the multiplier with data for the period that the exponential moving average will take. Let's make it an input field that requires an integer (hence, no decimal places). We will also specify a minimum (minval) and a default value (defval).
study(title="Binance Academy Script", overlay=true) emaLength = input(title="EMA Length", type=input.integer, defval=25, minval=0)We can calculate the EMA value for each candle on the chart by using the new variable:
study(title="Binance Academy Script", overlay=true) emaLength = input(title="EMA Length", type=input.integer, defval=25, minval=0) emaVal = ema(close, emaLength)amazing. Regarding the Relative Strength Index (RSI). We will enter the period in a similar way:
study(title="Binance Academy Script", overlay=true) emaLength = input(title="EMA Length", type=input.integer, defval=25, minval=0) emaVal = ema(close, emaLength) rsiLength = input(title="RSI Length", type=input.integer, defval=25, minval=0)Now we can calculate that:
study(title="Binance Academy Script", overlay=true) emaLength = input(title="EMA Length", type=input.integer, defval=25, minval=0) emaVal = ema(close, emaLength) rsiLength = input(title="RSI Length", type=input.integer, defval=25, minval=0) rsiVal = rsi(close, rsiLength)At this point, you should be aware that the colors of the price action charts depend on the EMA and RSI values. Let's consider an example when (a) the candle's closing price crosses the EMA and (b) the RSI is above 50.
Why? Well, you may decide that these indicators can be used in conjunction to tell you when to buy or sell Bitcoin. For example, you may think that fulfilling both conditions means that it is a good time to enter a long trade. Alternatively, you may use indicators to remind you when you should not sell, even if other indicators show otherwise.
So, the next line looks like this:
study(title="Binance Academy Script", overlay=true) emaLength = input(title="EMA Length", type=input.integer, defval=25, minval=0) emaVal = ema(close, emaLength) rsiLength = input(title="RSI Length", type=input.integer, defval=25, minval=0) rsiVal = rsi(close, rsiLength) colors = close > emaVal and rsiVal > 50 ? color.green : color.redIf we translate this into plain English, it means that if the EMA exceeds the closing price and the RSI score crosses 50, we will color the candle green. Otherwise, it will be colored red.
Then, plot the exponential moving average:
study(title="Binance Academy Script", overlay=true) emaLength = input(title="EMA Length", type=input.integer, defval=25, minval=0) emaVal = ema(close, emaLength) rsiLength = input(title="RSI Length", type=input.integer, defval=25, minval=0) rsiVal = rsi(close, rsiLength) colors = close > emaVal and rsiVal > 50 ? color.green : color.red plot(emaVal, "EMA")Finally, draw the candles, making sure to include the color variable:
study(title="Binance Academy Script", overlay=true) emaLength = input(title="EMA Length", type=input.integer, defval=25, minval=0) emaVal = ema(close, emaLength) rsiLength = input(title="RSI Length", type=input.integer, defval=25, minval=0) rsiVal = rsi(close, rsiLength) colors = close > emaVal and rsiVal > 50 ? color.green : color.red plot(emaVal, "EMA") plotcandle(open, high, low, close, color=colors)And you're done with the script! Add that to your chart to see it in action.
BTC/BUSD chart using EMA/RSI.
Concluding thoughts
In this article we've looked at some basic examples of what can be done using TradingView's Pine Editor. You should be able to make simple comments on the price chart in order to get additional insight from your indicators.
We've only highlighted two indicators here, but it's easy to create more complex indicators – whether by defining built-in scripts anew or writing them yourself.
Need inspirational ideas? The following articles may help you get some ideas for your next project:
A brief guide to the Parabolic SAR Indicator
A guide to mastering the Fibonacci Retracement Tool
Explain leading and lagging indicators
Explanation of the MACD indicator
