Honestly, the $ETH chart feels confusing at first glance.
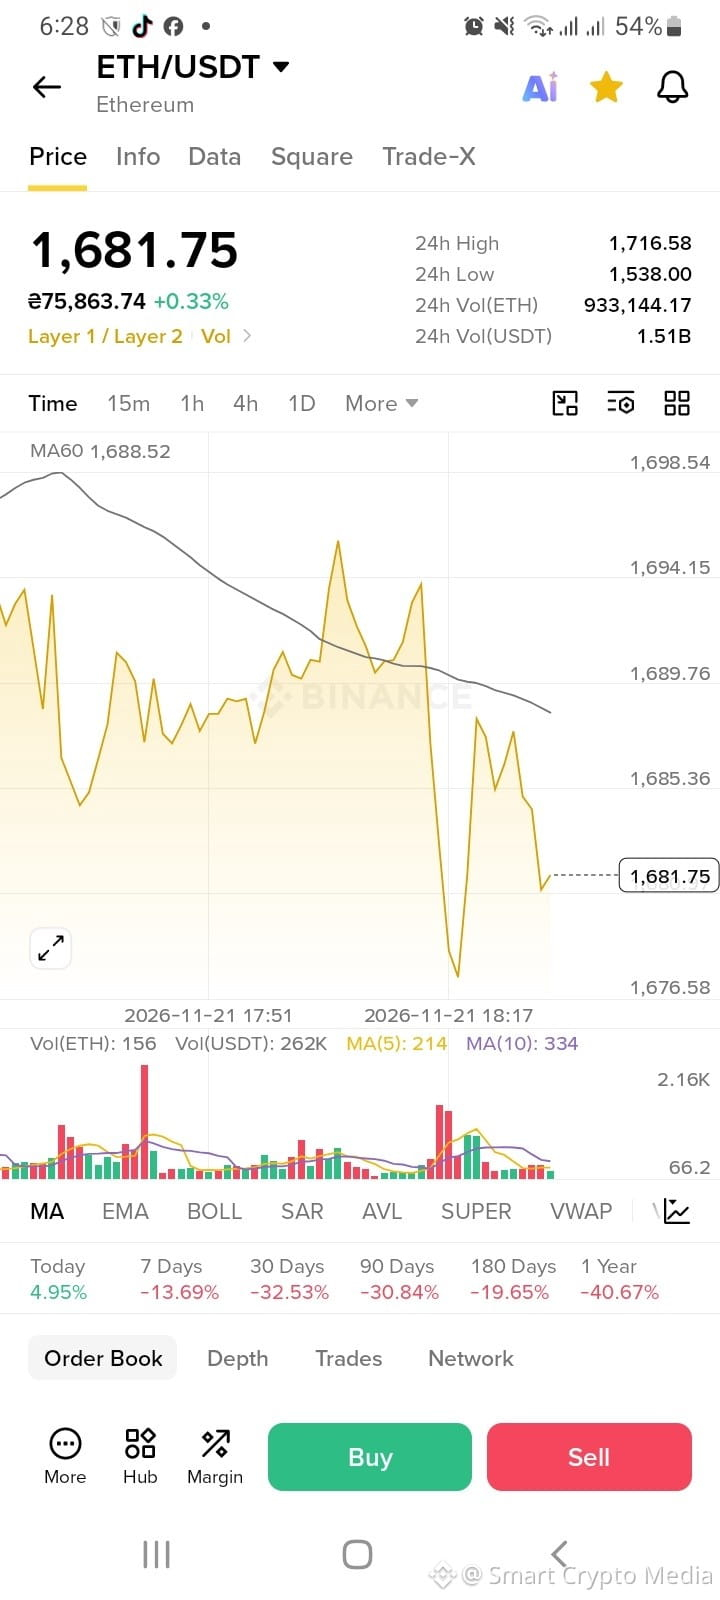
The daily number is green. +0.33%.
Then I looked at the other numbers.
$1,681.75 price. The MA60 sits at $1,688.52. Seven-day performance is -13.69%, while the 30-day figure is -32.53%.
That's a very different mood from the small green number at the top.
I think this is where it's easy to become emotionally attached to the timeframe you're watching. If you're looking at the last few candles, a bounce can feel like a recovery.
Zoom out, and the damage becomes harder to ignore.
I'm not saying ETH can't recover. I just don't think this screenshot gives enough evidence to call a trend reversal yet.
Sometimes the most useful thing on a chart isn't the candle that looks exciting. It's the numbers that remind you to slow down.
When ETH makes these small rebounds after a heavy drop, do you watch the short timeframe or step back and zoom out?
#ETH #SmartCryptoMedia
The daily number is green. +0.33%.
Then I looked at the other numbers.
$1,681.75 price. The MA60 sits at $1,688.52. Seven-day performance is -13.69%, while the 30-day figure is -32.53%.
That's a very different mood from the small green number at the top.
I think this is where it's easy to become emotionally attached to the timeframe you're watching. If you're looking at the last few candles, a bounce can feel like a recovery.
Zoom out, and the damage becomes harder to ignore.
I'm not saying ETH can't recover. I just don't think this screenshot gives enough evidence to call a trend reversal yet.
Sometimes the most useful thing on a chart isn't the candle that looks exciting. It's the numbers that remind you to slow down.
When ETH makes these small rebounds after a heavy drop, do you watch the short timeframe or step back and zoom out?
#ETH #SmartCryptoMedia