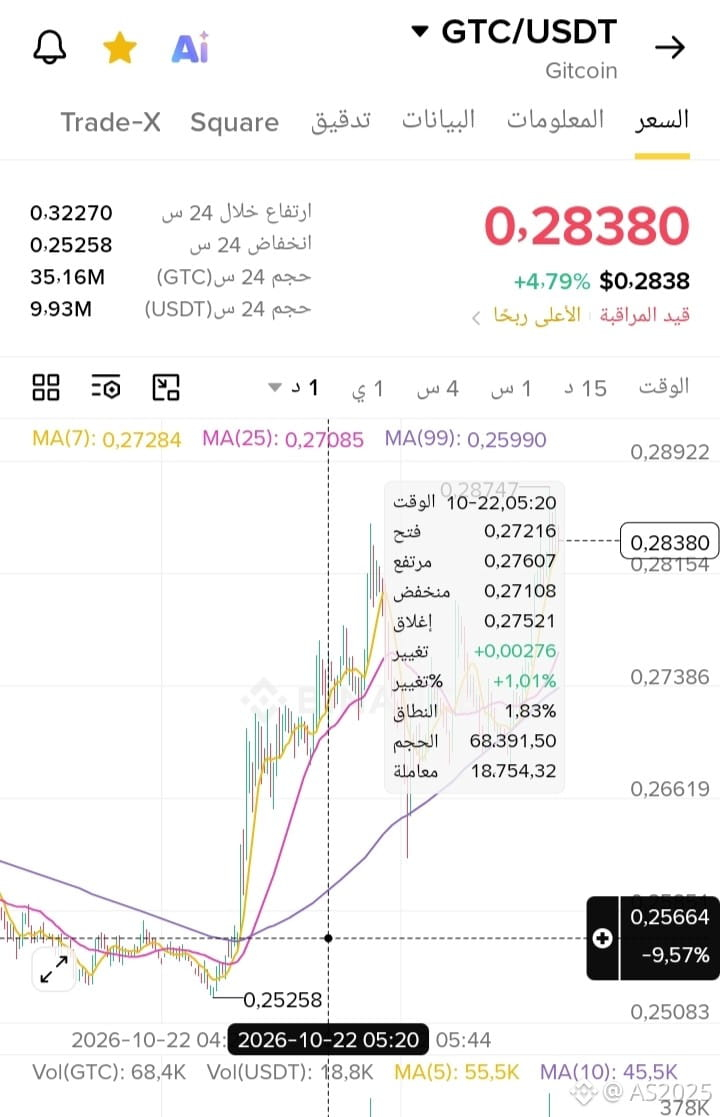
*$GTC (Gitcoin) - Instant analysis at $0.28479:*
*-5.57% today* - Correction after the explosive rally
*Support and resistance - live data:*
- *$0.28479 you are here* - Below EMA-99 at $0.289, broke below the Lower Bollinger Band at $0.259, and is trying to bounce
- *First resistance R1: $0.289 - $0.298* (+1.5% to +4.7%) - EMA-99 + daily 38.2% Fibonacci - Needs to close above this range to stop the bleeding
- *Second resistance R2: $0.3227 - $0.3368* (+13.5% to +18.5%) - Today's high + strong first resistance - Target if it bounces
- *Third resistance: $0.38 - $0.393* (+33% to +38%) - October high after the Upbit listing - The explosive rally's all-time high
- *First support S1: $0.2567 - $0.2525* (-9.7% to -11%) - First support + today's low - RSI-6 hit 14.7, deeply oversold, and bounced
- *Strong second support S2: $0.1911 - $0.1945* (-32% to -31%) - October 17 low + strong MA - If it breaks $0.25, it will drop to this level
- *Third support S3: $0.143 - $0.064* (-49% to -77%) - All-time low of $0.064 on June 30, then it exploded +482% to $0.393
*Technical picture:*
GTC soared *+214% in a month* from $0.083 to $0.393 due to months of accumulation at $0.0636-$0.115, a break above the downtrend + Golden Cross on October 1, and the Upbit KRW+USDT listing on October 12 (10x volume). Now it's correcting -11% from yesterday and -23% from the $0.3838 peak - classic sell-the-news behavior. RSI was neutral at 58.9, MACD was negative at -0.0123, and all EMAs (7/25/99) are trending down = *short-term bearish* despite the long-term Golden Cross.
*Quick plan at $0.28479:*
- Stop loss: *$0.2525 (-11.3%)* below today's low - if it breaks, it could slide to $0.19
- Target 1: *$0.298 (+4.7%)* - Bounce to EMA-99, sell a portion
- Target 2: *$0.3368 (+18%)* - Strong resistance
- Target 3: *$0.393 (+38%)* - Explosive rally peak
$GTC