

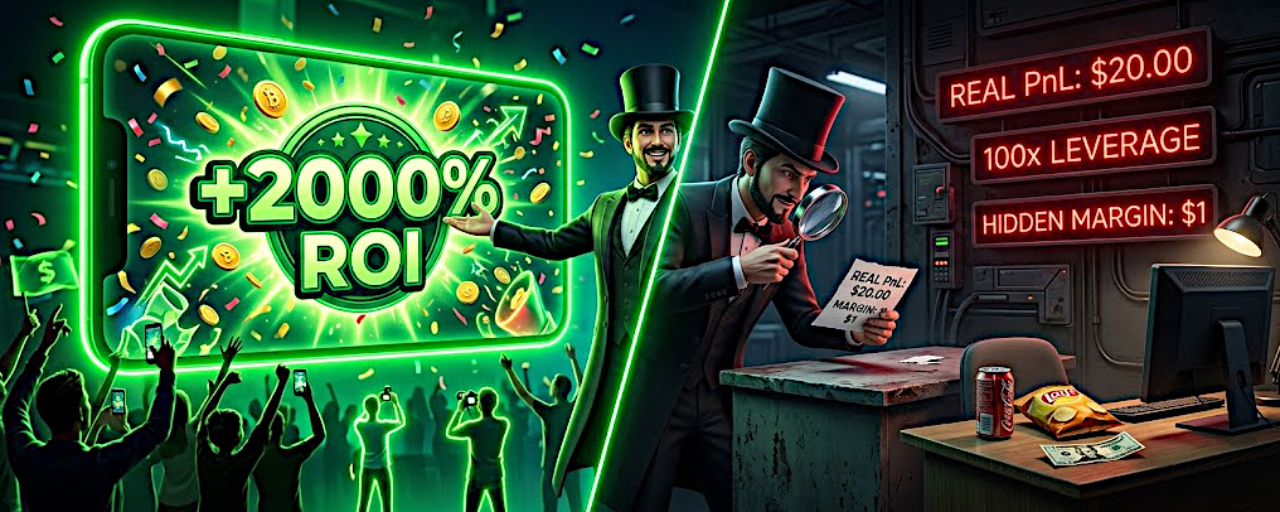

Everyone who has ever opened crypto social media has choked on their own saliva at the sight of dazzling green badges: “+2500% ROI”, “+5000% on futures in 10 minutes!”. The authors of these posts present themselves as reincarnated Wall Street geniuses, while the comments gather hundreds of admiring viewers with questions like: “Bro, what channel should I join?”, “What leverage are you using?”, “Take me to your training!”.
But if you strip away all this media gloss and turn on a plain school calculator, it turns out that behind those cosmic percentages, there’s often just clean profit that barely covers a bag of chips and a cheap branded soft drink.
Let’s break down the three main focuses of the financial illusionists from the feed and figure out how this magic works.
1. The magic of 100x leverage and $1 margin
The main secret of the “masters with super-profits” lies in how exchanges calculate ROI (Return on Investment). ROI shows the percentage increase exclusively relative to the allocated margin, not your entire deposit.
Psychology: A beginner sees proud +2000% and subconsciously matches the number to their own thousand dollars, imagining an instant purchase of a used sports car for $20,000.
Reality: The “feed guru” opens a trade with 100x leverage for a huge amount of $1 (one dollar). When the coin’s price makes just a tiny 2% move in the right direction, the exchange card cheerfully draws green +200% ROI. And if the price jumps by 20%, we get those same viral +2000% ROI. The real profit in your pocket, meanwhile, is exactly $20. But the author of the screenshot, of course, modestly smudges the absolute dollar amount with a finger or crops it out.
2. The “mushroom mycelium” method: Survivor’s syndrome
How to churn out beautiful screenshots every day without even knowing how to analyze a chart? Easy—we work by area.
Psychology: Followers are left with the illusion that the author literally predicts the future and takes profit with every little market hiccup.
Reality: The “analyst” opens a grid of 30–40 micro-positions on the most vicious shitcoins with 50x–100x leverage for symbolic pennies. 35 positions quietly and silently get liquidated (burning about a dollar each), while 2–3 positions randomly catch an impulsive pump and paint beautiful +1500% ROI. And guess which two screenshots will fly to social media with a pompous caption: “Another flawless profit grab using my secret method”?
3. Real PnL versus attention-grabbing pictures
ROI percentage without stating the real margin size and total deposit is an absolutely meaningless metric created purely for entertainment.
Example A (Plot for social media): A trader entered with $2 using 100x leverage and took +1000% ROI. Real profit: +$20. (But the picture looks like a million).
Example B (Systematic work): A trader entered with $10,000 using 3x leverage, strictly following risk management, and took a modest +15% ROI. Real profit: +$1500. (The picture is boring; schoolkids in the comments won’t be impressed).
Which of them actually makes a living from trading, and which just collects a set of tempting reports to attract gullible followers — rhetorical question.
Voice of reason:
Don’t let someone else’s green chart images make you feel inadequate and push you into overleveraging.
Look at absolute PnL in USD: ROI percentages don’t get cashed at the supermarket register. Evaluate any trading system only by the real increase in capital in dollars over the distance.
Ignore 100x leverage: The higher the leverage on the screenshot, the closer an instant auto-liquidation is with the slightest price movement against you. 100x leverage is for a circus show, not for preserving savings.
Demand distance: A one-time screenshot with +1000% means absolutely nothing. The real measure of professionalism is a statement over 6–12 months across all market phases and a reasonable Risk/Reward.
#Трейдинг #BinanceSquare #ПсихологияТрейдинга #УправлениеРисками #Write2Earn