
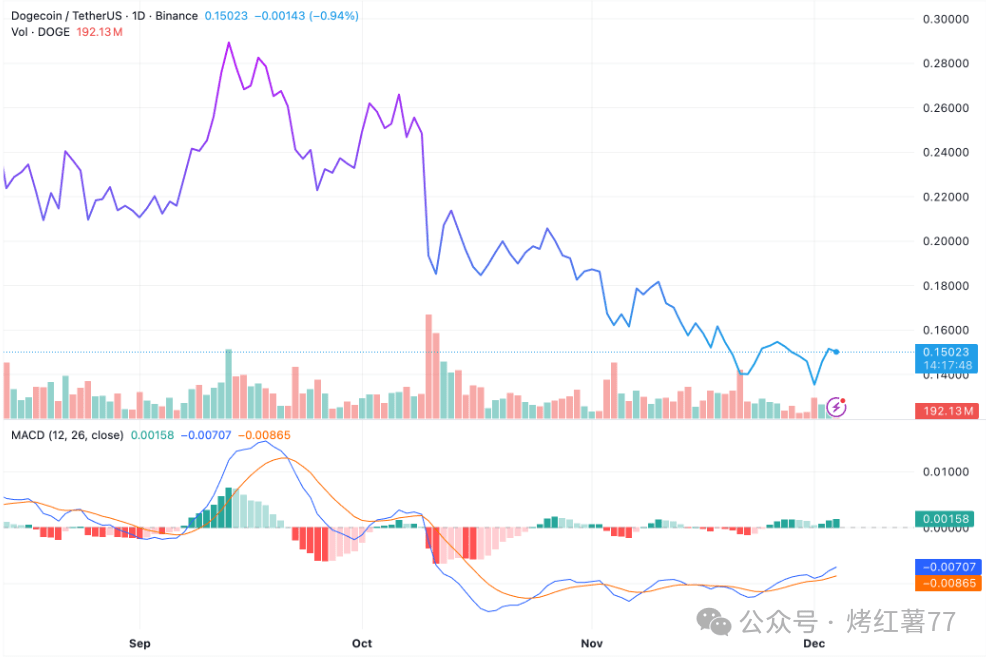
In the past 30 days, Dogecoin has been a 'slow decline player' - with consecutive lower highs and lows, the movements are compact and regular, causing quite a bit of anxiety for holders. But don't worry, the technical indicators are quietly releasing reversal signals: cryptocurrency commentator Clifton Fx's latest analysis points out that Dogecoin's downward trend is about to end, and a 'descending wedge' pattern is brewing. Once a successful breakout occurs, a 96% surge is expected!
🔍 What is a 'descending wedge'? A hidden signal of reversal
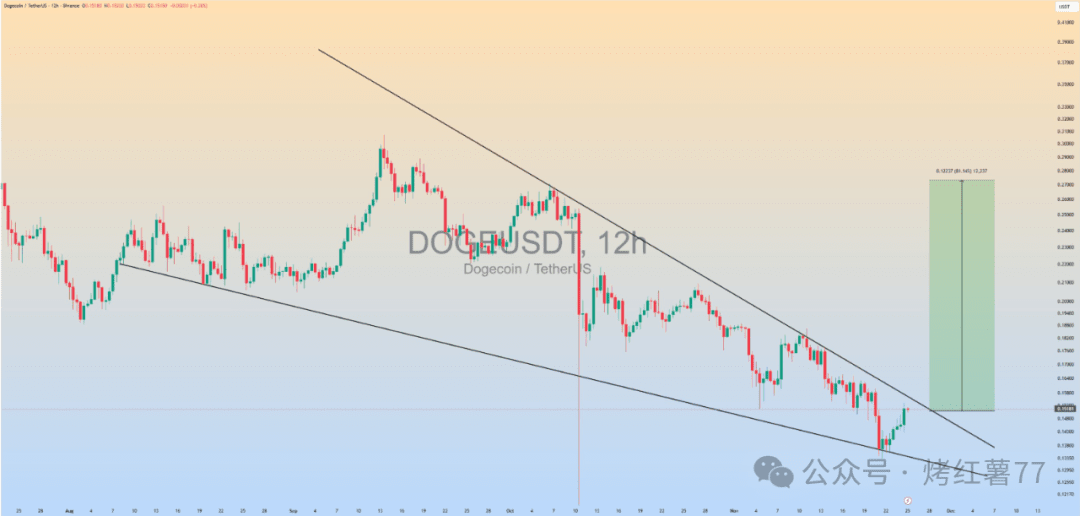
Open the Dogecoin 12-hour price chart, and you can clearly see two downward sloping trend lines gradually 'converging' - this is what analysts refer to as a 'descending wedge'. This pattern is quite distinctive: the price fluctuates as if being 'wrapped', with each rebound becoming weaker, and the distance between the two trend lines is also narrowing.
Don't be misled by its formation in a downtrend; it actually hides the mystery of reversal! The narrower the wedge narrows, the more it indicates that the selling power is continually depleting, while the buying side is secretly accumulating energy. Clifton Fx explains: 'Dogecoin has approached the upper boundary of the wedge and has attempted to break through multiple times, which is an early signal that momentum is about to switch.'
📈 48 hours of rebound power, approaching key resistance line
The good news is that Dogecoin has already started moving! After hitting a low of $0.135, in the past 48 hours, the 12-hour K-line has consecutively closed with green bullish candles, rebounding and approaching the upper boundary resistance line of the wedge. Now, Dogecoin's fate hangs on this resistance line — whether it can enter a skyrocketing mode depends entirely on whether it can successfully break through!
Analysts emphasize: 'If a strong breakout K-line appears during the breakthrough, it means that the descending wedge pattern is complete, and Dogecoin's upward channel is officially opened.' But there is a key prerequisite: the breakthrough must have 'real strength,' preferably accompanied by a simultaneous increase in trading volume, which can prove that the buyers are genuinely strong, rather than just a 'feint.'
🚀 How does a 96% increase come about? Technical patterns provide the answer
Why do we say it can rise by 96% after a breakthrough? This is not without basis! In technical analysis, the 'height' of a descending wedge is key — the vertical range that the pattern spans is an important reference for the rebound amplitude after the breakthrough. From the chart shared by Clifton Fx, this wedge pattern has enough vertical space, and once the breakthrough is successful, the price is expected to soar by 96% from the current level.
However, do not be blindly optimistic! Dogecoin has been under pressure for several weeks, and if there is insufficient momentum during the breakthrough, it could easily lead to 'failure.' If the breakthrough strength weakens, the price may 'fall short' in front of the resistance line and fall back to the support level at the lower boundary of the wedge — currently, this support level is around $0.135.
⚠️ Key reminder: A breakthrough is the true signal
Currently, Dogecoin is like an arrow fully drawn, just waiting for a 'breakthrough' signal. But remember: a breakthrough without strong momentum and volume is likely a 'false breakthrough.' If it can successfully stabilize above the resistance line, a 96% increase expectation will have a solid foundation; but if it cannot break through, it will likely return to the support level and continue to fluctuate.
For holders, the most important signals to watch right now are 'breakthrough + volume increase.' Once satisfied, Dogecoin may break free from the shadow of consecutive declines and initiate a surprising rebound market~#DogeETF
