What is the Stock to Flow model?
Simply put, the Stock to Flow (SF or S2F) model is a way to measure the abundance of a particular resource. Where Stock is the reserve and Flow is the flow. The Stock to Flow ratio is calculated as total reserves divided by annual produced flow.
The Stock to Flow model is often applied to natural resources. Let's take the example of gold. Although estimates vary, the World Gold Council estimates that approximately 190,000 tons of gold have been mined. This quantity (ie total supply) is called reserves. Meanwhile, about 2,500-3,200 tons of gold are mined each year. This quantity is called traffic.
We can calculate the Stock to fFlow ratio using these two units of measurement. But really, what does it mean? Essentially, for a given resource, it shows how much supply enters the market each year compared to the total supply. The higher the Stock to Flow ratio, the less new supply entering the market compared to the total supply. Thus, in theory, an asset with a higher Stock to Flow ratio will retain good value in the long term.
In contrast, consumer goods and industrial goods will often have a low Stock to Flow ratio. Why so? Because their value often comes from their destruction or consumption, and inventory often depends on the quantity consumed. These resources are not necessarily highly valuable as assets, so they are not suitable as investment assets. In some special cases, the prices of these goods may increase rapidly if there is a prediction of a future supply shortage. But usually this supply always follows demand.
Note, not all scarce resources are valuable. Gold is an example, and the existing gold reserves are 190,000 tons! According to the Stock to Flow ratio, gold is valuable because annual production relative to current reserves is relatively small and constant.
What is the Stock to Flow ratio of gold?
Historically, gold has had the highest Stock to Flow ratio of any precious metal. But how much exactly? Going back to the previous example, dividing the total supply of 190,000 tons by 3,200 gives us a Stock to Flow ratio of ~59 for gold. This tells us that: At current production rates, it would take approximately 59 years to mine 190,000 tons of gold.
Note, the volume of gold mined each year is usually an estimate. If we increase the annual production (flow) to 3,500, the Stock to Flow ratio will decrease to ~54.
So, why don't we also calculate the total value of all the gold that has been mined? In some ways, this is quite similar to calculating the total market capitalization of the cryptocurrency market. For example, if we take a price of about $1,500 per troy ounce of gold, the total value of all the gold in the world is about $9 trillion. It sounds like a lot, but if you put all the gold into one block, that block could only fit a football field!
Similarly, the total peak value of the Bitcoin network was around $300 billion at the end of 2017 and is hovering around $120 billion at the time of this writing.
Stock to Flow and Bitcoin
If you understand how Bitcoin works, you won't find it difficult to understand why the Stock to Flow model can be applied to Bitcoin. Essentially, in this model, Bitcoin is also equated with scarce commodities, like gold or silver.
Gold and silver are often referred to as stores of value. In theory, they retain their value over a long period of time due to their scarcity and low traffic. Furthermore, it is difficult to significantly increase their supply in a short period of time.
According to supporters of the Stock to Flow model, Bitcoin can be considered a resource because it is scarce, expensive to create, and has a maximum supply limited to 21 million units. Additionally, new Bitcoin supply is determined at the protocol level, making traffic completely predictable. You may have heard of the Bitcoin split event. Accordingly, the amount of new Bitcoin supply entering the system will decrease by half every 210,000 blocks (about four years).

Mined BTC Total Supply (%) and Block Subsidy (BTC).
For proponents of this model, it is these properties that make Bitcoin a digital resource, scarce and extremely potential to retain value in the long term. Additionally, they argue that there is a statistically significant relationship between Stock to Flow and market value. According to the model's predictions, the price of Bitcoin will increase significantly over time due to the continuous decrease in the Stock to Flow ratio.
There is an opinion that applying the Stock to Flow model to Bitcoin is said to be the idea of blogger PlanB with the article Modeling the value of Bitcoin using scarcity.
What is Bitcoin's Stock to Flow Ratio?
Currently, Bitcoin's circulating supply is around 18 million units. Meanwhile, new supply is about 0.7 million VND per year. At the time of writing, Bitcoin's Stock To Flow ratio is hovering around 25. After the next fork in May 2020, this ratio will increase to around 50.
In the image below, you can see the historical relationship between Bitcoin's 365-day Stock to Flow moving average and its price. The chart also shows the dates of Bitcoin splits on the vertical axis.
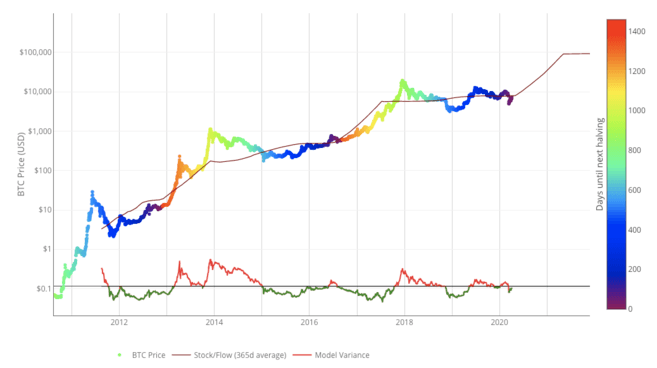
Stock-to-Flow Model for Bitcoin. Source: LookIntoBitcoin.com
Looking to get started with cryptocurrency? Buy Bitcoin now at Binance!
Limitations of the Stock to Flow model
Stock to Flow is a useful model for measuring scarcity, but it doesn't account for all of the problems in the aggregate. The strength of this model is that the assumptions are quite clear. Stock to Flow's value model assumes measurable scarcity, which in turn drives value. Many experts believe that using the Stock to Flow model will be a failure if Bitcoin does not have any useful value other than supply scarcity.
Gold's scarcity, predictable flow, and global liquidity have made it a relatively stable store of value compared to fiat currencies, which are susceptible to devaluation.
According to this model, Bitcoin's volatility should also decrease over time. This is confirmed by historical data from Coinmetrics.
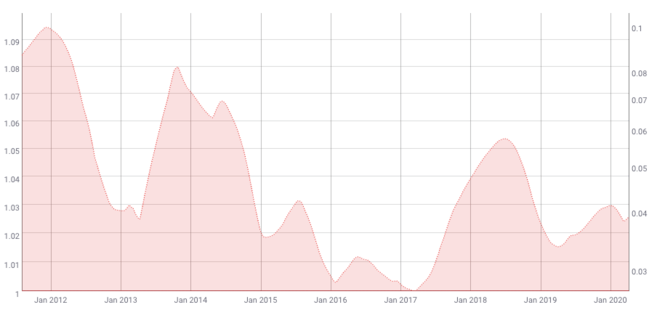
200-Day Moving Average of Bitcoin's 180-Day Price Volatility. Source: Coinmetrics.io
Valuing an asset requires taking into account its price fluctuations. If price movements are predictable to some degree, the pricing model is likely to be more reliable. However, Bitcoin is famous for its large price fluctuations.
On a macro level, price volatility may be decreasing, but Bitcoin is priced in a free market to begin with. This means that prices are mostly self-adjusting on the open market by users, traders and speculators. Combined with its relatively low liquidity, Bitcoin is potentially more susceptible to sudden price fluctuations than other assets. So the Stock to Flow model may not account for these things.
There are also other fluctuations, such as Black Swan economic events, that could also weaken this model. However, it should be noted that any model that attempts to predict the price of an asset based on historical data may actually have shortcomings. A Black Swan event, by definition, always has an element of surprise. Therefore, historical data cannot be used to account for unknown events.
Conclude
The Stock to Flow model measures the relationship between the available reserves of a resource and its production rate. This model is often applied to precious metals and other commodities, but some argue that it can also be applied to Bitcoin.
In this sense, Bitcoin can be seen as a scarce digital resource. According to this method of analysis, Bitcoin's unique properties could make it a long-term store of value.
However, the Stock to Flow model may not take into account all aspects of Bitcoin pricing. Furthermore, at the time of this article, Bitcoin has only been around for a little over ten years. Some argue that long-term pricing models like Stock to Flow need a larger data set for reliable accuracy.


