
Written by: Jack Inabinet
Compiled by: TechFlow

In November, the main theme of cryptocurrency was centered around concerns about the fate of crypto: a top-three cryptocurrency exchange, valued at $32 billion in June, collapsed overnight; a major cryptocurrency lending platform also collapsed.
However, ETH failed to create a new cycle low!
Cryptocurrencies’ surprising resilience despite market turmoil has also made us ponder an age-old question: Is this the end?
Inflation is falling, the Fed appears to be getting less hawkish, and global conflicts may be easing slightly. So, what does on-chain offer to support this bullish narrative?
Today we will examine 5 on-chain signals that indicate a “bottom.”
1. Rising yields
Total yield in DeFi has been rising since bottoming on June 9.

Ethereum reached its cycle low a week and a half later on June 18th.

The rise in yields from June 9 to 18 reflected the increased borrowing demand for crypto assets by users opening short positions. After that, the seven-day moving average yield peaked locally on June 19.
Unlike traditional financial markets, where yields on debt instruments, from mortgages to commercial paper to U.S. Treasuries, are primarily driven by macroeconomic interest rate conditions and the Federal Reserve’s interest rate targets, returns on cryptocurrencies are generated by demand for assets.
Higher DeFi yields are generally associated with higher crypto asset prices.
Why? Individuals and institutions primarily borrow to gain leverage or implement market making or other yield-generating strategies. Higher yields mean that borrowers are willing to pay a higher cost of capital, indicating that borrowers are better capitalized overall. In addition, higher borrowing yields indicate that borrowers are turning to a more risk-focused investment approach, which is good for risky asset classes such as cryptocurrencies.
2. Rebalancing of Curve Pools
Remember when FTX collapsed, Alameda allegedly shorted USDT, causing it to break the peg.

This move by Alameda and the resulting flows of funds from related parties reduced demand for USDT while increasing its supply, causing the peg to drop below $1. As a result of this sudden supply-demand mismatch, Curve’s 3Pool, arguably the most important and liquid stablecoin exchange in decentralized finance, began to see an increase in the proportional balance of USDT compared to DAI and USDC.
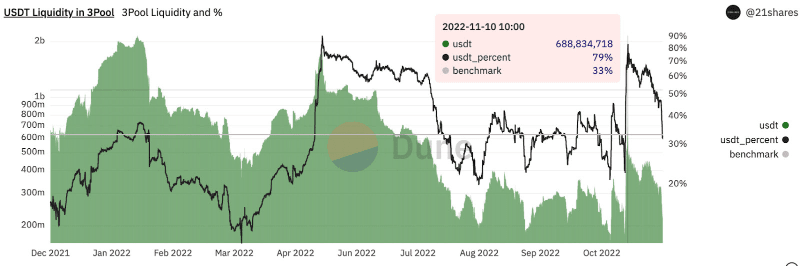
The increase in supply from short selling activity, selling pressure from associated holders, and lack of demand to absorb the increased supply increased the proportion of USDT in 3Pool.
During market crashes, stablecoin balances often fluctuate from the target level of 1:1:1 between USDT/USDC/DAI. Recent USDT inflows have brought the pool to the desired level, with 38% of Curve 3Pool consisting of USDT, and 31% each in USDC and DAI. The stability of Curve 3Pool, especially after periods of extreme volatility, shows confidence in the support of major stablecoins.
3Pool As a barometer of fear in the industry, the rebalancing of USDT balances is a bullish on-chain signal.
While the ratio between USDT, USDC, and DAI in 3Pool is still subject to rapid fluctuations, the stability of this ratio suggests that the market is looking forward to calm or positive conditions in the near term.
3. Negative funding rates, but stable prices
The funding rate keeps the price of the perpetual futures aligned with the spot price of the tracked asset.
When short positions are too large, the price of the perpetual contract will be lower than the price of the underlying asset. In this case, short users compensate longs through the funding rate. When the futures price is higher than the spot price of the underlying, longs will pay shorts through the funding rate. This mechanism encourages the tool to track the spot price of the asset.

Throughout November, BTC funding rates were largely negative across all major exchanges tracked by The Block. Generally speaking, a positive funding rate means positive funding action, and a negative funding rate means negative price action.
However, the combination of persistently negative funding rates and stable market pricing provides hope to bulls, showing the market’s resistance to further drawdowns despite unusually high selling pressure on crypto assets.
4. Volatility levels normalize
After peaking at $126.02 during the FTX crash on Nov. 9, the Crypto Volatility Index (CVI) — TradFi’s S&P 500-tracking counterpart to the cryptocurrency solution — has been declining to reach a baseline level of $80.71.

Similar to the VIX, highs in the CVI are often associated with adverse market conditions. Today, the CVI is trading at similar levels to where ETH formed a potential cycle bottom in June-July of this year.
Volatility and uncertainty in the crypto market must decrease for a bottom to form. Low CVI readings confirm this low volatility.
If a bottom is truly in place, we would expect CVI to continue to fall, just as it did before November 7th.
5. Smart money stablecoin holdings decline
Smart money allocations to stablecoins peaked at 38% on November 9 before declining.

Over the rest of November, smart money transitioned from a higher concentration of stablecoins in portfolios to today’s levels, where stablecoins currently make up 27% of smart money wallet balances.
Just like stablecoin holders sold Tether, crypto asset holders turned to holding stablecoins when the future value of crypto assets was questioned.
Investing in stablecoins allows crypto holders to mitigate risk and limit potential portfolio drawdowns while keeping funds on-chain and enabling whales to easily redeploy capital when they become more responsive to market conditions.
Although most of the smart money portfolio is still stablecoins, just like when ETH rebounded to $3.5,000 in April this year, their stablecoin holdings hit a level below 9%. Before the bottom is fully formed, smart money will reduce its allocation to stablecoins. Currently, the data is trending towards the bullish area.
Original link


