

#meme
meme
17.7M views
32,185 Discussing
Hot
Latest

·
--
The meme sentiment curve: where are we today?
For sentiment to be recovering, there needs to be a price move. Otherwise, it's just chatter.
Measure sentiment by price changes, not by buzz in the group chat.
WIF 0.1794 (+0.90%), DOGE 0.0771 (-0.23%), BONK 0.00000302 (-0.33%), SHIB 0.00000486 (-0.41%)
For comparison: BTC 80019 (24h -0.73%).
WIF is the strongest meme coin at +0.90%, but it hasn't pulled away from BTC (-0.73%). If it hasn't pulled away, it's not a market trend—just volatility.
The meme switch is BTC: unless it gets above 80845, I won't treat gains in small coins as a sector move.
Data: Binance spot 24h / Binance USDⓈ-M / Yahoo daily (5-day change) / altme_fng / mempool_fees / defillama_chains / coingecko_trending. Missing numbers are not filled in.
Would you dare to add to your position at this funding rate?
#meme #Sentiment
Takeaway: Tokens that have been trading for less than 24 hours can get crushed if the top 10 holders are too concentrated.
Idea: If the funding rate turns positive and the long/short ratio is >1.15, call it crowded—not a reason to chase.
Data card (same update as the main text; missing values shown as dashes):
BTC 80,019 -0.73% Binance spot 24h
ETH 2,315 -1.56% ETH/BTC 0.02893
S&P 500 7,675 -0.20% Yahoo 5-day
Nasdaq 26,179 -0.95% Yahoo 5-day
Dollar 102 +0.17% DXY 5-day
VIX 18.42 +6.41% Yahoo
Funding rate 0.0100% Open interest 7.57B (24h +0.79) Long/short 2.1878 Binance USDⓈ-M
Personal opinion; figures are from the sources listed in the main text. Not a trading instruction.
$DOGE $PEPE $BTC
The meme sentiment curve: where are we today?
For sentiment to be recovering, there needs to be a price move. Otherwise, it's just chatter.
Measure sentiment by price changes, not by buzz in the group chat.
WIF 0.1794 (+0.90%), DOGE 0.0771 (-0.23%), BONK 0.00000302 (-0.33%), SHIB 0.00000486 (-0.41%)
For comparison: BTC 80019 (24h -0.73%).
WIF is the strongest meme coin at +0.90%, but it hasn't pulled away from BTC (-0.73%). If it hasn't pulled away, it's not a market trend—just volatility.
The meme switch is BTC: unless it gets above 80845, I won't treat gains in small coins as a sector move.
Data: Binance spot 24h / Binance USDⓈ-M / Yahoo daily (5-day change) / altme_fng / mempool_fees / defillama_chains / coingecko_trending. Missing numbers are not filled in.
Would you dare to add to your position at this funding rate?
#meme #Sentiment
Takeaway: Tokens that have been trading for less than 24 hours can get crushed if the top 10 holders are too concentrated.
Idea: If the funding rate turns positive and the long/short ratio is >1.15, call it crowded—not a reason to chase.
Data card (same update as the main text; missing values shown as dashes):
BTC 80,019 -0.73% Binance spot 24h
ETH 2,315 -1.56% ETH/BTC 0.02893
S&P 500 7,675 -0.20% Yahoo 5-day
Nasdaq 26,179 -0.95% Yahoo 5-day
Dollar 102 +0.17% DXY 5-day
VIX 18.42 +6.41% Yahoo
Funding rate 0.0100% Open interest 7.57B (24h +0.79) Long/short 2.1878 Binance USDⓈ-M
Personal opinion; figures are from the sources listed in the main text. Not a trading instruction.
$DOGE $PEPE $BTC
For sentiment to be recovering, there needs to be a price move. Otherwise, it's just chatter.
Measure sentiment by price changes, not by buzz in the group chat.
WIF 0.1794 (+0.90%), DOGE 0.0771 (-0.23%), BONK 0.00000302 (-0.33%), SHIB 0.00000486 (-0.41%)
For comparison: BTC 80019 (24h -0.73%).
WIF is the strongest meme coin at +0.90%, but it hasn't pulled away from BTC (-0.73%). If it hasn't pulled away, it's not a market trend—just volatility.
The meme switch is BTC: unless it gets above 80845, I won't treat gains in small coins as a sector move.
Data: Binance spot 24h / Binance USDⓈ-M / Yahoo daily (5-day change) / altme_fng / mempool_fees / defillama_chains / coingecko_trending. Missing numbers are not filled in.
Would you dare to add to your position at this funding rate?
#meme #Sentiment
Takeaway: Tokens that have been trading for less than 24 hours can get crushed if the top 10 holders are too concentrated.
Idea: If the funding rate turns positive and the long/short ratio is >1.15, call it crowded—not a reason to chase.
Data card (same update as the main text; missing values shown as dashes):
BTC 80,019 -0.73% Binance spot 24h
ETH 2,315 -1.56% ETH/BTC 0.02893
S&P 500 7,675 -0.20% Yahoo 5-day
Nasdaq 26,179 -0.95% Yahoo 5-day
Dollar 102 +0.17% DXY 5-day
VIX 18.42 +6.41% Yahoo
Funding rate 0.0100% Open interest 7.57B (24h +0.79) Long/short 2.1878 Binance USDⓈ-M
Personal opinion; figures are from the sources listed in the main text. Not a trading instruction.
$DOGE $PEPE $BTC

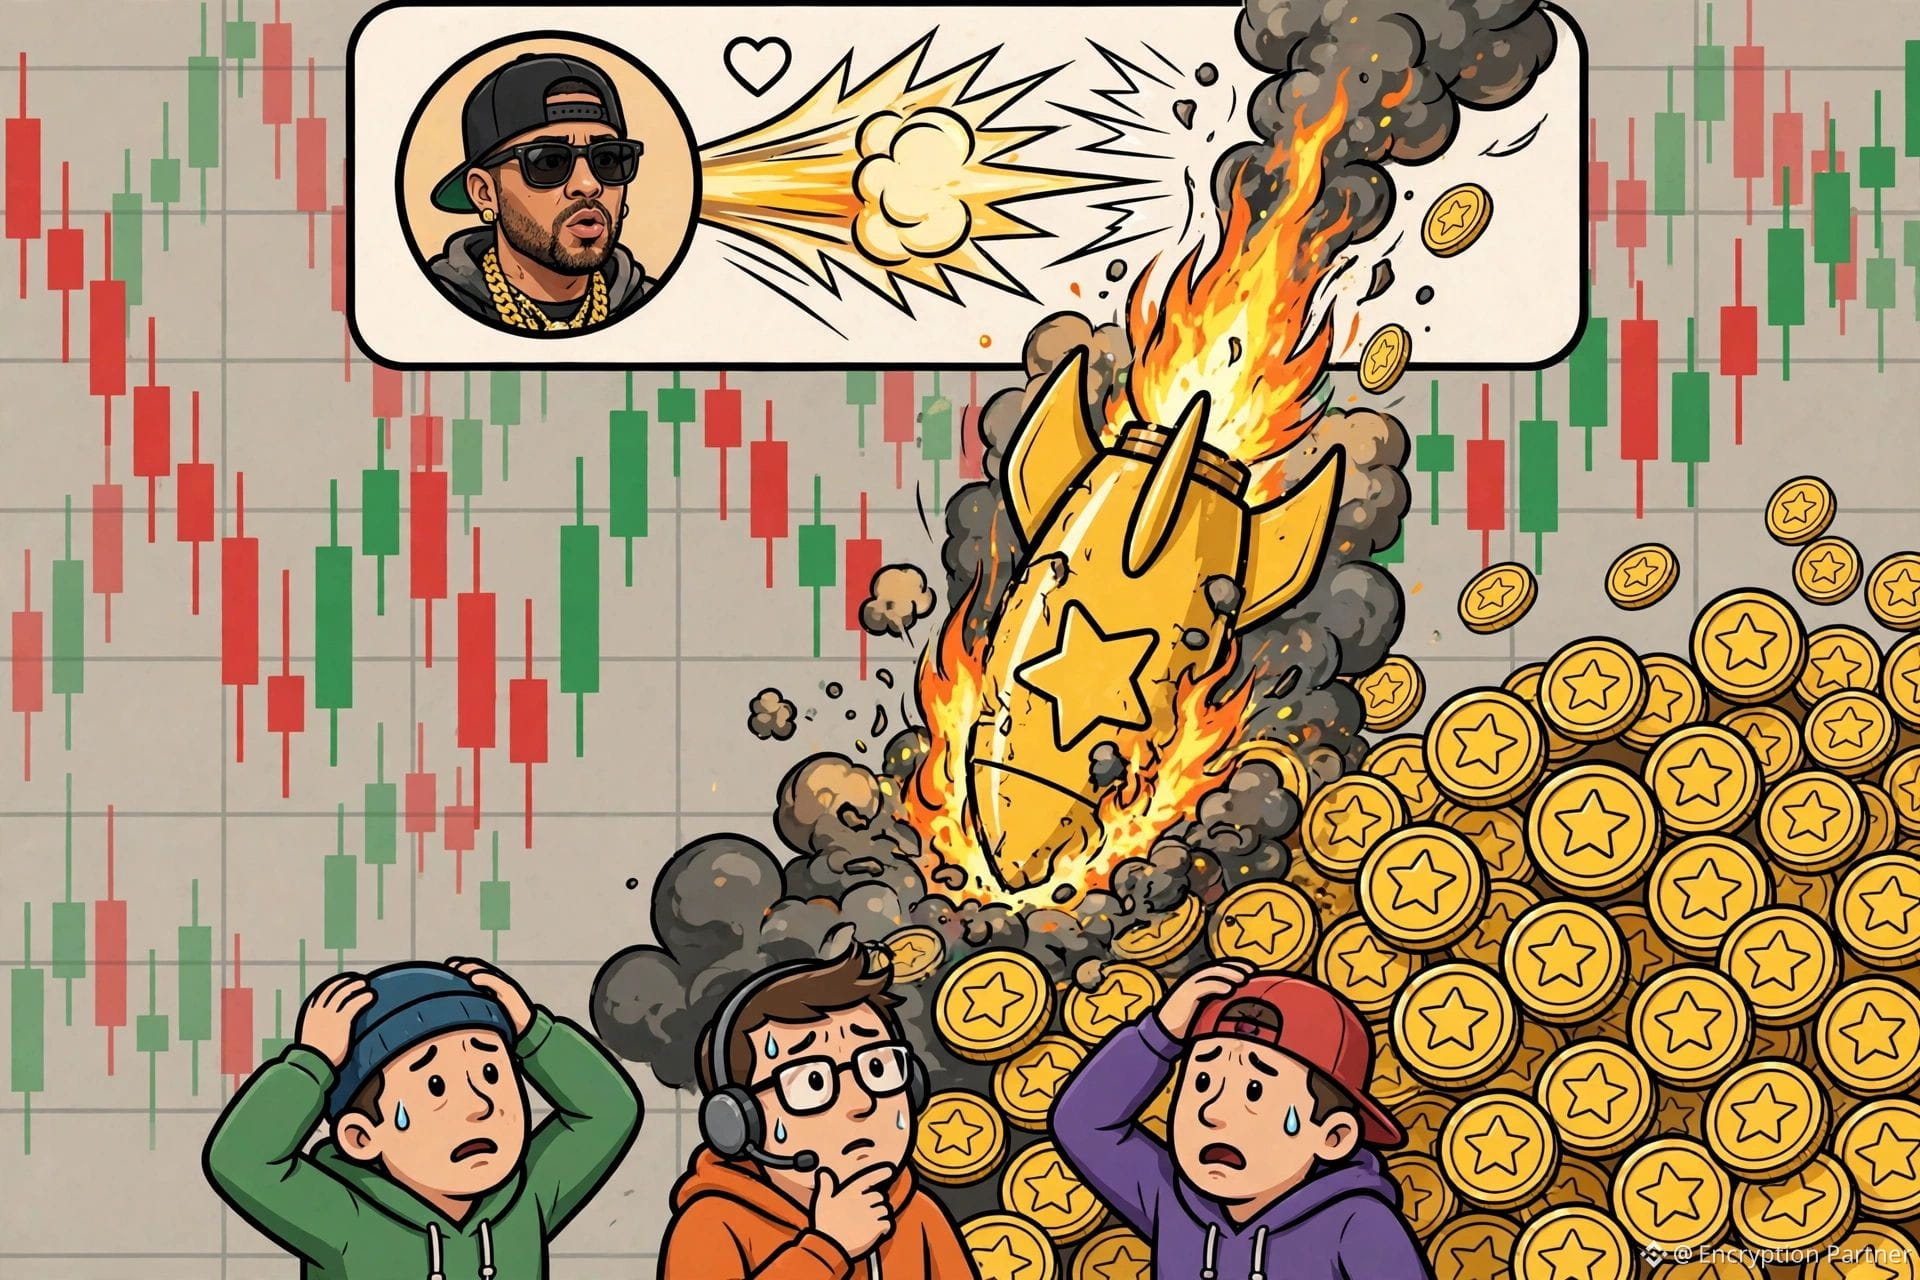
After more than a year of silence, rapper Playboi Carti’s X account, with 3.6 million followers, suddenly posted a Pump.fun link late Sunday night. CARTI surged 18,535% in its first hour, briefly reaching a market cap of $1.2 million—then got rugged. The most active pair saw $4.09 million in 24-hour trading volume, while the price actually fell 64%.
Even crazier, within hours more than 20 copycat tokens with the same name popped up, copying the name and avatar wholesale, just waiting for people searching the name to buy the wrong contract.
A harsh take: The account getting hacked isn’t undeserved; what’s undeserved is sympathy for people who rushed in despite knowing there was no official announcement. Pick a side in the comments: A. The hacker deserves to die. B. Anyone rushing into a copycat token has only themselves to blame.
$SOL $PUMP #meme #AccountHacked
After more than a year of silence, rapper Playboi Carti’s X account, with 3.6 million followers, suddenly posted a Pump.fun link late Sunday night. CARTI surged 18,535% in its first hour, briefly reaching a market cap of $1.2 million—then got rugged. The most active pair saw $4.09 million in 24-hour trading volume, while the price actually fell 64%.
Even crazier, within hours more than 20 copycat tokens with the same name popped up, copying the name and avatar wholesale, just waiting for people searching the name to buy the wrong contract.
A harsh take: The account getting hacked isn’t undeserved; what’s undeserved is sympathy for people who rushed in despite knowing there was no official announcement. Pick a side in the comments: A. The hacker deserves to die. B. Anyone rushing into a copycat token has only themselves to blame.
$SOL $PUMP #meme #AccountHacked
Even crazier, within hours more than 20 copycat tokens with the same name popped up, copying the name and avatar wholesale, just waiting for people searching the name to buy the wrong contract.
A harsh take: The account getting hacked isn’t undeserved; what’s undeserved is sympathy for people who rushed in despite knowing there was no official announcement. Pick a side in the comments: A. The hacker deserves to die. B. Anyone rushing into a copycat token has only themselves to blame.
$SOL $PUMP #meme #AccountHacked
7
·
--
🔥 BSC New Launch Review · 10/26
New launches were quiet today, and only one made the cut: a Flap version in the Agent sector.
———
🤖 7AGENT · Binance Agent
Flap · Agent narrative
📖 Narrative
After 4AGENT launched on Four.meme at 14:00 yesterday, 7AGENT went live on Flap at 19:11, directly naming itself Binance Agent and making it clear it aimed to be an “Agent coin on Flap.”
That same day, Binance Wallet announced that Agent ID claims had surpassed 100,000. The Agent topic itself is heating up, so the community started discussing 4AGENT and 7AGENT as a comparison between the Four and Flap platforms.
@0xLUFFT said, “7AGENT is a proxy war, not an official Binance coin.” Today, many accounts on X could also be seen copying the same promotional text, while @IZp3ddsqzk63818 questioned claims previously circulating about “grassroots promotion” and “Yi He following it.” The discussion has attracted attention, but is also contentious.
📊 Current market cap: $172K | Peak: $230K
⭐⭐ Moderate buzz, mainly driven by the Four vs. Flap narrative
———
Data: Binance Web3 + X, as of 23:45 (Beijing Time)
Personal observations only; not financial advice
#BSC #Meme #AIAgent #Flap
🔥 BSC New Launch Review · 10/26
New launches were quiet today, and only one made the cut: a Flap version in the Agent sector.
———
🤖 7AGENT · Binance Agent
Flap · Agent narrative
📖 Narrative
After 4AGENT launched on Four.meme at 14:00 yesterday, 7AGENT went live on Flap at 19:11, directly naming itself Binance Agent and making it clear it aimed to be an “Agent coin on Flap.”
That same day, Binance Wallet announced that Agent ID claims had surpassed 100,000. The Agent topic itself is heating up, so the community started discussing 4AGENT and 7AGENT as a comparison between the Four and Flap platforms.
@0xLUFFT said, “7AGENT is a proxy war, not an official Binance coin.” Today, many accounts on X could also be seen copying the same promotional text, while @IZp3ddsqzk63818 questioned claims previously circulating about “grassroots promotion” and “Yi He following it.” The discussion has attracted attention, but is also contentious.
📊 Current market cap: $172K | Peak: $230K
⭐⭐ Moderate buzz, mainly driven by the Four vs. Flap narrative
———
Data: Binance Web3 + X, as of 23:45 (Beijing Time)
Personal observations only; not financial advice
#BSC #Meme #AIAgent #Flap
New launches were quiet today, and only one made the cut: a Flap version in the Agent sector.
———
🤖 7AGENT · Binance Agent
Flap · Agent narrative
📖 Narrative
After 4AGENT launched on Four.meme at 14:00 yesterday, 7AGENT went live on Flap at 19:11, directly naming itself Binance Agent and making it clear it aimed to be an “Agent coin on Flap.”
That same day, Binance Wallet announced that Agent ID claims had surpassed 100,000. The Agent topic itself is heating up, so the community started discussing 4AGENT and 7AGENT as a comparison between the Four and Flap platforms.
@0xLUFFT said, “7AGENT is a proxy war, not an official Binance coin.” Today, many accounts on X could also be seen copying the same promotional text, while @IZp3ddsqzk63818 questioned claims previously circulating about “grassroots promotion” and “Yi He following it.” The discussion has attracted attention, but is also contentious.
📊 Current market cap: $172K | Peak: $230K
⭐⭐ Moderate buzz, mainly driven by the Four vs. Flap narrative
———
Data: Binance Web3 + X, as of 23:45 (Beijing Time)
Personal observations only; not financial advice
#BSC #Meme #AIAgent #Flap
45

USELESS is being dragged out again and hailed as “the strongest meme of this cycle.” First, let’s see who’s doing the shouting.
The top example in the X news roundup is Bonk Guy (@theunipcs), who holds about $2.43 million worth and is up 186%, then slapped the label “cycle top memecoin” on it. Calling your own coin the strongest while sitting on a position worth over $2 million isn’t an opinion—it’s advertising your own exit price. Not saying he’s definitely going to sell, but you should know where his interests lie.
Then there’s the retail chorus below: @cryptobaddiee1 copied and pasted “useless is undervalued” nine times in one post, which got 3,485 views; @OOrangeyouhappy repeated the same line nine times and got 137 views. They can’t even be bothered to write their own copy. Their faith runs on Ctrl+V.
The numbers are right there too: a market cap of about $158 million, after a roller-coaster ride from a low of $30 million to a high of over $400 million. This whole “it always V-recovers” thing is a postmortem from the survivors. The people whose bags never bounced back stopped tweeting long ago.
It calls itself “the most honest coin” and has no utility. Fine, I’ll give it that. The coin is honest; the people shilling it aren’t. If you want to play, keep your position small and treat it as entertainment. Don’t use an influencer’s screenshot of their holdings as your reason to buy.
#USELESS #Meme
USELESS is being dragged out again and hailed as “the strongest meme of this cycle.” First, let’s see who’s doing the shouting.
The top example in the X news roundup is Bonk Guy (@theunipcs), who holds about $2.43 million worth and is up 186%, then slapped the label “cycle top memecoin” on it. Calling your own coin the strongest while sitting on a position worth over $2 million isn’t an opinion—it’s advertising your own exit price. Not saying he’s definitely going to sell, but you should know where his interests lie.
Then there’s the retail chorus below: @cryptobaddiee1 copied and pasted “useless is undervalued” nine times in one post, which got 3,485 views; @OOrangeyouhappy repeated the same line nine times and got 137 views. They can’t even be bothered to write their own copy. Their faith runs on Ctrl+V.
The numbers are right there too: a market cap of about $158 million, after a roller-coaster ride from a low of $30 million to a high of over $400 million. This whole “it always V-recovers” thing is a postmortem from the survivors. The people whose bags never bounced back stopped tweeting long ago.
It calls itself “the most honest coin” and has no utility. Fine, I’ll give it that. The coin is honest; the people shilling it aren’t. If you want to play, keep your position small and treat it as entertainment. Don’t use an influencer’s screenshot of their holdings as your reason to buy.
#USELESS #Meme
The top example in the X news roundup is Bonk Guy (@theunipcs), who holds about $2.43 million worth and is up 186%, then slapped the label “cycle top memecoin” on it. Calling your own coin the strongest while sitting on a position worth over $2 million isn’t an opinion—it’s advertising your own exit price. Not saying he’s definitely going to sell, but you should know where his interests lie.
Then there’s the retail chorus below: @cryptobaddiee1 copied and pasted “useless is undervalued” nine times in one post, which got 3,485 views; @OOrangeyouhappy repeated the same line nine times and got 137 views. They can’t even be bothered to write their own copy. Their faith runs on Ctrl+V.
The numbers are right there too: a market cap of about $158 million, after a roller-coaster ride from a low of $30 million to a high of over $400 million. This whole “it always V-recovers” thing is a postmortem from the survivors. The people whose bags never bounced back stopped tweeting long ago.
It calls itself “the most honest coin” and has no utility. Fine, I’ll give it that. The coin is honest; the people shilling it aren’t. If you want to play, keep your position small and treat it as entertainment. Don’t use an influencer’s screenshot of their holdings as your reason to buy.
#USELESS #Meme
39

·
--
BULLA surged approximately 58% in 24 hours, with Binance futures trading volume reaching $150 million, indicating a clear concentration of market interest.
But with memecoin rallies like this, it’s important to distinguish between “buzz” and “sustainability.” A high-volume surge often comes with heavy leverage, sharp wick moves, and sudden reversals in short-term sentiment. Chasing the price without a stop-loss plan can easily backfire during a pullback.
Rising futures volume doesn’t mean spot buying is strong; it may simply reflect rapid turnover between buyers and sellers amid high volatility. Consider limiting your position size and reducing leverage. Don’t mistake a short-term spike for a sustained trend.
#MEME #加密行情 #FuturesRiskManagement
BULLA surged approximately 58% in 24 hours, with Binance futures trading volume reaching $150 million, indicating a clear concentration of market interest.
But with memecoin rallies like this, it’s important to distinguish between “buzz” and “sustainability.” A high-volume surge often comes with heavy leverage, sharp wick moves, and sudden reversals in short-term sentiment. Chasing the price without a stop-loss plan can easily backfire during a pullback.
Rising futures volume doesn’t mean spot buying is strong; it may simply reflect rapid turnover between buyers and sellers amid high volatility. Consider limiting your position size and reducing leverage. Don’t mistake a short-term spike for a sustained trend.
#MEME #加密行情 #FuturesRiskManagement
But with memecoin rallies like this, it’s important to distinguish between “buzz” and “sustainability.” A high-volume surge often comes with heavy leverage, sharp wick moves, and sudden reversals in short-term sentiment. Chasing the price without a stop-loss plan can easily backfire during a pullback.
Rising futures volume doesn’t mean spot buying is strong; it may simply reflect rapid turnover between buyers and sellers amid high volatility. Consider limiting your position size and reducing leverage. Don’t mistake a short-term spike for a sustained trend.
#MEME #加密行情 #FuturesRiskManagement
3
·
--
Meme market: Which moves first, the leaders or the small caps?
If the leaders aren't seeing volume, I won't listen to a single story about small caps.
Measure sentiment by price moves, not by hype in chat groups.
WIF 0.1788 (+0.56%), DOGE 0.0767 (+0.08%), SHIB 0.00000483 (-0.62%), BONK 0.00000299 (-0.66%)
For comparison: BTC 79608 (24h -0.84%).
The strongest meme coin, WIF, is up +0.56%—it hasn't outperformed BTC (-0.84%) by much. If it hasn't pulled away, it's not a trend; it's just volatility.
If the gap between the leader and the weakest coin narrows to within 2 percentage points, independent buying has disappeared. Close the position.
Data: Binance Spot 24h / Binance USDⓈ-M / Yahoo daily (5-day change) / altme_fng / mempool_fees / defillama_chains / coingecko_trending. Missing figures are not filled in.
Would you place a limit order at the pullback level, or wait for the candle to close?
#meme #Sentiment
Useful fact: OI is the notional value of open positions, not trading volume.
Food for thought: The dollar has strengthened over 5 days while BTC is still rising—that's an independent move, but its staying power gets discounted.
Data card (same update as the main text; missing values are shown as dashes):
BTC 79,608 -0.84% Binance Spot 24h
ETH 2,304 -1.06% ETH/BTC 0.02894
S&P 500 7,652 -0.50% Yahoo 5-day
Nasdaq 26,036 -1.49% Yahoo 5-day
US dollar 102 +0.18% DXY 5-day
VIX 19.06 +10.11% Yahoo
Funding rate 0.0084% Open interest 7.57B (24h +0.88) Long/short 2.2165 Binance USDⓈ-M
These are personal views; figures are from the sources listed in the main text. Not a trading instruction.
$BTC $DOGE $PEPE
Meme market: Which moves first, the leaders or the small caps?
If the leaders aren't seeing volume, I won't listen to a single story about small caps.
Measure sentiment by price moves, not by hype in chat groups.
WIF 0.1788 (+0.56%), DOGE 0.0767 (+0.08%), SHIB 0.00000483 (-0.62%), BONK 0.00000299 (-0.66%)
For comparison: BTC 79608 (24h -0.84%).
The strongest meme coin, WIF, is up +0.56%—it hasn't outperformed BTC (-0.84%) by much. If it hasn't pulled away, it's not a trend; it's just volatility.
If the gap between the leader and the weakest coin narrows to within 2 percentage points, independent buying has disappeared. Close the position.
Data: Binance Spot 24h / Binance USDⓈ-M / Yahoo daily (5-day change) / altme_fng / mempool_fees / defillama_chains / coingecko_trending. Missing figures are not filled in.
Would you place a limit order at the pullback level, or wait for the candle to close?
#meme #Sentiment
Useful fact: OI is the notional value of open positions, not trading volume.
Food for thought: The dollar has strengthened over 5 days while BTC is still rising—that's an independent move, but its staying power gets discounted.
Data card (same update as the main text; missing values are shown as dashes):
BTC 79,608 -0.84% Binance Spot 24h
ETH 2,304 -1.06% ETH/BTC 0.02894
S&P 500 7,652 -0.50% Yahoo 5-day
Nasdaq 26,036 -1.49% Yahoo 5-day
US dollar 102 +0.18% DXY 5-day
VIX 19.06 +10.11% Yahoo
Funding rate 0.0084% Open interest 7.57B (24h +0.88) Long/short 2.2165 Binance USDⓈ-M
These are personal views; figures are from the sources listed in the main text. Not a trading instruction.
$BTC $DOGE $PEPE
If the leaders aren't seeing volume, I won't listen to a single story about small caps.
Measure sentiment by price moves, not by hype in chat groups.
WIF 0.1788 (+0.56%), DOGE 0.0767 (+0.08%), SHIB 0.00000483 (-0.62%), BONK 0.00000299 (-0.66%)
For comparison: BTC 79608 (24h -0.84%).
The strongest meme coin, WIF, is up +0.56%—it hasn't outperformed BTC (-0.84%) by much. If it hasn't pulled away, it's not a trend; it's just volatility.
If the gap between the leader and the weakest coin narrows to within 2 percentage points, independent buying has disappeared. Close the position.
Data: Binance Spot 24h / Binance USDⓈ-M / Yahoo daily (5-day change) / altme_fng / mempool_fees / defillama_chains / coingecko_trending. Missing figures are not filled in.
Would you place a limit order at the pullback level, or wait for the candle to close?
#meme #Sentiment
Useful fact: OI is the notional value of open positions, not trading volume.
Food for thought: The dollar has strengthened over 5 days while BTC is still rising—that's an independent move, but its staying power gets discounted.
Data card (same update as the main text; missing values are shown as dashes):
BTC 79,608 -0.84% Binance Spot 24h
ETH 2,304 -1.06% ETH/BTC 0.02894
S&P 500 7,652 -0.50% Yahoo 5-day
Nasdaq 26,036 -1.49% Yahoo 5-day
US dollar 102 +0.18% DXY 5-day
VIX 19.06 +10.11% Yahoo
Funding rate 0.0084% Open interest 7.57B (24h +0.88) Long/short 2.2165 Binance USDⓈ-M
These are personal views; figures are from the sources listed in the main text. Not a trading instruction.
$BTC $DOGE $PEPE
1

·
--
{spot}(DOGEUSDT)
{spot}(SHIBUSDT)
{spot}(PEPEUSDT)
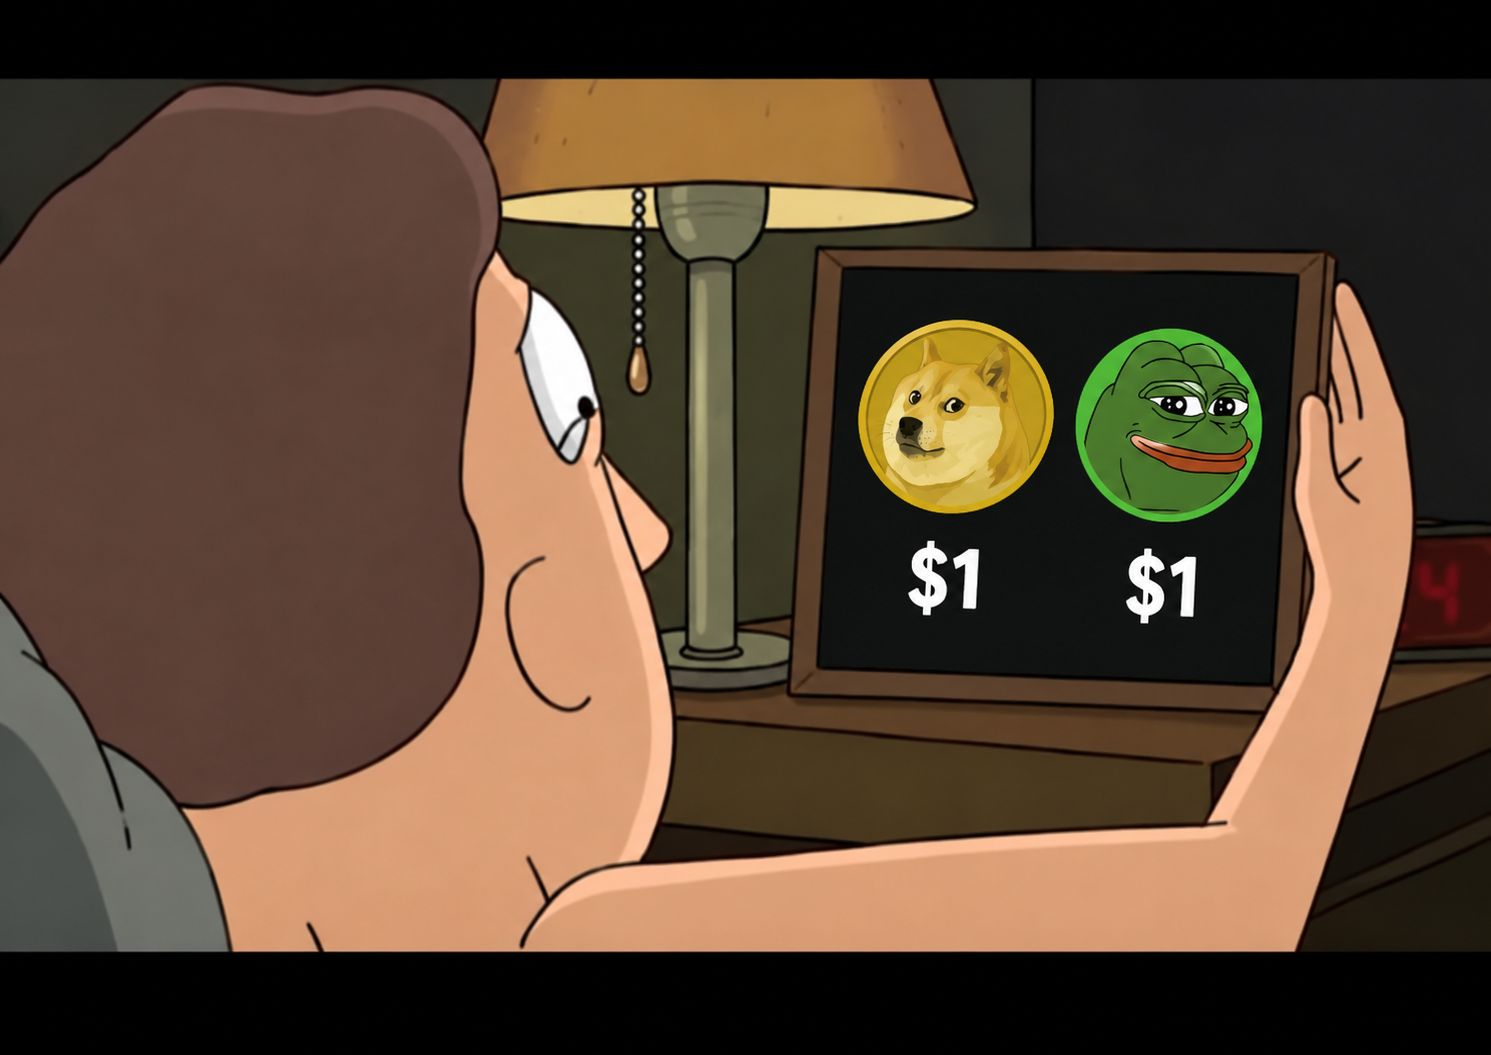
🔥 MEME COIN MADNESS 🚀🐸
Market Heating Let's Start Trade ⚡
🐶 $DOGE — $0.0778
🐕 $SHIB — $0.0000049
🐸 $PEPE — $0.0000044
📊 Trading Outlook
🟢 Watch for a breakout above resistance.
🔴 If support breaks, a further pullback is possible.
🎯 Confirm volume before entering a trade.
💬 DOGE, SHIB or PEPE — which one will pump next? 👇
#MEME
#DOGE
#SHIB
#PEPE
🔥 MEME COIN MADNESS 🚀🐸
Market Heating Let's Start Trade ⚡
🐶 $DOGE — $0.0778
🐕 $SHIB — $0.0000049
🐸 $PEPE — $0.0000044
📊 Trading Outlook
🟢 Watch for a breakout above resistance.
🔴 If support breaks, a further pullback is possible.
🎯 Confirm volume before entering a trade.
💬 DOGE, SHIB or PEPE — which one will pump next? 👇
#MEME
#DOGE
#SHIB
#PEPE
Market Heating Let's Start Trade ⚡
🐶 $DOGE — $0.0778
🐕 $SHIB — $0.0000049
🐸 $PEPE — $0.0000044
📊 Trading Outlook
🟢 Watch for a breakout above resistance.
🔴 If support breaks, a further pullback is possible.
🎯 Confirm volume before entering a trade.
💬 DOGE, SHIB or PEPE — which one will pump next? 👇
#MEME
#DOGE
#SHIB
#PEPE
1
136

·
--
$M
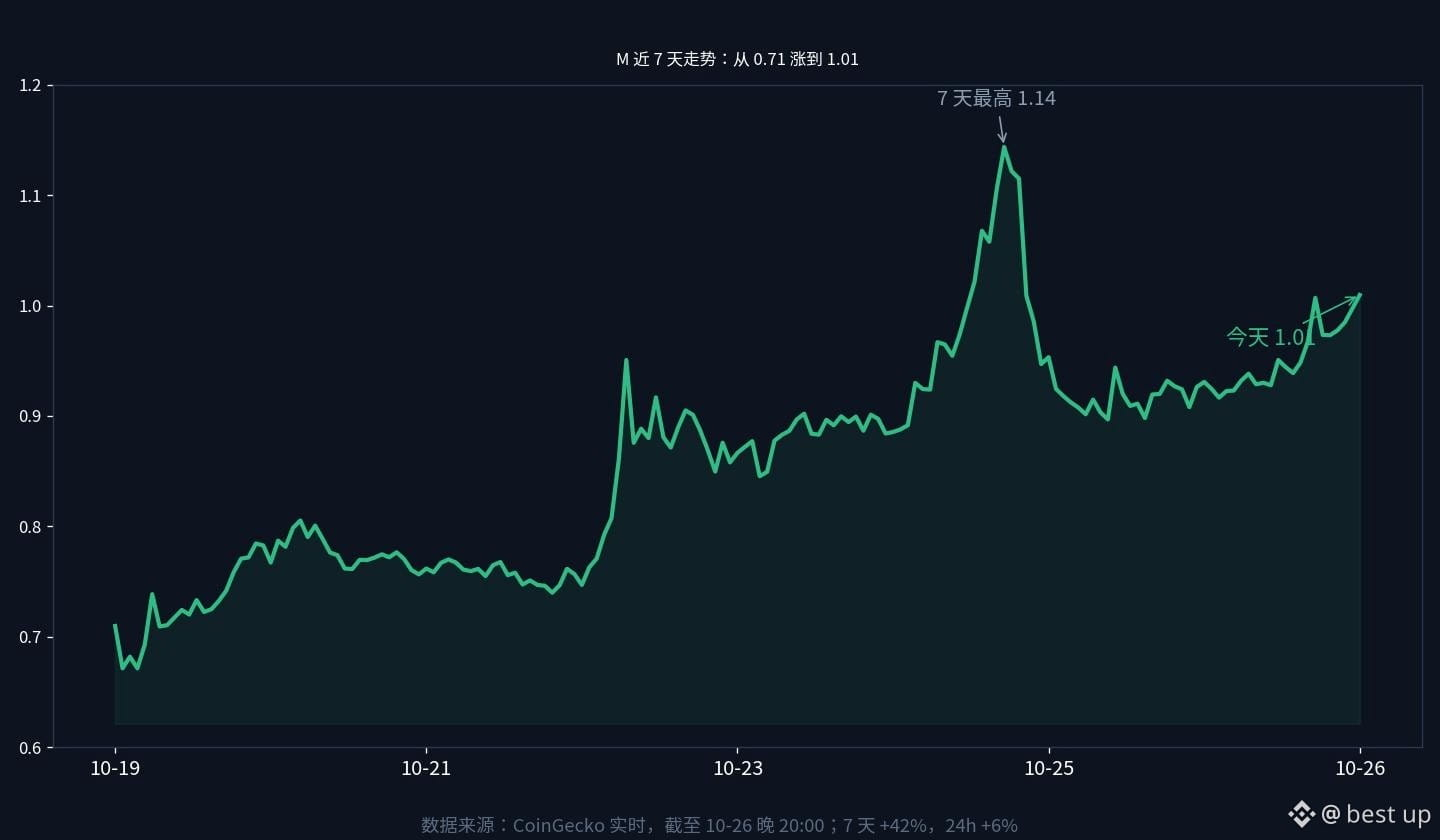
In one week, it surged from 0.71 to 1.01
A gain of over 40%
The whole market is falling
Yet it keeps climbing
Would you dare to chase this meme dark horse?
#meme #MarketWatch
$M
In one week, it surged from 0.71 to 1.01
A gain of over 40%
The whole market is falling
Yet it keeps climbing
Would you dare to chase this meme dark horse?
#meme #MarketWatch
In one week, it surged from 0.71 to 1.01
A gain of over 40%
The whole market is falling
Yet it keeps climbing
Would you dare to chase this meme dark horse?
#meme #MarketWatch
59

🔥 This timeline is a little noisy tonight: that bull on BSC has surged 58% in just 24 hours.
It’s not doing tens of millions in trading volume, but volume has topped $2 million, and liquidity is just over $600,000. The thing to watch with a market this size is that it doesn’t take much money to push the price around quickly.
📊 Live data
Current price: $0.1418
24-hour change: +58.45%
Trading volume: $2.166 million
Liquidity: $669,000
Holders: 60,500
Market cap: about $142 million
Chain: BSC
Where to trade: Available on Binance Alpha
Why are people sharing it? Its name is literally that bull. When bullish sentiment kicks in, mascot tokens are always among the first to get attention. There’s no new story to be found today, and no new campaign—the gains are doing all the talking. With just over 60,000 holders, this isn’t a new token; what’s drawing people in tonight is that 58% figure. Short-term money is clearly moving into it—it’s not just being propped up by rumors.
And because liquidity is thin, the same amount of money that sends it up quickly can send it down just as fast. What you’re seeing is a 58% gain, not profit that’s already locked in. Meme coins run on sentiment, and when sentiment fades, the pullback won’t give you a warning.
⚠️ Meme coins are extremely volatile. This is not investment advice. You are responsible for your own gains and losses.
Data source: Binance Alpha live market data (October 26, 19:42 UTC+8)
#meme #币安Alpha #OnchainHotspots
$BULLA
🔥 This timeline is a little noisy tonight: that bull on BSC has surged 58% in just 24 hours.
It’s not doing tens of millions in trading volume, but volume has topped $2 million, and liquidity is just over $600,000. The thing to watch with a market this size is that it doesn’t take much money to push the price around quickly.
📊 Live data
Current price: $0.1418
24-hour change: +58.45%
Trading volume: $2.166 million
Liquidity: $669,000
Holders: 60,500
Market cap: about $142 million
Chain: BSC
Where to trade: Available on Binance Alpha
Why are people sharing it? Its name is literally that bull. When bullish sentiment kicks in, mascot tokens are always among the first to get attention. There’s no new story to be found today, and no new campaign—the gains are doing all the talking. With just over 60,000 holders, this isn’t a new token; what’s drawing people in tonight is that 58% figure. Short-term money is clearly moving into it—it’s not just being propped up by rumors.
And because liquidity is thin, the same amount of money that sends it up quickly can send it down just as fast. What you’re seeing is a 58% gain, not profit that’s already locked in. Meme coins run on sentiment, and when sentiment fades, the pullback won’t give you a warning.
⚠️ Meme coins are extremely volatile. This is not investment advice. You are responsible for your own gains and losses.
Data source: Binance Alpha live market data (October 26, 19:42 UTC+8)
#meme #币安Alpha #OnchainHotspots
$BULLA
It’s not doing tens of millions in trading volume, but volume has topped $2 million, and liquidity is just over $600,000. The thing to watch with a market this size is that it doesn’t take much money to push the price around quickly.
📊 Live data
Current price: $0.1418
24-hour change: +58.45%
Trading volume: $2.166 million
Liquidity: $669,000
Holders: 60,500
Market cap: about $142 million
Chain: BSC
Where to trade: Available on Binance Alpha
Why are people sharing it? Its name is literally that bull. When bullish sentiment kicks in, mascot tokens are always among the first to get attention. There’s no new story to be found today, and no new campaign—the gains are doing all the talking. With just over 60,000 holders, this isn’t a new token; what’s drawing people in tonight is that 58% figure. Short-term money is clearly moving into it—it’s not just being propped up by rumors.
And because liquidity is thin, the same amount of money that sends it up quickly can send it down just as fast. What you’re seeing is a 58% gain, not profit that’s already locked in. Meme coins run on sentiment, and when sentiment fades, the pullback won’t give you a warning.
⚠️ Meme coins are extremely volatile. This is not investment advice. You are responsible for your own gains and losses.
Data source: Binance Alpha live market data (October 26, 19:42 UTC+8)
#meme #币安Alpha #OnchainHotspots
$BULLA
353

·
--
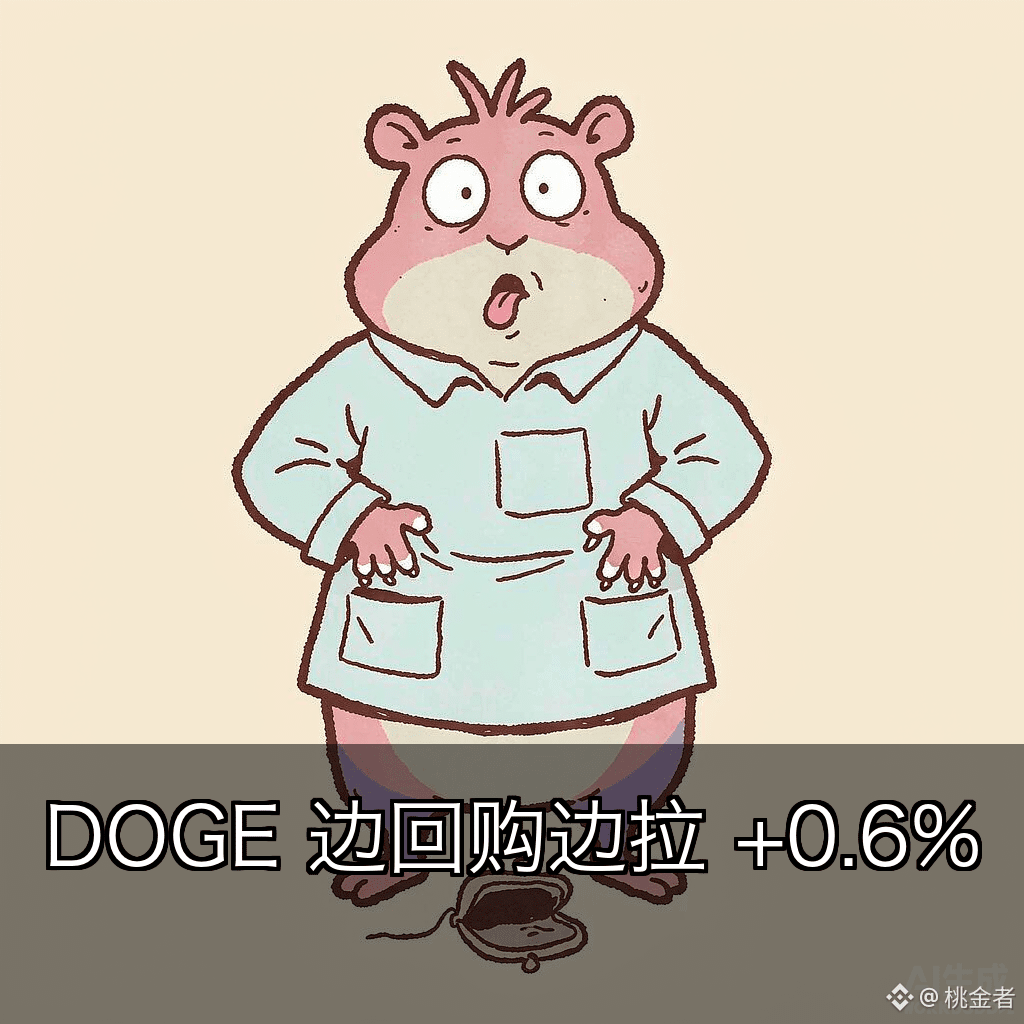
⚡ Today’s wealth code · DOGE +0.63% in one day
🟢 Long: Today’s volume supports this gain.
Aggressive 0.0771 (enter at the current price)|Stop-loss 0.0730|Take-profit 0.0855
Conservative 0.0755 (enter on a pullback)|Stop-loss 0.0715|Take-profit 0.0855
Limit order 0.0740 (buy the dip)|Stop-loss 0.0701|Take-profit 0.0855
📌 It only counts as a continuation if DOGE holds above 0.0809; otherwise, it’s a bull trap.
Why:
💵 24h +0.63%, trading volume 211.1M U, current price 0.07707.
Funding rate +0.0064%/8h (longs and shorts are roughly balanced)
RSI 51 (neutral, ranging)
Major inflows -1.53M USDT Strength -7.2%
1h net flow -27.5K USDT
4h net flow -530.9K USDT
24h net flow -1.53M USDT
💬 At this DOGE price, would you add to your position or get out for now?
🎉 Wishing you returns today that beat what others make in a whole year 📅
$DOGE #Meme 🔥
Investing involves risk. For reference only; this is not investment advice. Please do your own research.
⚡ Today’s wealth code · DOGE +0.63% in one day
🟢 Long: Today’s volume supports this gain.
Aggressive 0.0771 (enter at the current price)|Stop-loss 0.0730|Take-profit 0.0855
Conservative 0.0755 (enter on a pullback)|Stop-loss 0.0715|Take-profit 0.0855
Limit order 0.0740 (buy the dip)|Stop-loss 0.0701|Take-profit 0.0855
📌 It only counts as a continuation if DOGE holds above 0.0809; otherwise, it’s a bull trap.
Why:
💵 24h +0.63%, trading volume 211.1M U, current price 0.07707.
Funding rate +0.0064%/8h (longs and shorts are roughly balanced)
RSI 51 (neutral, ranging)
Major inflows -1.53M USDT Strength -7.2%
1h net flow -27.5K USDT
4h net flow -530.9K USDT
24h net flow -1.53M USDT
💬 At this DOGE price, would you add to your position or get out for now?
🎉 Wishing you returns today that beat what others make in a whole year 📅
$DOGE #Meme 🔥
Investing involves risk. For reference only; this is not investment advice. Please do your own research.
🟢 Long: Today’s volume supports this gain.
Aggressive 0.0771 (enter at the current price)|Stop-loss 0.0730|Take-profit 0.0855
Conservative 0.0755 (enter on a pullback)|Stop-loss 0.0715|Take-profit 0.0855
Limit order 0.0740 (buy the dip)|Stop-loss 0.0701|Take-profit 0.0855
📌 It only counts as a continuation if DOGE holds above 0.0809; otherwise, it’s a bull trap.
Why:
💵 24h +0.63%, trading volume 211.1M U, current price 0.07707.
Funding rate +0.0064%/8h (longs and shorts are roughly balanced)
RSI 51 (neutral, ranging)
Major inflows -1.53M USDT Strength -7.2%
1h net flow -27.5K USDT
4h net flow -530.9K USDT
24h net flow -1.53M USDT
💬 At this DOGE price, would you add to your position or get out for now?
🎉 Wishing you returns today that beat what others make in a whole year 📅
$DOGE #Meme 🔥
Investing involves risk. For reference only; this is not investment advice. Please do your own research.
4
·
--
Can you be part of a MEME community without buying coins?
Take a look at NEIRO’s charity page, and there’s one detail worth noting: getting involved doesn’t just mean donating. It also includes volunteering at local animal shelters, walking dogs, and helping train puppies.
That’s more concrete than simply saying “the community is strong”: it gives people who don’t trade a role they can play.
From a community research perspective, I’m more interested in whether efforts like these can be sustained: people could organize shelter needs, translate information, coordinate in person, and then share the results with everyone.
The key isn’t to turn everyone into a token holder, but to make sure there’s something different people can contribute.
Of course, a website listing ways to get involved doesn’t mean every initiative has already been carried out; and supporting a charitable cause doesn’t mean buying coins is the same as donating.
If all a MEME has left is price action, then the only thing people can talk about is price. What might make people want to stick around is having something to do together beyond buying and selling.
What do you think is the most important non-trading role in a community?
$NEIRO #MEME #社区观察
Can you be part of a MEME community without buying coins?
Take a look at NEIRO’s charity page, and there’s one detail worth noting: getting involved doesn’t just mean donating. It also includes volunteering at local animal shelters, walking dogs, and helping train puppies.
That’s more concrete than simply saying “the community is strong”: it gives people who don’t trade a role they can play.
From a community research perspective, I’m more interested in whether efforts like these can be sustained: people could organize shelter needs, translate information, coordinate in person, and then share the results with everyone.
The key isn’t to turn everyone into a token holder, but to make sure there’s something different people can contribute.
Of course, a website listing ways to get involved doesn’t mean every initiative has already been carried out; and supporting a charitable cause doesn’t mean buying coins is the same as donating.
If all a MEME has left is price action, then the only thing people can talk about is price. What might make people want to stick around is having something to do together beyond buying and selling.
What do you think is the most important non-trading role in a community?
$NEIRO #MEME #社区观察
Take a look at NEIRO’s charity page, and there’s one detail worth noting: getting involved doesn’t just mean donating. It also includes volunteering at local animal shelters, walking dogs, and helping train puppies.
That’s more concrete than simply saying “the community is strong”: it gives people who don’t trade a role they can play.
From a community research perspective, I’m more interested in whether efforts like these can be sustained: people could organize shelter needs, translate information, coordinate in person, and then share the results with everyone.
The key isn’t to turn everyone into a token holder, but to make sure there’s something different people can contribute.
Of course, a website listing ways to get involved doesn’t mean every initiative has already been carried out; and supporting a charitable cause doesn’t mean buying coins is the same as donating.
If all a MEME has left is price action, then the only thing people can talk about is price. What might make people want to stick around is having something to do together beyond buying and selling.
What do you think is the most important non-trading role in a community?
$NEIRO #MEME #社区观察

154
·
--
DOGE leads—did the others follow?
For sentiment to recover, there needs to be price movement; otherwise, it’s just chatter.
Measure sentiment by price changes, not group activity.
WIF 0.1806 (+2.27%), DOGE 0.0770 (+0.86%), PEPE 0.0000044 (+0.69%), BONK 0.000003 (+0.33%)
For comparison: BTC 80205 (24h -0.24%).
WIF’s 24h gain of +2.27% clearly outperforms BTC at -0.24%, showing independent buying. But SHIB is only +0.00%—there’s no sector-wide confirmation. Trade only the leader; don’t fantasize about catch-up gains.
If the gap between the leader and the weakest coin narrows to within 2 percentage points, independent buying has disappeared. Close the position.
Data: Binance spot 24h / Binance USDⓈ-M / Yahoo daily (5-day change) / altme_fng / mempool_fees / defillama_chains / coingecko_trending. Missing figures are not filled in.
When memes aren’t outperforming BTC, are you still holding them?
#meme #Sentiment
Key point: The dot plot shows each official’s individual projection, not the decision at the next meeting.
Insight: Fear & Greed <25: sentiment is cold, but that doesn’t confirm a bottom.
Data card (same update as the main text; missing values are shown as dashes):
BTC 80,205 -0.24% Binance spot 24h
ETH 2,324 -0.45% ETH/BTC 0.02898
S&P 500 7,624 -0.47% Yahoo 5-day
Nasdaq 25,955 -0.71% Yahoo 5-day
Dollar 102 +0.01% DXY 5-day
VIX 19.28 +11.38% Yahoo
Funding rate 0.0078% Open interest 7.53B (24h +0.63) Long/short 2.2258 Binance USDⓈ-M
Personal opinion; figures and sources are in the main text. Not a trade instruction.
$DOGE $PEPE $BTC
DOGE leads—did the others follow?
For sentiment to recover, there needs to be price movement; otherwise, it’s just chatter.
Measure sentiment by price changes, not group activity.
WIF 0.1806 (+2.27%), DOGE 0.0770 (+0.86%), PEPE 0.0000044 (+0.69%), BONK 0.000003 (+0.33%)
For comparison: BTC 80205 (24h -0.24%).
WIF’s 24h gain of +2.27% clearly outperforms BTC at -0.24%, showing independent buying. But SHIB is only +0.00%—there’s no sector-wide confirmation. Trade only the leader; don’t fantasize about catch-up gains.
If the gap between the leader and the weakest coin narrows to within 2 percentage points, independent buying has disappeared. Close the position.
Data: Binance spot 24h / Binance USDⓈ-M / Yahoo daily (5-day change) / altme_fng / mempool_fees / defillama_chains / coingecko_trending. Missing figures are not filled in.
When memes aren’t outperforming BTC, are you still holding them?
#meme #Sentiment
Key point: The dot plot shows each official’s individual projection, not the decision at the next meeting.
Insight: Fear & Greed <25: sentiment is cold, but that doesn’t confirm a bottom.
Data card (same update as the main text; missing values are shown as dashes):
BTC 80,205 -0.24% Binance spot 24h
ETH 2,324 -0.45% ETH/BTC 0.02898
S&P 500 7,624 -0.47% Yahoo 5-day
Nasdaq 25,955 -0.71% Yahoo 5-day
Dollar 102 +0.01% DXY 5-day
VIX 19.28 +11.38% Yahoo
Funding rate 0.0078% Open interest 7.53B (24h +0.63) Long/short 2.2258 Binance USDⓈ-M
Personal opinion; figures and sources are in the main text. Not a trade instruction.
$DOGE $PEPE $BTC
For sentiment to recover, there needs to be price movement; otherwise, it’s just chatter.
Measure sentiment by price changes, not group activity.
WIF 0.1806 (+2.27%), DOGE 0.0770 (+0.86%), PEPE 0.0000044 (+0.69%), BONK 0.000003 (+0.33%)
For comparison: BTC 80205 (24h -0.24%).
WIF’s 24h gain of +2.27% clearly outperforms BTC at -0.24%, showing independent buying. But SHIB is only +0.00%—there’s no sector-wide confirmation. Trade only the leader; don’t fantasize about catch-up gains.
If the gap between the leader and the weakest coin narrows to within 2 percentage points, independent buying has disappeared. Close the position.
Data: Binance spot 24h / Binance USDⓈ-M / Yahoo daily (5-day change) / altme_fng / mempool_fees / defillama_chains / coingecko_trending. Missing figures are not filled in.
When memes aren’t outperforming BTC, are you still holding them?
#meme #Sentiment
Key point: The dot plot shows each official’s individual projection, not the decision at the next meeting.
Insight: Fear & Greed <25: sentiment is cold, but that doesn’t confirm a bottom.
Data card (same update as the main text; missing values are shown as dashes):
BTC 80,205 -0.24% Binance spot 24h
ETH 2,324 -0.45% ETH/BTC 0.02898
S&P 500 7,624 -0.47% Yahoo 5-day
Nasdaq 25,955 -0.71% Yahoo 5-day
Dollar 102 +0.01% DXY 5-day
VIX 19.28 +11.38% Yahoo
Funding rate 0.0078% Open interest 7.53B (24h +0.63) Long/short 2.2258 Binance USDⓈ-M
Personal opinion; figures and sources are in the main text. Not a trade instruction.
$DOGE $PEPE $BTC
1

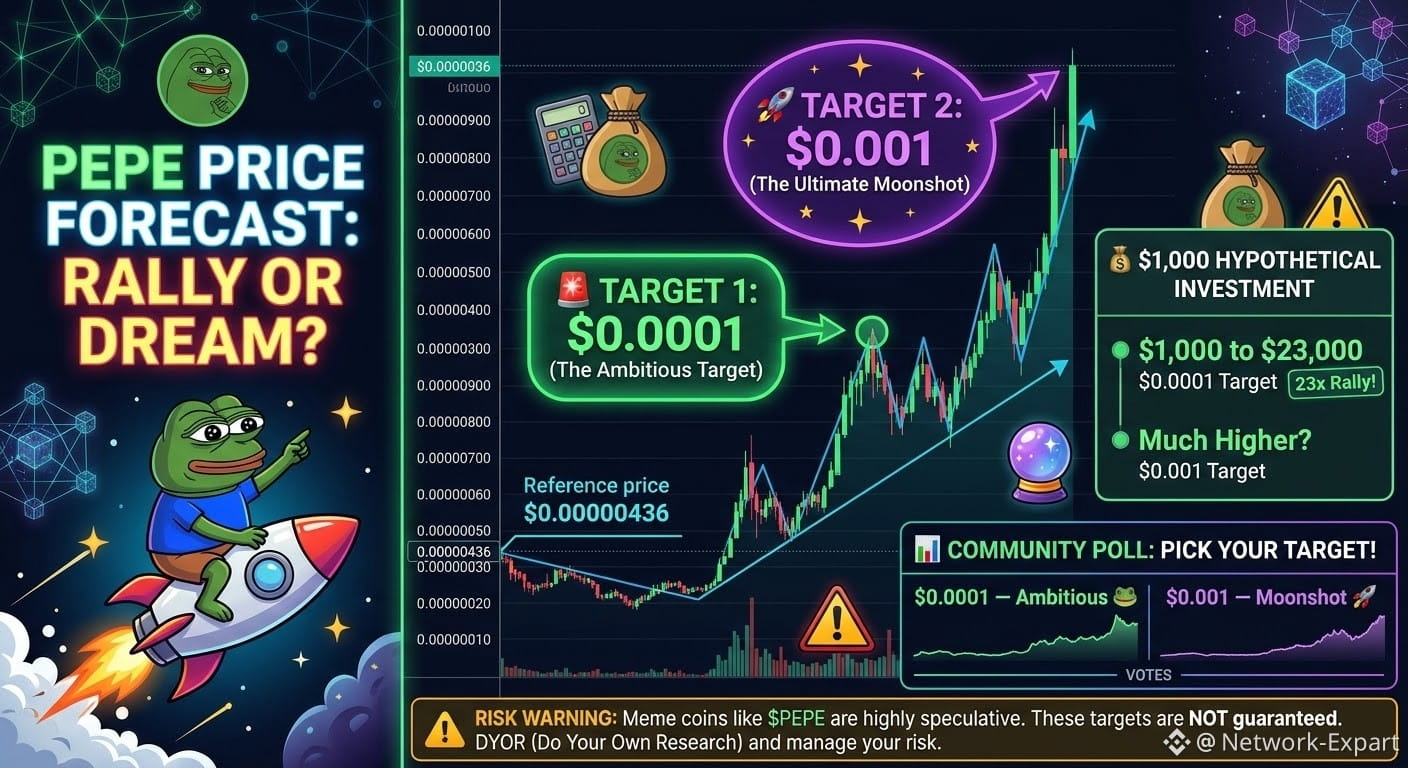
🚨 $PEPE TO $0.0001… OR A WILD $0.001 DREAM? 🐸🚀
Imagine $PEPE making a massive move from its referenced price of $0.00000436! 👀🔥
💰 A hypothetical 23x rally could turn a $1,000 investment into around $23,000 — before fees and taxes.
But some PEPE believers have an even crazier target in mind: $0.001! 😭💎
🐸 Is it an ambitious dream, or are meme coin holders getting carried away by the hype?
⚠️ Let's be realistic: these targets are highly speculative. A $0.001 PEPE price would require an enormous market capitalization, depending on its circulating supply, and is not guaranteed to happen.
🎯 PICK YOUR $PEPE DREAM TARGET!
🐸 $0.0001 — The ambitious target
🚀 $0.001 — The ultimate moonshot
💬 If #PEPE starts pumping hard, would you take profits along the way or keep holding for your dream price?
👇 CAST YOUR VOTE & LET THE PEPE ARMY SPEAK!
⚠️ Remember: Meme coins carry extreme risk. Never confuse hype with a guarantee. DYOR & manage your risk.
#MemeCoinMarket #MEME
🚨 $PEPE TO $0.0001… OR A WILD $0.001 DREAM? 🐸🚀
Imagine $PEPE making a massive move from its referenced price of $0.00000436! 👀🔥
💰 A hypothetical 23x rally could turn a $1,000 investment into around $23,000 — before fees and taxes.
But some PEPE believers have an even crazier target in mind: $0.001! 😭💎
🐸 Is it an ambitious dream, or are meme coin holders getting carried away by the hype?
⚠️ Let's be realistic: these targets are highly speculative. A $0.001 PEPE price would require an enormous market capitalization, depending on its circulating supply, and is not guaranteed to happen.
🎯 PICK YOUR $PEPE DREAM TARGET!
🐸 $0.0001 — The ambitious target
🚀 $0.001 — The ultimate moonshot
💬 If #PEPE starts pumping hard, would you take profits along the way or keep holding for your dream price?
👇 CAST YOUR VOTE & LET THE PEPE ARMY SPEAK!
⚠️ Remember: Meme coins carry extreme risk. Never confuse hype with a guarantee. DYOR & manage your risk.
#MemeCoinMarket #MEME
Imagine $PEPE making a massive move from its referenced price of $0.00000436! 👀🔥
💰 A hypothetical 23x rally could turn a $1,000 investment into around $23,000 — before fees and taxes.
But some PEPE believers have an even crazier target in mind: $0.001! 😭💎
🐸 Is it an ambitious dream, or are meme coin holders getting carried away by the hype?
⚠️ Let's be realistic: these targets are highly speculative. A $0.001 PEPE price would require an enormous market capitalization, depending on its circulating supply, and is not guaranteed to happen.
🎯 PICK YOUR $PEPE DREAM TARGET!
🐸 $0.0001 — The ambitious target
🚀 $0.001 — The ultimate moonshot
💬 If #PEPE starts pumping hard, would you take profits along the way or keep holding for your dream price?
👇 CAST YOUR VOTE & LET THE PEPE ARMY SPEAK!
⚠️ Remember: Meme coins carry extreme risk. Never confuse hype with a guarantee. DYOR & manage your risk.
#MemeCoinMarket #MEME
51
🔥 That “AI Shiba Inu” on Robinhood Chain surged again today, up 19.20% in 24 hours. The memecoin market is pushing it higher on its own.
First, a look at the market: the current price is $0.06214, trading volume is $2.764 million, there are 57,800 holders, market cap is about $61.45 million, and $13.25 million in liquidity is there to cushion the market—not exactly a pool that goes empty at the slightest touch. The intraday low was around $0.0518, and it has recovered since. With a market cap above $60 million and nearly 60,000 holders, it’s no small fry. The rally is driven by memecoin sentiment itself; there’s no protocol upgrade to talk about. It’s tradable on Binance Alpha, but hasn’t made it to spot trading.
Why does it keep coming back into the spotlight? The meme is simple, but it spreads fast: a Shiba Inu meme meets the AI narrative, and on-chain it’s also tied to the Nvidia-linked token. Retail traders move quickly on Robinhood Chain, and once the “dog plus computing power” catchphrase catches on, it spreads faster than any roadmap. It’s the standout gainer among memecoins today, with volume holding above $1 million—a sign that the excitement hasn’t completely faded. Just keep an eye on the market, and don’t mistake a catchy phrase for fundamentals.
⚠️ Memecoins are extremely volatile. Swings of 10–20% in either direction in a single day are common. This content is not investment advice.
Data source: Binance Alpha live market data (October 26, 14:43 UTC+8)
#meme #币安Alpha #On-chain buzz
$AI
🔥 That “AI Shiba Inu” on Robinhood Chain surged again today, up 19.20% in 24 hours. The memecoin market is pushing it higher on its own.
First, a look at the market: the current price is $0.06214, trading volume is $2.764 million, there are 57,800 holders, market cap is about $61.45 million, and $13.25 million in liquidity is there to cushion the market—not exactly a pool that goes empty at the slightest touch. The intraday low was around $0.0518, and it has recovered since. With a market cap above $60 million and nearly 60,000 holders, it’s no small fry. The rally is driven by memecoin sentiment itself; there’s no protocol upgrade to talk about. It’s tradable on Binance Alpha, but hasn’t made it to spot trading.
Why does it keep coming back into the spotlight? The meme is simple, but it spreads fast: a Shiba Inu meme meets the AI narrative, and on-chain it’s also tied to the Nvidia-linked token. Retail traders move quickly on Robinhood Chain, and once the “dog plus computing power” catchphrase catches on, it spreads faster than any roadmap. It’s the standout gainer among memecoins today, with volume holding above $1 million—a sign that the excitement hasn’t completely faded. Just keep an eye on the market, and don’t mistake a catchy phrase for fundamentals.
⚠️ Memecoins are extremely volatile. Swings of 10–20% in either direction in a single day are common. This content is not investment advice.
Data source: Binance Alpha live market data (October 26, 14:43 UTC+8)
#meme #币安Alpha #On-chain buzz
$AI
First, a look at the market: the current price is $0.06214, trading volume is $2.764 million, there are 57,800 holders, market cap is about $61.45 million, and $13.25 million in liquidity is there to cushion the market—not exactly a pool that goes empty at the slightest touch. The intraday low was around $0.0518, and it has recovered since. With a market cap above $60 million and nearly 60,000 holders, it’s no small fry. The rally is driven by memecoin sentiment itself; there’s no protocol upgrade to talk about. It’s tradable on Binance Alpha, but hasn’t made it to spot trading.
Why does it keep coming back into the spotlight? The meme is simple, but it spreads fast: a Shiba Inu meme meets the AI narrative, and on-chain it’s also tied to the Nvidia-linked token. Retail traders move quickly on Robinhood Chain, and once the “dog plus computing power” catchphrase catches on, it spreads faster than any roadmap. It’s the standout gainer among memecoins today, with volume holding above $1 million—a sign that the excitement hasn’t completely faded. Just keep an eye on the market, and don’t mistake a catchy phrase for fundamentals.
⚠️ Memecoins are extremely volatile. Swings of 10–20% in either direction in a single day are common. This content is not investment advice.
Data source: Binance Alpha live market data (October 26, 14:43 UTC+8)
#meme #币安Alpha #On-chain buzz
$AI
176
·
--
DOGE is leading—did the others follow?
I only pay attention to memes when they have independent buying pressure; otherwise, I treat them as volatility.
I measure sentiment by price moves, not chat group activity.
DOGE 0.0764 (-1.77%), SHIB 0.00000482 (-2.23%), WIF 0.1775 (-3.27%), BONK 0.00000297 (-4.19%)
For comparison: BTC 79643 (24h -1.59%).
Even leading DOGE is down just -1.77%; the weakest, PEPE, is down -4.26%. Memes are bleeding. Talking about sentiment recovering is self-deception.
If the gap between the leader and the weakest coin narrows to under 2 percentage points, independent buying pressure has disappeared, and I’ll close my positions.
Data: Binance Spot 24h / Binance USDⓈ-M / Yahoo daily (5-day change) / altme_fng / mempool_fees / defillama_chains / coingecko_trending. Missing figures are not filled in.
Are you sitting in cash and waiting for a pullback, or are you already in?
#meme #Sentiment
Takeaway: The total supply unlock schedule matters more than slogans; if the token issuance switch is on, treat it as noise.
Thought: If the strongest meme coin hasn't outperformed BTC by 2%, treat it as volatility, not a sector.
Data card (same update as the main text; missing figures are shown as dashes):
BTC 79,643 -1.59% Binance Spot 24h
ETH 2,309 -2.32% ETH/BTC 0.02899
S&P 500 7,624 -0.47% Yahoo 5-day
Nasdaq 25,955 -0.71% Yahoo 5-day
Dollar 102 -0.11% DXY 5-day
VIX 19.45 +5.48% Yahoo
Funding rate 0.0040% Open interest 7.55B (24h -0.79) Long/short 2.2436 Binance USDⓈ-M
Personal opinion; figures are from the sources cited in the main text. Not a trading instruction.
$DOGE $PEPE $BTC
DOGE is leading—did the others follow?
I only pay attention to memes when they have independent buying pressure; otherwise, I treat them as volatility.
I measure sentiment by price moves, not chat group activity.
DOGE 0.0764 (-1.77%), SHIB 0.00000482 (-2.23%), WIF 0.1775 (-3.27%), BONK 0.00000297 (-4.19%)
For comparison: BTC 79643 (24h -1.59%).
Even leading DOGE is down just -1.77%; the weakest, PEPE, is down -4.26%. Memes are bleeding. Talking about sentiment recovering is self-deception.
If the gap between the leader and the weakest coin narrows to under 2 percentage points, independent buying pressure has disappeared, and I’ll close my positions.
Data: Binance Spot 24h / Binance USDⓈ-M / Yahoo daily (5-day change) / altme_fng / mempool_fees / defillama_chains / coingecko_trending. Missing figures are not filled in.
Are you sitting in cash and waiting for a pullback, or are you already in?
#meme #Sentiment
Takeaway: The total supply unlock schedule matters more than slogans; if the token issuance switch is on, treat it as noise.
Thought: If the strongest meme coin hasn't outperformed BTC by 2%, treat it as volatility, not a sector.
Data card (same update as the main text; missing figures are shown as dashes):
BTC 79,643 -1.59% Binance Spot 24h
ETH 2,309 -2.32% ETH/BTC 0.02899
S&P 500 7,624 -0.47% Yahoo 5-day
Nasdaq 25,955 -0.71% Yahoo 5-day
Dollar 102 -0.11% DXY 5-day
VIX 19.45 +5.48% Yahoo
Funding rate 0.0040% Open interest 7.55B (24h -0.79) Long/short 2.2436 Binance USDⓈ-M
Personal opinion; figures are from the sources cited in the main text. Not a trading instruction.
$DOGE $PEPE $BTC
I only pay attention to memes when they have independent buying pressure; otherwise, I treat them as volatility.
I measure sentiment by price moves, not chat group activity.
DOGE 0.0764 (-1.77%), SHIB 0.00000482 (-2.23%), WIF 0.1775 (-3.27%), BONK 0.00000297 (-4.19%)
For comparison: BTC 79643 (24h -1.59%).
Even leading DOGE is down just -1.77%; the weakest, PEPE, is down -4.26%. Memes are bleeding. Talking about sentiment recovering is self-deception.
If the gap between the leader and the weakest coin narrows to under 2 percentage points, independent buying pressure has disappeared, and I’ll close my positions.
Data: Binance Spot 24h / Binance USDⓈ-M / Yahoo daily (5-day change) / altme_fng / mempool_fees / defillama_chains / coingecko_trending. Missing figures are not filled in.
Are you sitting in cash and waiting for a pullback, or are you already in?
#meme #Sentiment
Takeaway: The total supply unlock schedule matters more than slogans; if the token issuance switch is on, treat it as noise.
Thought: If the strongest meme coin hasn't outperformed BTC by 2%, treat it as volatility, not a sector.
Data card (same update as the main text; missing figures are shown as dashes):
BTC 79,643 -1.59% Binance Spot 24h
ETH 2,309 -2.32% ETH/BTC 0.02899
S&P 500 7,624 -0.47% Yahoo 5-day
Nasdaq 25,955 -0.71% Yahoo 5-day
Dollar 102 -0.11% DXY 5-day
VIX 19.45 +5.48% Yahoo
Funding rate 0.0040% Open interest 7.55B (24h -0.79) Long/short 2.2436 Binance USDⓈ-M
Personal opinion; figures are from the sources cited in the main text. Not a trading instruction.
$DOGE $PEPE $BTC
28
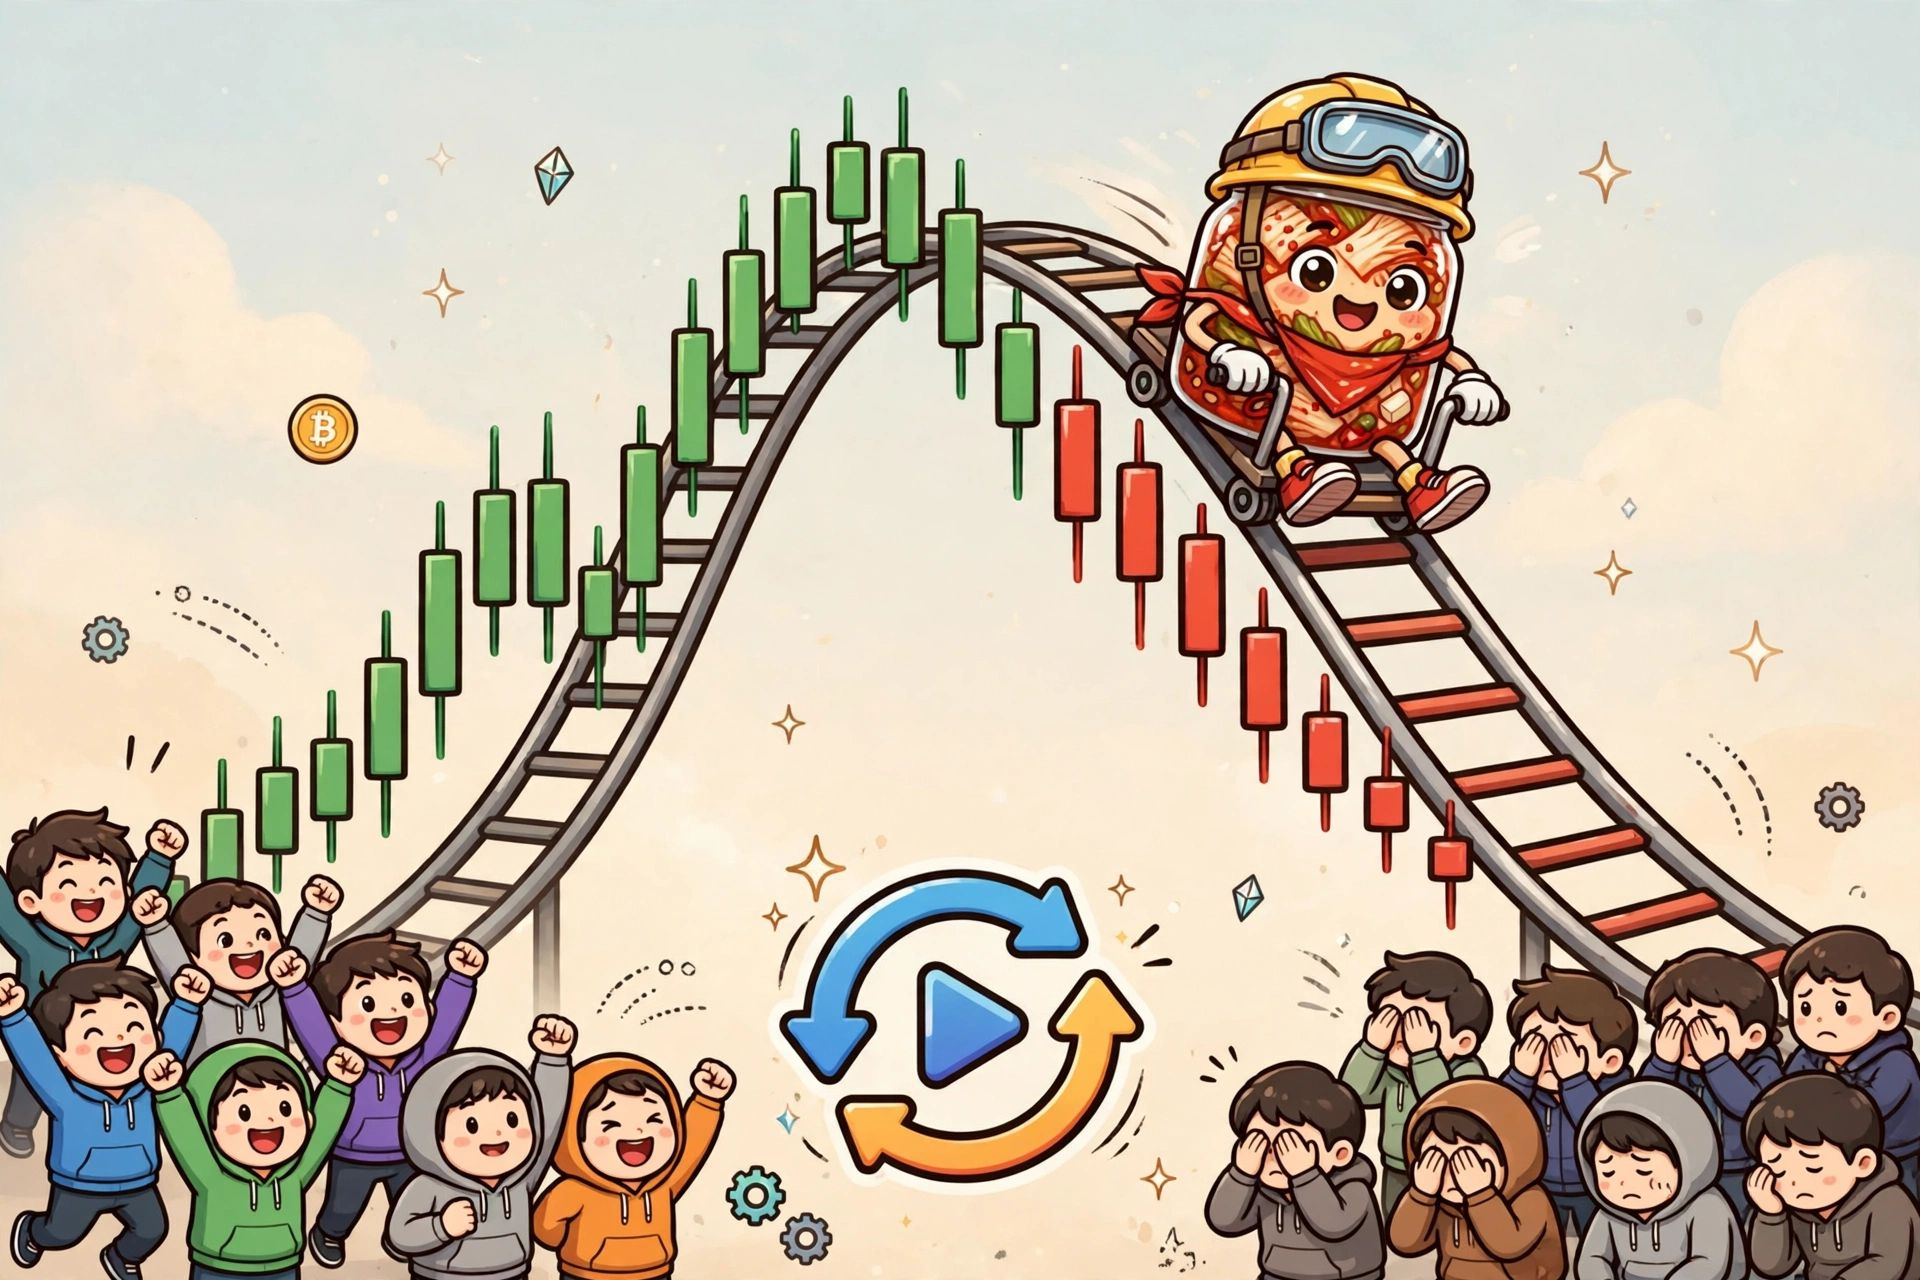
This morning, the Solana shitcoin scene ran the same old familiar play: trader Kimchi put Pump.fun back in their X bio, and a meme coin with the same name promptly surged past a $15 million market cap, up over 47% in 24 hours—before sliding back to around $9.3 million.
Here’s how everyone reacted: those who aped in the moment the bio changed believed “the big boss is back”; those who bought the $15 million peak were banking on “last time it hit $30 million in 10 minutes and $40 million in an hour”; those still holding at $9.3 million are telling themselves “at least it hasn’t gone to zero”; and the spectators on the sidelines quietly dug up the old receipts from four days ago—the same crew did this on October 22, too, when it fell from $40 million all the way to $21 million.
The funniest part is, they didn’t even change the script: update the bio, coin flies, retail arrives late, then it all comes back down. They ran this exact show four days ago, and people are still buying tickets.
So here’s the question: is this season two of the big boss’s return, or are you willing to pay to watch the same episode again? Pick a side in the comments: A, the bio is the signal—just send it; B, buying a ticket to a rerun means you deserve to get buried.
$SOL $BTC $ETH #meme #土狗 #Pumpfun
This morning, the Solana shitcoin scene ran the same old familiar play: trader Kimchi put Pump.fun back in their X bio, and a meme coin with the same name promptly surged past a $15 million market cap, up over 47% in 24 hours—before sliding back to around $9.3 million.
Here’s how everyone reacted: those who aped in the moment the bio changed believed “the big boss is back”; those who bought the $15 million peak were banking on “last time it hit $30 million in 10 minutes and $40 million in an hour”; those still holding at $9.3 million are telling themselves “at least it hasn’t gone to zero”; and the spectators on the sidelines quietly dug up the old receipts from four days ago—the same crew did this on October 22, too, when it fell from $40 million all the way to $21 million.
The funniest part is, they didn’t even change the script: update the bio, coin flies, retail arrives late, then it all comes back down. They ran this exact show four days ago, and people are still buying tickets.
So here’s the question: is this season two of the big boss’s return, or are you willing to pay to watch the same episode again? Pick a side in the comments: A, the bio is the signal—just send it; B, buying a ticket to a rerun means you deserve to get buried.
$SOL $BTC $ETH #meme #土狗 #Pumpfun
Here’s how everyone reacted: those who aped in the moment the bio changed believed “the big boss is back”; those who bought the $15 million peak were banking on “last time it hit $30 million in 10 minutes and $40 million in an hour”; those still holding at $9.3 million are telling themselves “at least it hasn’t gone to zero”; and the spectators on the sidelines quietly dug up the old receipts from four days ago—the same crew did this on October 22, too, when it fell from $40 million all the way to $21 million.
The funniest part is, they didn’t even change the script: update the bio, coin flies, retail arrives late, then it all comes back down. They ran this exact show four days ago, and people are still buying tickets.
So here’s the question: is this season two of the big boss’s return, or are you willing to pay to watch the same episode again? Pick a side in the comments: A, the bio is the signal—just send it; B, buying a ticket to a rerun means you deserve to get buried.
$SOL $BTC $ETH #meme #土狗 #Pumpfun
43

·
--
Bearish
🚨 $PEPE HOLDERS, HOW HIGH CAN IT GO? 🐸🔥
At $0.00000436, reaching $0.0001 means roughly 23x, while $0.001 would require around 229x! 🤯
A massive rally could turn heads, but volatility cuts both ways. Hype can push prices up, while profit-taking and fading momentum can send them back down. 📈📉
ONE TARGET for next month: $0.0001 or $0.001? 👀
Drop your pick! NFA. Manage risk. 🚀
$PEPE
{spot}(PEPEUSDT)
#PEPE #MEME
🚨 $PEPE HOLDERS, HOW HIGH CAN IT GO? 🐸🔥
At $0.00000436, reaching $0.0001 means roughly 23x, while $0.001 would require around 229x! 🤯
A massive rally could turn heads, but volatility cuts both ways. Hype can push prices up, while profit-taking and fading momentum can send them back down. 📈📉
ONE TARGET for next month: $0.0001 or $0.001? 👀
Drop your pick! NFA. Manage risk. 🚀
$PEPE
#PEPE #MEME
At $0.00000436, reaching $0.0001 means roughly 23x, while $0.001 would require around 229x! 🤯
A massive rally could turn heads, but volatility cuts both ways. Hype can push prices up, while profit-taking and fading momentum can send them back down. 📈📉
ONE TARGET for next month: $0.0001 or $0.001? 👀
Drop your pick! NFA. Manage risk. 🚀
$PEPE
#PEPE #MEME
1
135
Pump.fun was exposed for internal chats showing the product was designed to be “addictive,” leaving CT “shocked.”
Shocked about what?
The chats cited in that New York lawsuit basically admit that most users will lose everything, a small number will make big money, and the platform will reliably collect fees. Posts summarizing the case on X also say the judge has allowed the RICO claims to proceed. Fine—let the lawyers argue the legal side.
What I really want to say is: the on-chain data spelled this out ages ago. People keep reposting Solidus Labs’ finding that “98.6% of tokens show signs of manipulation or rug pulls.” Monthly active users topping 900,000 and most people losing money aren’t secrets either. The people aping into shitcoins every day know perfectly well what’s going on—they just think they’re in the 1.4%.
Now they’re shouting BOYCOTTPUMPFUN, tagging @SEC and @FBI in the comments to demand compensation, then turning around and aping into the next launchpad. That’s not waking up; it’s getting hooked on another platform.
Plenty of “boycott” posts conveniently link a Telegram channel or a new platform’s CA. Outrage is traffic, and someone’s cashing in on all that emotion.
Who knows if the lawsuit will win; even a ruling is years away. There’s only one thing that can protect you: don’t treat a launchpad like a money printer. It’s designed to make money for the platform first.
#PumpFun #Meme
Pump.fun was exposed for internal chats showing the product was designed to be “addictive,” leaving CT “shocked.”
Shocked about what?
The chats cited in that New York lawsuit basically admit that most users will lose everything, a small number will make big money, and the platform will reliably collect fees. Posts summarizing the case on X also say the judge has allowed the RICO claims to proceed. Fine—let the lawyers argue the legal side.
What I really want to say is: the on-chain data spelled this out ages ago. People keep reposting Solidus Labs’ finding that “98.6% of tokens show signs of manipulation or rug pulls.” Monthly active users topping 900,000 and most people losing money aren’t secrets either. The people aping into shitcoins every day know perfectly well what’s going on—they just think they’re in the 1.4%.
Now they’re shouting BOYCOTTPUMPFUN, tagging @SEC and @FBI in the comments to demand compensation, then turning around and aping into the next launchpad. That’s not waking up; it’s getting hooked on another platform.
Plenty of “boycott” posts conveniently link a Telegram channel or a new platform’s CA. Outrage is traffic, and someone’s cashing in on all that emotion.
Who knows if the lawsuit will win; even a ruling is years away. There’s only one thing that can protect you: don’t treat a launchpad like a money printer. It’s designed to make money for the platform first.
#PumpFun #Meme
Shocked about what?
The chats cited in that New York lawsuit basically admit that most users will lose everything, a small number will make big money, and the platform will reliably collect fees. Posts summarizing the case on X also say the judge has allowed the RICO claims to proceed. Fine—let the lawyers argue the legal side.
What I really want to say is: the on-chain data spelled this out ages ago. People keep reposting Solidus Labs’ finding that “98.6% of tokens show signs of manipulation or rug pulls.” Monthly active users topping 900,000 and most people losing money aren’t secrets either. The people aping into shitcoins every day know perfectly well what’s going on—they just think they’re in the 1.4%.
Now they’re shouting BOYCOTTPUMPFUN, tagging @SEC and @FBI in the comments to demand compensation, then turning around and aping into the next launchpad. That’s not waking up; it’s getting hooked on another platform.
Plenty of “boycott” posts conveniently link a Telegram channel or a new platform’s CA. Outrage is traffic, and someone’s cashing in on all that emotion.
Who knows if the lawsuit will win; even a ruling is years away. There’s only one thing that can protect you: don’t treat a launchpad like a money printer. It’s designed to make money for the platform first.
#PumpFun #Meme
4

·
--
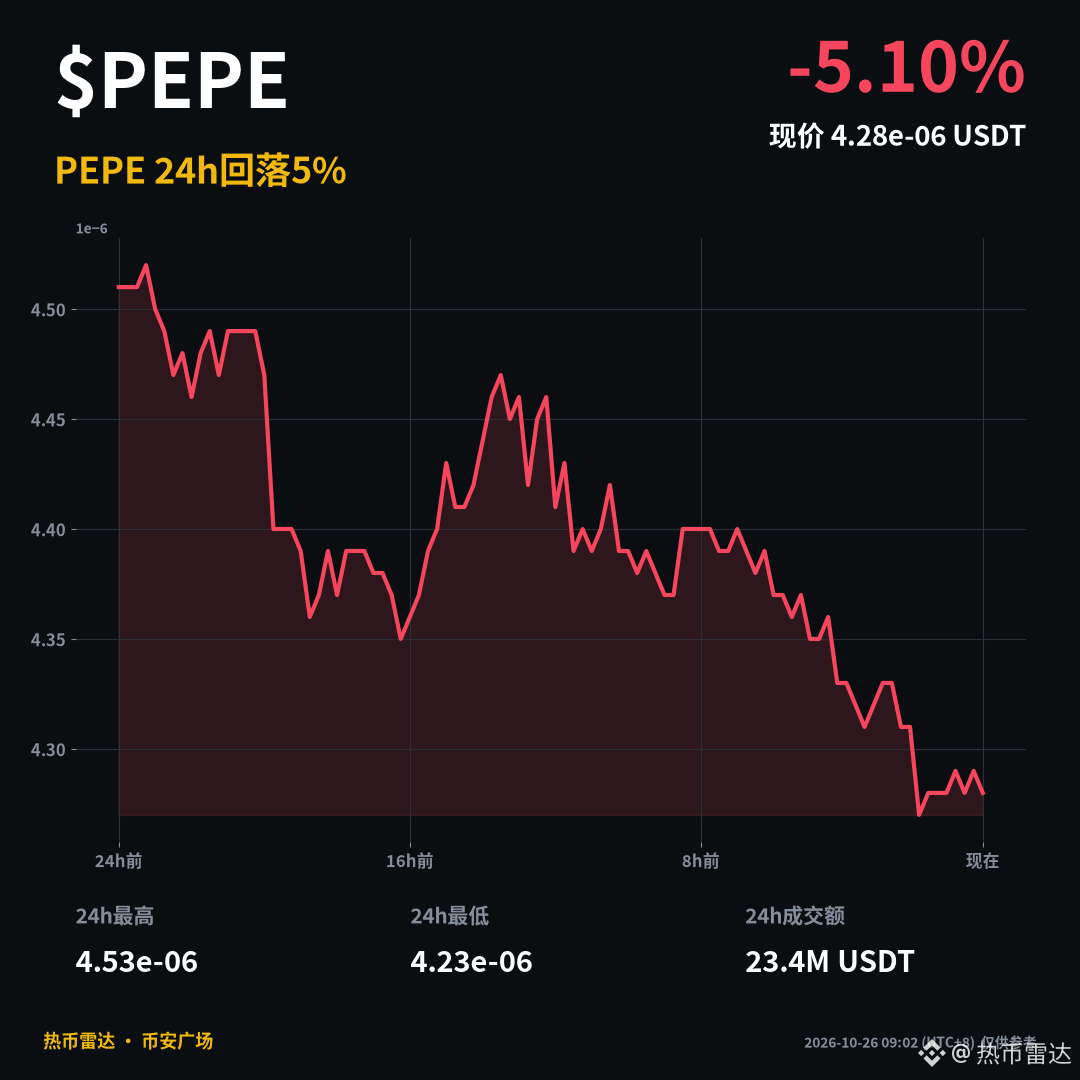
🐸 PEPE is down 5.1% in 24h, leading losses among major coins!
Price: 0.00000428 U|24h trading volume: approximately 23.43 million U.
Over the same period, WLD fell 4.7% and SUI 1.8%, while BTC was around 80,188 U (-0.8%) and ETH at 2,329 U (-1.2%). The broader market saw a slight pullback, with the Meme sector falling more sharply.
Do you think this Meme pullback is a buying opportunity or is it better to keep watching? Share your thoughts in the comments 👇
$PEPE $WLD #PEPE #Meme #币安广场
Data: Binance Spot 24h market data. For reference only; this is not investment advice.
🐸 PEPE is down 5.1% in 24h, leading losses among major coins!
Price: 0.00000428 U|24h trading volume: approximately 23.43 million U.
Over the same period, WLD fell 4.7% and SUI 1.8%, while BTC was around 80,188 U (-0.8%) and ETH at 2,329 U (-1.2%). The broader market saw a slight pullback, with the Meme sector falling more sharply.
Do you think this Meme pullback is a buying opportunity or is it better to keep watching? Share your thoughts in the comments 👇
$PEPE $WLD #PEPE #Meme #币安广场
Data: Binance Spot 24h market data. For reference only; this is not investment advice.
Price: 0.00000428 U|24h trading volume: approximately 23.43 million U.
Over the same period, WLD fell 4.7% and SUI 1.8%, while BTC was around 80,188 U (-0.8%) and ETH at 2,329 U (-1.2%). The broader market saw a slight pullback, with the Meme sector falling more sharply.
Do you think this Meme pullback is a buying opportunity or is it better to keep watching? Share your thoughts in the comments 👇
$PEPE $WLD #PEPE #Meme #币安广场
Data: Binance Spot 24h market data. For reference only; this is not investment advice.
317


$PEPE holders, let's talk about price targets.
Could PEPE reach $0.0001 next month, or is $0.001 even possible?
At the current price of $0.00000436, reaching $0.0001 would require roughly a 23x move. Reaching $0.001 would require around 229x. Both are ambitious and neither is guaranteed.
If you had to choose ONE target for next month.. which would you pick.. $0.0001 or $0.001?
NFA. Manage risk.
$PEPE #PEPE #MEME
$PEPE holders, let's talk about price targets.
Could PEPE reach $0.0001 next month, or is $0.001 even possible?
At the current price of $0.00000436, reaching $0.0001 would require roughly a 23x move. Reaching $0.001 would require around 229x. Both are ambitious and neither is guaranteed.
If you had to choose ONE target for next month.. which would you pick.. $0.0001 or $0.001?
NFA. Manage risk.
$PEPE #PEPE #MEME
Could PEPE reach $0.0001 next month, or is $0.001 even possible?
At the current price of $0.00000436, reaching $0.0001 would require roughly a 23x move. Reaching $0.001 would require around 229x. Both are ambitious and neither is guaranteed.
If you had to choose ONE target for next month.. which would you pick.. $0.0001 or $0.001?
NFA. Manage risk.
$PEPE #PEPE #MEME

MrDanishcrypto:
hi I follow you plz follow me back
28
2
84
48.8k
Log in to explore more content
Join global crypto users on Binance Square
⚡️ Get latest and useful information about crypto.
💬 Trusted by the world’s largest crypto exchange.
👍 Discover real insights from verified creators.
Email / Phone number
Trending Topics
1
#BinancePick
3M views
151,940 Discussing
2
#EarningsSeason
5.2M views
25,816 Discussing
3
#AnthropicTTMRevenueGrewAbout1200%
20,994 views
346 Discussing
4
#AnthropicS1ExpectedToday
21,779 views
299 Discussing
5
#SouthKoreaReportedlyWeighsFourthCryptoTaxDelay
26,637 views
421 Discussing
6
#FranklinTempletonFilesForTwoDividendToBitcoinETFs
34,504 views
515 Discussing
7
#StrategyMSTRSurpassesNasdaqInMarketCap
26,460 views
373 Discussing
8
#CanadaProposesStablecoinRedemptionWithin3BusinessDays
1,201 views
34 Discussing
9
#ElectrumWalletBugLetRogueServersStealFunds
28,078 views
449 Discussing
10
#ArgentineCourtDismissesLIBRACaseAgainstMilei
42,596 views
556 Discussing