

#fedholdsrateshawkishdotplot
fedholdsrateshawkishdotplot
29,360 views
147 Discussing
Hot
Latest

·
--
Bullish
#fedholdsrateshawkishdotplot
🔥 THE FED HELD RATES — BUT THE DOT PLOT JUST TURNED HAWKISH AS HELL 🦅 Markets walked into Wednesday expecting a boring non-event: the Fed holding rates steady for the 4th straight meeting at 3.5%–3.75%. They got that. What they didn't expect was the dot plot flip underneath it. Half the committee now sees a hike coming before year-end. The median 2026 rate projection jumped to 3.8% from 3.4% in March. The Fed's statement got a quiet but brutal edit too — the language hinting at future rate cuts was stripped out entirely, replaced with a leaner, no-promises, purely data-dependent tone. The market reaction was immediate: stocks dipped and short-term Treasury yields jumped as traders repriced the odds of a hike later this year. New Chair Kevin Warsh used his very first meeting to set a hawkish tone right out of the gate — no easy "honeymoon" period here. For crypto, this is the kind of macro shift that tightens the screws on risk appetite fast. Liquidity expectations just got a reality check. Are you de-risking ahead of more hawkish signals, or buying the dip? 💭
#Fed #DotPlot #crypto #BinanceSquare
$AGT $ESPORTS $BTC
{future}(AGTUSDT)
#fedholdsrateshawkishdotplot
🔥 THE FED HELD RATES — BUT THE DOT PLOT JUST TURNED HAWKISH AS HELL 🦅 Markets walked into Wednesday expecting a boring non-event: the Fed holding rates steady for the 4th straight meeting at 3.5%–3.75%. They got that. What they didn't expect was the dot plot flip underneath it. Half the committee now sees a hike coming before year-end. The median 2026 rate projection jumped to 3.8% from 3.4% in March. The Fed's statement got a quiet but brutal edit too — the language hinting at future rate cuts was stripped out entirely, replaced with a leaner, no-promises, purely data-dependent tone. The market reaction was immediate: stocks dipped and short-term Treasury yields jumped as traders repriced the odds of a hike later this year. New Chair Kevin Warsh used his very first meeting to set a hawkish tone right out of the gate — no easy "honeymoon" period here. For crypto, this is the kind of macro shift that tightens the screws on risk appetite fast. Liquidity expectations just got a reality check. Are you de-risking ahead of more hawkish signals, or buying the dip? 💭
#Fed #DotPlot #crypto #BinanceSquare
$AGT $ESPORTS $BTC
3.8k

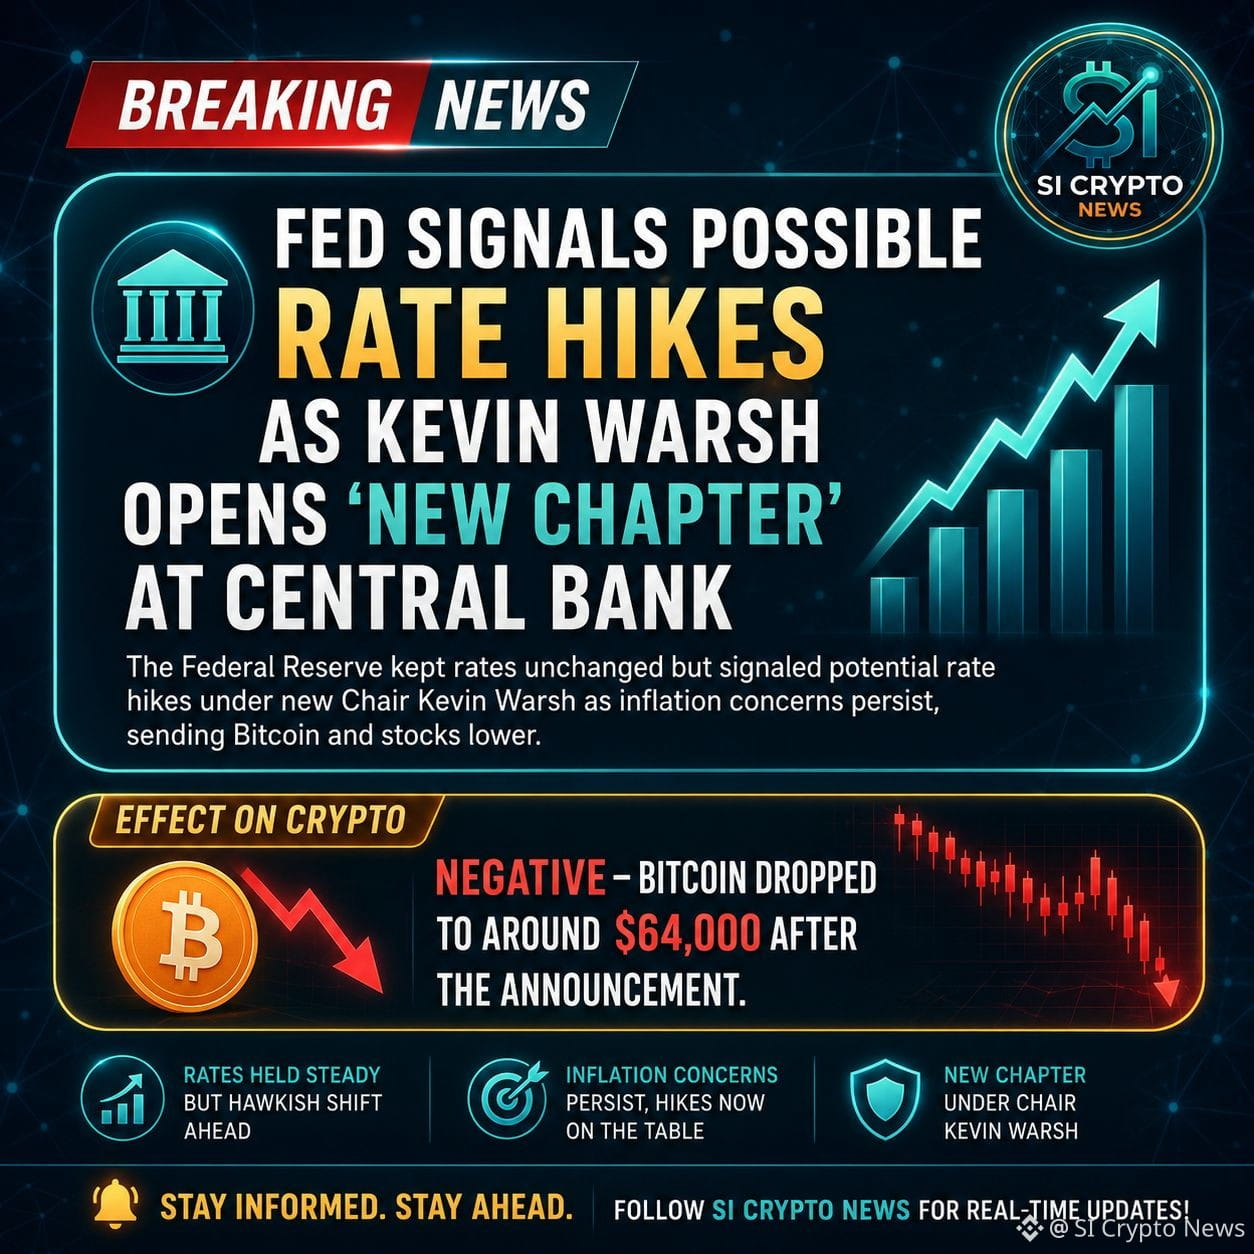
Bitcoin Slips as Federal Reserve Signals Possible Rate Hikes
The latest Federal Reserve meeting delivered a message that many investors were not expecting. While the central bank left interest rates unchanged, officials signaled that rate hikes could still be on the table if inflation remains stubbornly high.
The meeting was particularly important because it was the first one led by new Fed Chair Kevin Warsh. His comments and the updated projections suggested a more cautious and hawkish approach than markets had anticipated.
#SICryptoNews #FedHoldsRatesHawkishDotPlot $BTC
{future}(BTCUSDT)
$SPCXB
{spot}(SPCXBUSDT)
Bitcoin Slips as Federal Reserve Signals Possible Rate Hikes
The latest Federal Reserve meeting delivered a message that many investors were not expecting. While the central bank left interest rates unchanged, officials signaled that rate hikes could still be on the table if inflation remains stubbornly high.
The meeting was particularly important because it was the first one led by new Fed Chair Kevin Warsh. His comments and the updated projections suggested a more cautious and hawkish approach than markets had anticipated.
#SICryptoNews #FedHoldsRatesHawkishDotPlot $BTC
$SPCXB
214

·
--
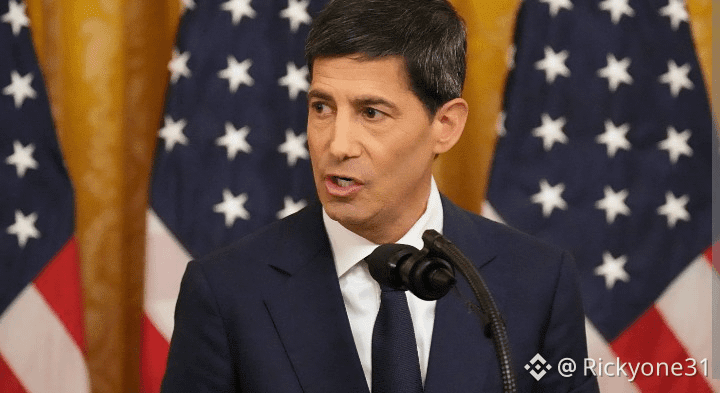
#FedHoldsRatesHawkishDotPlot The Federal Reserve of the United States 🇺🇸 kept interest rates steady 👏🏼👏🏼👏🏼 for the fourth consecutive session, maintaining them in the range of 3.5% to 3.75%. However, they didn’t anticipate a surprising shift in the analysis of the underlying data.
Half of the committee members now foresee a rate hike 📈 before the year ends.
The average forecast for the interest rate in 2026 has been revised upward 📈, from 3.4% in March to 3.8%.
The Fed's statement also underwent significant and discreet revisions, completely removing any wording hinting at future rate cuts, replacing it with a more direct, cautious, and data-driven approach. $TRUMP
{future}(TRUMPUSDT)
#FedHoldsRatesHawkishDotPlot The Federal Reserve of the United States 🇺🇸 kept interest rates steady 👏🏼👏🏼👏🏼 for the fourth consecutive session, maintaining them in the range of 3.5% to 3.75%. However, they didn’t anticipate a surprising shift in the analysis of the underlying data.
Half of the committee members now foresee a rate hike 📈 before the year ends.
The average forecast for the interest rate in 2026 has been revised upward 📈, from 3.4% in March to 3.8%.
The Fed's statement also underwent significant and discreet revisions, completely removing any wording hinting at future rate cuts, replacing it with a more direct, cautious, and data-driven approach. $TRUMP
2
2.1k

#FedHoldsRatesHawkishDotPlot #FedHoldsRatesHawkishDotPlot
The Federal Reserve has held interest rates steady, but the accompanying dot plot carried a more hawkish tone than markets expected, signaling that policy easing is not imminent.
Key takeaways:
• Rates remain unchanged, reinforcing a wait-and-see stance
• The FOMC Dot Plot shows several members still expecting tighter policy or delayed cuts
• Inflation progress is not yet sufficient to justify a clear pivot toward easing
• The median projection suggests “higher-for-longer” remains the dominant narrative
Market reaction dynamics:
• Equity markets tend to soften when hawkish dots dominate forward guidance
• Nasdaq Composite is most sensitive due to rate exposure in growth and tech valuations
• S&P 500 often sees moderate pressure but remains range-bound
• Bond yields may rise as traders reprice the timing of cuts
Overall message:
Policy is on hold, but the bias in the projections leans restrictive—meaning liquidity conditions remain tight, and markets stay highly dependent on incoming inflation and labor data for direction.
45

·
--
#FedHoldsRatesHawkishDotPlot
The Fed kept rates unchanged at 3.5%-3.75% but the dot plot showed heightened divergence, with 9 officials expecting hikes by end-2026 and median raised to 3.75%.
Chair Warsh’s debut turned hawkish, stressing inflation well above 2% target and forming five monetary policy working groups. New statement streamlined, focusing on price stability.
Year-end hike expectations rose sharply, reinforcing dollar support but raising volatility in equities and risk assets. Trump said holding rates is “also OK” and hinted at hikes.
$DOT
$TRX
$TON
92
Article
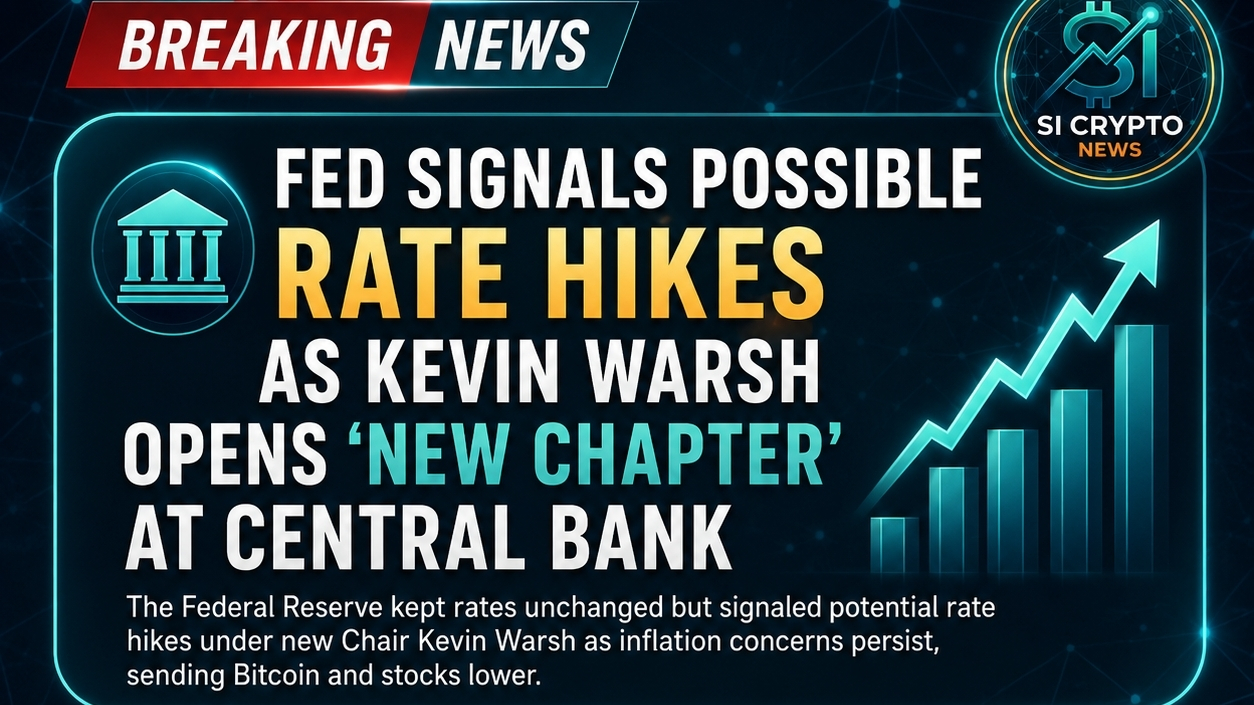
New Signals from the Federal Reserve, Bitcoin Under PressureAfter the latest meeting of the American Federal Reserve, financial markets are feeling the jitters once again. While the Fed didn't change interest rates immediately, they clearly signaled that an increase could be on the horizon in the coming months.
A key highlight of this meeting was the leadership of the new chairman, Kevin Warsh, who made it clear that the battle against inflation is far from over. According to the Fed, the US economy is still moving forward with strong momentum, but inflation is hovering at higher levels than expected, which could necessitate the continuation of a tight monetary policy.
New Signals from the Federal Reserve, Bitcoin Under Pressure
After the latest meeting of the American Federal Reserve, financial markets are feeling the jitters once again. While the Fed didn't change interest rates immediately, they clearly signaled that an increase could be on the horizon in the coming months.
A key highlight of this meeting was the leadership of the new chairman, Kevin Warsh, who made it clear that the battle against inflation is far from over. According to the Fed, the US economy is still moving forward with strong momentum, but inflation is hovering at higher levels than expected, which could necessitate the continuation of a tight monetary policy.
A key highlight of this meeting was the leadership of the new chairman, Kevin Warsh, who made it clear that the battle against inflation is far from over. According to the Fed, the US economy is still moving forward with strong momentum, but inflation is hovering at higher levels than expected, which could necessitate the continuation of a tight monetary policy.
119

·
--
Article
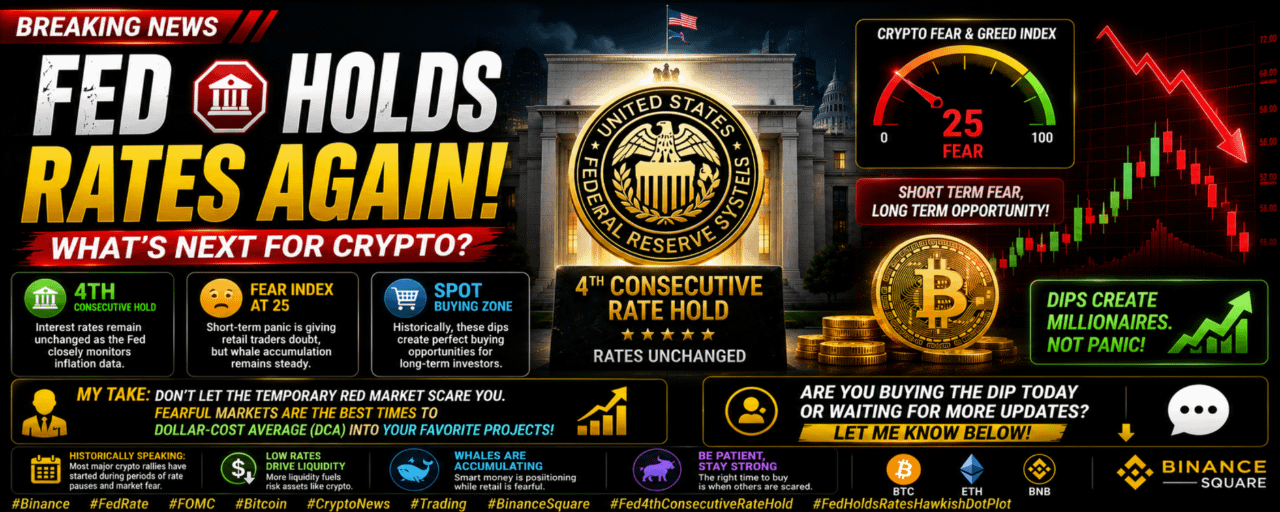
FED HOLDS RATES AGAIN! WHAT’S NEXT FOR CRYPTO?🛑 📉
Hello Trader Friends! 👋
The Federal Reserve has officially announced its 4th consecutive interest rate hold! Market sentiment has shifted into "Fear" mode, but smart investors know this is where the real opportunities are built. 💼
✅ 4th Consecutive Hold: Interest rates remain unchanged as the Fed closely monitors inflation data.
✅ Fear Index at 25: Short-term panic is giving retail traders doubt, but whale accumulation remains steady.
✅ Spot Buying Zone: Historically, these dips create perfect buying opportunities for long-term spot investors.
💭 My Take: Don't let the temporary red market scare you. Fearful markets are the best times to dollar-cost average (DCA) into your favorite projects! 📊
👇 Are you buying the dip today or waiting for more updates? Let me know below! 👇
#Binance #FedRate #FOMC #Bitcoin #CryptoNews #Trading #BinanceSquare #Fed4thConsecutiveRateHold #FedHoldsRatesHawkishDotPlot
$BTC $BNB $ETH
FED HOLDS RATES AGAIN! WHAT’S NEXT FOR CRYPTO?
🛑 📉
Hello Trader Friends! 👋
The Federal Reserve has officially announced its 4th consecutive interest rate hold! Market sentiment has shifted into "Fear" mode, but smart investors know this is where the real opportunities are built. 💼
✅ 4th Consecutive Hold: Interest rates remain unchanged as the Fed closely monitors inflation data.
✅ Fear Index at 25: Short-term panic is giving retail traders doubt, but whale accumulation remains steady.
✅ Spot Buying Zone: Historically, these dips create perfect buying opportunities for long-term spot investors.
💭 My Take: Don't let the temporary red market scare you. Fearful markets are the best times to dollar-cost average (DCA) into your favorite projects! 📊
👇 Are you buying the dip today or waiting for more updates? Let me know below! 👇
#Binance #FedRate #FOMC #Bitcoin #CryptoNews #Trading #BinanceSquare #Fed4thConsecutiveRateHold #FedHoldsRatesHawkishDotPlot
$BTC $BNB $ETH
102

·
--
Bullish
$AGT nearly doubled and people still call it luck.
At some point, every winning trade looks obvious in hindsight.
Trade Setup: Entry: $0.025–0.027 Target: $0.035 / $0.045 Stop Loss: $0.022
The chart doesn't need your approval to keep moving higher.#FedHoldsRatesHawkishDotPlot #Fed4thConsecutiveRateHold #WLDGainsOver50%In7Days
{future}(AGTUSDT)
$AGT nearly doubled and people still call it luck.
At some point, every winning trade looks obvious in hindsight.
Trade Setup: Entry: $0.025–0.027 Target: $0.035 / $0.045 Stop Loss: $0.022
The chart doesn't need your approval to keep moving higher.#FedHoldsRatesHawkishDotPlot #Fed4thConsecutiveRateHold #WLDGainsOver50%In7Days
At some point, every winning trade looks obvious in hindsight.
Trade Setup: Entry: $0.025–0.027 Target: $0.035 / $0.045 Stop Loss: $0.022
The chart doesn't need your approval to keep moving higher.#FedHoldsRatesHawkishDotPlot #Fed4thConsecutiveRateHold #WLDGainsOver50%In7Days
192



·
--
Bearish
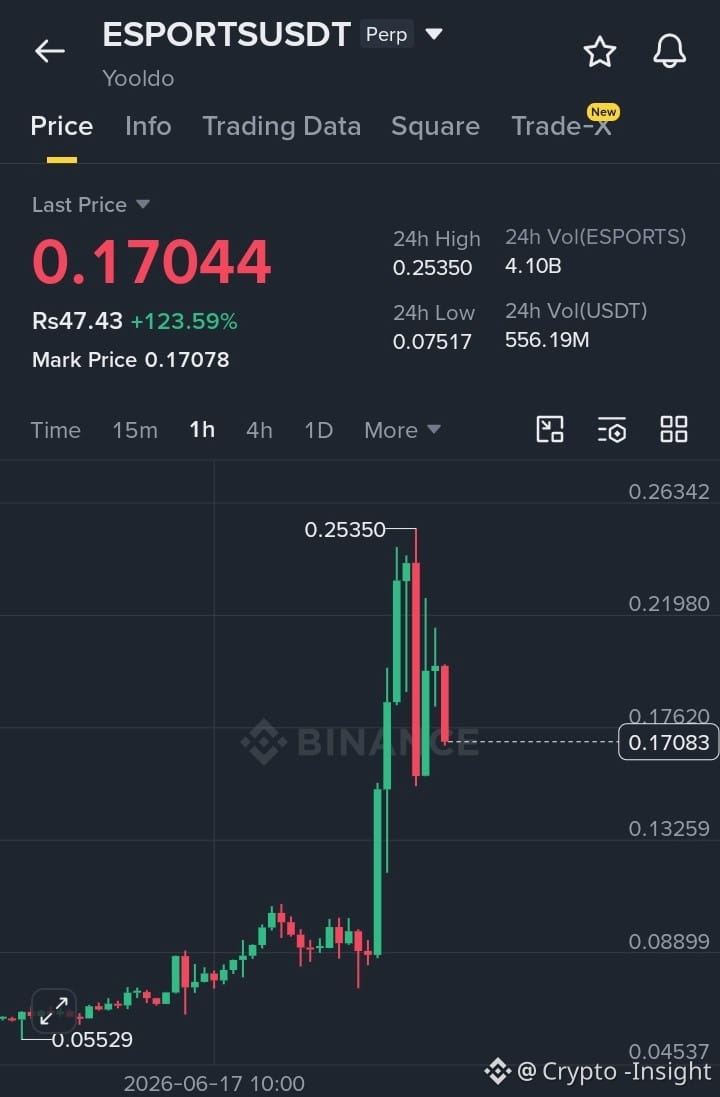
🚀 $ESPORTS /USDT GOES PARABOLIC AS TRADERS CHASE A MONSTER BREAKOUT!
$ESPORTS /USDT has erupted into one of the market's most explosive performers, rocketing to $0.17044 with a staggering +123.59% gain in just 24 hours. After launching from a daily low of $0.07517, the token stormed to an intraday high of $0.25350, delivering massive volatility and attracting aggressive trader attention.
🔥 The volume is absolutely massive, with over 4.10B ESPORTS traded and an incredible 556.19M USDT in trading activity. This level of liquidity signals intense market participation as momentum traders pile into the rally.
📊 Market Snapshot:
• Price: $0.17044
• 24h Change: +123.59%
• 24h High: $0.25350
• 24h Low: $0.07517
• Volume: 4.10B ESPORTS
• Trading Volume: 556.19M USDT
⚡ Despite a strong pullback from the daily peak, ESPORTS remains one of the strongest gainers on the board. The market is now watching whether bulls can reclaim the $0.20-$0.25 zone and continue the momentum wave.
🔥 Triple-digit gains. Billion-token volume. Extreme volatility. This is the type of price action that turns heads across the entire market.
🚨 Smart money is watching. Momentum traders are active. ESPORTS/USDT has become one of the hottest battlegrounds in crypto right now.
#FedHoldsRatesHawkishDotPlot #QatarLNGTankerNearHormuzStrait $ESPORTS
{future}(ESPORTSUSDT)
🚀 $ESPORTS /USDT GOES PARABOLIC AS TRADERS CHASE A MONSTER BREAKOUT!
$ESPORTS /USDT has erupted into one of the market's most explosive performers, rocketing to $0.17044 with a staggering +123.59% gain in just 24 hours. After launching from a daily low of $0.07517, the token stormed to an intraday high of $0.25350, delivering massive volatility and attracting aggressive trader attention.
🔥 The volume is absolutely massive, with over 4.10B ESPORTS traded and an incredible 556.19M USDT in trading activity. This level of liquidity signals intense market participation as momentum traders pile into the rally.
📊 Market Snapshot:
• Price: $0.17044
• 24h Change: +123.59%
• 24h High: $0.25350
• 24h Low: $0.07517
• Volume: 4.10B ESPORTS
• Trading Volume: 556.19M USDT
⚡ Despite a strong pullback from the daily peak, ESPORTS remains one of the strongest gainers on the board. The market is now watching whether bulls can reclaim the $0.20-$0.25 zone and continue the momentum wave.
🔥 Triple-digit gains. Billion-token volume. Extreme volatility. This is the type of price action that turns heads across the entire market.
🚨 Smart money is watching. Momentum traders are active. ESPORTS/USDT has become one of the hottest battlegrounds in crypto right now.
#FedHoldsRatesHawkishDotPlot #QatarLNGTankerNearHormuzStrait $ESPORTS
1
249

·
--
#opg $OPG The part of OpenGradient nobody talks about: where do AI agents get their data? 🤔
Everyone fixates on the model. but a model is only as honest as the inputs it's fed. if an AI agent is trading based on a price feed, and that feed gets spoofed, the smartest model in the world still makes a garbage decision. garbage in, garbage out except now there's real money on it.this is where OPG's data nodes are kinda underrated. they run in secure environments and pipe in trusted external info live market prices, on-chain data while making it way harder to manipulate that input. so it's not just "did the model run correctly," it's "did it run correctly on real data." both halves of the trust problem, not just one.that combo matters more as agents go autonomous. a bot doesn't have a gut feeling that a number looks off. it just acts. so the integrity of the feed is the safety layer.anyway fixed 1B supply, on Base, a16z-backed, focused on verifiable AI end to end. I keep coming back to the data piece because it's the unglamorous part that actually breaks things in the real world.just my 2 cents. NFA 🧠
@OpenGradient
#WLDGainsOver50%In7Days
#Fed4thConsecutiveRateHold
#FedDotPlotHalfFOMCMembersProjectRateHike
#FedHoldsRatesHawkishDotPlot

1
2
127
·
--
Bullish
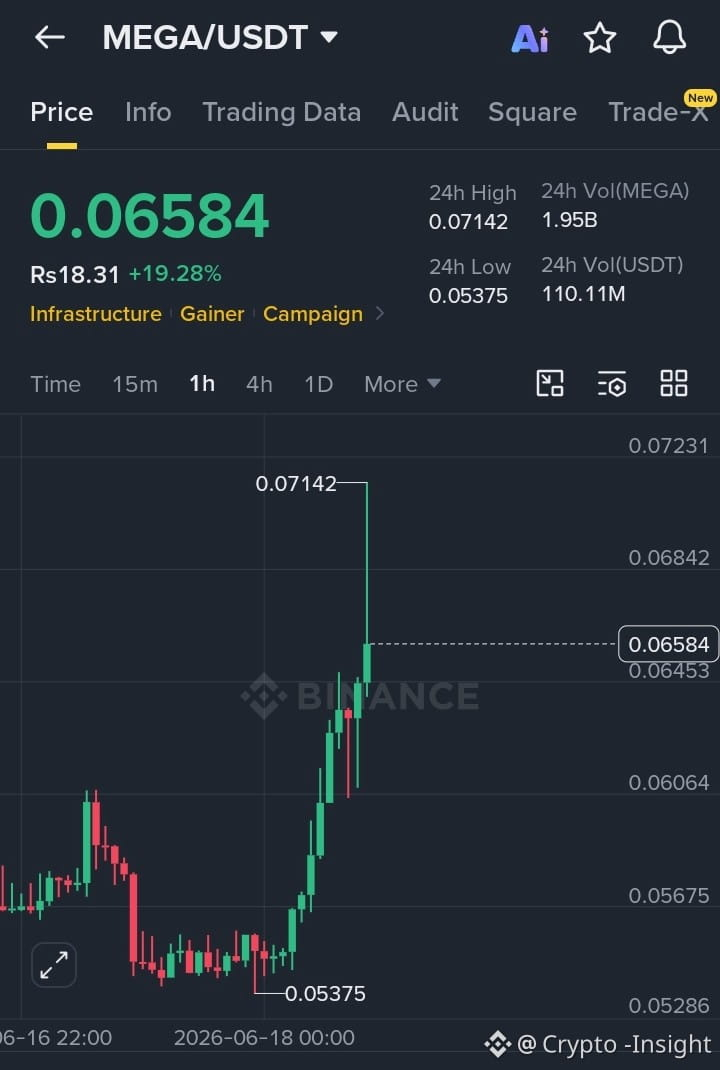
🚀 $MEGA /USDT IGNITES AS VOLUME EXPLODES AND BULLS TAKE OVER!
is turning heads across the market, surging to $0.06584 with an impressive +19.28% gain in the last 24 hours. After bouncing from a daily low of $0.05375, the token powered its way to a high of $0.07142, delivering one of the strongest performances in the Infrastructure sector.
🔥 The real story is the volume. More than 1.95 BILLION MEGA tokens have changed hands, with a staggering 110.11M USDT in trading activity. This level of participation signals aggressive accumulation and growing trader interest.
📊 Market Snapshot:
• Price: $0.06584
• 24h Change: +19.28%
• 24h High: $0.07142
• 24h Low: $0.05375
• Volume: 1.95B MEGA
• Trading Volume: 110.11M USDT
⚡ MEGA is now consolidating after its explosive rally, but the bulls remain firmly in control. If buyers reclaim the $0.0700–$0.0720 zone, another powerful leg higher could quickly follow.
🔥 Massive volume. Strong momentum. Infrastructure narrative gaining strength. MEGA/USDT is emerging as one of the market's hottest breakout candidates.
🚨 Smart money is watching. Volume is flooding in. Momentum is accelerating. MEGA/USDT looks ready for another showdown with resistance.
#FedHoldsRatesHawkishDotPlot #WLDGainsOver50%In7Days $MEGA
{spot}(MEGAUSDT)
🚀 $MEGA /USDT IGNITES AS VOLUME EXPLODES AND BULLS TAKE OVER!
is turning heads across the market, surging to $0.06584 with an impressive +19.28% gain in the last 24 hours. After bouncing from a daily low of $0.05375, the token powered its way to a high of $0.07142, delivering one of the strongest performances in the Infrastructure sector.
🔥 The real story is the volume. More than 1.95 BILLION MEGA tokens have changed hands, with a staggering 110.11M USDT in trading activity. This level of participation signals aggressive accumulation and growing trader interest.
📊 Market Snapshot:
• Price: $0.06584
• 24h Change: +19.28%
• 24h High: $0.07142
• 24h Low: $0.05375
• Volume: 1.95B MEGA
• Trading Volume: 110.11M USDT
⚡ MEGA is now consolidating after its explosive rally, but the bulls remain firmly in control. If buyers reclaim the $0.0700–$0.0720 zone, another powerful leg higher could quickly follow.
🔥 Massive volume. Strong momentum. Infrastructure narrative gaining strength. MEGA/USDT is emerging as one of the market's hottest breakout candidates.
🚨 Smart money is watching. Volume is flooding in. Momentum is accelerating. MEGA/USDT looks ready for another showdown with resistance.
#FedHoldsRatesHawkishDotPlot #WLDGainsOver50%In7Days $MEGA
2
145

·
--
It's emerging. 👀🚀 $WARD
WARD isn't selling a narrative.
It's delivering a product.
🔥Halo.
🔥Permissionless AI.
🔥69 models.
🔥Binance Academy.
$1.8M Market Cap. 🚀🚀$MUB $BNB #WLDGainsOver50%In7Days #Fed4thConsecutiveRateHold #STRCHitsRecordLow #FedDotPlotHalfFOMCMembersProjectRateHike #FedHoldsRatesHawkishDotPlot
WARD isn't selling a narrative.
It's delivering a product.
🔥Halo.
🔥Permissionless AI.
🔥69 models.
🔥Binance Academy.
$1.8M Market Cap. 🚀🚀$MUB $BNB #WLDGainsOver50%In7Days #Fed4thConsecutiveRateHold #STRCHitsRecordLow #FedDotPlotHalfFOMCMembersProjectRateHike #FedHoldsRatesHawkishDotPlot

1
292

·
--
$MITO
{future}(MITOUSDT)
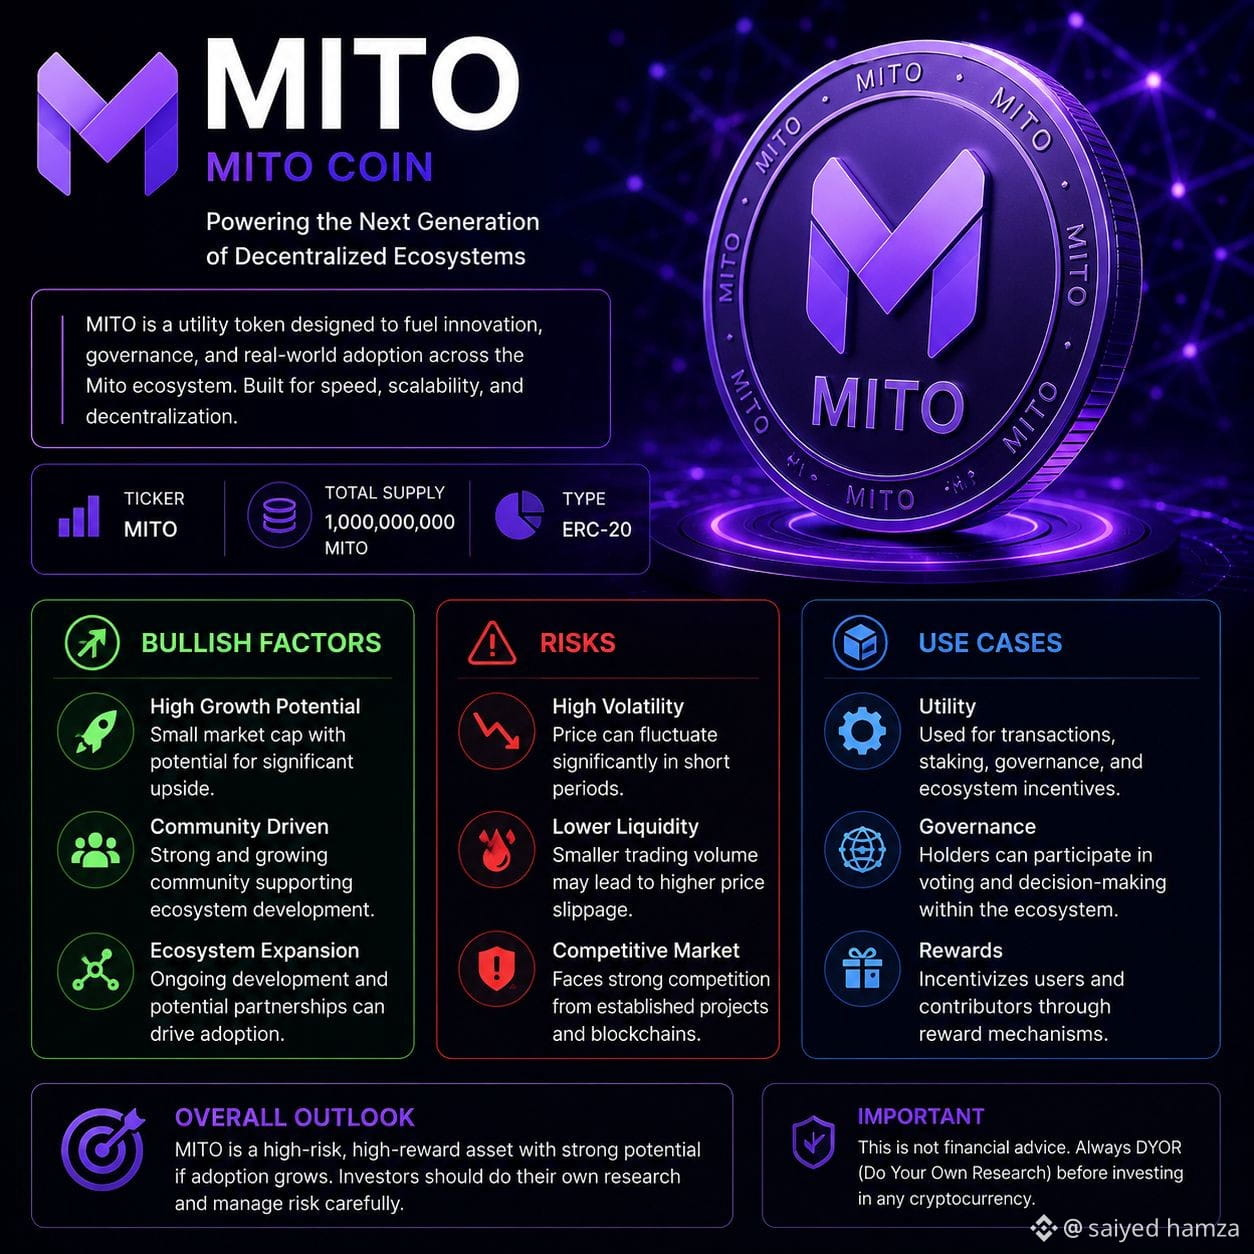
MITO Coin – Short Analysis
MITO is a relatively small-cap cryptocurrency project, so its performance is driven heavily by ecosystem growth, community adoption, and overall crypto market sentiment.
Bullish factors:
Potential for high upside if the project gains users and partnerships.
Small market-cap tokens can experience rapid price appreciation during bullish market cycles.
Community-driven development may support long-term ecosystem growth.
Risks:
Higher volatility and lower liquidity compared to major cryptocurrencies.
Limited adoption and competition from larger, established blockchain projects.
Small-cap tokens are more vulnerable to market sentiment and speculative trading.
Overall:
MITO can be considered a high-risk, high-reward investment. Investors should carefully review the project's utility, team, tokenomics, and trading volume before investing. As with most small-cap crypto assets, proper risk management is essential.#WLDGainsOver50%In7Days #Fed4thConsecutiveRateHold #STRCHitsRecordLow #QatarLNGTankerNearHormuzStrait #FedHoldsRatesHawkishDotPlot
$MITO
MITO Coin – Short Analysis
MITO is a relatively small-cap cryptocurrency project, so its performance is driven heavily by ecosystem growth, community adoption, and overall crypto market sentiment.
Bullish factors:
Potential for high upside if the project gains users and partnerships.
Small market-cap tokens can experience rapid price appreciation during bullish market cycles.
Community-driven development may support long-term ecosystem growth.
Risks:
Higher volatility and lower liquidity compared to major cryptocurrencies.
Limited adoption and competition from larger, established blockchain projects.
Small-cap tokens are more vulnerable to market sentiment and speculative trading.
Overall:
MITO can be considered a high-risk, high-reward investment. Investors should carefully review the project's utility, team, tokenomics, and trading volume before investing. As with most small-cap crypto assets, proper risk management is essential.#WLDGainsOver50%In7Days #Fed4thConsecutiveRateHold #STRCHitsRecordLow #QatarLNGTankerNearHormuzStrait #FedHoldsRatesHawkishDotPlot
80

·
--
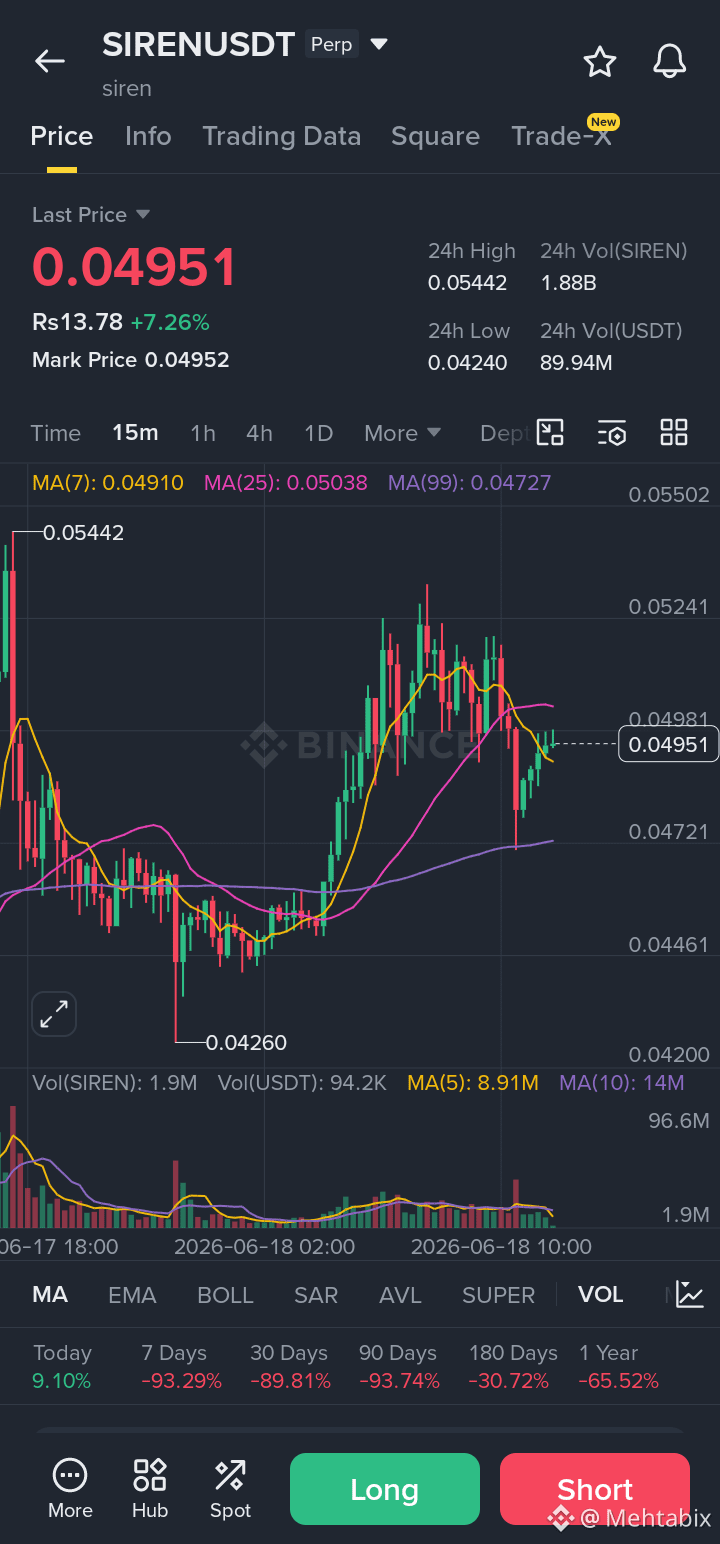
🚨 One development that could strengthen $SIREN s position in the coming weeks is the growing interest in AI-powered crypto projects, especially those combining on-chain analytics with AI capabilities. SIREN has recently gained attention for positioning itself within this narrative, which has helped attract traders and speculative capital. �
📌 Key factors to watch:
🤖 Rising demand for AI + blockchain projects.
📈 Improving price action as buyers defend important support levels.
💰 Increased trading activity and renewed investor attention.
🌐 Broader adoption of AI-related crypto ecosystems. �
TradingView +1
⚠️ Keep in mind that $SIREN remains a high-volatility, speculative token, so its performance will still depend heavily on overall crypto market sentiment and whether the AI narrative continues to attract users and developers. �
coinmarketcap.com +1
{future}(SIRENUSDT)
#Fed4thConsecutiveRateHold #STRCHitsRecordLow #FedHoldsRatesHawkishDotPlot SpotGoldDropsOver$40
🚨 One development that could strengthen $SIREN s position in the coming weeks is the growing interest in AI-powered crypto projects, especially those combining on-chain analytics with AI capabilities. SIREN has recently gained attention for positioning itself within this narrative, which has helped attract traders and speculative capital. �
📌 Key factors to watch:
🤖 Rising demand for AI + blockchain projects.
📈 Improving price action as buyers defend important support levels.
💰 Increased trading activity and renewed investor attention.
🌐 Broader adoption of AI-related crypto ecosystems. �
TradingView +1
⚠️ Keep in mind that $SIREN remains a high-volatility, speculative token, so its performance will still depend heavily on overall crypto market sentiment and whether the AI narrative continues to attract users and developers. �
coinmarketcap.com +1
#Fed4thConsecutiveRateHold #STRCHitsRecordLow #FedHoldsRatesHawkishDotPlot SpotGoldDropsOver$40
1
169


·
--
Bearish
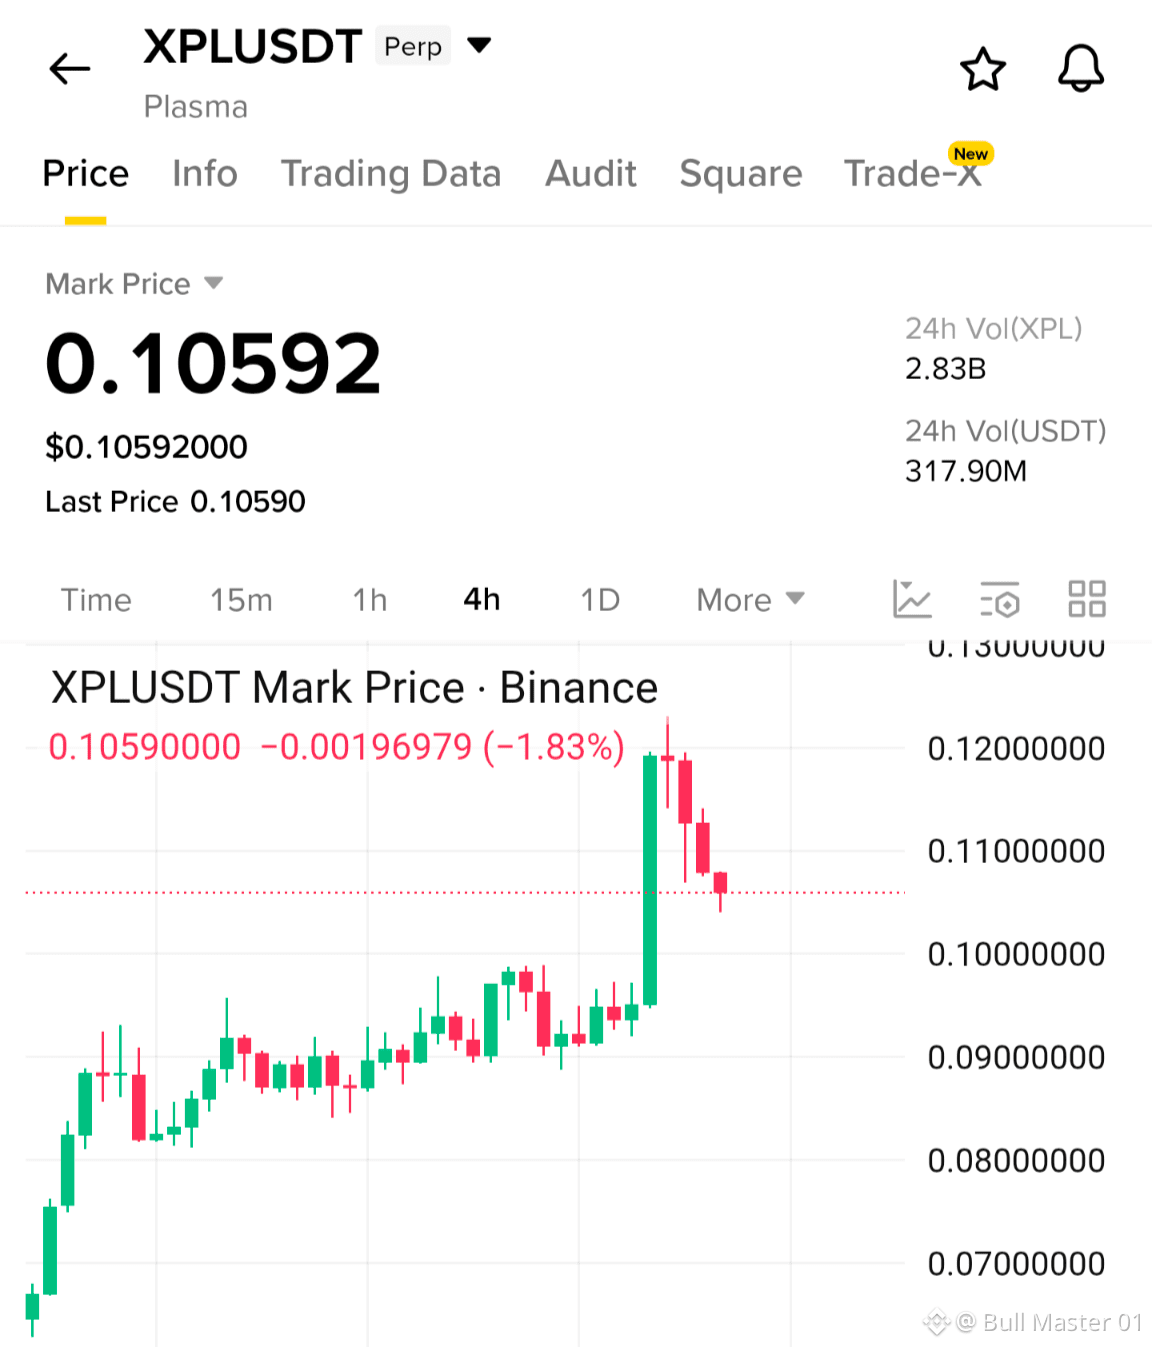
$XPL down 1.8% and rolling over, more downside ahead
Red candle. Rejection from the top...
We were at 0.12 before. That's 13% higher than where we are now. Price is struggling to hold support. No bounce. No reversal.
Why short
The trend is turning down. Next support is 0.10 (6% down), then 0.095 (10% down), then 0.09 (15% down).
Entry: 0.1059–0.1060
Stop: above 0.11
Target: 0.10 then 0.095
Don't fight the red. Ride it down.
0.10 first. Then 0.095. Let it bleed.
Short here 👇🏻
{future}(XPLUSDT)
$SIREN $H #FedHoldsRatesHawkishDotPlot #Fed4thConsecutiveRateHold
$XPL down 1.8% and rolling over, more downside ahead
Red candle. Rejection from the top...
We were at 0.12 before. That's 13% higher than where we are now. Price is struggling to hold support. No bounce. No reversal.
Why short
The trend is turning down. Next support is 0.10 (6% down), then 0.095 (10% down), then 0.09 (15% down).
Entry: 0.1059–0.1060
Stop: above 0.11
Target: 0.10 then 0.095
Don't fight the red. Ride it down.
0.10 first. Then 0.095. Let it bleed.
Short here 👇🏻
$SIREN $H #FedHoldsRatesHawkishDotPlot #Fed4thConsecutiveRateHold
415

·
--
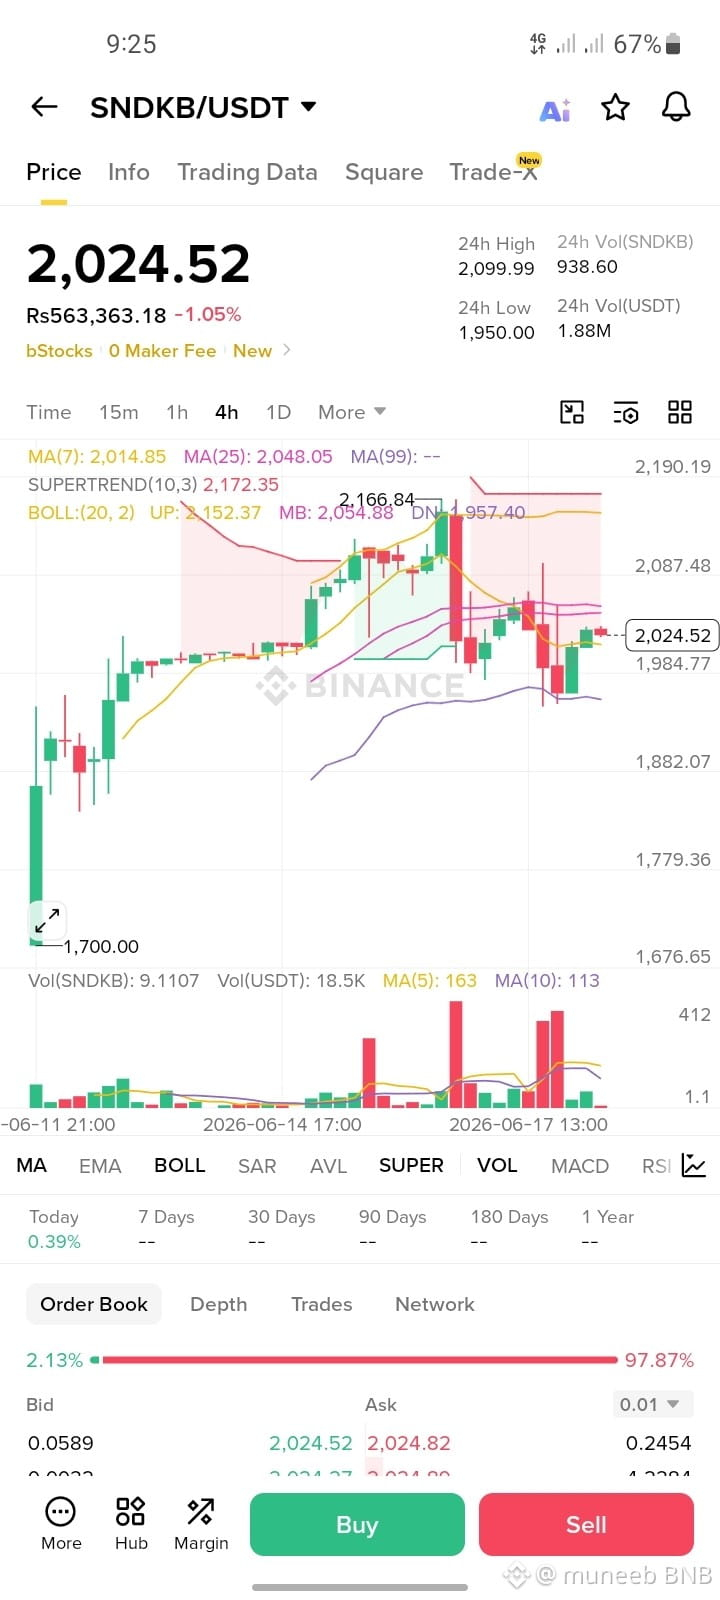
🚨 SNDKB/USDT 4H Chart Alert: Make or Break Zone! 📉📈
SNDKB is flashing mixed signals on the 4-hour chart, and a massive move is brewing. Here is exactly what is happening right now:
The Bearish Pressure: The price recently faced a sharp rejection near the 2,166 level and crashed straight through the middle Bollinger Band (2,054.88).
The Tug-of-War: It is currently trading at 2,024.52, sandwiching itself right between the MA(7) at 2,014.85 (immediate support) and the MA(25) at 2,048.05 (immediate resistance).
Volume Check: The selling volume spiked heavily during the recent drop, meaning the bears are actively defending the upper levels.
🎯 Key Levels to Watch:
Bullish Target: A clean breakout and close above 2,055 could push the price back up to test 2,150+.
Bearish Danger: If it breaks below the lower Bollinger Band support at 1,957.40, expect a deeper drop toward 1,880.
What’s your play here? Are you buying the dip or waiting for a breakdown? 👇
$SNDKB
{spot}(SNDKBUSDT)
#WLDGainsOver50%In7Days #Fed4thConsecutiveRateHold #STRCHitsRecordLow #FedDotPlotHalfFOMCMembersProjectRateHike #FedHoldsRatesHawkishDotPlot
🚨 SNDKB/USDT 4H Chart Alert: Make or Break Zone! 📉📈
SNDKB is flashing mixed signals on the 4-hour chart, and a massive move is brewing. Here is exactly what is happening right now:
The Bearish Pressure: The price recently faced a sharp rejection near the 2,166 level and crashed straight through the middle Bollinger Band (2,054.88).
The Tug-of-War: It is currently trading at 2,024.52, sandwiching itself right between the MA(7) at 2,014.85 (immediate support) and the MA(25) at 2,048.05 (immediate resistance).
Volume Check: The selling volume spiked heavily during the recent drop, meaning the bears are actively defending the upper levels.
🎯 Key Levels to Watch:
Bullish Target: A clean breakout and close above 2,055 could push the price back up to test 2,150+.
Bearish Danger: If it breaks below the lower Bollinger Band support at 1,957.40, expect a deeper drop toward 1,880.
What’s your play here? Are you buying the dip or waiting for a breakdown? 👇
$SNDKB
#WLDGainsOver50%In7Days #Fed4thConsecutiveRateHold #STRCHitsRecordLow #FedDotPlotHalfFOMCMembersProjectRateHike #FedHoldsRatesHawkishDotPlot
68

·
--
☀️ Good Morning Crypto Fam — Thursday, June 18 🌅
Hope everyone slept better than $BTC did last night 😅
Market's still digesting the Fed's hawkish tone from yesterday — $XRP , $SOL , and $DOGE still sitting in the red this morning, but nothing that changes the bigger picture. New day, fresh charts, let's see what unfolds.
🔔 Follow @Sufyaan_Esha for daily updates and market vibes!
#Crypto #BTC #GoodMorning
#WLDGainsOver50%In7Days
#FedHoldsRatesHawkishDotPlot
How's your portfolio looking this morning?
📈 Green, I'm winning
77%
📉 Red, send help
23%
22 votes • Voting closed
866

·
--
#BinancePickAndWin
win prizes
#WLDGainsOver50%In7Days #USStocksSlipAfterFedRateDecision #FedHoldsRatesHawkishDotPlot
$BTC
$ETH
$NVDAB
{spot}(NVDABUSDT)
{spot}(TSLABUSDT)
{spot}(SPCXBUSDT)
#BinancePickAndWin
win prizes
#WLDGainsOver50%In7Days #USStocksSlipAfterFedRateDecision #FedHoldsRatesHawkishDotPlot
$BTC
$ETH
$NVDAB
win prizes
#WLDGainsOver50%In7Days #USStocksSlipAfterFedRateDecision #FedHoldsRatesHawkishDotPlot
$BTC
$ETH
$NVDAB
41

·
--
When Hormuz closed, the Gulf didn't stop.
It improvised.
This map shows you how.
Route 1️⃣: Saudi Arabia's East-West Pipeline (Petroline)
Built exactly for this scenario. Pumps oil 1,200km from Gulf fields to Yanbu on the Red Sea completely bypassing Hormuz.
Capacity:~5 million barrels per day.
Hormuz was moving 17-20 mb/d before the war.
The bypass covers less than 30%
Route 2️⃣: UAE's Khor Fakkan
The UAE's east coast port sits outside the strait in the Gulf of Oman. ADNOC used it for ship to ship transfers, loading tankers that never entered Hormuz.
Remember those 30 million barrels ADNOC just sold to Asia? Many came out this way.
Route 3️⃣: The TIR All-Road Route
Trucks. Actual trucks carrying oil overland Saudi Arabia → Jordan → Israel → Lebanon → Turkey → Europe.
Slow.
Expensive.
A fraction of sea volume.
But it ran.
Route 4️⃣: Around the Peninsula
The long way. Gulf of Aden → Red Sea → SUMED pipeline in Egypt → Mediterranean.
Adds weeks of transit and thousands of miles.
Here's the brutal math?
All these routes combined can handle maybe 7-8 million barrels per day.
Hormuz was doing 17-20.
The gap 10+ mb/d simply didn't move.
This is why workarounds exist but don't work at scale.
Hormuz isn't bypassed.
It's merely partially patched.
$CL
{future}(CLUSDT)
$BZ
{future}(BZUSDT)
$NATGAS
{future}(NATGASUSDT)
#QatarLNGTankerNearHormuzStrait #FedDotPlotHalfFOMCMembersProjectRateHike #STRCHitsRecordLow #FedHoldsRatesHawkishDotPlot #Fed4thConsecutiveRateHold
When Hormuz closed, the Gulf didn't stop.
It improvised.
This map shows you how.
Route 1️⃣: Saudi Arabia's East-West Pipeline (Petroline)
Built exactly for this scenario. Pumps oil 1,200km from Gulf fields to Yanbu on the Red Sea completely bypassing Hormuz.
Capacity:~5 million barrels per day.
Hormuz was moving 17-20 mb/d before the war.
The bypass covers less than 30%
Route 2️⃣: UAE's Khor Fakkan
The UAE's east coast port sits outside the strait in the Gulf of Oman. ADNOC used it for ship to ship transfers, loading tankers that never entered Hormuz.
Remember those 30 million barrels ADNOC just sold to Asia? Many came out this way.
Route 3️⃣: The TIR All-Road Route
Trucks. Actual trucks carrying oil overland Saudi Arabia → Jordan → Israel → Lebanon → Turkey → Europe.
Slow.
Expensive.
A fraction of sea volume.
But it ran.
Route 4️⃣: Around the Peninsula
The long way. Gulf of Aden → Red Sea → SUMED pipeline in Egypt → Mediterranean.
Adds weeks of transit and thousands of miles.
Here's the brutal math?
All these routes combined can handle maybe 7-8 million barrels per day.
Hormuz was doing 17-20.
The gap 10+ mb/d simply didn't move.
This is why workarounds exist but don't work at scale.
Hormuz isn't bypassed.
It's merely partially patched.
$CL
$BZ
$NATGAS
#QatarLNGTankerNearHormuzStrait #FedDotPlotHalfFOMCMembersProjectRateHike #STRCHitsRecordLow #FedHoldsRatesHawkishDotPlot #Fed4thConsecutiveRateHold

1
190
Log in to explore more content
Join global crypto users on Binance Square
⚡️ Get latest and useful information about crypto.
💬 Trusted by the world’s largest crypto exchange.
👍 Discover real insights from verified creators.
Email / Phone number
Trending Topics
1
#FBIConfirmsNorthKoreaIsResponsibleForBinanceCryptoHack
14 views
5 Discussing
2
#BinanceSAFUFundTransferCompleted7499BTC
42,754 views
867 Discussing
3
#BinanceRecovery90% of stolen assets
147,342 views
181 Discussing
4
#YiHe:ProofOfReserves:10TokensAt100%Backing
143,905 views
786 Discussing
5
#BackedNotBroken:RichardTengSaysUsersBearNoLoss
45,759 views
492 Discussing
6
#B14gReportsUnauthorizedTransferOfAbout97MCORE
168 views
9 Discussing
7
#USSpotETHETFsPost23StraightDaysOfNetOutflows
4 views
7 Discussing
8
#CZSaysCompensationIsinPlaceUsersAreProtected
131,528 views
1,412 Discussing
9
#IntelHasItsWorstDaySince1974
50,506 views
722 Discussing
10
#TRMCambodianCasinosReceived$1.07BInCrypto
14,049 views
75 Discussing