

#bitcoinslipsbelow$80kagain
bitcoinslipsbelow$80kagain
Hot
Latest

·
--
Bearish
BTC Is Bleeding While the Whale W Move Out — Stacked Against a Corporate Bid
Seven days of downside, and it wasn't retail that drove.
The: BTC closed ~79,796 on Oct27, down ~2.6% over 7 days and ~5.2% over 30 days. Daily RSI(12) sits at 39.8. The week's range: high ~84,377 (Oct 22), low ~79,220 (Oct 24). No capitulation candle. No reclaim of 84K. Just grind.
The supply side is doing the talking. Dormant wallets moved 2,571 BTC (~$206.5M) toward institutional exchanges. That is supply arriving at the venue, not leaving it. Treasury appetite also cooled — Strategy redirected $204.9M into share buybacks instead of BTC.
The bid underneath is corporate, not speculative. Strive acquired 6,182 BTC (~$511.4M); public firms added 6,200+ BTC combined. That is a real floor argument near $79.7K — but it is a floor, not a breakout catalyst.
Momentum is not on the bulls' side. MACD histogram at −23.99, price under the 99 EMA. Upside is capped below ~$80.5K until that structure fl.
Positioning is mildly bullish, not euphoric. Square community poll: 2,116 bullish vs 1,714 bearish of 3,830 votes A limited sample — worth knowing, not worth trading on alone.
My read: this is distribution into a corporate bid. The floor is real; the momentum is not there. Watching whether the 79.2K–79.7K zone absorbs the exchange inflow is the whole story this week.
{spot}(BTCUSDT)
#BitcoinSlipsBelow$80KAgain
BTC Is Bleeding While the Whale W Move Out — Stacked Against a Corporate Bid
Seven days of downside, and it wasn't retail that drove.
The: BTC closed ~79,796 on Oct27, down ~2.6% over 7 days and ~5.2% over 30 days. Daily RSI(12) sits at 39.8. The week's range: high ~84,377 (Oct 22), low ~79,220 (Oct 24). No capitulation candle. No reclaim of 84K. Just grind.
The supply side is doing the talking. Dormant wallets moved 2,571 BTC (~$206.5M) toward institutional exchanges. That is supply arriving at the venue, not leaving it. Treasury appetite also cooled — Strategy redirected $204.9M into share buybacks instead of BTC.
The bid underneath is corporate, not speculative. Strive acquired 6,182 BTC (~$511.4M); public firms added 6,200+ BTC combined. That is a real floor argument near $79.7K — but it is a floor, not a breakout catalyst.
Momentum is not on the bulls' side. MACD histogram at −23.99, price under the 99 EMA. Upside is capped below ~$80.5K until that structure fl.
Positioning is mildly bullish, not euphoric. Square community poll: 2,116 bullish vs 1,714 bearish of 3,830 votes A limited sample — worth knowing, not worth trading on alone.
My read: this is distribution into a corporate bid. The floor is real; the momentum is not there. Watching whether the 79.2K–79.7K zone absorbs the exchange inflow is the whole story this week.
#BitcoinSlipsBelow$80KAgain
ABO3ZAM:
تحليل واقعي يا صديقي، 79 ألف منطقة مفصلية للمضارب. إذا ما تماسك السعر فوقها، السيولة بتسحبنا لمناطق أعمق تحت، خلنا نراقب إغلاق الشمعة الحالية بحذر 🤝
1
1
849

Article
🚨 THE CORRECTION EQUATION: $BTC LOSES $80K 🚨#bitcoinslipsbelow$80kagain
The bulls have officially lost the psychological line in the sand! Let’s break down the latest Bitcoin breakdown using pure math 🧮👇
(Moving Average Loss) + (Risk-Off Selling) = Key Support Test 📉
Here is the exact technical formula driving the market today:
The Price Input:
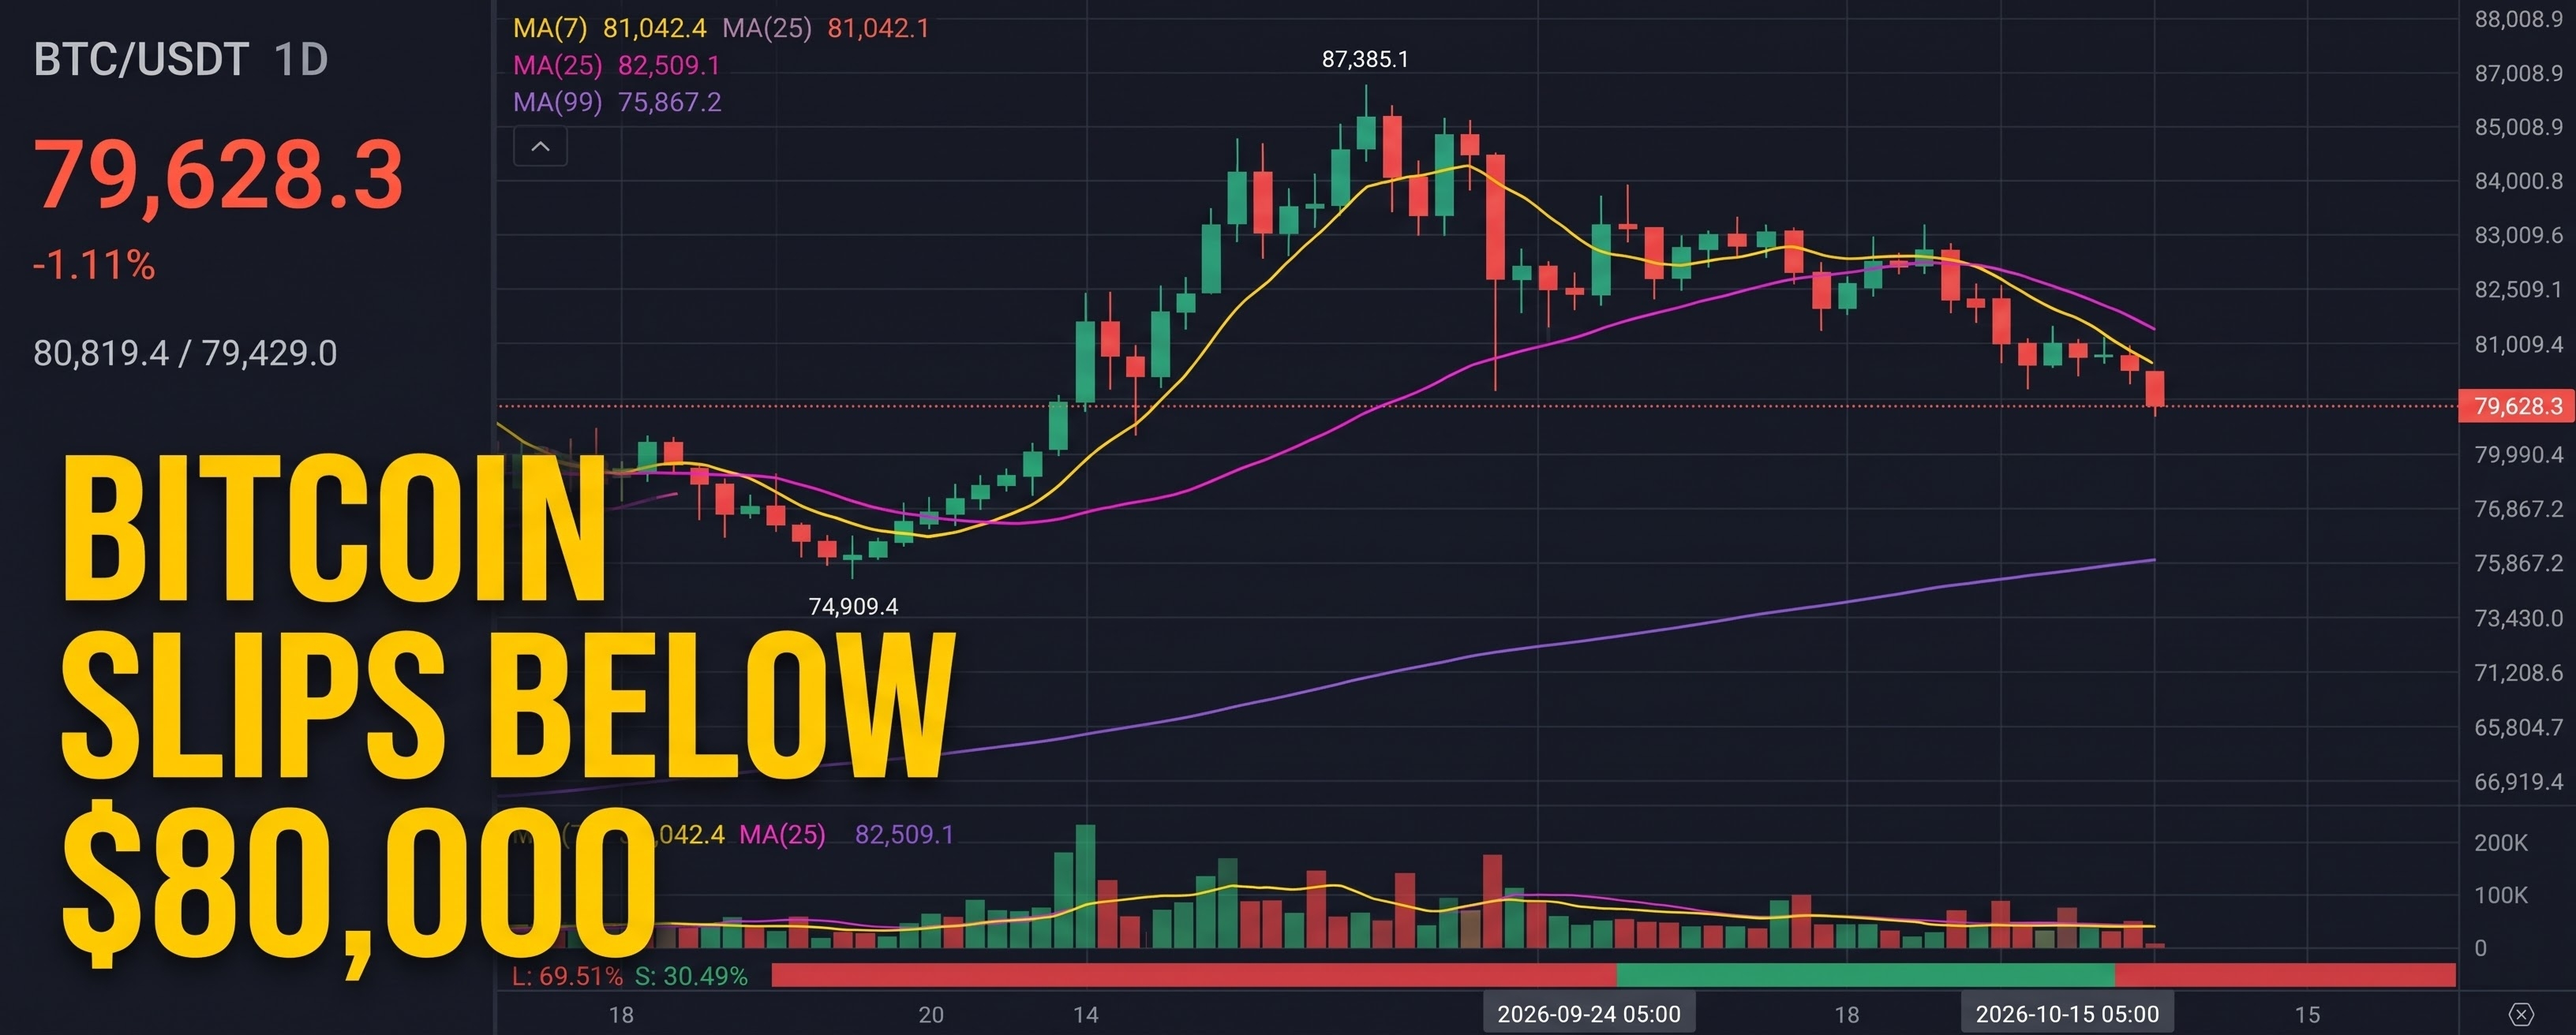
(The Breakdown) = Bitcoin has officially slipped below the critical $80,000 level, currently trading at $79,628 on the Binance Perpetual chart.
The Chart Reality:
(Technical Damage) ➔ Based on the chart data, BTC has decisively lost its short-term momentum indicators, falling below both the MA(7) at $81,042 and the MA(25) at $82,509.
The Breakdown:
With the 24-hour low tagging $79,429, the bears are firmly in control of the immediate trend. The price is now trapped in a downward trajectory, making the longer-term MA(99) sitting all the way down at $75,867 the next major structural defense line for the bulls. If buyers cannot rapidly reclaim the $81K zone, a deeper flush becomes highly probable.
Are you buying this dip or waiting for lower levels? Let's debate! 👇💬
$BTC $AIN $HUMA
{future}(HUMAUSDT)
{future}(BTCUSDT)
{future}(AINUSDT)
#BTC #cryptotrading #Binance #TechnicalAnalysis
🚨 THE CORRECTION EQUATION: $BTC LOSES $80K 🚨
#bitcoinslipsbelow$80kagain
The bulls have officially lost the psychological line in the sand! Let’s break down the latest Bitcoin breakdown using pure math 🧮👇
(Moving Average Loss) + (Risk-Off Selling) = Key Support Test 📉
Here is the exact technical formula driving the market today:
The Price Input:
(The Breakdown) = Bitcoin has officially slipped below the critical $80,000 level, currently trading at $79,628 on the Binance Perpetual chart.
The Chart Reality:
(Technical Damage) ➔ Based on the chart data, BTC has decisively lost its short-term momentum indicators, falling below both the MA(7) at $81,042 and the MA(25) at $82,509.
The Breakdown:
With the 24-hour low tagging $79,429, the bears are firmly in control of the immediate trend. The price is now trapped in a downward trajectory, making the longer-term MA(99) sitting all the way down at $75,867 the next major structural defense line for the bulls. If buyers cannot rapidly reclaim the $81K zone, a deeper flush becomes highly probable.
Are you buying this dip or waiting for lower levels? Let's debate! 👇💬
$BTC $AIN $HUMA
#BTC #cryptotrading #Binance #TechnicalAnalysis
Sharie Wareheim vK9Lرابحه ان شاءالله:
ok
15
18
44.3k


Article
THE CORRECTION EQUATION: $BTC LOSES $80K 🚨#bitcoinslipsbelow$80kagain
The bulls have officially lost the psychological line they were never supposed to cross! Let’s analyze Bitcoin’s latest drop using pure math 🧮👇
(Moving average breakdown) + (Risk-off selling) = Key support test 📉
This is the exact technical formula driving the market today:
The price:
(The breakdown) = Bitcoin has officially fallen below the critical $80,000 level and is currently trading at $79,628 on the Binance perpetuals chart.
THE CORRECTION EQUATION: $BTC LOSES $80K 🚨
#bitcoinslipsbelow$80kagain
The bulls have officially lost the psychological line they were never supposed to cross! Let’s analyze Bitcoin’s latest drop using pure math 🧮👇
(Moving average breakdown) + (Risk-off selling) = Key support test 📉
This is the exact technical formula driving the market today:
The price:
(The breakdown) = Bitcoin has officially fallen below the critical $80,000 level and is currently trading at $79,628 on the Binance perpetuals chart.
ABDULGHAFFAR_00:
Great Article
1
582

·
--
Bullish
🚨 Bitcoin is heading for a red October.
Our thesis: the bear-market bottom is behind us.
Are sellers exhausted—or are bulls ignoring a weak chart?
THE MARKET FILE — RED MONTH, BULLISH THESIS
October 27, 2026
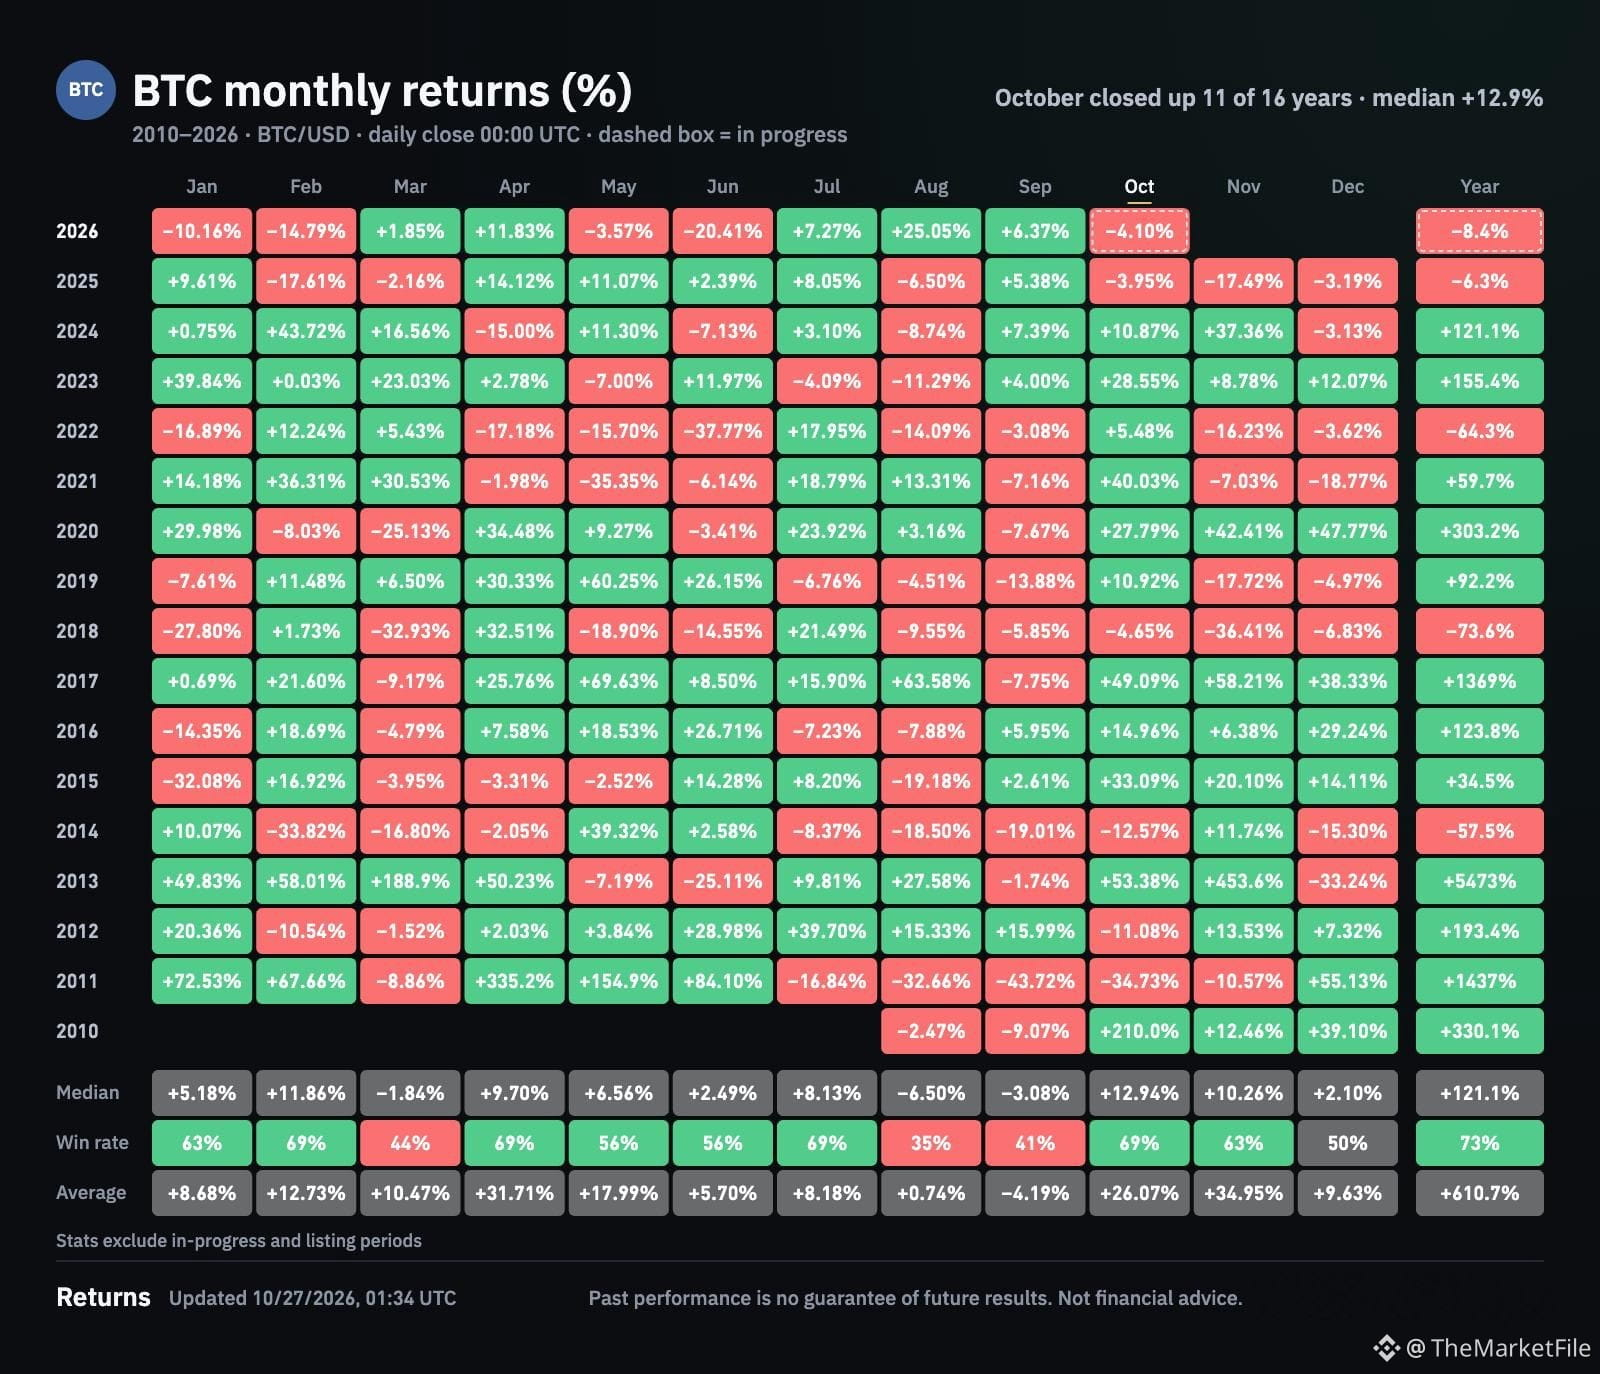
BTC is down roughly 4.1% this month. October hasn’t closed yet.
Four arguments support the bullish case. Each has limits. 👇
📊 1️⃣ LONG-TERM STRUCTURE
BTC reclaimed its 50-week moving average after 44 weeks below it, then posted five weekly closes above it through October 18.
Four comparable historical cases support the thesis—but remain a small sample.
🏦 2️⃣ POSITIONING RESET
Asset managers’ net long exposure in CME BTC futures fell 57% from the all-time-high week.
U.S. spot ETFs added about 87,000 BTC from the June low through the report’s cutoff.
Demand persisted as speculative positions unwound. That doesn’t prove selling is over.
👥 3️⃣ POSSIBLE CAPITULATION
Roughly 30,000 fewer addresses held BTC balances since October 16.
A potential contrarian bottom signal—but addresses aren’t individual investors. Transfers and consolidation also affect the count.
💵 4️⃣ MACRO SUPPORT
High U.S. debt and persistent deficits strengthen the long-term case for a scarce asset.
This thesis plays out over years, not days.
⚠️ HISTORY ISN’T A PROMISE
October was positive in 10 of 13 years from 2013–2025. Yet October 2025 lost 3.95%.
Seasonality won’t save a weak trade.
👀 THE MARKET FILE’S TEST
• Hold $80K and reclaim ~$82.5K: stronger bottom case.
• Sustained break below $79K: weaker case.
These are conditions, not guaranteed floors or targets.
📖 MY READ:
A bullish thesis needs to explain what would prove it wrong.
💬 Accumulation—or a bullish story to justify falling prices?
Name ONE signal that would change your mind.
$BTC
{future}(BTCUSDT)
#bitcoin #BTCanalysis #CryptoMarket #BitcoinSlipsBelow$80KAgain
🚨 Bitcoin is heading for a red October.
Our thesis: the bear-market bottom is behind us.
Are sellers exhausted—or are bulls ignoring a weak chart?
THE MARKET FILE — RED MONTH, BULLISH THESIS
October 27, 2026
BTC is down roughly 4.1% this month. October hasn’t closed yet.
Four arguments support the bullish case. Each has limits. 👇
📊 1️⃣ LONG-TERM STRUCTURE
BTC reclaimed its 50-week moving average after 44 weeks below it, then posted five weekly closes above it through October 18.
Four comparable historical cases support the thesis—but remain a small sample.
🏦 2️⃣ POSITIONING RESET
Asset managers’ net long exposure in CME BTC futures fell 57% from the all-time-high week.
U.S. spot ETFs added about 87,000 BTC from the June low through the report’s cutoff.
Demand persisted as speculative positions unwound. That doesn’t prove selling is over.
👥 3️⃣ POSSIBLE CAPITULATION
Roughly 30,000 fewer addresses held BTC balances since October 16.
A potential contrarian bottom signal—but addresses aren’t individual investors. Transfers and consolidation also affect the count.
💵 4️⃣ MACRO SUPPORT
High U.S. debt and persistent deficits strengthen the long-term case for a scarce asset.
This thesis plays out over years, not days.
⚠️ HISTORY ISN’T A PROMISE
October was positive in 10 of 13 years from 2013–2025. Yet October 2025 lost 3.95%.
Seasonality won’t save a weak trade.
👀 THE MARKET FILE’S TEST
• Hold $80K and reclaim ~$82.5K: stronger bottom case.
• Sustained break below $79K: weaker case.
These are conditions, not guaranteed floors or targets.
📖 MY READ:
A bullish thesis needs to explain what would prove it wrong.
💬 Accumulation—or a bullish story to justify falling prices?
Name ONE signal that would change your mind.
$BTC
#bitcoin #BTCanalysis #CryptoMarket #BitcoinSlipsBelow$80KAgain
2
400


·
--
Bitcoin Slips Below $80K Again: Is $79K the Level That Decides the Next Move?#BitcoinSlipsBelow$80KAgain
$BTC
{spot}(BTCUSDT)
Bitcoin slipped below $80K again, dipping to around $79.3K on Monday, its lowest level in over a month. Three things are weighing on the price: roughly $770M left US spot Bitcoin ETFs on Thursday and Friday, leveraged longs were flushed over the weekend, and traders are cutting risk ahead of Wednesday's Fed decision. Strategy also paused its buying after five straight weeks of additions.
My take: this looks more like cautious positioning than panic. The $80K level has been tested several times, and $79K is the key support I'm watching on the daily close. A sustained break below it could open the door to $75K, while reclaiming $82K would ease the selling pressure. Until the Fed decision is out, I expect choppy, range-bound price action, and I'd rather wait for confirmation than chase a move in either direction.
What's your view: bounce from $79K or a deeper drop? Tell me below 👇
Follow me for more trading content and market updates.
#BTC #CryptoMarkets #BinanceSquare
Bitcoin Slips Below $80K Again: Is $79K the Level That Decides the Next Move?
#BitcoinSlipsBelow$80KAgain
$BTC
Bitcoin slipped below $80K again, dipping to around $79.3K on Monday, its lowest level in over a month. Three things are weighing on the price: roughly $770M left US spot Bitcoin ETFs on Thursday and Friday, leveraged longs were flushed over the weekend, and traders are cutting risk ahead of Wednesday's Fed decision. Strategy also paused its buying after five straight weeks of additions.
My take: this looks more like cautious positioning than panic. The $80K level has been tested several times, and $79K is the key support I'm watching on the daily close. A sustained break below it could open the door to $75K, while reclaiming $82K would ease the selling pressure. Until the Fed decision is out, I expect choppy, range-bound price action, and I'd rather wait for confirmation than chase a move in either direction.
What's your view: bounce from $79K or a deeper drop? Tell me below 👇
Follow me for more trading content and market updates.
#BTC #CryptoMarkets #BinanceSquare
1
8.7k

·
--
Bullish
Bitcoin just made a slight "U-turn" back to the low 79k range, sending everyone into a frenzy, shouting #BitcoinSlipsBelow$80KAgain ! A detailed analysis shows that over the past 24 hours, it’s only gained 0.42%—barely moving, as if it’s run out of gas. Add the U.S. midterm elections, making the candles jump around, and Willy Woo’s simulation of 10,000 scenarios predicting $1 million by 2033, and you’ve got everyone "believing it—but not quite buying it."
What should traders do now?
1️⃣ Don’t panic: Glassnode says selling pressure has eased, and this position looks better than it did last month.
2️⃣ Close the app and go to sleep. Wait for it to consolidate or "get back to breakeven."
3️⃣ Buckle up and get ready for the 2028 peak!
This is not financial advice! Sign up for Binance now to buy the dip: [binance.com](https://www.binance.com/register?ref=VINHTOCDO) (Referral code: VINHTOCDO).
Click a trade below to support me:
$BTC
{spot}(BTCUSDT)
$ETH
{spot}(ETHUSDT)
$BNB
{spot}(BNBUSDT)
#VINHTOCDO #CryptoTrading #BitcoinUpdate #CryptoNews #BullRun #Altcoins
Bitcoin just made a slight "U-turn" back to the low 79k range, sending everyone into a frenzy, shouting #BitcoinSlipsBelow$80KAgain ! A detailed analysis shows that over the past 24 hours, it’s only gained 0.42%—barely moving, as if it’s run out of gas. Add the U.S. midterm elections, making the candles jump around, and Willy Woo’s simulation of 10,000 scenarios predicting $1 million by 2033, and you’ve got everyone "believing it—but not quite buying it."
What should traders do now?
1️⃣ Don’t panic: Glassnode says selling pressure has eased, and this position looks better than it did last month.
2️⃣ Close the app and go to sleep. Wait for it to consolidate or "get back to breakeven."
3️⃣ Buckle up and get ready for the 2028 peak!
This is not financial advice! Sign up for Binance now to buy the dip: binance.com (Referral code: VINHTOCDO).
Click a trade below to support me:
$BTC
$ETH
$BNB
#VINHTOCDO #CryptoTrading #BitcoinUpdate #CryptoNews #BullRun #Altcoins

5
325

·
--
is Bitcoin breaking $80,000 or just chewing on it? I'm on "chewing", for now
#BitcoinSlipsBelow$80KAgain is true. read the $BTC
{future}(BTCUSDT)
candles though:
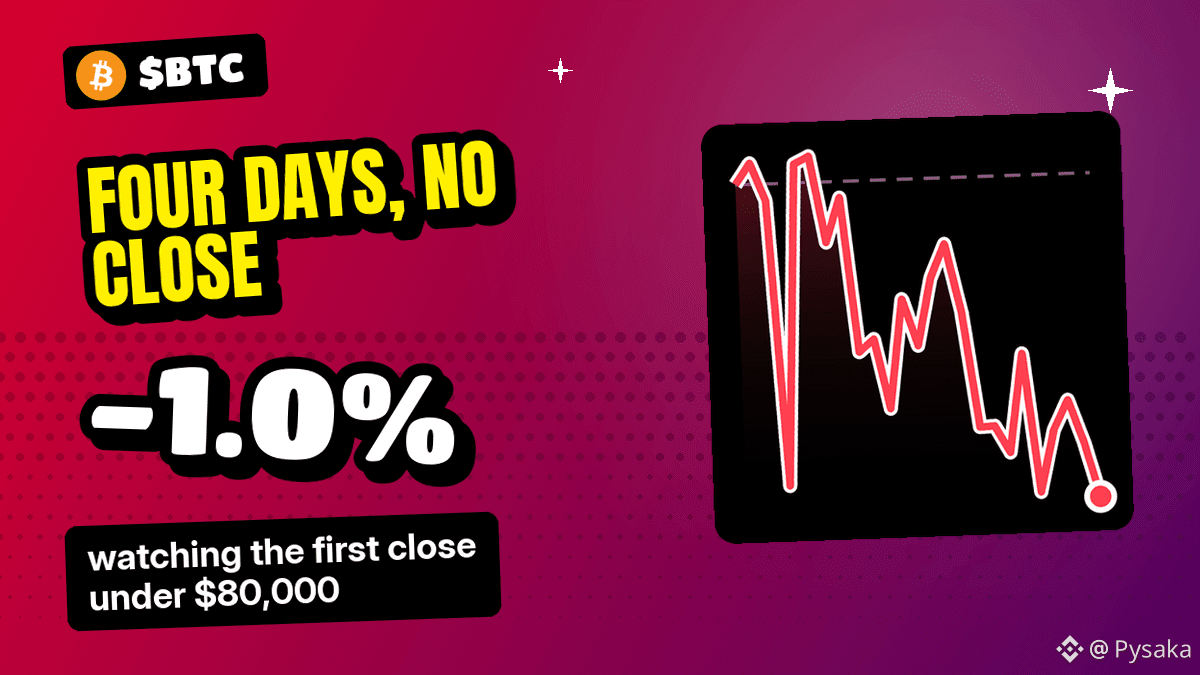
🔸 first trade under $80,000: October 24, 14:00 UTC hour
🔸 deepest point: 79,220.74, same Saturday
🔸 daily closes since: 80,888.16, 80,154.09, 80,150.56
every close held. that's why I don't call it a breakdown
the Saturday flush was the real event: $436.44 million liquidated across crypto in four hours, $404.15 million of it longs. Monday's 24h was $154.23 million. the panic already happened
the line that changes my mind: the first daily close below $80,000 since September 17
I don't hold BTC, just watching. Fed on October 28, an estimated $11 billion of options expiring October 30, I'll write up whichever way it closes, follow if you want it
is Bitcoin breaking $80,000 or just chewing on it? I'm on "chewing", for now
#BitcoinSlipsBelow$80KAgain is true. read the $BTC
candles though:
🔸 first trade under $80,000: October 24, 14:00 UTC hour
🔸 deepest point: 79,220.74, same Saturday
🔸 daily closes since: 80,888.16, 80,154.09, 80,150.56
every close held. that's why I don't call it a breakdown
the Saturday flush was the real event: $436.44 million liquidated across crypto in four hours, $404.15 million of it longs. Monday's 24h was $154.23 million. the panic already happened
the line that changes my mind: the first daily close below $80,000 since September 17
I don't hold BTC, just watching. Fed on October 28, an estimated $11 billion of options expiring October 30, I'll write up whichever way it closes, follow if you want it
83

·
--
Bullish
#BitcoinSlipsBelow$80KAgain Bitcoin has slipped below the $80,000 threshold again, signaling a notable shift in short-term market momentum. This recent price pullback highlights the ongoing battle between buyers and sellers at these elevated price levels. For traders, breaching this key psychological barrier reflects underlying liquidity dynamics and shifting risk appetite across the broader digital asset ecosystem.
The drop below $80k matters because it tests critical technical support zones. When a major round number fails to hold, it often triggers automated stop-losses, accelerating downward price pressure. However, it also presents a potential accumulation opportunity for long-term investors who view these dips as strategic entry points. Overall market sentiment is currently transitioning from exuberance to caution, with traders closely monitoring order books for signs of a definitive bottom.
Looking ahead, market participants should watch trading volume and spot ETF flows to gauge the true strength of this correction. If Bitcoin can reclaim $80,000 with strong volume, the broader bullish structure remains intact. Conversely, a sustained break could open the path toward the $75,000 support region. Navigating this current market volatility requires strict risk management and patience.
#Bitcoin #CryptoMarket #BTC #Trading
$HUMA $BANK $BTC
{future}(BTCUSDT)
{future}(BANKUSDT)
{future}(HUMAUSDT)
#BitcoinSlipsBelow$80KAgain Bitcoin has slipped below the $80,000 threshold again, signaling a notable shift in short-term market momentum. This recent price pullback highlights the ongoing battle between buyers and sellers at these elevated price levels. For traders, breaching this key psychological barrier reflects underlying liquidity dynamics and shifting risk appetite across the broader digital asset ecosystem.
The drop below $80k matters because it tests critical technical support zones. When a major round number fails to hold, it often triggers automated stop-losses, accelerating downward price pressure. However, it also presents a potential accumulation opportunity for long-term investors who view these dips as strategic entry points. Overall market sentiment is currently transitioning from exuberance to caution, with traders closely monitoring order books for signs of a definitive bottom.
Looking ahead, market participants should watch trading volume and spot ETF flows to gauge the true strength of this correction. If Bitcoin can reclaim $80,000 with strong volume, the broader bullish structure remains intact. Conversely, a sustained break could open the path toward the $75,000 support region. Navigating this current market volatility requires strict risk management and patience.
#Bitcoin #CryptoMarket #BTC #Trading
$HUMA $BANK $BTC

466

·
--
Bullish
📊 $BTC # Short Analysis — 27 October 2026
💰 Current Price: Approximately $80,400 USD.
📉 Market Trend: Short-term bearish to sideways. Bitcoin has been trading below $80,000 recently as investors await the US Federal Reserve’s interest-rate decision.
🔑 Key Price Levels
* Support: $79,000 and $78,000
* Resistance: $80,800 and $82,000
* Bullish signal: A sustained move above $82,000.
* Bearish signal: A break below $78,000.
🔮 Short-Term Outlook: Bitcoin may consolidate between $79,000 and $81,000. A breakout in either direction could trigger a stronger move.
⚠️ Risk Warning: Bitcoin is highly volatile. These levels are indicative, not guaranteed. This is market analysis, not financial advice.
Analysis date: 27 October 2026. Prices can change rapidly.
#BitcoinSlipsBelow$80KAgain #CanMicrosoftDeliverOnAI #CanGoogleDefindItsCore #FOMCWatch
$BTC
{future}(BTCUSDT)
📊 $BTC # Short Analysis — 27 October 2026
💰 Current Price: Approximately $80,400 USD.
📉 Market Trend: Short-term bearish to sideways. Bitcoin has been trading below $80,000 recently as investors await the US Federal Reserve’s interest-rate decision.
🔑 Key Price Levels
* Support: $79,000 and $78,000
* Resistance: $80,800 and $82,000
* Bullish signal: A sustained move above $82,000.
* Bearish signal: A break below $78,000.
🔮 Short-Term Outlook: Bitcoin may consolidate between $79,000 and $81,000. A breakout in either direction could trigger a stronger move.
⚠️ Risk Warning: Bitcoin is highly volatile. These levels are indicative, not guaranteed. This is market analysis, not financial advice.
Analysis date: 27 October 2026. Prices can change rapidly.
#BitcoinSlipsBelow$80KAgain #CanMicrosoftDeliverOnAI #CanGoogleDefindItsCore #FOMCWatch
$BTC

·
--
Bearish
#BitcoinSlipsBelow$80KAgain
🚨 BITCOIN SLIPS BELOW $80,000 AGAIN — WILL BEARS TAKE CONTROL?
Bitcoin ($BTC) has fallen below the psychologically important $80,000 level again, putting traders on alert as the market heads into a crucial Federal Reserve policy meeting on October 28.
📉 What’s Behind the Decline?
Several factors are weighing on market sentiment:
Fed uncertainty: Traders are reducing risk exposure while waiting for signals on interest rates and future monetary policy.
ETF outflows: U.S. spot Bitcoin ETFs experienced significant withdrawals late last week, adding pressure to sentiment.
Broader market weakness: Concerns surrounding technology stocks and risk appetite are also affecting crypto markets.
According to recent market reports, BTC traded below $80,000, with prices briefly falling toward $79,300 before recovering some losses.
📊 What Should Traders Watch?
🔴 Bearish scenario: If BTC remains below $80,000 and selling pressure continues, the market could test lower support levels.
🟢 Bullish scenario: A convincing move back above $80,000, followed by sustained buying volume, could signal that buyers are regaining control.
⚠️ The Bigger Picture
Bitcoin’s next move may depend less on headlines alone and more on the Federal Reserve’s messaging, ETF flows, and whether buyers can defend nearby support.
Trader takeaway: Avoid chasing the breakdown. Watch price action around $80,000, confirm the trend with volume, and manage leverage carefully. A break below support is not automatically a guaranteed crash, just as a recovery is not proof of a new rally.
#bitcoin #BTC #CryptoMarket #BitcoinNews
$PLAY $FOGO $CVX
{future}(CVXUSDT)
{future}(FOGOUSDT)
{future}(PLAYUSDT)
#BitcoinSlipsBelow$80KAgain
🚨 BITCOIN SLIPS BELOW $80,000 AGAIN — WILL BEARS TAKE CONTROL?
Bitcoin ($BTC) has fallen below the psychologically important $80,000 level again, putting traders on alert as the market heads into a crucial Federal Reserve policy meeting on October 28.
📉 What’s Behind the Decline?
Several factors are weighing on market sentiment:
Fed uncertainty: Traders are reducing risk exposure while waiting for signals on interest rates and future monetary policy.
ETF outflows: U.S. spot Bitcoin ETFs experienced significant withdrawals late last week, adding pressure to sentiment.
Broader market weakness: Concerns surrounding technology stocks and risk appetite are also affecting crypto markets.
According to recent market reports, BTC traded below $80,000, with prices briefly falling toward $79,300 before recovering some losses.
📊 What Should Traders Watch?
🔴 Bearish scenario: If BTC remains below $80,000 and selling pressure continues, the market could test lower support levels.
🟢 Bullish scenario: A convincing move back above $80,000, followed by sustained buying volume, could signal that buyers are regaining control.
⚠️ The Bigger Picture
Bitcoin’s next move may depend less on headlines alone and more on the Federal Reserve’s messaging, ETF flows, and whether buyers can defend nearby support.
Trader takeaway: Avoid chasing the breakdown. Watch price action around $80,000, confirm the trend with volume, and manage leverage carefully. A break below support is not automatically a guaranteed crash, just as a recovery is not proof of a new rally.
#bitcoin #BTC #CryptoMarket #BitcoinNews
$PLAY $FOGO $CVX

68

·
--
Bullish
#BitcoinSlipsBelow$80KAgain bitcoinslipsbelow$80kagain Bitcoin falls below $80K again. Volatility returns to the market as investors assess macroeconomic conditions and ETF flows. Temporary correction or the start of a new phase? 👀📉 #Bitcoin #BTC $BTC
{spot}(BTCUSDT)
#BitcoinSlipsBelow$80KAgain bitcoinslipsbelow$80kagain Bitcoin falls below $80K again. Volatility returns to the market as investors assess macroeconomic conditions and ETF flows. Temporary correction or the start of a new phase? 👀📉 #Bitcoin #BTC $BTC
5

#BitcoinSlipsBelow$80KAgain
🚨 THE $80K BATTLE Is Bitcoin Shaking Out Longs or Preparing for a Deeper Drop? 📉
Bitcoin ($BTC) has officially slipped below the psychological $80,000 threshold again, currently grinding around the $79,600 – $79,800 zone. The short-term momentum indicators are flashing red as BTC fell below its MA(7) and MA(25) lines, leaving traders wondering: Is this a trap, or the perfect buy-the-dip window?
Here is the exact market breakdown you need to know today:
🔍 Technical Reality Check: Key Support & Resistance
• The Floor to Watch: Buyers urgently need to defend the $79,000 – $79,200 support zone. A clean breakdown below this could accelerate selling pressure down to the next major demand area near $75,800 (MA(99)).
• The Bullish Reclaim: To completely invalidate this immediate bearish structure, bulls must reclaim the $80,800 – $82,500 area with high volume.
📊 Behind the Scenes: What's Driving the Move?
• Macro Caution: Traders are actively cutting risk ahead of the upcoming Fed interest rate decision.
• Liquidation Wave: Over $400M+ in over-leveraged long positions were flushed out recently, wiping out speculative froth and cooling down funding rates.
• The Corporate Bid vs. AI Rotation: While institutional whales and public firms continue to bid and set a solid long-term floor, massive liquidity is temporarily rotating into massive tech AI capital plays.
💡 The Strategy
This looks more like a healthy macro-driven consolidation and risk-off positioning rather than absolute panic. Avoid chasing high-leverage trades in this volatility and focus on spot accumulation zones.
💬 Let's Debate Below:
Are you aggressively buying this $79K dip, or are you sitting on cash waiting for lower levels? Drop your strategy in the comments! 👇
#BTC #cryptotrading #Binance #TechnicalAnalysis
$BTC $HUMA $AIN
{future}(AINUSDT)
{future}(HUMAUSDT)
{future}(BTCUSDT)
#BitcoinSlipsBelow$80KAgain
🚨 THE $80K BATTLE Is Bitcoin Shaking Out Longs or Preparing for a Deeper Drop? 📉
Bitcoin ($BTC ) has officially slipped below the psychological $80,000 threshold again, currently grinding around the $79,600 – $79,800 zone. The short-term momentum indicators are flashing red as BTC fell below its MA(7) and MA(25) lines, leaving traders wondering: Is this a trap, or the perfect buy-the-dip window?
Here is the exact market breakdown you need to know today:
🔍 Technical Reality Check: Key Support & Resistance
• The Floor to Watch: Buyers urgently need to defend the $79,000 – $79,200 support zone. A clean breakdown below this could accelerate selling pressure down to the next major demand area near $75,800 (MA(99)).
• The Bullish Reclaim: To completely invalidate this immediate bearish structure, bulls must reclaim the $80,800 – $82,500 area with high volume.
📊 Behind the Scenes: What's Driving the Move?
• Macro Caution: Traders are actively cutting risk ahead of the upcoming Fed interest rate decision.
• Liquidation Wave: Over $400M+ in over-leveraged long positions were flushed out recently, wiping out speculative froth and cooling down funding rates.
• The Corporate Bid vs. AI Rotation: While institutional whales and public firms continue to bid and set a solid long-term floor, massive liquidity is temporarily rotating into massive tech AI capital plays.
💡 The Strategy
This looks more like a healthy macro-driven consolidation and risk-off positioning rather than absolute panic. Avoid chasing high-leverage trades in this volatility and focus on spot accumulation zones.
💬 Let's Debate Below:
Are you aggressively buying this $79K dip, or are you sitting on cash waiting for lower levels? Drop your strategy in the comments! 👇
#BTC #cryptotrading #Binance #TechnicalAnalysis
$BTC $HUMA $AIN

160

·
--
🚨 BITCOIN BELOW $80K — THESE SUPPORT ZONES MATTER NOW
Bitcoin has slipped below the psychological $80,000 level, and traders are watching the next key support areas closely.
📉 BTC SUPPORT BREAKDOWN
🔹 $79,400–$79,000 — Immediate support zone. Buyers need to defend this area to prevent further weakness
🔹 $78,000–$78,600 — Next important support. A breakdown below this zone could accelerate selling pressure
🔹 $75,500–$76,000 — Major downside area if BTC loses the $78K region
🔹 $74,800–$75,000 — Deeper support zone that could become important during a stronger correction
📊 What Traders Should Watch
If Bitcoin reclaims $80K and holds above it, a recovery toward $80,800–$82,000 becomes possible
However, a sustained breakdown below $78K could expose BTC to the $75.5K region
Remember, support zones are areas of potential buying interest, not guaranteed reversal points
Will Bitcoin defend $78K, or are bears targeting $75K next?
These are technical reference zones, not guaranteed price targets. Recent market analysis places immediate support near $79.4K and the next major zone around $77.8K–$78.1K, with $75.5K as a broader downside area.
#BitcoinSlipsBelow$80KAgain $BTC
{future}(BTCUSDT)
🚨 BITCOIN BELOW $80K — THESE SUPPORT ZONES MATTER NOW
Bitcoin has slipped below the psychological $80,000 level, and traders are watching the next key support areas closely.
📉 BTC SUPPORT BREAKDOWN
🔹 $79,400–$79,000 — Immediate support zone. Buyers need to defend this area to prevent further weakness
🔹 $78,000–$78,600 — Next important support. A breakdown below this zone could accelerate selling pressure
🔹 $75,500–$76,000 — Major downside area if BTC loses the $78K region
🔹 $74,800–$75,000 — Deeper support zone that could become important during a stronger correction
📊 What Traders Should Watch
If Bitcoin reclaims $80K and holds above it, a recovery toward $80,800–$82,000 becomes possible
However, a sustained breakdown below $78K could expose BTC to the $75.5K region
Remember, support zones are areas of potential buying interest, not guaranteed reversal points
Will Bitcoin defend $78K, or are bears targeting $75K next?
These are technical reference zones, not guaranteed price targets. Recent market analysis places immediate support near $79.4K and the next major zone around $77.8K–$78.1K, with $75.5K as a broader downside area.
#BitcoinSlipsBelow$80KAgain $BTC
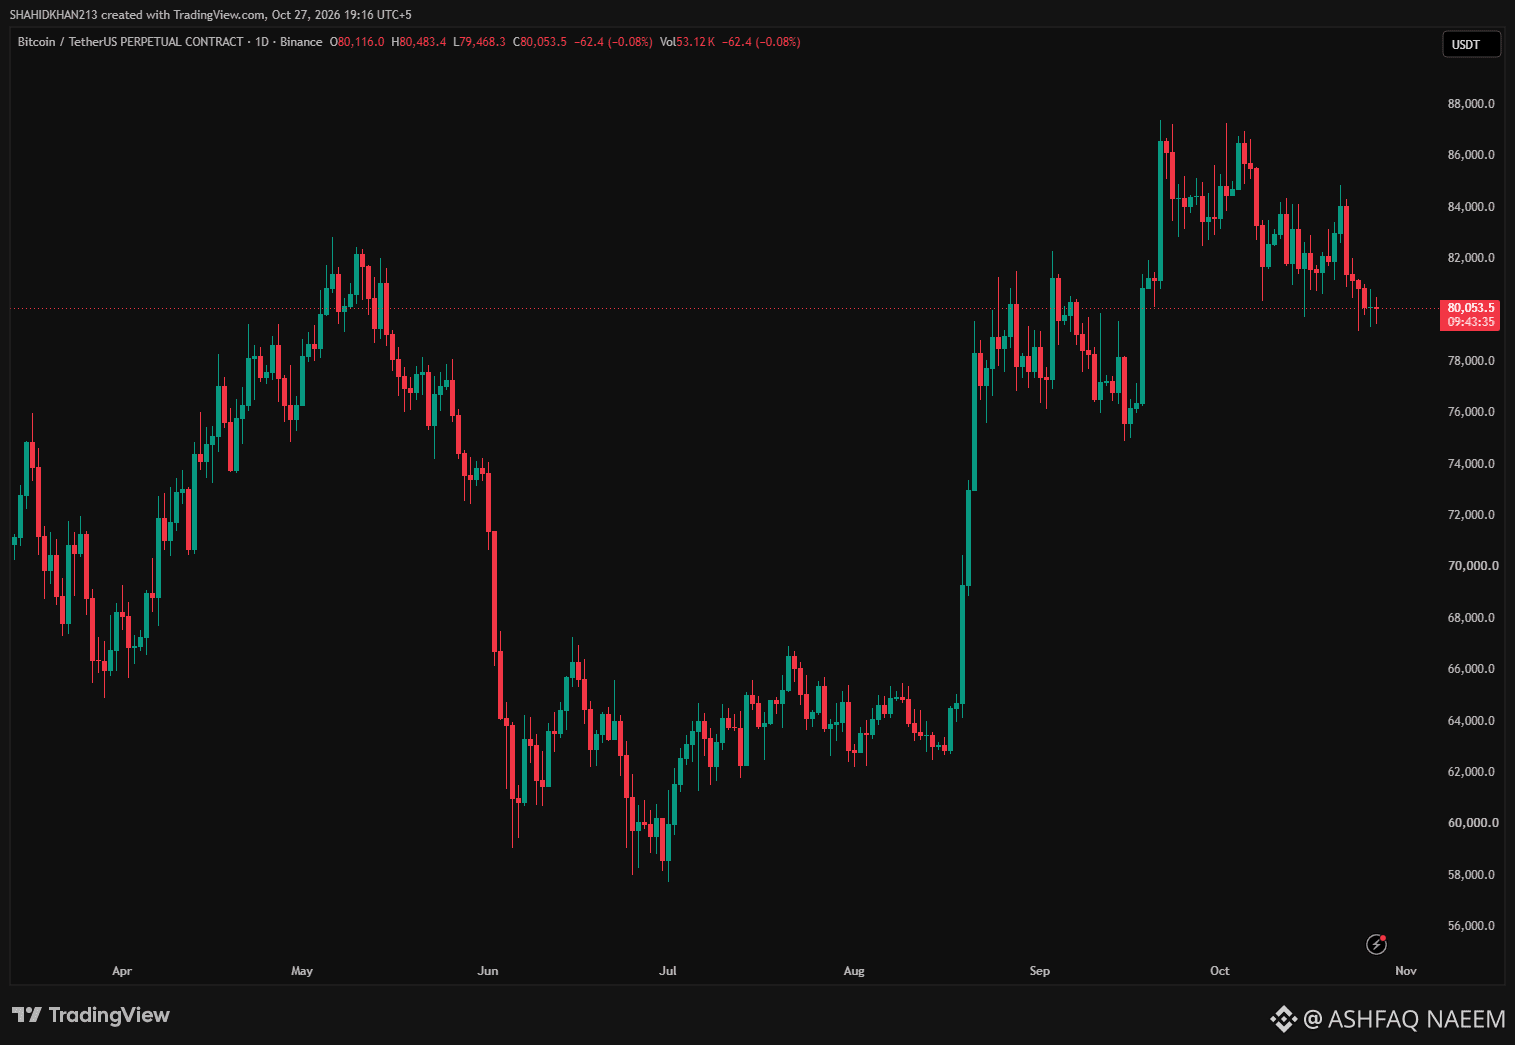
8


Article
Bitcoin Analysis Today - October 27, 2026Price: ∼$79,700 - $80,000
BTC is trading below the psychological $80K level today. Down ∼0.4% since midnight UTC.
Today's range: $79,468 - $80,364
Current: Around $80,084 / $79,760 on other exchanges
Weekly trend: Down 2.5% over past week and down 2.10% on the 7-day c996f722ef1e51cb1e6f
Technical Levels:
Support: $79,278 and $79,145, with a major bid wall at $79,000 (401 BTC)
Resistance: $80,710 and $80,925, ask wall at $80,800 - $80,900
Momentum: Daily MACD at -588 (weak short-term), Weekly MACD at 2,130 (firmer long-term)
Sentiment: Fear & Greed 48 - Neutral, down from 50 yesterday 3447c996ef1eeacf
Market Drivers Today:
Fed Meeting: The Fed begins 2-day meeting today, decision Wednesday. Market pricing 90% chance of no change. Traders cautious ahead of it.
AI vs Crypto: Capital rotating to AI. Meta announced $95B capital raise and Anthropic filed for IPO aiming up to $100B - nearly $200B going to AI, not crypto. Asian tech stocks rallied (Kospi +3.1%) but crypto didn't follow.
ETF Flows: Spot BTC ETFs took in $110M on Monday after 2 days of outflows, but had seen $635.6M outflows on Oct 22.
Liquidations: Last 24h - $13.9M longs and $8.0M shorts liquidated. de0662ff0599c996
Short-term Outlook:
Consolidation below $80K with max pain at $80,000 for tomorrow's expiry. Volume is up 36% to $25.7B despite price decline - shows increased participation but no clear direction. Need to hold $79K or risk drop to $78K. Break above $80,800 wall needed for bullish continuation.$BTC #EthereumDropsBelow$2300 #FOMCWatch #BitcoinSlipsBelow$80KAgain
{future}(BTCUSDT)
Bitcoin Analysis Today - October 27, 2026
Price: ∼$79,700 - $80,000
BTC is trading below the psychological $80K level today. Down ∼0.4% since midnight UTC.
Today's range: $79,468 - $80,364
Current: Around $80,084 / $79,760 on other exchanges
Weekly trend: Down 2.5% over past week and down 2.10% on the 7-day c996f722ef1e51cb1e6f
Technical Levels:
Support: $79,278 and $79,145, with a major bid wall at $79,000 (401 BTC)
Resistance: $80,710 and $80,925, ask wall at $80,800 - $80,900
Momentum: Daily MACD at -588 (weak short-term), Weekly MACD at 2,130 (firmer long-term)
Sentiment: Fear & Greed 48 - Neutral, down from 50 yesterday 3447c996ef1eeacf
Market Drivers Today:
Fed Meeting: The Fed begins 2-day meeting today, decision Wednesday. Market pricing 90% chance of no change. Traders cautious ahead of it.
AI vs Crypto: Capital rotating to AI. Meta announced $95B capital raise and Anthropic filed for IPO aiming up to $100B - nearly $200B going to AI, not crypto. Asian tech stocks rallied (Kospi +3.1%) but crypto didn't follow.
ETF Flows: Spot BTC ETFs took in $110M on Monday after 2 days of outflows, but had seen $635.6M outflows on Oct 22.
Liquidations: Last 24h - $13.9M longs and $8.0M shorts liquidated. de0662ff0599c996
Short-term Outlook:
Consolidation below $80K with max pain at $80,000 for tomorrow's expiry. Volume is up 36% to $25.7B despite price decline - shows increased participation but no clear direction. Need to hold $79K or risk drop to $78K. Break above $80,800 wall needed for bullish continuation.$BTC #EthereumDropsBelow$2300 #FOMCWatch #BitcoinSlipsBelow$80KAgain
70

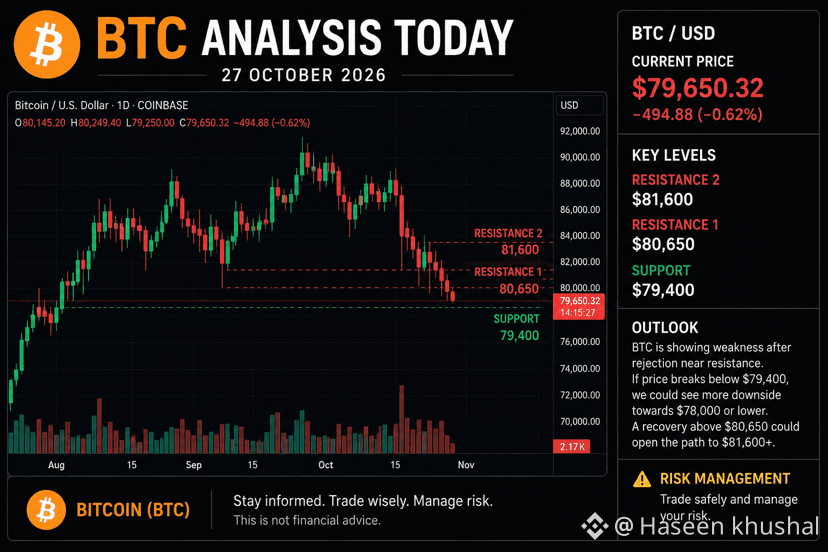
📊 Bitcoin $BTC (BTC) Analysis — October 27, 2026
₿ Current Price: Around $79,500–$80,000.
📉 Market Trend: BTC is facing short-term selling pressure, with the market showing mixed signals.
🟢 Support: $79,400
🔴 Resistance: $80,650–$81,600
📈 My Outlook: A breakout above $80,650 could support further gains, while a drop below $79,400 may trigger more downside.#BitcoinSlipsBelow$80KAgain #BitmineAdds10452ETH #BitcoinSlipsBelow$80KAgain #BitcoinSlipsBelow$80KAgain
⚠️ Stay cautious and manage your risk. This is market analysis, not financial advice.
68

·
--
#BitcoinSlipsBelow$80KAgain #CryptoMarket #BTC
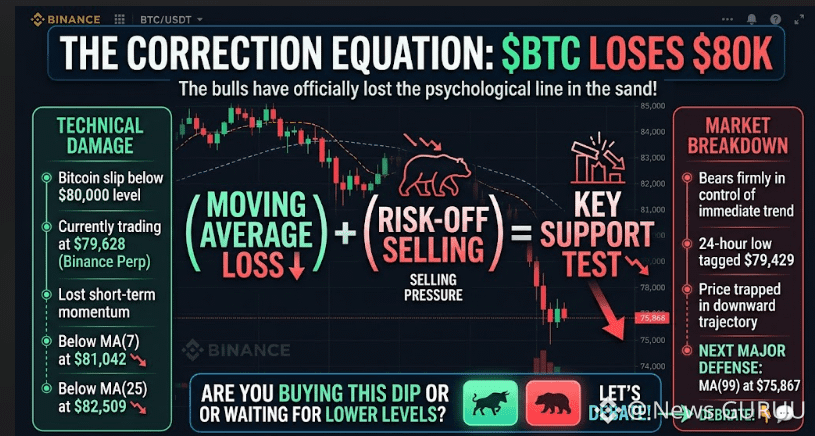
🚨 BITCOIN DROPS BELOW $80K! 📉
BTC is trading at $79,628, below MA(7) at $81,042 and MA(25) at $82,509. Bears are gaining control!
🎯 Key Support: $75,867
📈 Recovery Zone: $81K+
Will Bitcoin bounce back or drop further? 👇."CLICK ON THE BELOW YELLOW COIN TAG TO GO TO DESIRED TRADING PAGE TO GET BENEFIT TRADE"$BTC $AIN $HUMA
{spot}(HUMAUSDT)
{future}(AINUSDT)
{spot}(BTCUSDT)
#BitcoinSlipsBelow$80KAgain #CryptoMarket #BTC
🚨 BITCOIN DROPS BELOW $80K! 📉
BTC is trading at $79,628, below MA(7) at $81,042 and MA(25) at $82,509. Bears are gaining control!
🎯 Key Support: $75,867
📈 Recovery Zone: $81K+
Will Bitcoin bounce back or drop further? 👇."CLICK ON THE BELOW YELLOW COIN TAG TO GO TO DESIRED TRADING PAGE TO GET BENEFIT TRADE"$BTC $AIN $HUMA
1
71
·
--
Bullish
#BitcoinSlipsBelow$80KAgain Bitcoin Retraces Below $80K: Key Market Levels and Ecosystem Impact 📉
Bitcoin has once again dipped below the $80,000 threshold, prompting renewed attention from traders and analysts monitoring key psychological support levels in the current market cycle.
📰 Core News
BTC recently experienced a downward retracement, slipping back under the $80K mark. Such movements are a natural part of market dynamics and are often driven by a combination of factors, including macroeconomic data shifts, routine profit-taking after prior rallies, or the liquidation of over-leveraged positions in the derivatives market.
📊 Market Impact
• Bitcoin (BTC) The $80K level acts as a major psychological pivot. A sustained hold below this zone may lead to increased short-term volatility as the market searches for the next robust support level.
• Altcoin Market Historically, when Bitcoin tests or loses key support levels, altcoins can experience amplified price swings. Liquidity may temporarily rotate or pause as traders reassess risk exposure.
• Derivatives & Funding Watch for noticeable shifts in open interest and funding rates. A cooldown in leverage often indicates a healthier, more sustainable market structure forming after a correction.
💡 What’s Next?
Market participants are closely observing on-chain metrics, such as exchange net flows and whale accumulation patterns, to gauge whether this is a brief consolidation or the start of a deeper correction.
Let’s Discuss
What key support level are you watching next, and how do you think this retracement will shape the broader market narrative over the coming weeks? Share your thoughts below! 👇
#Bitcoin #CryptoMarket #BTCAnalysis #MarketUpdate #CryptoNews
This is for educational purposes only. Not Financial Advice (NFA). Always Do Your Own Research (DYOR).
$BTC $PARTI $OSMO
{spot}(OSMOUSDT)
{future}(PARTIUSDT)
{future}(BTCUSDT)
#BitcoinSlipsBelow$80KAgain Bitcoin Retraces Below $80K: Key Market Levels and Ecosystem Impact 📉
Bitcoin has once again dipped below the $80,000 threshold, prompting renewed attention from traders and analysts monitoring key psychological support levels in the current market cycle.
📰 Core News
BTC recently experienced a downward retracement, slipping back under the $80K mark. Such movements are a natural part of market dynamics and are often driven by a combination of factors, including macroeconomic data shifts, routine profit-taking after prior rallies, or the liquidation of over-leveraged positions in the derivatives market.
📊 Market Impact
• Bitcoin (BTC) The $80K level acts as a major psychological pivot. A sustained hold below this zone may lead to increased short-term volatility as the market searches for the next robust support level.
• Altcoin Market Historically, when Bitcoin tests or loses key support levels, altcoins can experience amplified price swings. Liquidity may temporarily rotate or pause as traders reassess risk exposure.
• Derivatives & Funding Watch for noticeable shifts in open interest and funding rates. A cooldown in leverage often indicates a healthier, more sustainable market structure forming after a correction.
💡 What’s Next?
Market participants are closely observing on-chain metrics, such as exchange net flows and whale accumulation patterns, to gauge whether this is a brief consolidation or the start of a deeper correction.
Let’s Discuss
What key support level are you watching next, and how do you think this retracement will shape the broader market narrative over the coming weeks? Share your thoughts below! 👇
#Bitcoin #CryptoMarket #BTCAnalysis #MarketUpdate #CryptoNews
This is for educational purposes only. Not Financial Advice (NFA). Always Do Your Own Research (DYOR).
$BTC $PARTI $OSMO

80

·
--

Article
BitcoinSlipsBelow$80KAgain: Market Reality, Liquidation Waves, and What Lies Ahead#BitcoinSlipsBelow$80KAgain
The cryptocurrency market has once again found itself gripped by intense volatility. Bitcoin (BTC) has faced heavy downward pressure, slipping beneath the crucial psychological and structural milestone of $80,000.
For months, $80K served as a closely watched psychological floor—and notably, it aligns close to the average cost basis for several corporate treasuries holding Bitcoin on their balance sheets. With prices dipping underneath this threshold, market participants are left scrambling to assess whether this is a temporary shakeout or the beginning of a deeper correction.
📉 The Reality Check: What Triggered the Drop?
Recent market downturns were not driven by a single catalyst, but rather a combination of macroeconomic headwinds, geopolitical tensions, and structural leverage unwinding:
Massive Long Liquidations: According to data from CoinGlass, the sudden slide triggered massive waves of liquidations. Over $800 million in leveraged positions were wiped out in a single 24-hour period, with overly optimistic long traders absorbing the vast majority of the losses as prices broke key supports.Macro & Geopolitical Pressures: Escalating geopolitical tensions in the Middle East and rising crude oil prices have severely dampened global risk appetite. With energy costs climbing, inflation fears have resurfaced, causing institutional investors to pull back from risk-on assets like crypto ahead of upcoming central bank decisions.Corporate Treasuries Underwater: Glassnode estimates indicate that Bitcoin slipping below $80,000 places the average corporate treasury position at an unrealized loss, adding psychological weight to the current market sentiment.📊 Bitcoin ($BTC ) Trade Plan{spot}(BTCUSDT)Note: The market is experiencing heightened volatility due to macroeconomic triggers and geopolitical tension. Focus on spot trading or use strict risk management for leveraged positions.
🟢 Scenario 1: Bullish Reclaim (Long Setup)
Trigger: BTC reclaims and closes a 4-hour candle above the $81,500 – $82,000 resistance zone.Entry Zone: $81,200 – $82,000Target 1: $84,500Target 2: $87,000Target 3: $92,000 – $94,000Stop Loss: $79,500 (Strict SL)
🔴 Scenario 2: Bearish Breakdown (Short Setup)
Trigger: Price breaks below the key $79,000 support level and closes a 1-hour/4-hour candle beneath it.Entry Zone: $78,800 – $79,200Target 1: $76,500Target 2: $74,200 (Liquidity gap fill)Target 3: $71,000 – $72,500Stop Loss: $80,800
🟡 Scenario 3: Demand Zone Accumulation (Spot Buying)
Strategy: Look for DCA (Dollar-Cost Averaging) spot buying opportunities if price drops into the key demand zone.Buy Zone: $74,000 – $76,500Long-Term Target: $88,000+Invalidation / Cut-Loss: Daily close below $72,000
🔍 Technical Outlook: Support and Resistance Zones
Analysts are closely monitoring key technical levels to gauge the next market direction:
Immediate Resistance: Bitcoin must reclaim and hold $83,000 to invalidate current bearish momentum and signal a return to stability.Downside Support: If selling continues, analysts point to immediate support around $77,876, with a broader, more substantial demand zone sitting between $72,500 and $76,700.
💡 Summary: Navigating the Volatility
Cover images capturing this moment—such as a stressed investor checking charts in a dimly lit diner—reflect the raw emotional reality of crypto trading during sudden flash crashes. However, seasoned market participants view these phases as a test of risk management rather than panic.
As leverage is flushed out of the system, the market ultimately purges excess speculation. Whether Bitcoin builds a base to bounce back or tests lower supports will depend heavily on macro developments and institutional capital flows in the coming days.
#bitcoin #BTC #CryptoMarket #CryptoNews
BitcoinSlipsBelow$80KAgain: Market Reality, Liquidation Waves, and What Lies Ahead
#BitcoinSlipsBelow$80KAgain
The cryptocurrency market has once again found itself gripped by intense volatility. Bitcoin (BTC) has faced heavy downward pressure, slipping beneath the crucial psychological and structural milestone of $80,000.
For months, $80K served as a closely watched psychological floor—and notably, it aligns close to the average cost basis for several corporate treasuries holding Bitcoin on their balance sheets. With prices dipping underneath this threshold, market participants are left scrambling to assess whether this is a temporary shakeout or the beginning of a deeper correction.
📉 The Reality Check: What Triggered the Drop?
Recent market downturns were not driven by a single catalyst, but rather a combination of macroeconomic headwinds, geopolitical tensions, and structural leverage unwinding:
Massive Long Liquidations: According to data from CoinGlass, the sudden slide triggered massive waves of liquidations. Over $800 million in leveraged positions were wiped out in a single 24-hour period, with overly optimistic long traders absorbing the vast majority of the losses as prices broke key supports.Macro & Geopolitical Pressures: Escalating geopolitical tensions in the Middle East and rising crude oil prices have severely dampened global risk appetite. With energy costs climbing, inflation fears have resurfaced, causing institutional investors to pull back from risk-on assets like crypto ahead of upcoming central bank decisions.Corporate Treasuries Underwater: Glassnode estimates indicate that Bitcoin slipping below $80,000 places the average corporate treasury position at an unrealized loss, adding psychological weight to the current market sentiment.📊 Bitcoin ($BTC ) Trade PlanNote: The market is experiencing heightened volatility due to macroeconomic triggers and geopolitical tension. Focus on spot trading or use strict risk management for leveraged positions.
🟢 Scenario 1: Bullish Reclaim (Long Setup)
Trigger: BTC reclaims and closes a 4-hour candle above the $81,500 – $82,000 resistance zone.Entry Zone: $81,200 – $82,000Target 1: $84,500Target 2: $87,000Target 3: $92,000 – $94,000Stop Loss: $79,500 (Strict SL)
🔴 Scenario 2: Bearish Breakdown (Short Setup)
Trigger: Price breaks below the key $79,000 support level and closes a 1-hour/4-hour candle beneath it.Entry Zone: $78,800 – $79,200Target 1: $76,500Target 2: $74,200 (Liquidity gap fill)Target 3: $71,000 – $72,500Stop Loss: $80,800
🟡 Scenario 3: Demand Zone Accumulation (Spot Buying)
Strategy: Look for DCA (Dollar-Cost Averaging) spot buying opportunities if price drops into the key demand zone.Buy Zone: $74,000 – $76,500Long-Term Target: $88,000+Invalidation / Cut-Loss: Daily close below $72,000
🔍 Technical Outlook: Support and Resistance Zones
Analysts are closely monitoring key technical levels to gauge the next market direction:
Immediate Resistance: Bitcoin must reclaim and hold $83,000 to invalidate current bearish momentum and signal a return to stability.Downside Support: If selling continues, analysts point to immediate support around $77,876, with a broader, more substantial demand zone sitting between $72,500 and $76,700.
💡 Summary: Navigating the Volatility
Cover images capturing this moment—such as a stressed investor checking charts in a dimly lit diner—reflect the raw emotional reality of crypto trading during sudden flash crashes. However, seasoned market participants view these phases as a test of risk management rather than panic.
As leverage is flushed out of the system, the market ultimately purges excess speculation. Whether Bitcoin builds a base to bounce back or tests lower supports will depend heavily on macro developments and institutional capital flows in the coming days.
#bitcoin #BTC #CryptoMarket #CryptoNews
57

#BitcoinSlipsBelow$80KAgain
The battle between buyers and sellers remains intense.
Bitcoin has once again lost support at $80,000.
For some, a break below this level is a warning sign that triggers automatic stop-loss orders. For long-term investors, it represents a strategic accumulation window at key support zones.
The big question is how to separate the noise from the trend. Market sentiment has shifted from euphoria to caution. Keep an eye on the actual data:
1. Trading volume.
2. Spot ETF inflows and outflows.
A strong recovery above $80,000 would validate the broader bullish structure. Otherwise, the next major technical support lies around $75,000.
In this environment, disciplined risk management and patience are your greatest assets.
$HUMA $BANK $BTC
#Bitcoin #BTC #Trading
{spot}(HUMAUSDT)
{spot}(BANKUSDT)
{spot}(BTCUSDT)
#BitcoinSlipsBelow$80KAgain
The battle between buyers and sellers remains intense.
Bitcoin has once again lost support at $80,000.
For some, a break below this level is a warning sign that triggers automatic stop-loss orders. For long-term investors, it represents a strategic accumulation window at key support zones.
The big question is how to separate the noise from the trend. Market sentiment has shifted from euphoria to caution. Keep an eye on the actual data:
1. Trading volume.
2. Spot ETF inflows and outflows.
A strong recovery above $80,000 would validate the broader bullish structure. Otherwise, the next major technical support lies around $75,000.
In this environment, disciplined risk management and patience are your greatest assets.
$HUMA $BANK $BTC
#Bitcoin #BTC #Trading

1
82

·
--
#BitcoinSlipsBelow$80KAgain
Bitcoin's price fell below the $80,000 level again
📉 Sharp Decline: Selling pressure increased across cryptocurrency markets.₿ Bitcoin (BTC): Failed to hold the $80,000 mark, an important psychological support level.🔻 Pullback: Prices slid into the red as bears applied pressure.💸 Investor Unease: Short-term profit-taking and panic selling are being observed in the market.
$BTC $BR $ZEC
{future}(ZECUSDT)
{alpha}(560xff7d6a96ae471bbcd7713af9cb1feeb16cf56b41)
{future}(BTCUSDT)
#BitcoinSlipsBelow$80KAgain
Bitcoin's price fell below the $80,000 level again
📉 Sharp Decline: Selling pressure increased across cryptocurrency markets.₿ Bitcoin (BTC): Failed to hold the $80,000 mark, an important psychological support level.🔻 Pullback: Prices slid into the red as bears applied pressure.💸 Investor Unease: Short-term profit-taking and panic selling are being observed in the market.
$BTC $BR $ZEC

148
Log in to explore more content
Join global crypto users on Binance Square
⚡️ Get latest and useful information about crypto.
💬 Trusted by the world’s largest crypto exchange.
👍 Discover real insights from verified creators.
Email / Phone number
Trending Topics
1
#CanMicrosoftDeliverOnAI
9,632 views
281 Discussing
2
#CanGoogleDefindItsCore
5,927 views
231 Discussing
3
#FOMCWatch
9M views
27,437 Discussing
4
#EthereumDropsBelow$2300
6,748 views
123 Discussing
5
#BitcoinSlipsBelow$80KAgain
20,615 views
92 Discussing
6
#ThailandLaunchesWORPTStablecoinToQRPaymentApp
37,809 views
623 Discussing
7
#StrategySkipsBitcoinPurchasesSpends$205MOnSTRCBuybacks
8,739 views
88 Discussing
8
#BitmineAdds10452ETH
77,258 views
1,009 Discussing
9
#SouthKoreaConsidersEducationTaxOnCryptoExchanges
40,966 views
743 Discussing
10
#OCCUrgesCommunityBanksToEnterStablecoinPayments
31,756 views
529 Discussing