
#beta
beta
495,769 views
910 Discussing
Hot
Latest

Everyone thinks a -64% candle is the bottom. It’s not — it’s a warning.
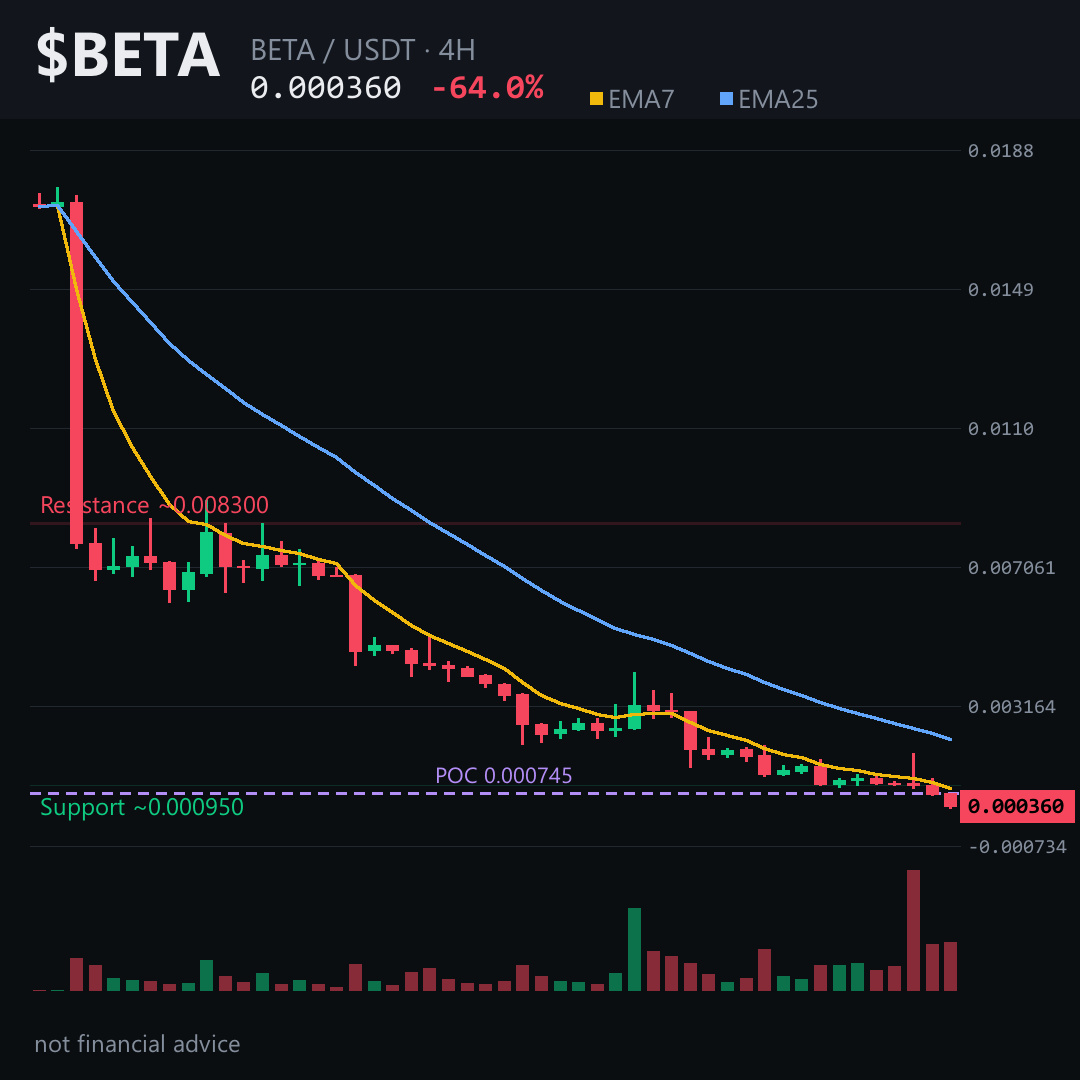
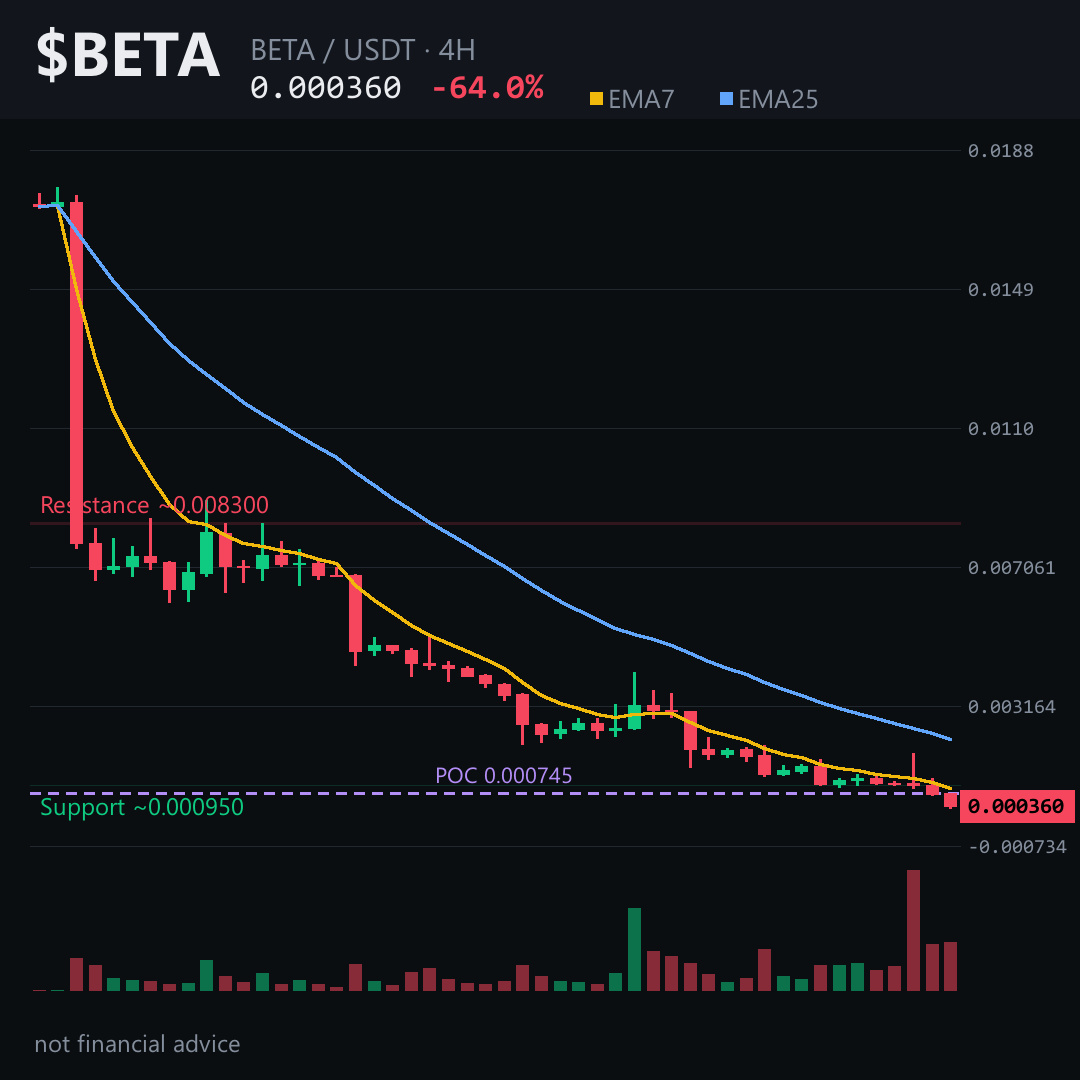
The 4H chart just printed a -51% collapse, closing at 0.00036000. RSI is buried at 17.5. ATR has exploded. This is not a dip — it’s a falling knife.
Futures are empty. Funding flat at zero. Open interest is nothing. No leveraged longs left to liquidate — and no short-squeeze fuel. This is spot-driven panic, and panic often overextends before the real bounce.
The bearish fair value gap between 0.00230000 and 0.00286000 is miles above. Volume profile point of control sits at 0.00074500 — roughly double current price. This zone is a vacuum.
If $BETA holds around 0.00036000, the next downside objective is 0.00032900. Lose that and the 24H low at 0.00031000 becomes the last line.
Invalidation: a 4H close back above 0.00038000 suggests the flush is exhausted. Until then, path of least resistance remains lower.
My read: broken chart in freefall, not a discount. The only trade here is patience.
Tap $BETA to see how far below fair value this has fallen. I’ll update if 0.00032900 gets tested — follow so you’re in the loop.
What level are you watching on $BETA to signal the bleeding has stopped? 👇
⚠️ Not financial advice. DYOR.
#BETA #Crypto #BinanceSquare
Everyone thinks a -64% candle is the bottom. It’s not — it’s a warning.
The 4H chart just printed a -51% collapse, closing at 0.00036000. RSI is buried at 17.5. ATR has exploded. This is not a dip — it’s a falling knife.
Futures are empty. Funding flat at zero. Open interest is nothing. No leveraged longs left to liquidate — and no short-squeeze fuel. This is spot-driven panic, and panic often overextends before the real bounce.
The bearish fair value gap between 0.00230000 and 0.00286000 is miles above. Volume profile point of control sits at 0.00074500 — roughly double current price. This zone is a vacuum.
If $BETA holds around 0.00036000, the next downside objective is 0.00032900. Lose that and the 24H low at 0.00031000 becomes the last line.
Invalidation: a 4H close back above 0.00038000 suggests the flush is exhausted. Until then, path of least resistance remains lower.
My read: broken chart in freefall, not a discount. The only trade here is patience.
Tap $BETA to see how far below fair value this has fallen. I’ll update if 0.00032900 gets tested — follow so you’re in the loop.
What level are you watching on $BETA to signal the bleeding has stopped? 👇
⚠️ Not financial advice. DYOR.
#BETA #Crypto #BinanceSquare
The 4H chart just printed a -51% collapse, closing at 0.00036000. RSI is buried at 17.5. ATR has exploded. This is not a dip — it’s a falling knife.
Futures are empty. Funding flat at zero. Open interest is nothing. No leveraged longs left to liquidate — and no short-squeeze fuel. This is spot-driven panic, and panic often overextends before the real bounce.
The bearish fair value gap between 0.00230000 and 0.00286000 is miles above. Volume profile point of control sits at 0.00074500 — roughly double current price. This zone is a vacuum.
If $BETA holds around 0.00036000, the next downside objective is 0.00032900. Lose that and the 24H low at 0.00031000 becomes the last line.
Invalidation: a 4H close back above 0.00038000 suggests the flush is exhausted. Until then, path of least resistance remains lower.
My read: broken chart in freefall, not a discount. The only trade here is patience.
Tap $BETA to see how far below fair value this has fallen. I’ll update if 0.00032900 gets tested — follow so you’re in the loop.
What level are you watching on $BETA to signal the bleeding has stopped? 👇
⚠️ Not financial advice. DYOR.
#BETA #Crypto #BinanceSquare
7
The 4‑hour candle just broke the tiny green candle at 0.00036 — did the market just hand you the next “stop‑run” zone? 👀
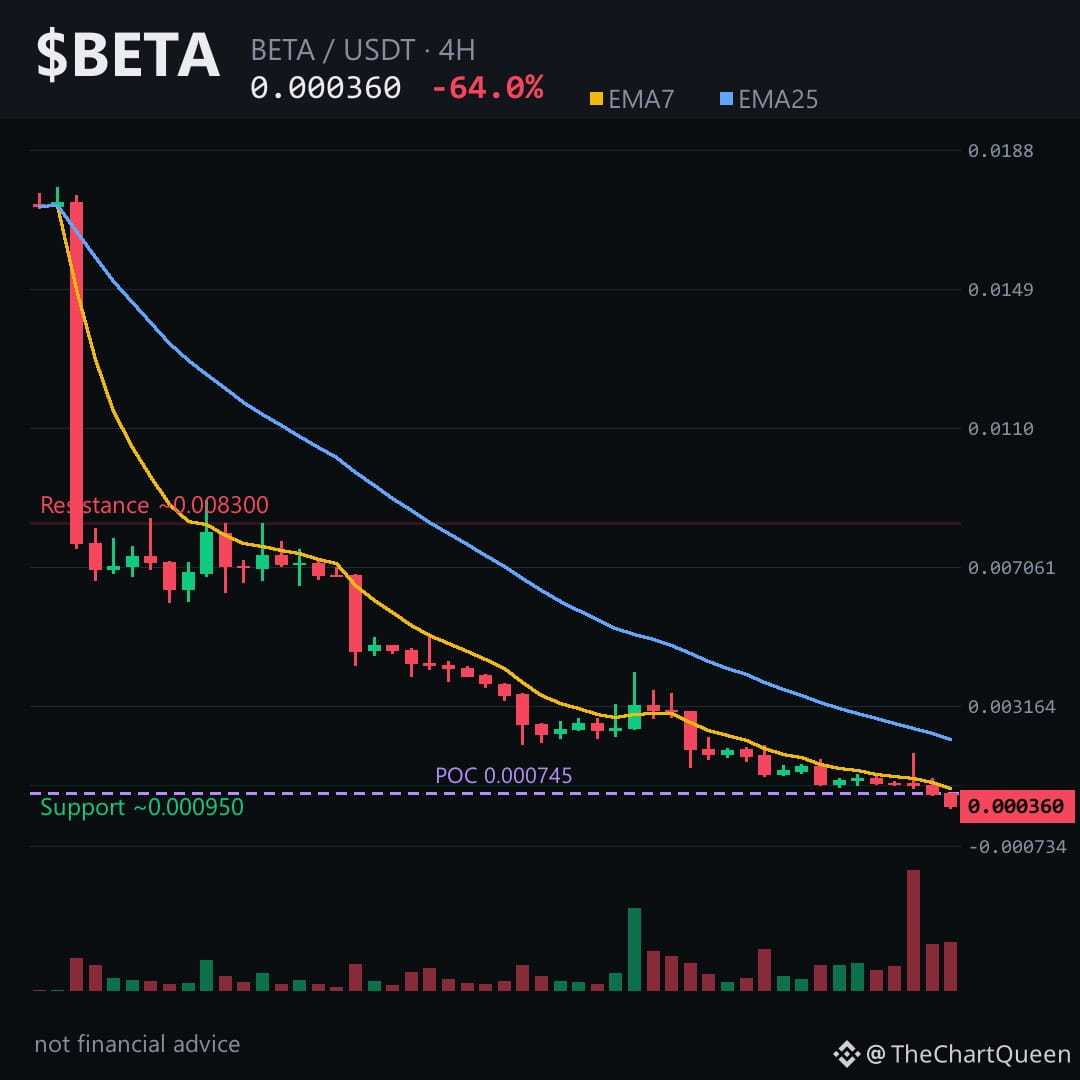
Price is screaming bearish, yet the funding line sits at zero and open interest is flat, hinting at a lack of conviction from leveraged traders. The EMA7 is well under the EMA25 and RSI is stuck in the teens, so the downside pressure is real, but the chart still holds a tiny cushion.
On the 4H picture the current area clusters around 0.000362 . Below that, the ~0.000329 zone acts as the next demand pocket, while a close above ~0.000380 would invalidate the bearish case. Think of it as a narrow hallway: once the price slips past the doorway it may wander down to the lower zone.
My read: the market is primed to test the ~0.000329 area; if it holds, the downside narrative stays intact.
Follow me for a next‑level breakdown when price either respects that zone or flips the script.
What level are you watching on $BETA? 👇
⚠️ Not financial advice. DYOR.
#BETA #Crypto #BinanceSquare #Altcoins
The 4‑hour candle just broke the tiny green candle at 0.00036 — did the market just hand you the next “stop‑run” zone? 👀
Price is screaming bearish, yet the funding line sits at zero and open interest is flat, hinting at a lack of conviction from leveraged traders. The EMA7 is well under the EMA25 and RSI is stuck in the teens, so the downside pressure is real, but the chart still holds a tiny cushion.
On the 4H picture the current area clusters around 0.000362 . Below that, the ~0.000329 zone acts as the next demand pocket, while a close above ~0.000380 would invalidate the bearish case. Think of it as a narrow hallway: once the price slips past the doorway it may wander down to the lower zone.
My read: the market is primed to test the ~0.000329 area; if it holds, the downside narrative stays intact.
Follow me for a next‑level breakdown when price either respects that zone or flips the script.
What level are you watching on $BETA? 👇
⚠️ Not financial advice. DYOR.
#BETA #Crypto #BinanceSquare #Altcoins
Price is screaming bearish, yet the funding line sits at zero and open interest is flat, hinting at a lack of conviction from leveraged traders. The EMA7 is well under the EMA25 and RSI is stuck in the teens, so the downside pressure is real, but the chart still holds a tiny cushion.
On the 4H picture the current area clusters around 0.000362 . Below that, the ~0.000329 zone acts as the next demand pocket, while a close above ~0.000380 would invalidate the bearish case. Think of it as a narrow hallway: once the price slips past the doorway it may wander down to the lower zone.
My read: the market is primed to test the ~0.000329 area; if it holds, the downside narrative stays intact.
Follow me for a next‑level breakdown when price either respects that zone or flips the script.
What level are you watching on $BETA? 👇
⚠️ Not financial advice. DYOR.
#BETA #Crypto #BinanceSquare #Altcoins
2
The 64% plunge has traders writing $BETA off as a dead coin.
But the 4‑hour chart still hides a slim cushion that could stall the fall.
Read the price action before you dismiss it 👇
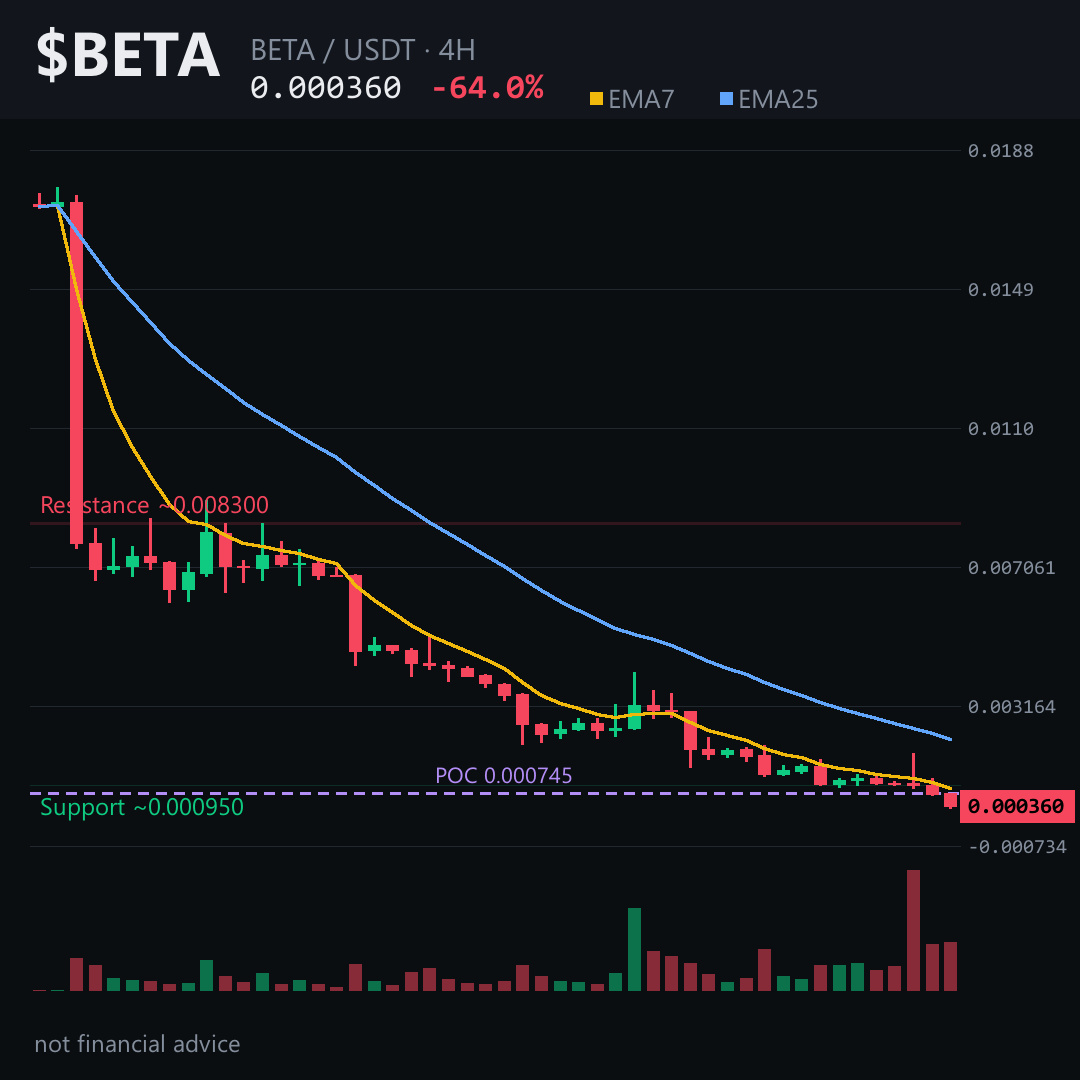
Price is hugging the 4H pivot while RSI sits at 17.5, flagging extreme oversold.
The bearish unfilled gap above $0.0023 is already burnt, so the next swing targets the lower zone.
The current area sits around 0.000362; losing the ~0.000329 zone would confirm the downside.
If $BETA slides below that level, the bearish case strengthens.
Tap $BETA to pull up the chart and see these zones yourself.
I see a higher‑probability bounce off the 0.000362 area, with the real risk if it pierces the ~0.000380 ceiling.
Follow me for the next update when the price tests the 0.000380 barrier – I’ll break down what that means for the longer swing.
What level are you watching on BETA? 👇
⚠️ Not financial advice. DYOR.
#BETA #Crypto #BinanceSquare #TopLoser
The 64% plunge has traders writing $BETA off as a dead coin.
But the 4‑hour chart still hides a slim cushion that could stall the fall.
Read the price action before you dismiss it 👇
Price is hugging the 4H pivot while RSI sits at 17.5, flagging extreme oversold.
The bearish unfilled gap above $0.0023 is already burnt, so the next swing targets the lower zone.
The current area sits around 0.000362; losing the ~0.000329 zone would confirm the downside.
If $BETA slides below that level, the bearish case strengthens.
Tap $BETA to pull up the chart and see these zones yourself.
I see a higher‑probability bounce off the 0.000362 area, with the real risk if it pierces the ~0.000380 ceiling.
Follow me for the next update when the price tests the 0.000380 barrier – I’ll break down what that means for the longer swing.
What level are you watching on BETA? 👇
⚠️ Not financial advice. DYOR.
#BETA #Crypto #BinanceSquare #TopLoser
But the 4‑hour chart still hides a slim cushion that could stall the fall.
Read the price action before you dismiss it 👇
Price is hugging the 4H pivot while RSI sits at 17.5, flagging extreme oversold.
The bearish unfilled gap above $0.0023 is already burnt, so the next swing targets the lower zone.
The current area sits around 0.000362; losing the ~0.000329 zone would confirm the downside.
If $BETA slides below that level, the bearish case strengthens.
Tap $BETA to pull up the chart and see these zones yourself.
I see a higher‑probability bounce off the 0.000362 area, with the real risk if it pierces the ~0.000380 ceiling.
Follow me for the next update when the price tests the 0.000380 barrier – I’ll break down what that means for the longer swing.
What level are you watching on BETA? 👇
⚠️ Not financial advice. DYOR.
#BETA #Crypto #BinanceSquare #TopLoser
3
A wave of optimism is hanging on the $0.0011 high, hoping $BETA will sprint back.
The 4‑hour candles, however, are painting a different picture.
Read the math before you chase the hype 👇
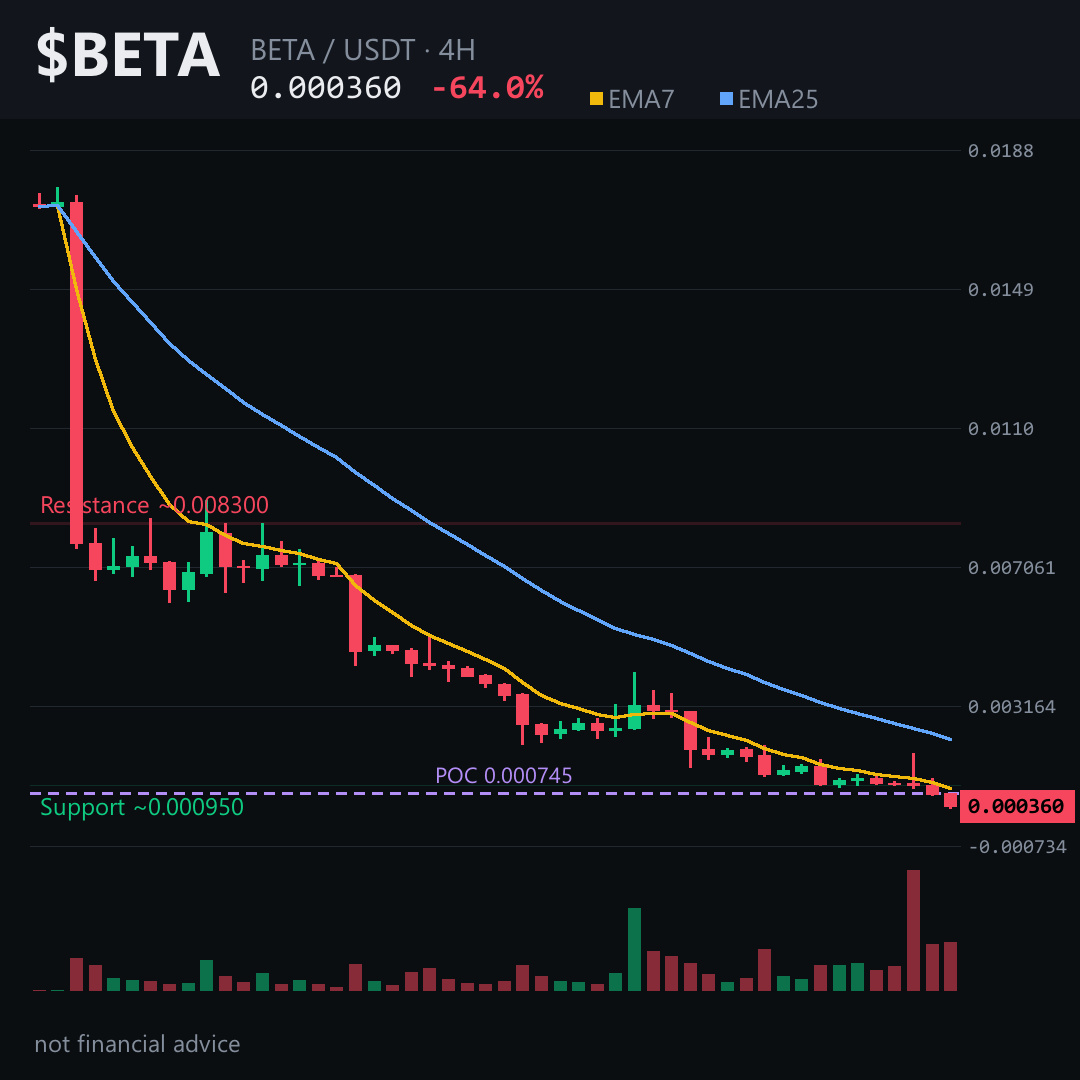
Price sits under its 4‑hour EMA7 and RSI is stuck in the teens – a classic oversold trap that often precedes a deeper slide. A fresh bearish FVG sits just above the market, ready to swallow any false rally.
If $BETA can’t hold the ~0.000362 zone, the next hurdle is the ~0.000380 barrier; a break there would open the path toward the ~0.000329 area. Tap $BETA to pull up the chart and see these zones yourself.
The chart is whispering that the real risk lies in a slip below the ~0.000362 zone – the downside bias feels solid.
I’ll break down the next move once the price tests the ~0.000380 line, so hit follow to stay ahead.
What do you think BETA will do around the 0.00036 area? 👇
⚠️ Not financial advice. DYOR.
#BETA #Crypto #BinanceSquare #Altcoins
A wave of optimism is hanging on the $0.0011 high, hoping $BETA will sprint back.
The 4‑hour candles, however, are painting a different picture.
Read the math before you chase the hype 👇
Price sits under its 4‑hour EMA7 and RSI is stuck in the teens – a classic oversold trap that often precedes a deeper slide. A fresh bearish FVG sits just above the market, ready to swallow any false rally.
If $BETA can’t hold the ~0.000362 zone, the next hurdle is the ~0.000380 barrier; a break there would open the path toward the ~0.000329 area. Tap $BETA to pull up the chart and see these zones yourself.
The chart is whispering that the real risk lies in a slip below the ~0.000362 zone – the downside bias feels solid.
I’ll break down the next move once the price tests the ~0.000380 line, so hit follow to stay ahead.
What do you think BETA will do around the 0.00036 area? 👇
⚠️ Not financial advice. DYOR.
#BETA #Crypto #BinanceSquare #Altcoins
The 4‑hour candles, however, are painting a different picture.
Read the math before you chase the hype 👇
Price sits under its 4‑hour EMA7 and RSI is stuck in the teens – a classic oversold trap that often precedes a deeper slide. A fresh bearish FVG sits just above the market, ready to swallow any false rally.
If $BETA can’t hold the ~0.000362 zone, the next hurdle is the ~0.000380 barrier; a break there would open the path toward the ~0.000329 area. Tap $BETA to pull up the chart and see these zones yourself.
The chart is whispering that the real risk lies in a slip below the ~0.000362 zone – the downside bias feels solid.
I’ll break down the next move once the price tests the ~0.000380 line, so hit follow to stay ahead.
What do you think BETA will do around the 0.00036 area? 👇
⚠️ Not financial advice. DYOR.
#BETA #Crypto #BinanceSquare #Altcoins
28
-64% in a day. That’s not a dip — that’s a structural reset.
$BETA just printed a 51% red candle on the 4H, closing near the lows. Daily RSI sits at 15 — often exhaustion, but sometimes still finding a floor. Futures are silent: no funding, no open interest. No conviction, just drift.
Price rejected from an unfilled bearish gap between 0.0023 and 0.00286. It never recovered. Now it’s compressing under 0.00038 — the near-term ceiling. If $BETA loses 0.00033 on a 4H close, next leg likely targets 0.00031 (24H low) — and below that, the macro objective near 0.00023.
The only invalidation that matters here: a 4H close back above 0.00038. That would signal sell-side momentum fading. Until then, path of least resistance remains lower. Tap $BETA to pull up the chart and read these levels yourself.
My read: a falling knife with no volume cushion underneath. Bounce attempts are weak, range keeps expanding lower. I’d need a higher low before trusting any recovery.
Follow me for the follow-up if BETA tests 0.00033 — that’s where the next decision gets made.
What level are you watching more closely — 0.00033 or 0.00038? 👇
⚠️ Not financial advice. DYOR.
#BETA #Crypto #BinanceSquare
-64% in a day. That’s not a dip — that’s a structural reset.
$BETA just printed a 51% red candle on the 4H, closing near the lows. Daily RSI sits at 15 — often exhaustion, but sometimes still finding a floor. Futures are silent: no funding, no open interest. No conviction, just drift.
Price rejected from an unfilled bearish gap between 0.0023 and 0.00286. It never recovered. Now it’s compressing under 0.00038 — the near-term ceiling. If $BETA loses 0.00033 on a 4H close, next leg likely targets 0.00031 (24H low) — and below that, the macro objective near 0.00023.
The only invalidation that matters here: a 4H close back above 0.00038. That would signal sell-side momentum fading. Until then, path of least resistance remains lower. Tap $BETA to pull up the chart and read these levels yourself.
My read: a falling knife with no volume cushion underneath. Bounce attempts are weak, range keeps expanding lower. I’d need a higher low before trusting any recovery.
Follow me for the follow-up if BETA tests 0.00033 — that’s where the next decision gets made.
What level are you watching more closely — 0.00033 or 0.00038? 👇
⚠️ Not financial advice. DYOR.
#BETA #Crypto #BinanceSquare
$BETA just printed a 51% red candle on the 4H, closing near the lows. Daily RSI sits at 15 — often exhaustion, but sometimes still finding a floor. Futures are silent: no funding, no open interest. No conviction, just drift.
Price rejected from an unfilled bearish gap between 0.0023 and 0.00286. It never recovered. Now it’s compressing under 0.00038 — the near-term ceiling. If $BETA loses 0.00033 on a 4H close, next leg likely targets 0.00031 (24H low) — and below that, the macro objective near 0.00023.
The only invalidation that matters here: a 4H close back above 0.00038. That would signal sell-side momentum fading. Until then, path of least resistance remains lower. Tap $BETA to pull up the chart and read these levels yourself.
My read: a falling knife with no volume cushion underneath. Bounce attempts are weak, range keeps expanding lower. I’d need a higher low before trusting any recovery.
Follow me for the follow-up if BETA tests 0.00033 — that’s where the next decision gets made.
What level are you watching more closely — 0.00033 or 0.00038? 👇
⚠️ Not financial advice. DYOR.
#BETA #Crypto #BinanceSquare
3

·
--
The sheer scale of today's slide on $BETA is hard to ignore.
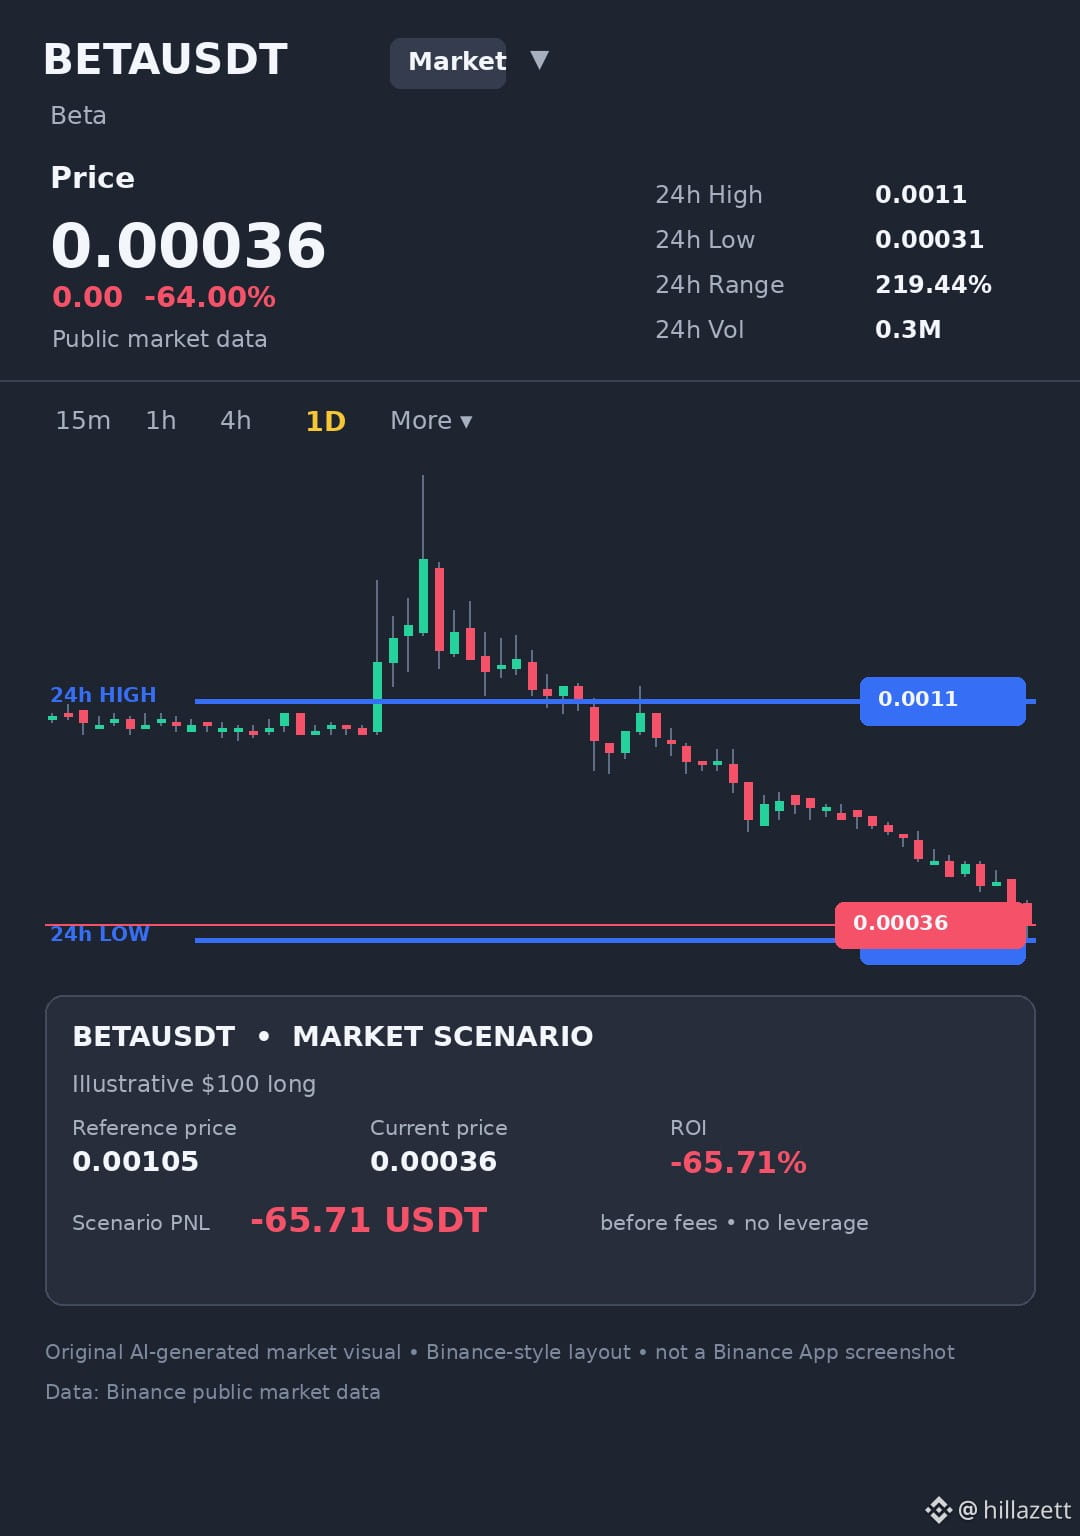
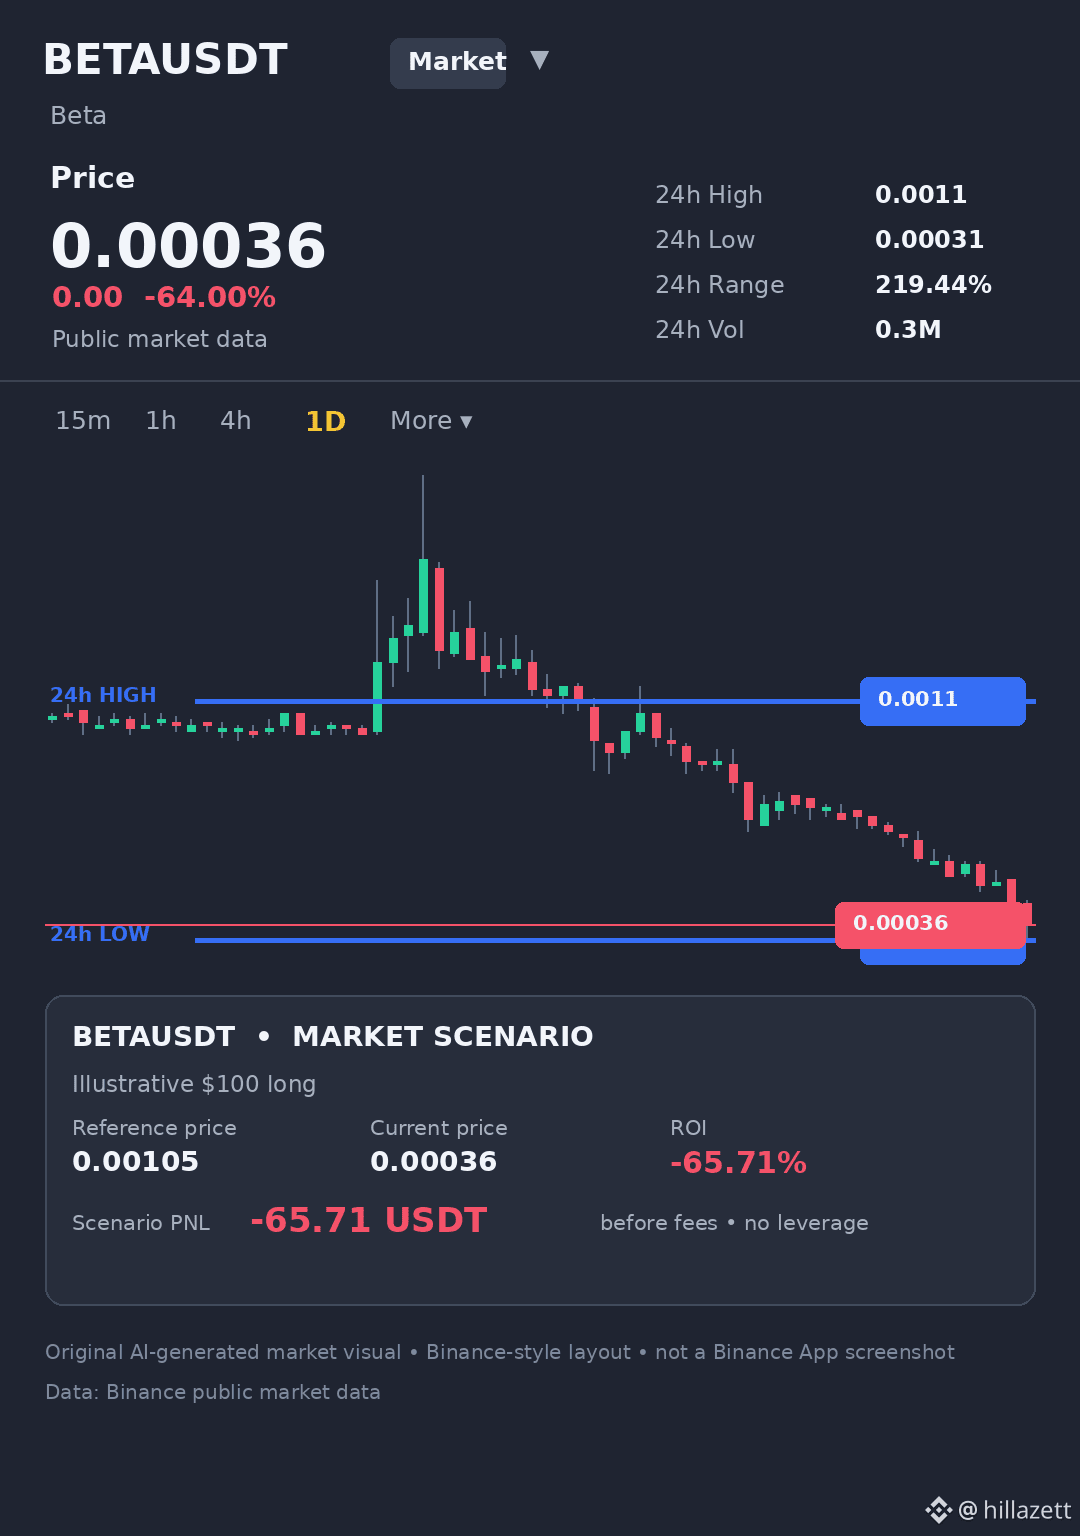
The token sank 64.00% down to 0.00036, trading right near its 0.00031 session low after reaching 0.0011 earlier. That is a massive 219.44% range on $296,136 in volume.
When prices compress this close to the floor, are you waiting for structure to build or staying clear? #BETA #Altcoins
The sheer scale of today's slide on $BETA is hard to ignore.
The token sank 64.00% down to 0.00036, trading right near its 0.00031 session low after reaching 0.0011 earlier. That is a massive 219.44% range on $296,136 in volume.
When prices compress this close to the floor, are you waiting for structure to build or staying clear? #BETA #Altcoins
The token sank 64.00% down to 0.00036, trading right near its 0.00031 session low after reaching 0.0011 earlier. That is a massive 219.44% range on $296,136 in volume.
When prices compress this close to the floor, are you waiting for structure to build or staying clear? #BETA #Altcoins
77
A 64% single-day flush isn't a dip — it's a liquidation cascade that already happened. And the scary part? The chart shows no sign it's done.
RSI is buried at 17 on the 4H. That's not "oversold bounce territory." That's what a coin looks like when sellers step away only because there's no one left to sell to. 8 red out of the last 12 candles, with the final one slicing through 0.00067 like it wasn't there. That was a structural break.
Price is hovering around 0.00036, and the only thing between here and 0.00033 is thin air. That lower zone is the 4H objective — a natural continuation if the bounce stalls. The invalidation is clean: a 4H close back above 0.00038 and this bearish read starts losing teeth. Until then, every pump attempt this week has been sold. Tap $BETA and watch how price keeps rejecting the 0.00095–0.0010 band on the way down. That's not accumulation. That's distribution disguised as hope.
My read: trend broken, bounce weak, and only a decisive reclaim of 0.00038 on real volume changes the picture. Until then, downside pressure remains the path of least resistance.
If this level breaks or the bounce holds, I'll walk through which side of the tape is winning — follow so that update lands in your feed.
What's the one level you're watching on $BETA right now 👇
⚠️ Not financial advice. DYOR.
#BETA #Crypto #BinanceSquare #Altcoins
A 64% single-day flush isn't a dip — it's a liquidation cascade that already happened. And the scary part? The chart shows no sign it's done.
RSI is buried at 17 on the 4H. That's not "oversold bounce territory." That's what a coin looks like when sellers step away only because there's no one left to sell to. 8 red out of the last 12 candles, with the final one slicing through 0.00067 like it wasn't there. That was a structural break.
Price is hovering around 0.00036, and the only thing between here and 0.00033 is thin air. That lower zone is the 4H objective — a natural continuation if the bounce stalls. The invalidation is clean: a 4H close back above 0.00038 and this bearish read starts losing teeth. Until then, every pump attempt this week has been sold. Tap $BETA and watch how price keeps rejecting the 0.00095–0.0010 band on the way down. That's not accumulation. That's distribution disguised as hope.
My read: trend broken, bounce weak, and only a decisive reclaim of 0.00038 on real volume changes the picture. Until then, downside pressure remains the path of least resistance.
If this level breaks or the bounce holds, I'll walk through which side of the tape is winning — follow so that update lands in your feed.
What's the one level you're watching on $BETA right now 👇
⚠️ Not financial advice. DYOR.
#BETA #Crypto #BinanceSquare #Altcoins
RSI is buried at 17 on the 4H. That's not "oversold bounce territory." That's what a coin looks like when sellers step away only because there's no one left to sell to. 8 red out of the last 12 candles, with the final one slicing through 0.00067 like it wasn't there. That was a structural break.
Price is hovering around 0.00036, and the only thing between here and 0.00033 is thin air. That lower zone is the 4H objective — a natural continuation if the bounce stalls. The invalidation is clean: a 4H close back above 0.00038 and this bearish read starts losing teeth. Until then, every pump attempt this week has been sold. Tap $BETA and watch how price keeps rejecting the 0.00095–0.0010 band on the way down. That's not accumulation. That's distribution disguised as hope.
My read: trend broken, bounce weak, and only a decisive reclaim of 0.00038 on real volume changes the picture. Until then, downside pressure remains the path of least resistance.
If this level breaks or the bounce holds, I'll walk through which side of the tape is winning — follow so that update lands in your feed.
What's the one level you're watching on $BETA right now 👇
⚠️ Not financial advice. DYOR.
#BETA #Crypto #BinanceSquare #Altcoins
4
Everyone thinks a -64% day means the bottom is in.
Flip that: the most dangerous knife on Binance right now is the one still falling at terminal velocity.
$BETA didn’t just dip — it erased two-thirds of its value in 24 hours.
RSI on the 4H is buried near 17. That’s not “oversold bounce” territory yet — that’s a market with no bid under it.
Here’s the part that should make you pause:
The last 4H candle closed at 0.000360 after tagging 0.000310.
Volume is thin. The only real liquidity pool sits far below.
This is a falling asset with no floor nearby — just air.
My levels on the 4H:
Support is the old low zone around 0.000310.
If that gives way, the next natural magnet is the mid-0.00032 area and lower.
The only level that would tell me the bleed is stalling is a 4H close back above 0.000380.
Until then, bounces are exits, not entries.
My read: this is a chart that punishes optimism. The risk isn’t missing a rebound — it’s catching a falling brick before the volume confirms a real reversal.
Tap $BETA and look at the 4H close yourself — the level is obvious once you see it.
Follow for the follow-up when this range either reclaims or collapses — that’s the only signal that matters.
Which level are you watching on $BETA — the reclaim zone or the breakdown? 👇
⚠️ Not financial advice. DYOR.
#BETA #Crypto #BinanceSquare
Everyone thinks a -64% day means the bottom is in.
Flip that: the most dangerous knife on Binance right now is the one still falling at terminal velocity.
$BETA didn’t just dip — it erased two-thirds of its value in 24 hours.
RSI on the 4H is buried near 17. That’s not “oversold bounce” territory yet — that’s a market with no bid under it.
Here’s the part that should make you pause:
The last 4H candle closed at 0.000360 after tagging 0.000310.
Volume is thin. The only real liquidity pool sits far below.
This is a falling asset with no floor nearby — just air.
My levels on the 4H:
Support is the old low zone around 0.000310.
If that gives way, the next natural magnet is the mid-0.00032 area and lower.
The only level that would tell me the bleed is stalling is a 4H close back above 0.000380.
Until then, bounces are exits, not entries.
My read: this is a chart that punishes optimism. The risk isn’t missing a rebound — it’s catching a falling brick before the volume confirms a real reversal.
Tap $BETA and look at the 4H close yourself — the level is obvious once you see it.
Follow for the follow-up when this range either reclaims or collapses — that’s the only signal that matters.
Which level are you watching on $BETA — the reclaim zone or the breakdown? 👇
⚠️ Not financial advice. DYOR.
#BETA #Crypto #BinanceSquare
Flip that: the most dangerous knife on Binance right now is the one still falling at terminal velocity.
$BETA didn’t just dip — it erased two-thirds of its value in 24 hours.
RSI on the 4H is buried near 17. That’s not “oversold bounce” territory yet — that’s a market with no bid under it.
Here’s the part that should make you pause:
The last 4H candle closed at 0.000360 after tagging 0.000310.
Volume is thin. The only real liquidity pool sits far below.
This is a falling asset with no floor nearby — just air.
My levels on the 4H:
Support is the old low zone around 0.000310.
If that gives way, the next natural magnet is the mid-0.00032 area and lower.
The only level that would tell me the bleed is stalling is a 4H close back above 0.000380.
Until then, bounces are exits, not entries.
My read: this is a chart that punishes optimism. The risk isn’t missing a rebound — it’s catching a falling brick before the volume confirms a real reversal.
Tap $BETA and look at the 4H close yourself — the level is obvious once you see it.
Follow for the follow-up when this range either reclaims or collapses — that’s the only signal that matters.
Which level are you watching on $BETA — the reclaim zone or the breakdown? 👇
⚠️ Not financial advice. DYOR.
#BETA #Crypto #BinanceSquare
55
·
--
Markets are busy debating if Amazon’s massive tech bets will pay off, but crypto isn't waiting around to de-risk.
$BETA slid 64.00% to trade at 0.00036, spanning a wild 219.44% range from 0.0011 down to 0.00031 on just $296,136 volume.
When broader risk sentiment turns defensive, smaller caps get hit double hard. Are you holding cash or looking for setups? #BETA #CryptoTrading
Markets are busy debating if Amazon’s massive tech bets will pay off, but crypto isn't waiting around to de-risk.
$BETA slid 64.00% to trade at 0.00036, spanning a wild 219.44% range from 0.0011 down to 0.00031 on just $296,136 volume.
When broader risk sentiment turns defensive, smaller caps get hit double hard. Are you holding cash or looking for setups? #BETA #CryptoTrading
$BETA slid 64.00% to trade at 0.00036, spanning a wild 219.44% range from 0.0011 down to 0.00031 on just $296,136 volume.
When broader risk sentiment turns defensive, smaller caps get hit double hard. Are you holding cash or looking for setups? #BETA #CryptoTrading

61
·
--
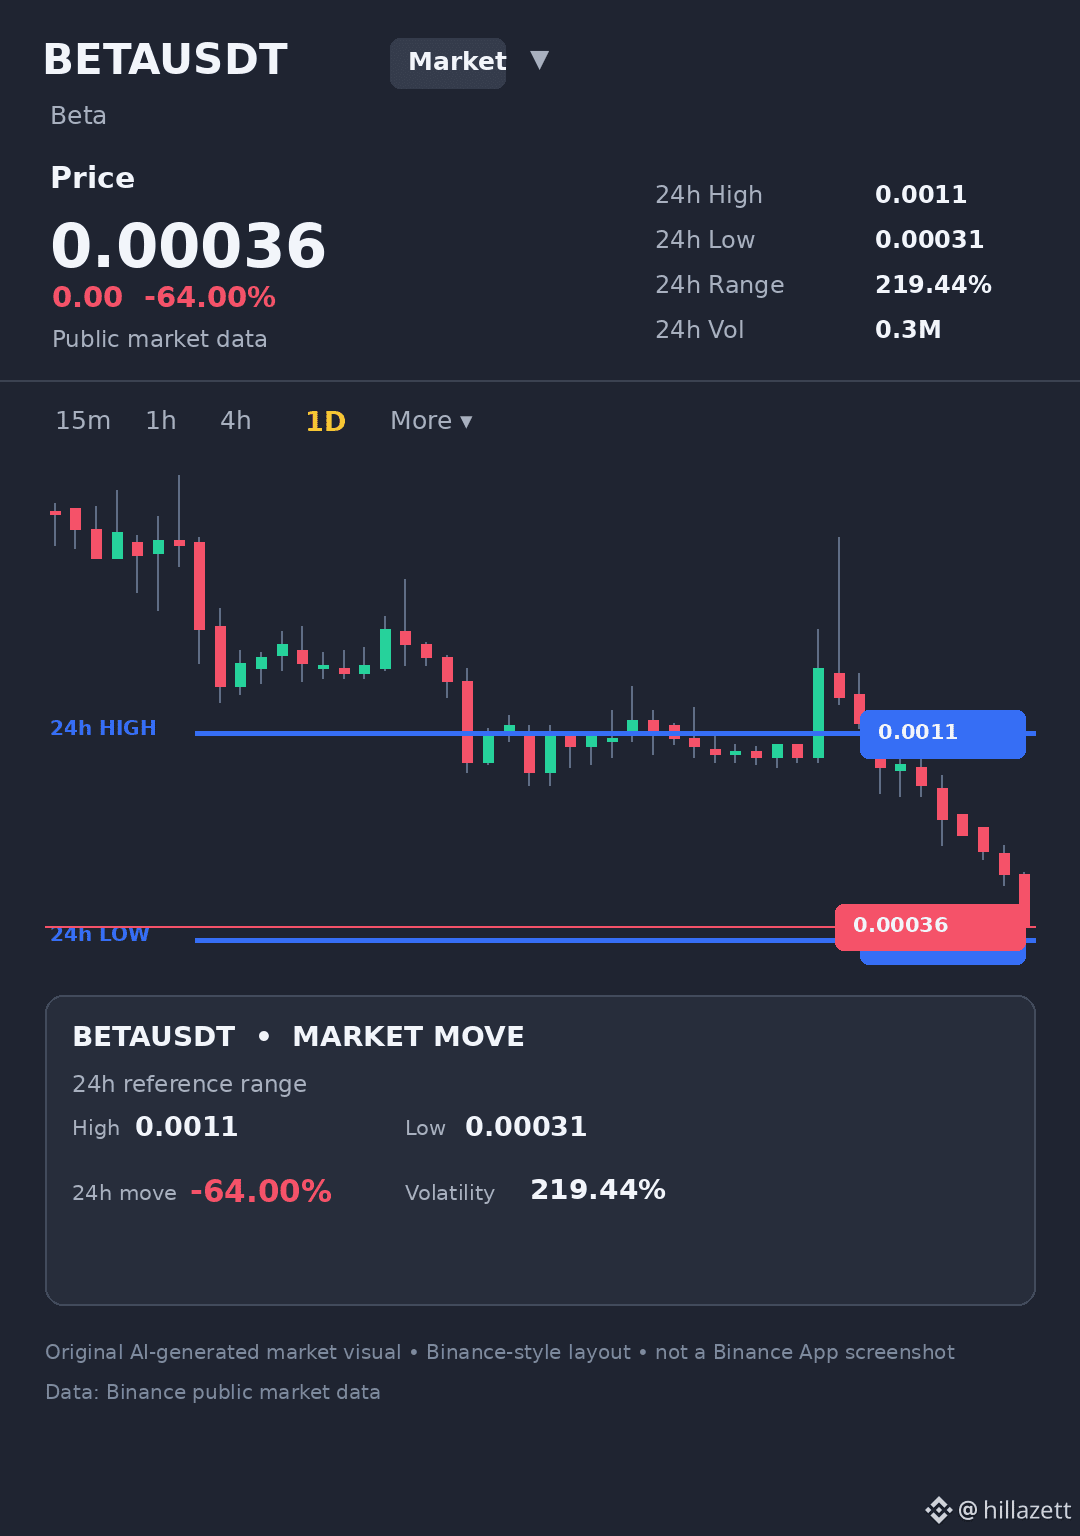
Looking closely at the $BETA chart today.
Price got hammered down 64.00% to 0.00036, stretching across a 219.44% spread between 0.0011 and 0.00031 on $296,136 volume.
When a candle pins this close to the lows without building any reclaim structure, trying to catch the knife usually hurts.
Are you waiting for a confirmed base here, or staying completely clear? #BETA #CryptoTrading
Looking closely at the $BETA chart today.
Price got hammered down 64.00% to 0.00036, stretching across a 219.44% spread between 0.0011 and 0.00031 on $296,136 volume.
When a candle pins this close to the lows without building any reclaim structure, trying to catch the knife usually hurts.
Are you waiting for a confirmed base here, or staying completely clear? #BETA #CryptoTrading
Price got hammered down 64.00% to 0.00036, stretching across a 219.44% spread between 0.0011 and 0.00031 on $296,136 volume.
When a candle pins this close to the lows without building any reclaim structure, trying to catch the knife usually hurts.
Are you waiting for a confirmed base here, or staying completely clear? #BETA #CryptoTrading
76
·
--
Thin liquidity turns ordinary selling into massive price swings.
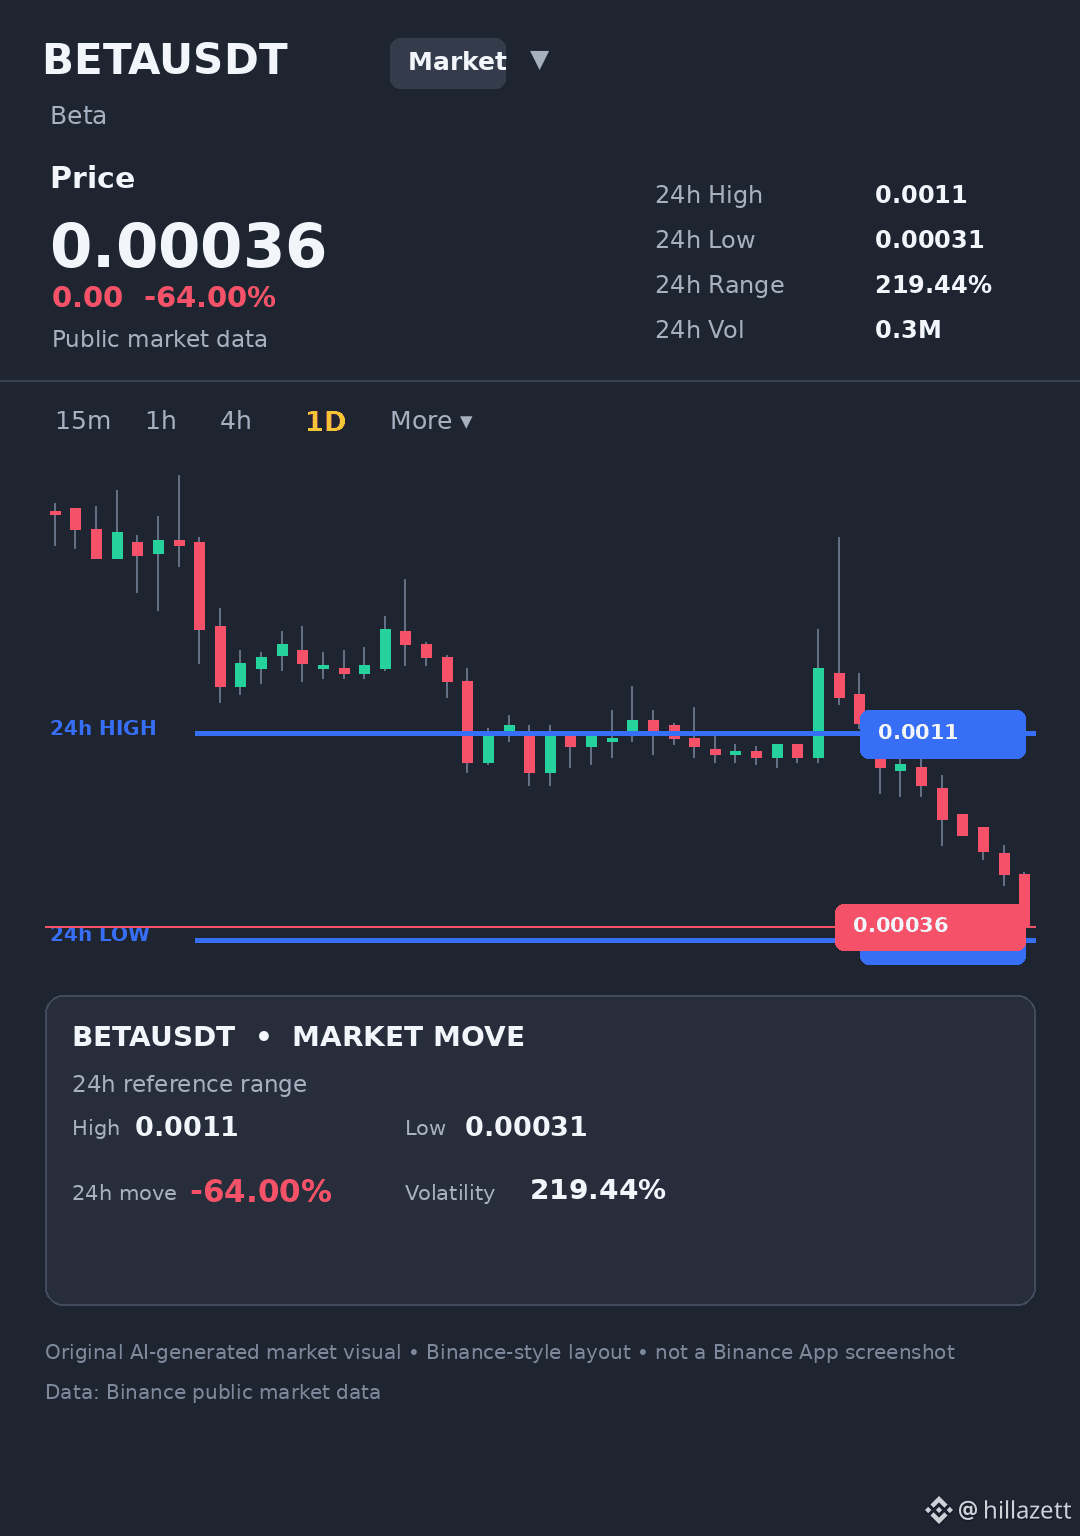
$BETA collapsed 64.00% to 0.00036, carving out a 219.44% range between 0.0011 and 0.00031 on just $296,136 in volume.
When volume is thin across such a wide spread, market orders often trigger severe slippage. Limit orders protect your fill when depth dries up.
Do you stick strictly to limit orders on days like this? #BETA #CryptoEducation
Thin liquidity turns ordinary selling into massive price swings.
$BETA collapsed 64.00% to 0.00036, carving out a 219.44% range between 0.0011 and 0.00031 on just $296,136 in volume.
When volume is thin across such a wide spread, market orders often trigger severe slippage. Limit orders protect your fill when depth dries up.
Do you stick strictly to limit orders on days like this? #BETA #CryptoEducation
$BETA collapsed 64.00% to 0.00036, carving out a 219.44% range between 0.0011 and 0.00031 on just $296,136 in volume.
When volume is thin across such a wide spread, market orders often trigger severe slippage. Limit orders protect your fill when depth dries up.
Do you stick strictly to limit orders on days like this? #BETA #CryptoEducation
11
What actually happens when a coin loses 64% in a single day?
The chart looks destroyed — but the internals whisper something stranger.
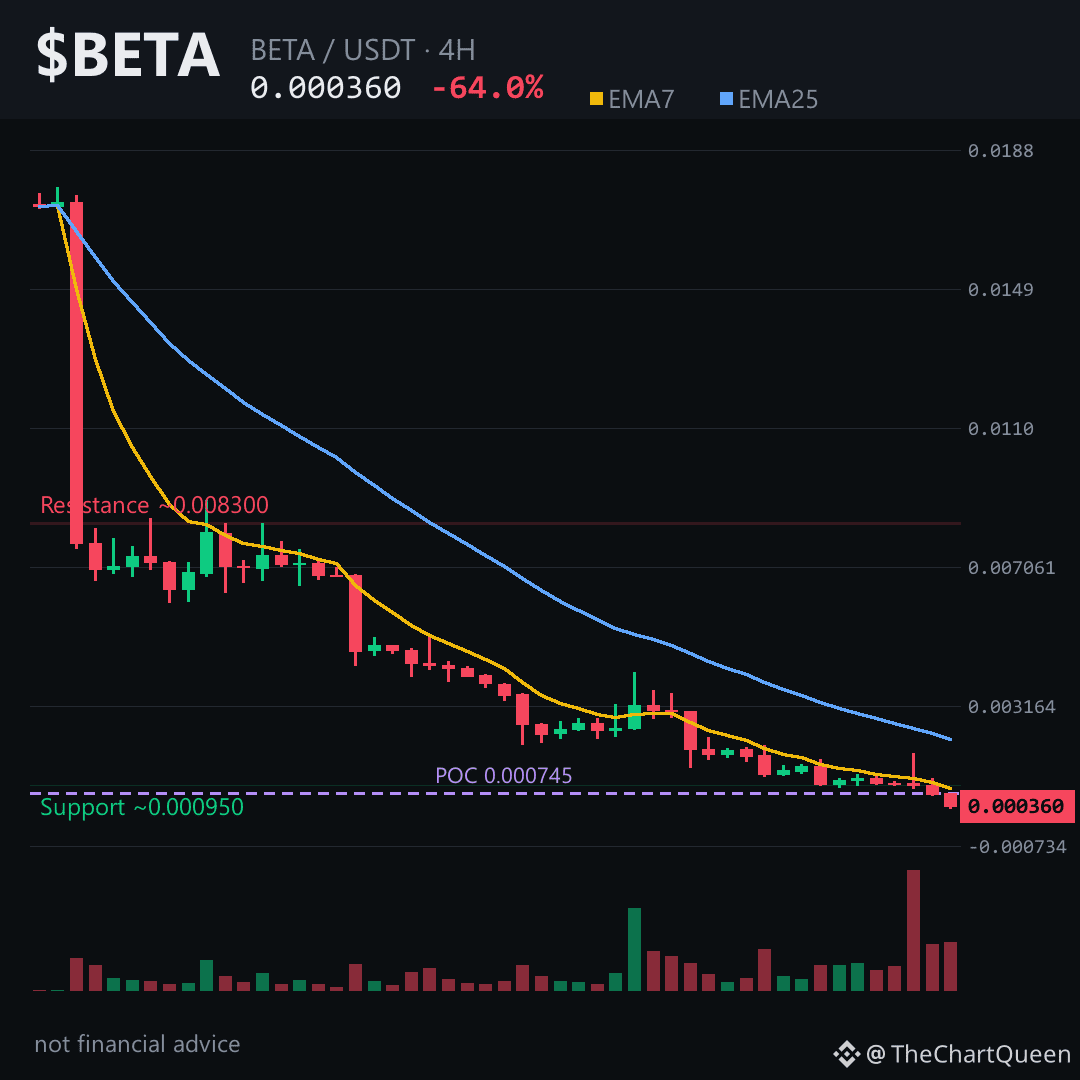
$BETA is trading around the 0.00036 area after a brutal 24 hours. Price gapped from 0.00074 down to 0.00031 in one 4-hour candle. That's not a dip. That's a liquidation event.
RSI on the 4H is near 17. On the daily, around 15. Below 20 is rare. Below 15 is the kind of exhaustion you see right before violent bounces.
But here's the trap.
There's an unfilled bearish gap between 0.00230 and 0.00286. Markets often revisit those gaps. Not today. But eventually.
The heaviest traded level sits around 0.000745 — nearly double the current price. That's now overhead resistance. Any bounce into the 0.00070s likely meets sellers who want out at breakeven.
The bearish case stays intact while price holds below roughly 0.00038. That's the line in the sand — a 4H close above it and the "continuation down" story weakens fast. Below it, the objective zone sits near 0.00033, with a deeper macro target around 0.00023 if momentum refuses to cool.
Tap $BETA to pull up the chart.
My read: this is a falling knife with a coiled spring underneath. Oversold doesn't mean "done dropping." The real risk is catching a bounce before price reclaims the 0.00038 area.
Where do you think $BETA finds its first real floor? 👇
Follow for the next read on this chart.
⚠️ Not financial advice. DYOR.
#BETA #Crypto #BinanceSquare #Altcoins
What actually happens when a coin loses 64% in a single day?
The chart looks destroyed — but the internals whisper something stranger.
$BETA is trading around the 0.00036 area after a brutal 24 hours. Price gapped from 0.00074 down to 0.00031 in one 4-hour candle. That's not a dip. That's a liquidation event.
RSI on the 4H is near 17. On the daily, around 15. Below 20 is rare. Below 15 is the kind of exhaustion you see right before violent bounces.
But here's the trap.
There's an unfilled bearish gap between 0.00230 and 0.00286. Markets often revisit those gaps. Not today. But eventually.
The heaviest traded level sits around 0.000745 — nearly double the current price. That's now overhead resistance. Any bounce into the 0.00070s likely meets sellers who want out at breakeven.
The bearish case stays intact while price holds below roughly 0.00038. That's the line in the sand — a 4H close above it and the "continuation down" story weakens fast. Below it, the objective zone sits near 0.00033, with a deeper macro target around 0.00023 if momentum refuses to cool.
Tap $BETA to pull up the chart.
My read: this is a falling knife with a coiled spring underneath. Oversold doesn't mean "done dropping." The real risk is catching a bounce before price reclaims the 0.00038 area.
Where do you think $BETA finds its first real floor? 👇
Follow for the next read on this chart.
⚠️ Not financial advice. DYOR.
#BETA #Crypto #BinanceSquare #Altcoins
The chart looks destroyed — but the internals whisper something stranger.
$BETA is trading around the 0.00036 area after a brutal 24 hours. Price gapped from 0.00074 down to 0.00031 in one 4-hour candle. That's not a dip. That's a liquidation event.
RSI on the 4H is near 17. On the daily, around 15. Below 20 is rare. Below 15 is the kind of exhaustion you see right before violent bounces.
But here's the trap.
There's an unfilled bearish gap between 0.00230 and 0.00286. Markets often revisit those gaps. Not today. But eventually.
The heaviest traded level sits around 0.000745 — nearly double the current price. That's now overhead resistance. Any bounce into the 0.00070s likely meets sellers who want out at breakeven.
The bearish case stays intact while price holds below roughly 0.00038. That's the line in the sand — a 4H close above it and the "continuation down" story weakens fast. Below it, the objective zone sits near 0.00033, with a deeper macro target around 0.00023 if momentum refuses to cool.
Tap $BETA to pull up the chart.
My read: this is a falling knife with a coiled spring underneath. Oversold doesn't mean "done dropping." The real risk is catching a bounce before price reclaims the 0.00038 area.
Where do you think $BETA finds its first real floor? 👇
Follow for the next read on this chart.
⚠️ Not financial advice. DYOR.
#BETA #Crypto #BinanceSquare #Altcoins
76
·
--
The math on steep pullbacks is rarely intuitive.
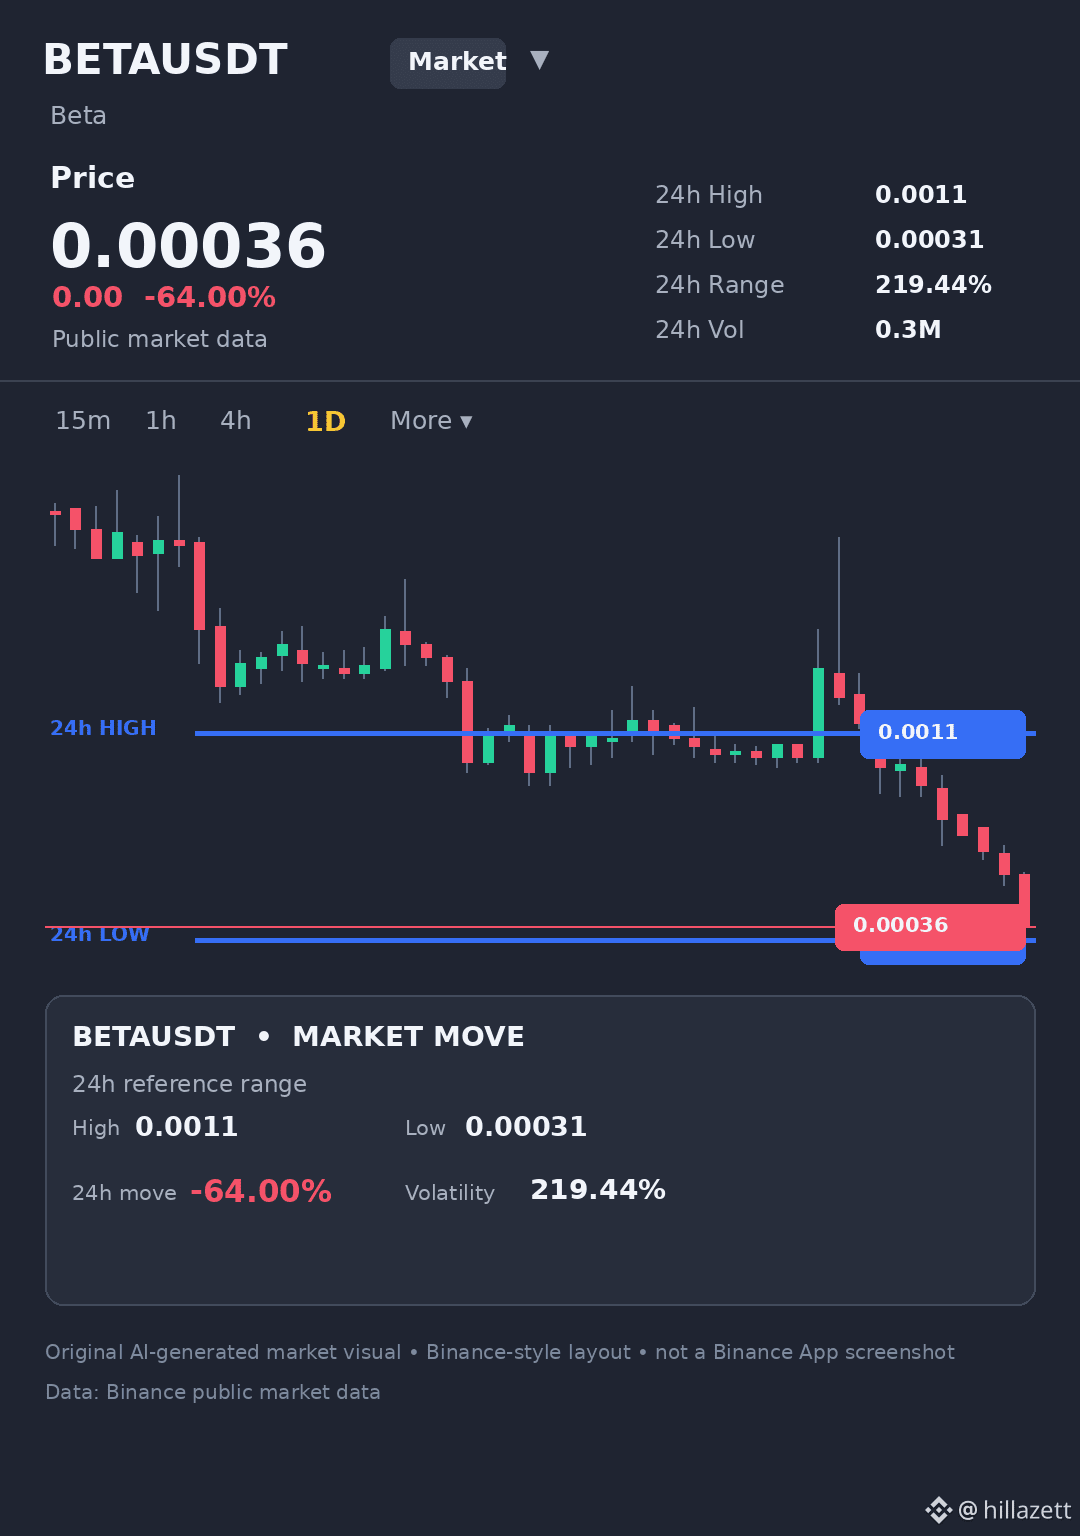
$BETA is down 64.00% to 0.00036, spanning a 219.44% range between 0.0011 and 0.00031 on $296,136 volume.
A 64% drop requires nearly a 180% rally just to break even from the starting price. That asymmetry is why sizing discipline matters far more than trying to catch the exact bottom.
Do you calculate recovery math before buying heavy dips? #BETA #CryptoEducation
The math on steep pullbacks is rarely intuitive.
$BETA is down 64.00% to 0.00036, spanning a 219.44% range between 0.0011 and 0.00031 on $296,136 volume.
A 64% drop requires nearly a 180% rally just to break even from the starting price. That asymmetry is why sizing discipline matters far more than trying to catch the exact bottom.
Do you calculate recovery math before buying heavy dips? #BETA #CryptoEducation
$BETA is down 64.00% to 0.00036, spanning a 219.44% range between 0.0011 and 0.00031 on $296,136 volume.
A 64% drop requires nearly a 180% rally just to break even from the starting price. That asymmetry is why sizing discipline matters far more than trying to catch the exact bottom.
Do you calculate recovery math before buying heavy dips? #BETA #CryptoEducation
73
·
--
Few things test patience quite like a steep intraday plunge.
$BETA dropped 64.00% down to 0.00036, covering a massive 219.44% range between 0.0011 and 0.00031 on $296,136 in volume. Hovering just above the session low, the tape remains unsettled.
How do you handle momentum when it shifts this quickly? #BETA #CryptoTrading
Few things test patience quite like a steep intraday plunge.
$BETA dropped 64.00% down to 0.00036, covering a massive 219.44% range between 0.0011 and 0.00031 on $296,136 in volume. Hovering just above the session low, the tape remains unsettled.
How do you handle momentum when it shifts this quickly? #BETA #CryptoTrading
$BETA dropped 64.00% down to 0.00036, covering a massive 219.44% range between 0.0011 and 0.00031 on $296,136 in volume. Hovering just above the session low, the tape remains unsettled.
How do you handle momentum when it shifts this quickly? #BETA #CryptoTrading
52
Here's the ugly truth about a -64% day: the fall isn't the story. It's what happens after the knife stops bouncing that separates the survivors from the spectators.
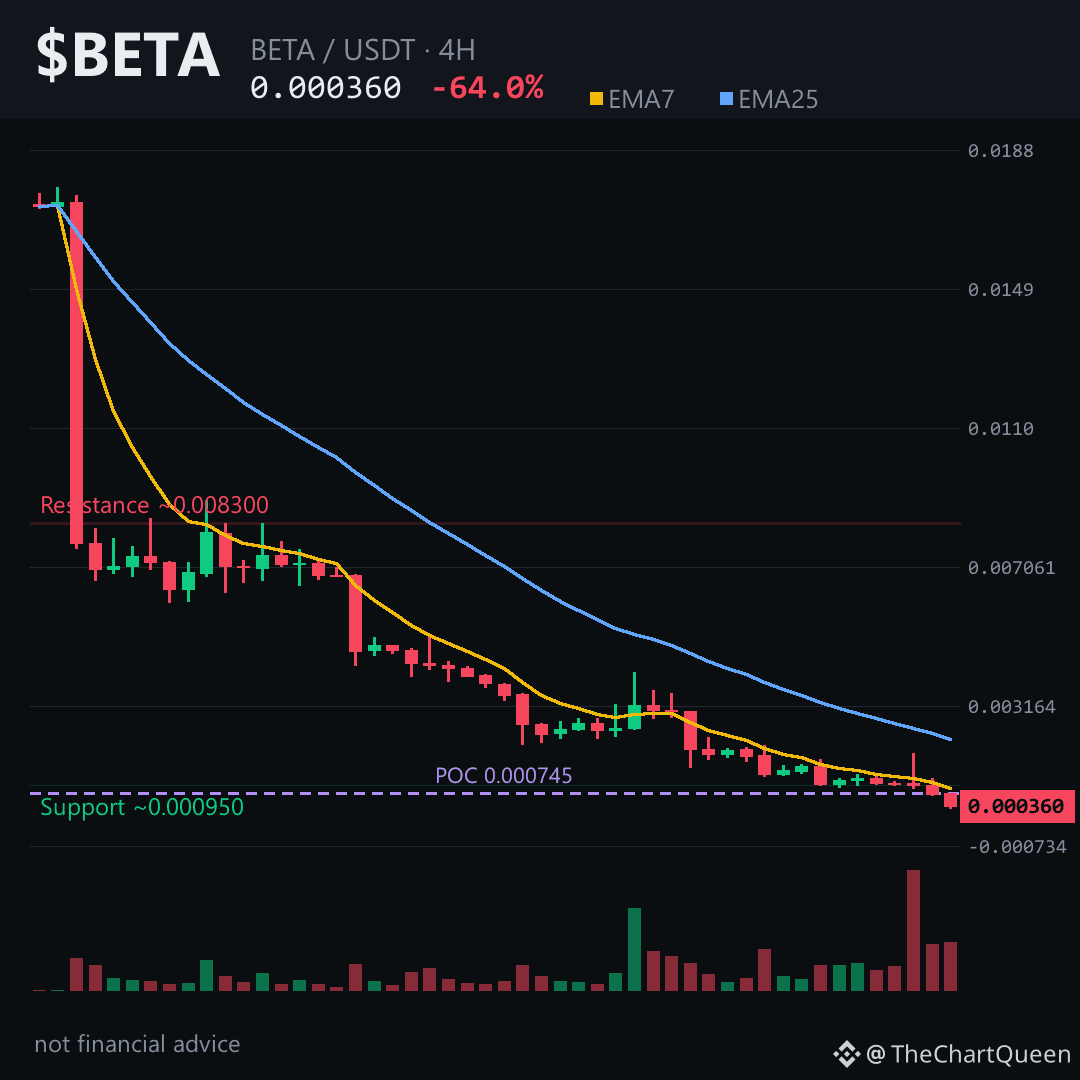
$BETA didn't just bleed out — it collapsed through every level that used to mean something. The 4H chart shows a 51% red candle in the last 00:00 close alone. Price went from 0.000740 to 0.000360 in one four-hour window. That's not a correction. That's a structural break.
RSI on the 4H is sitting at 17.5. On the daily, it's 15.4. Both are deep in oversold territory, but oversold in a downtrend like this usually means "paused," not "bottomed." The EMA7 is trading more than 60% below the EMA25 on the daily — that's not a dip, that's a coin that lost its bid entirely.
The 4H picture is the only one that matters right now. Price is hovering around 0.000360, and the invalidation zone sits just above at roughly 0.000380. If $BETA can't reclaim that area on a 4H close, the path of least resistance points toward 0.000329 and potentially lower.
What concerns me most isn't the red candles. It's the silence. Funding rate is flat at zero. Open interest is effectively nonexistent. That means no one is left to fight over this coin — no leverage, no positioning, no real interest. A dead market can drift lower for a long time without a bounce, because there's no fuel for a short squeeze.
My read: the chart is bearish until proven otherwise, and the only proof that matters is a 4H close back above 0.000380. Until then, every pop is suspect. The real risk isn't missing the bottom — it's catching a falling knife that hasn't finished falling.
Tap $BETA to pull up the chart and see how cleanly price rejected the 0.000380 area on the last push.
I'll be watching whether 0.000329 holds or folds in the next 24 hours — follow along if you want the read as it develops, not after it's already happened.
What level are you watching on BETA right now? 👇
Not financial advice. DYOR.
#BETA #Crypto #BinanceSquare #MarketAnalysis #Altcoins
Here's the ugly truth about a -64% day: the fall isn't the story. It's what happens after the knife stops bouncing that separates the survivors from the spectators.
$BETA didn't just bleed out — it collapsed through every level that used to mean something. The 4H chart shows a 51% red candle in the last 00:00 close alone. Price went from 0.000740 to 0.000360 in one four-hour window. That's not a correction. That's a structural break.
RSI on the 4H is sitting at 17.5. On the daily, it's 15.4. Both are deep in oversold territory, but oversold in a downtrend like this usually means "paused," not "bottomed." The EMA7 is trading more than 60% below the EMA25 on the daily — that's not a dip, that's a coin that lost its bid entirely.
The 4H picture is the only one that matters right now. Price is hovering around 0.000360, and the invalidation zone sits just above at roughly 0.000380. If $BETA can't reclaim that area on a 4H close, the path of least resistance points toward 0.000329 and potentially lower.
What concerns me most isn't the red candles. It's the silence. Funding rate is flat at zero. Open interest is effectively nonexistent. That means no one is left to fight over this coin — no leverage, no positioning, no real interest. A dead market can drift lower for a long time without a bounce, because there's no fuel for a short squeeze.
My read: the chart is bearish until proven otherwise, and the only proof that matters is a 4H close back above 0.000380. Until then, every pop is suspect. The real risk isn't missing the bottom — it's catching a falling knife that hasn't finished falling.
Tap $BETA to pull up the chart and see how cleanly price rejected the 0.000380 area on the last push.
I'll be watching whether 0.000329 holds or folds in the next 24 hours — follow along if you want the read as it develops, not after it's already happened.
What level are you watching on BETA right now? 👇
Not financial advice. DYOR.
#BETA #Crypto #BinanceSquare #MarketAnalysis #Altcoins
$BETA didn't just bleed out — it collapsed through every level that used to mean something. The 4H chart shows a 51% red candle in the last 00:00 close alone. Price went from 0.000740 to 0.000360 in one four-hour window. That's not a correction. That's a structural break.
RSI on the 4H is sitting at 17.5. On the daily, it's 15.4. Both are deep in oversold territory, but oversold in a downtrend like this usually means "paused," not "bottomed." The EMA7 is trading more than 60% below the EMA25 on the daily — that's not a dip, that's a coin that lost its bid entirely.
The 4H picture is the only one that matters right now. Price is hovering around 0.000360, and the invalidation zone sits just above at roughly 0.000380. If $BETA can't reclaim that area on a 4H close, the path of least resistance points toward 0.000329 and potentially lower.
What concerns me most isn't the red candles. It's the silence. Funding rate is flat at zero. Open interest is effectively nonexistent. That means no one is left to fight over this coin — no leverage, no positioning, no real interest. A dead market can drift lower for a long time without a bounce, because there's no fuel for a short squeeze.
My read: the chart is bearish until proven otherwise, and the only proof that matters is a 4H close back above 0.000380. Until then, every pop is suspect. The real risk isn't missing the bottom — it's catching a falling knife that hasn't finished falling.
Tap $BETA to pull up the chart and see how cleanly price rejected the 0.000380 area on the last push.
I'll be watching whether 0.000329 holds or folds in the next 24 hours — follow along if you want the read as it develops, not after it's already happened.
What level are you watching on BETA right now? 👇
Not financial advice. DYOR.
#BETA #Crypto #BinanceSquare #MarketAnalysis #Altcoins
14
Minus 64% in a single day — and the 4H chart just printed its most violent red candle yet 🔻
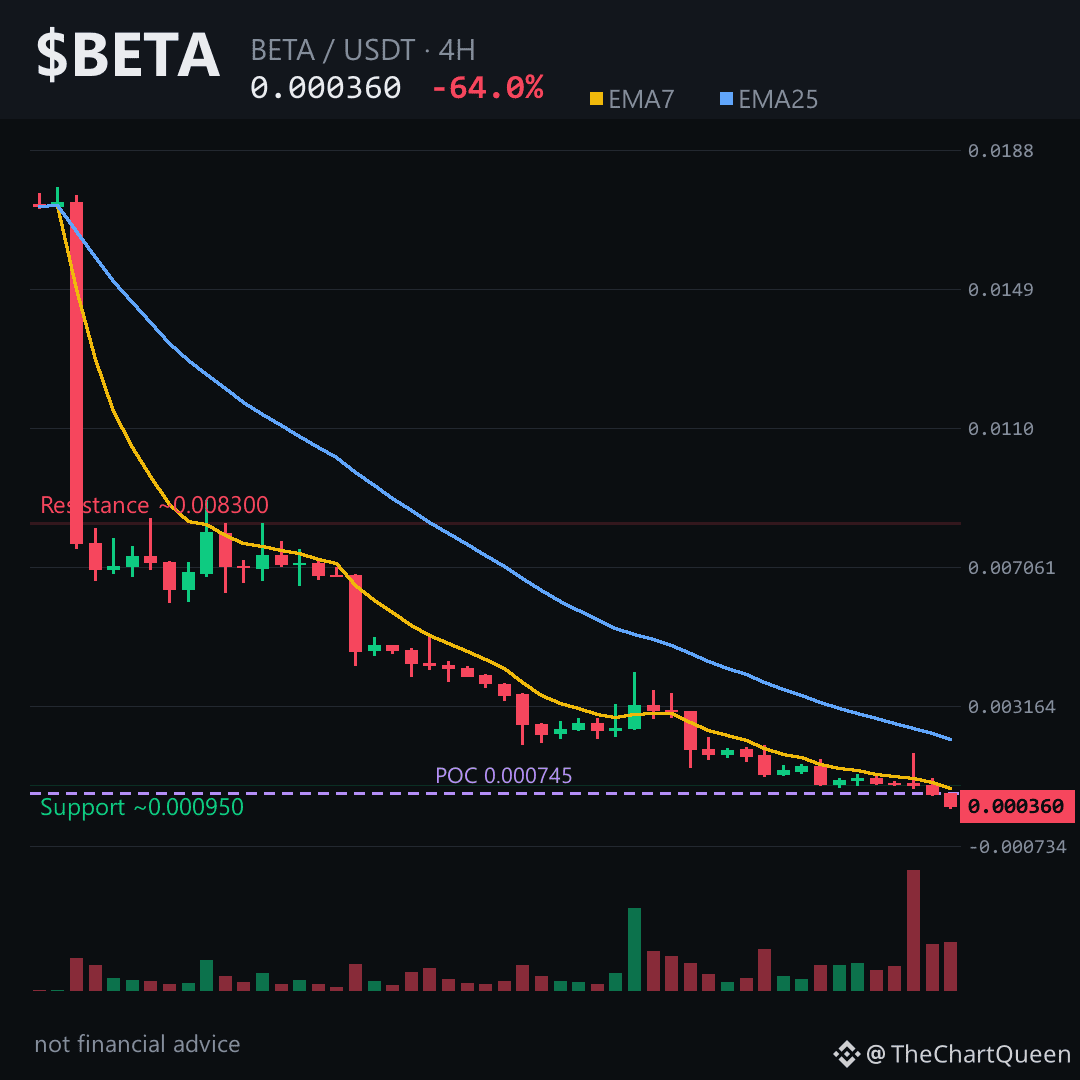
That’s not a dip. That’s a full structural break. The wick to 0.00031000 and close at 0.00036000 show the bid side is thin, and every tiny bounce gets sold into the next candle.
EMA7 is now roughly half of EMA25 on the 4H — the kind of spread that usually shows up only after a liquidation cascade. RSI is buried under 18, but volume is fading with every green candle. The bearish FVG between 0.00230000 and 0.00286000 is a vacuum zone far above — price isn’t coming back without a serious catalyst.
The 1D is uglier: RSI pinned near 15, weekly POC at 0.043694 — now 100x away. This isn’t a pullback; it’s a regime reset.
My read on $BETA: ~0.00038000 is the line in the sand on the 4H. Lose that on a close and the next objective is near 0.00032900, with 0.00030800 as the lower magnet. The only thing that flips this read is a 4H close back above ~0.00040000 — and even then, the structure above is a minefield.
Tap $BETA to pull up the chart and see how thin this book really is.
I’ll be watching whether that 0.00031000 low gets retested or respected into the next session — follow for the update, because this move isn’t done writing itself yet.
What level are you watching on $BETA right now 👇
⚠️ Not financial advice. DYOR.
#BETA #Crypto #BinanceSquare #MarketAnalysis
Minus 64% in a single day — and the 4H chart just printed its most violent red candle yet 🔻
That’s not a dip. That’s a full structural break. The wick to 0.00031000 and close at 0.00036000 show the bid side is thin, and every tiny bounce gets sold into the next candle.
EMA7 is now roughly half of EMA25 on the 4H — the kind of spread that usually shows up only after a liquidation cascade. RSI is buried under 18, but volume is fading with every green candle. The bearish FVG between 0.00230000 and 0.00286000 is a vacuum zone far above — price isn’t coming back without a serious catalyst.
The 1D is uglier: RSI pinned near 15, weekly POC at 0.043694 — now 100x away. This isn’t a pullback; it’s a regime reset.
My read on $BETA: ~0.00038000 is the line in the sand on the 4H. Lose that on a close and the next objective is near 0.00032900, with 0.00030800 as the lower magnet. The only thing that flips this read is a 4H close back above ~0.00040000 — and even then, the structure above is a minefield.
Tap $BETA to pull up the chart and see how thin this book really is.
I’ll be watching whether that 0.00031000 low gets retested or respected into the next session — follow for the update, because this move isn’t done writing itself yet.
What level are you watching on $BETA right now 👇
⚠️ Not financial advice. DYOR.
#BETA #Crypto #BinanceSquare #MarketAnalysis
That’s not a dip. That’s a full structural break. The wick to 0.00031000 and close at 0.00036000 show the bid side is thin, and every tiny bounce gets sold into the next candle.
EMA7 is now roughly half of EMA25 on the 4H — the kind of spread that usually shows up only after a liquidation cascade. RSI is buried under 18, but volume is fading with every green candle. The bearish FVG between 0.00230000 and 0.00286000 is a vacuum zone far above — price isn’t coming back without a serious catalyst.
The 1D is uglier: RSI pinned near 15, weekly POC at 0.043694 — now 100x away. This isn’t a pullback; it’s a regime reset.
My read on $BETA: ~0.00038000 is the line in the sand on the 4H. Lose that on a close and the next objective is near 0.00032900, with 0.00030800 as the lower magnet. The only thing that flips this read is a 4H close back above ~0.00040000 — and even then, the structure above is a minefield.
Tap $BETA to pull up the chart and see how thin this book really is.
I’ll be watching whether that 0.00031000 low gets retested or respected into the next session — follow for the update, because this move isn’t done writing itself yet.
What level are you watching on $BETA right now 👇
⚠️ Not financial advice. DYOR.
#BETA #Crypto #BinanceSquare #MarketAnalysis
64

·
--
😨 BETA down 64% – Be careful not to buy at the top!
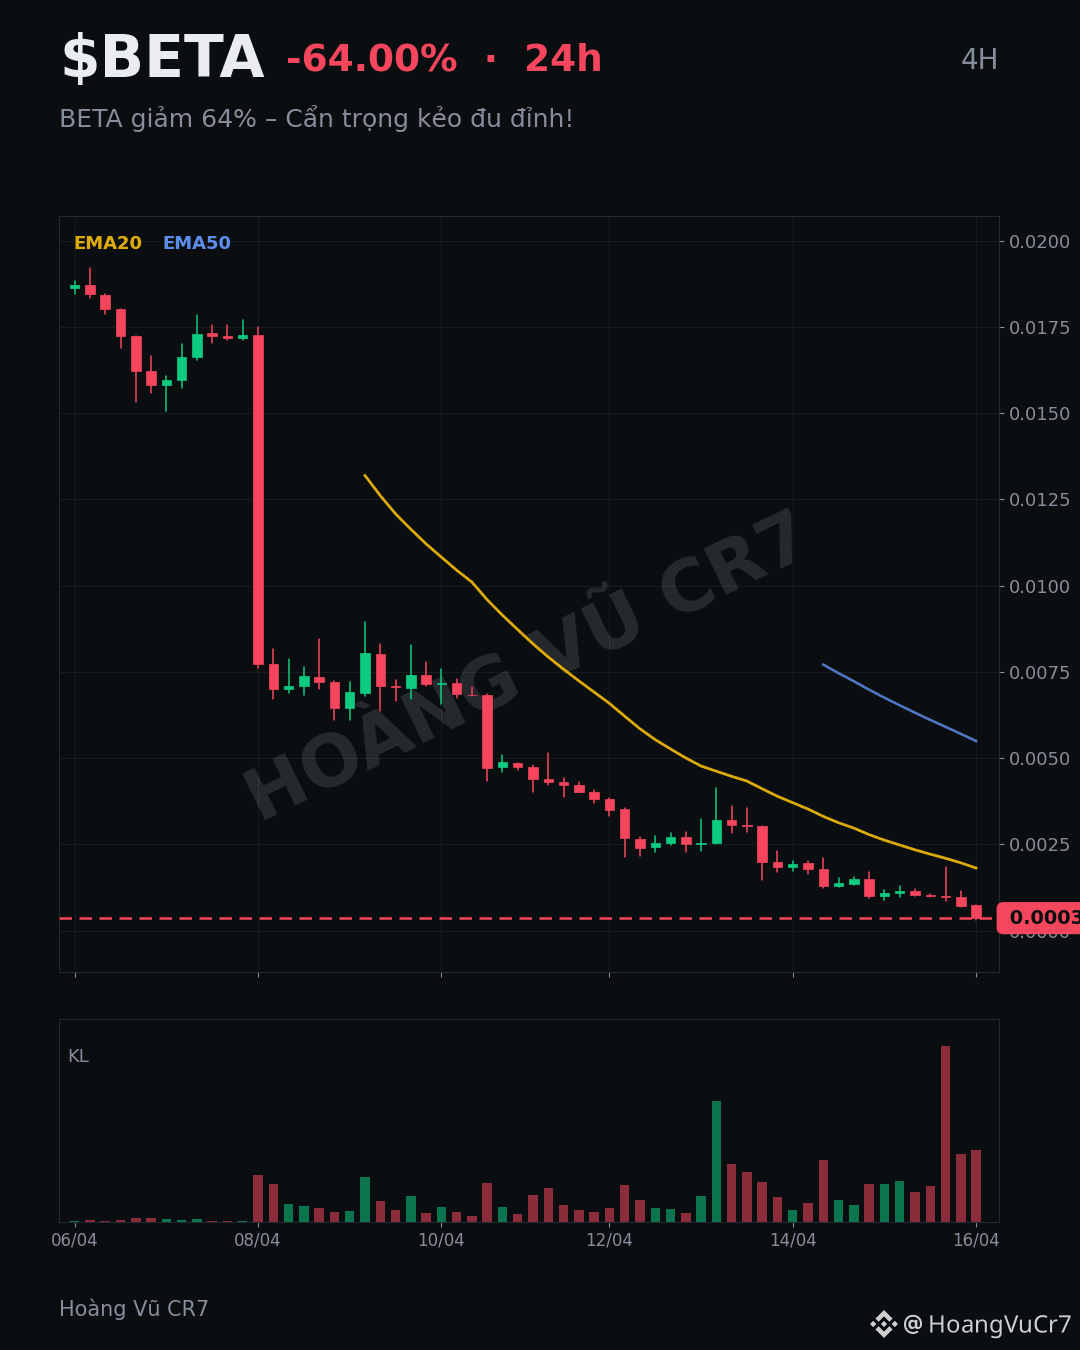
Honestly, I opened the price chart this morning and was shocked to see had plunged 64% in 24 hours. It’s a huge shock for anyone holding it—it feels like their account has been torn to shreds. I know there’s news about World ID for Zoom starting to roll out, but price action is truly beyond what many people expected. 📉
A lot of people are discussing the reasons behind it, but right now, the most important thing is to keep a cool head. Trading volume is also quite high, which shows extremely strong selling pressure. Whatever happens, remember that this is not investment advice, everyone. 🤔
Here’s what I’m keeping a close eye on right now:
* Will selling pressure ease, or will it continue to fall further?
* Where might find its next support level?
* Overall market sentiment toward altcoins is quite weak.
#BETA $BETA
😨 BETA down 64% – Be careful not to buy at the top!
Honestly, I opened the price chart this morning and was shocked to see had plunged 64% in 24 hours. It’s a huge shock for anyone holding it—it feels like their account has been torn to shreds. I know there’s news about World ID for Zoom starting to roll out, but price action is truly beyond what many people expected. 📉
A lot of people are discussing the reasons behind it, but right now, the most important thing is to keep a cool head. Trading volume is also quite high, which shows extremely strong selling pressure. Whatever happens, remember that this is not investment advice, everyone. 🤔
Here’s what I’m keeping a close eye on right now:
* Will selling pressure ease, or will it continue to fall further?
* Where might find its next support level?
* Overall market sentiment toward altcoins is quite weak.
#BETA $BETA
Honestly, I opened the price chart this morning and was shocked to see had plunged 64% in 24 hours. It’s a huge shock for anyone holding it—it feels like their account has been torn to shreds. I know there’s news about World ID for Zoom starting to roll out, but price action is truly beyond what many people expected. 📉
A lot of people are discussing the reasons behind it, but right now, the most important thing is to keep a cool head. Trading volume is also quite high, which shows extremely strong selling pressure. Whatever happens, remember that this is not investment advice, everyone. 🤔
Here’s what I’m keeping a close eye on right now:
* Will selling pressure ease, or will it continue to fall further?
* Where might find its next support level?
* Overall market sentiment toward altcoins is quite weak.
#BETA $BETA
127
Everyone sees a -64% candle and assumes the bottom is in.
Flip it: the structure says this thing hasn’t finished bleeding.
$BETA just carved a 254% range in a single day. That’s not a flush — that’s an asset trying to find any bid at all. RSI is buried near 17, which sounds “oversold” until you remember oversold can stay oversold while price keeps sliding.
The tell is the unfilled bearish gap sitting just above, around 0.0023-0.00286. Price collapsed through it and never looked back. That zone is now a ceiling, not a magnet.
The 4H read hinges on the ~0.00038 area. If price can’t reclaim that zone on a closing basis, the path of least resistance stays lower, toward the mid-0.00032s. Lose the ~0.00031 low from earlier today and the next leg could be fast.
My read: a falling knife with no confirmed floor yet. Bounce attempts keep getting sold, and until buyers reclaim that 0.00038-0.00040 band, any green candle is just noise inside a downtrend. Tap $BETA to see how clean that rejection structure is.
Follow me — I’ll update this read if price starts printing higher lows instead of lower ones. What level are you watching to decide this is actually bottoming? $BETA 👇
⚠️ Not financial advice. DYOR.
#BETA #Crypto #BinanceSquare
Everyone sees a -64% candle and assumes the bottom is in.
Flip it: the structure says this thing hasn’t finished bleeding.
$BETA just carved a 254% range in a single day. That’s not a flush — that’s an asset trying to find any bid at all. RSI is buried near 17, which sounds “oversold” until you remember oversold can stay oversold while price keeps sliding.
The tell is the unfilled bearish gap sitting just above, around 0.0023-0.00286. Price collapsed through it and never looked back. That zone is now a ceiling, not a magnet.
The 4H read hinges on the ~0.00038 area. If price can’t reclaim that zone on a closing basis, the path of least resistance stays lower, toward the mid-0.00032s. Lose the ~0.00031 low from earlier today and the next leg could be fast.
My read: a falling knife with no confirmed floor yet. Bounce attempts keep getting sold, and until buyers reclaim that 0.00038-0.00040 band, any green candle is just noise inside a downtrend. Tap $BETA to see how clean that rejection structure is.
Follow me — I’ll update this read if price starts printing higher lows instead of lower ones. What level are you watching to decide this is actually bottoming? $BETA 👇
⚠️ Not financial advice. DYOR.
#BETA #Crypto #BinanceSquare
Flip it: the structure says this thing hasn’t finished bleeding.
$BETA just carved a 254% range in a single day. That’s not a flush — that’s an asset trying to find any bid at all. RSI is buried near 17, which sounds “oversold” until you remember oversold can stay oversold while price keeps sliding.
The tell is the unfilled bearish gap sitting just above, around 0.0023-0.00286. Price collapsed through it and never looked back. That zone is now a ceiling, not a magnet.
The 4H read hinges on the ~0.00038 area. If price can’t reclaim that zone on a closing basis, the path of least resistance stays lower, toward the mid-0.00032s. Lose the ~0.00031 low from earlier today and the next leg could be fast.
My read: a falling knife with no confirmed floor yet. Bounce attempts keep getting sold, and until buyers reclaim that 0.00038-0.00040 band, any green candle is just noise inside a downtrend. Tap $BETA to see how clean that rejection structure is.
Follow me — I’ll update this read if price starts printing higher lows instead of lower ones. What level are you watching to decide this is actually bottoming? $BETA 👇
⚠️ Not financial advice. DYOR.
#BETA #Crypto #BinanceSquare
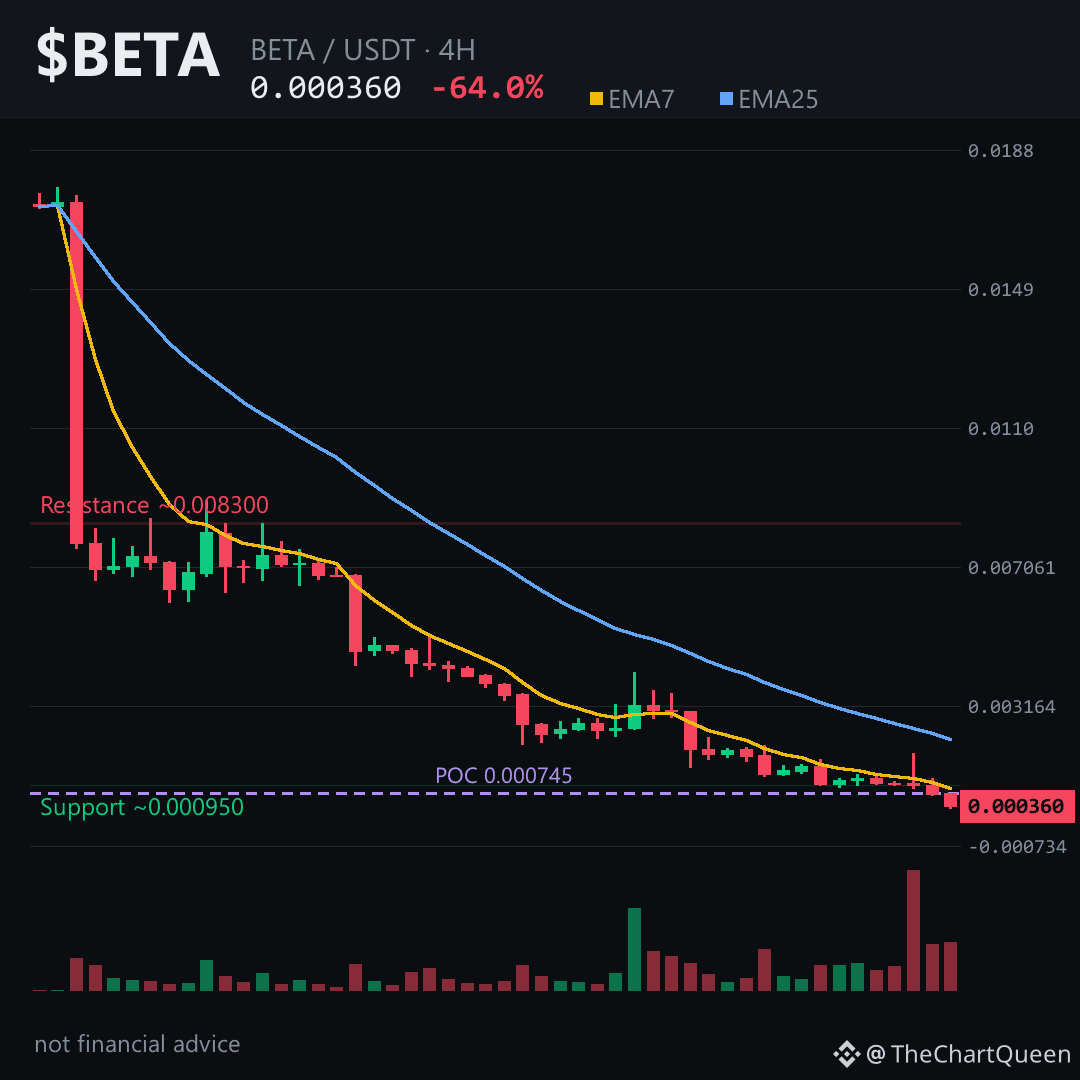
11
What happens to a coin that just lost 64% in a day — and still nobody is stepping in to catch it?
That is the uncomfortable question hanging over $BETA right now.
The chart is not just red. It is structurally broken.
On the 4-hour picture, price has collapsed from the 0.002 area all the way down to around 0.00036 — and the two moving averages that usually act like a floor are now miles above, both sloping down. That is not a dip. That is a trend reset.
RSI is sitting near 17. In plain words: the momentum gauge is pinned in extreme fear territory. A dead cat bounce can happen from here — but the path of least resistance is still lower until proven otherwise.
Futures activity is essentially absent. No meaningful funding, no open interest. This is a spot-driven washout, which often means the selling is real, not a leveraged flush that can snap back violently.
The levels that matter right now are brutally simple.
If $BETA cannot reclaim the 0.00038–0.00040 area — the zone just above current price — then the next gravitational pull is down toward the 0.00033 region, and below that, the macro picture opens up toward the 0.00023 area.
Lose the 0.00038 zone on any bounce and this read stays bearish. Reclaim it with conviction, and the oversold bounce gets interesting. Until then, the chart is not paying anyone to be brave.
My read: this is a falling knife with no visible hands trying to catch it yet. The risk is not in missing the bottom — it is in mistaking a pause for a reversal.
Follow me here — I will update this read if 0.00038 flips from resistance to support, because that is the only level that changes the conversation on $BETA.
Which zone are you watching closer — 0.00033 or 0.00040? 👇
⚠️ Not financial advice. DYOR.
#BETA #Crypto #BinanceSquare #Altcoins
What happens to a coin that just lost 64% in a day — and still nobody is stepping in to catch it?
That is the uncomfortable question hanging over $BETA right now.
The chart is not just red. It is structurally broken.
On the 4-hour picture, price has collapsed from the 0.002 area all the way down to around 0.00036 — and the two moving averages that usually act like a floor are now miles above, both sloping down. That is not a dip. That is a trend reset.
RSI is sitting near 17. In plain words: the momentum gauge is pinned in extreme fear territory. A dead cat bounce can happen from here — but the path of least resistance is still lower until proven otherwise.
Futures activity is essentially absent. No meaningful funding, no open interest. This is a spot-driven washout, which often means the selling is real, not a leveraged flush that can snap back violently.
The levels that matter right now are brutally simple.
If $BETA cannot reclaim the 0.00038–0.00040 area — the zone just above current price — then the next gravitational pull is down toward the 0.00033 region, and below that, the macro picture opens up toward the 0.00023 area.
Lose the 0.00038 zone on any bounce and this read stays bearish. Reclaim it with conviction, and the oversold bounce gets interesting. Until then, the chart is not paying anyone to be brave.
My read: this is a falling knife with no visible hands trying to catch it yet. The risk is not in missing the bottom — it is in mistaking a pause for a reversal.
Follow me here — I will update this read if 0.00038 flips from resistance to support, because that is the only level that changes the conversation on $BETA.
Which zone are you watching closer — 0.00033 or 0.00040? 👇
⚠️ Not financial advice. DYOR.
#BETA #Crypto #BinanceSquare #Altcoins
That is the uncomfortable question hanging over $BETA right now.
The chart is not just red. It is structurally broken.
On the 4-hour picture, price has collapsed from the 0.002 area all the way down to around 0.00036 — and the two moving averages that usually act like a floor are now miles above, both sloping down. That is not a dip. That is a trend reset.
RSI is sitting near 17. In plain words: the momentum gauge is pinned in extreme fear territory. A dead cat bounce can happen from here — but the path of least resistance is still lower until proven otherwise.
Futures activity is essentially absent. No meaningful funding, no open interest. This is a spot-driven washout, which often means the selling is real, not a leveraged flush that can snap back violently.
The levels that matter right now are brutally simple.
If $BETA cannot reclaim the 0.00038–0.00040 area — the zone just above current price — then the next gravitational pull is down toward the 0.00033 region, and below that, the macro picture opens up toward the 0.00023 area.
Lose the 0.00038 zone on any bounce and this read stays bearish. Reclaim it with conviction, and the oversold bounce gets interesting. Until then, the chart is not paying anyone to be brave.
My read: this is a falling knife with no visible hands trying to catch it yet. The risk is not in missing the bottom — it is in mistaking a pause for a reversal.
Follow me here — I will update this read if 0.00038 flips from resistance to support, because that is the only level that changes the conversation on $BETA.
Which zone are you watching closer — 0.00033 or 0.00040? 👇
⚠️ Not financial advice. DYOR.
#BETA #Crypto #BinanceSquare #Altcoins
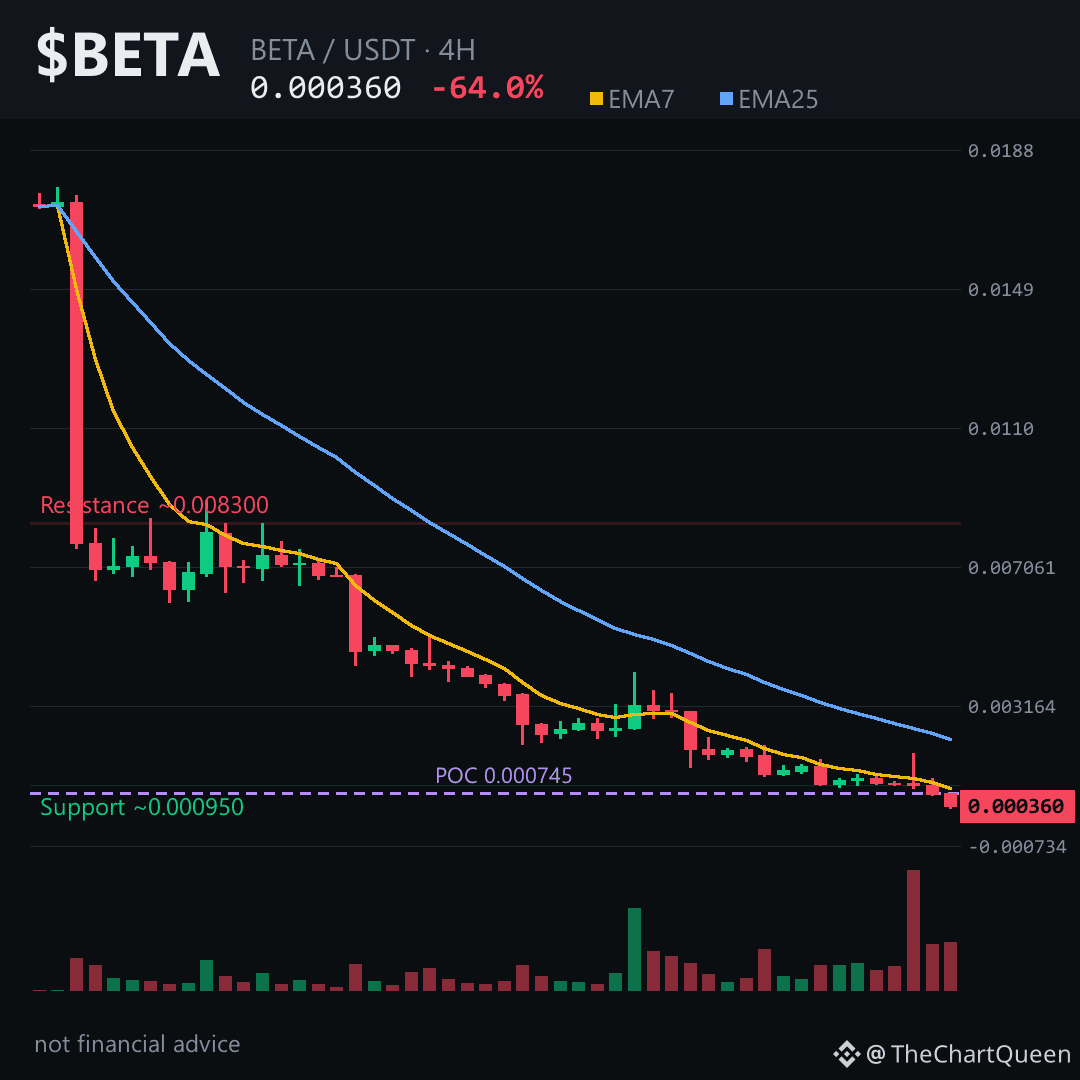
9
What does a -64% day actually look like on a chart?
It looks like gravity with a grudge.
$BETA just printed a 12-candle stretch where the last two 4H candles alone erased half of the token's remaining value. That's not a normal pullback. That's a full-scale repricing event.
When a coin falls this hard, the chart usually leaves behind an unfilled gap — a zone where price moved so fast it never traded at certain levels. For $BETA, that bearish gap sits between roughly 0.0023 and 0.00286. That's a ceiling. If price ever rallies back toward it, sellers who missed the exit earlier often show up there.
The 4H picture is the one that matters right now. Price is hovering near 0.00036, and momentum is screaming oversold — but oversold in a downtrend just means "cheap can get cheaper." The invalidation for this read sits around the 0.00038 zone. As long as price stays below that on a closing basis, the path of least resistance likely points toward 0.00033, where the next meaningful support cluster sits.
The macro view is uglier. The weekly chart's volume-weighted anchor sits near 0.0437 — meaning the average holder from recent months is underwater by over 99%. Every small bounce becomes an exit door.
My read: this is a falling knife in slow motion. Bounce attempts have been shallow and quickly sold. The real risk isn't missing the bottom — it's catching a "bounce" that's really just a pause before the next leg.
Tap $BETA and zoom out to the 4H. You'll see the gap I'm talking about.
I'll keep an eye on whether price can reclaim that 0.00038 area — that's the first sign of any real shift. Follow if you want the updated read when it does or doesn't.
Which level are you watching more closely — the 0.00033 support or the gap overhead on BETA? 👇
⚠️ Not financial advice. DYOR.
#BETA #Crypto #BinanceSquare #Altcoins
What does a -64% day actually look like on a chart?
It looks like gravity with a grudge.
$BETA just printed a 12-candle stretch where the last two 4H candles alone erased half of the token's remaining value. That's not a normal pullback. That's a full-scale repricing event.
When a coin falls this hard, the chart usually leaves behind an unfilled gap — a zone where price moved so fast it never traded at certain levels. For $BETA, that bearish gap sits between roughly 0.0023 and 0.00286. That's a ceiling. If price ever rallies back toward it, sellers who missed the exit earlier often show up there.
The 4H picture is the one that matters right now. Price is hovering near 0.00036, and momentum is screaming oversold — but oversold in a downtrend just means "cheap can get cheaper." The invalidation for this read sits around the 0.00038 zone. As long as price stays below that on a closing basis, the path of least resistance likely points toward 0.00033, where the next meaningful support cluster sits.
The macro view is uglier. The weekly chart's volume-weighted anchor sits near 0.0437 — meaning the average holder from recent months is underwater by over 99%. Every small bounce becomes an exit door.
My read: this is a falling knife in slow motion. Bounce attempts have been shallow and quickly sold. The real risk isn't missing the bottom — it's catching a "bounce" that's really just a pause before the next leg.
Tap $BETA and zoom out to the 4H. You'll see the gap I'm talking about.
I'll keep an eye on whether price can reclaim that 0.00038 area — that's the first sign of any real shift. Follow if you want the updated read when it does or doesn't.
Which level are you watching more closely — the 0.00033 support or the gap overhead on BETA? 👇
⚠️ Not financial advice. DYOR.
#BETA #Crypto #BinanceSquare #Altcoins
It looks like gravity with a grudge.
$BETA just printed a 12-candle stretch where the last two 4H candles alone erased half of the token's remaining value. That's not a normal pullback. That's a full-scale repricing event.
When a coin falls this hard, the chart usually leaves behind an unfilled gap — a zone where price moved so fast it never traded at certain levels. For $BETA, that bearish gap sits between roughly 0.0023 and 0.00286. That's a ceiling. If price ever rallies back toward it, sellers who missed the exit earlier often show up there.
The 4H picture is the one that matters right now. Price is hovering near 0.00036, and momentum is screaming oversold — but oversold in a downtrend just means "cheap can get cheaper." The invalidation for this read sits around the 0.00038 zone. As long as price stays below that on a closing basis, the path of least resistance likely points toward 0.00033, where the next meaningful support cluster sits.
The macro view is uglier. The weekly chart's volume-weighted anchor sits near 0.0437 — meaning the average holder from recent months is underwater by over 99%. Every small bounce becomes an exit door.
My read: this is a falling knife in slow motion. Bounce attempts have been shallow and quickly sold. The real risk isn't missing the bottom — it's catching a "bounce" that's really just a pause before the next leg.
Tap $BETA and zoom out to the 4H. You'll see the gap I'm talking about.
I'll keep an eye on whether price can reclaim that 0.00038 area — that's the first sign of any real shift. Follow if you want the updated read when it does or doesn't.
Which level are you watching more closely — the 0.00033 support or the gap overhead on BETA? 👇
⚠️ Not financial advice. DYOR.
#BETA #Crypto #BinanceSquare #Altcoins
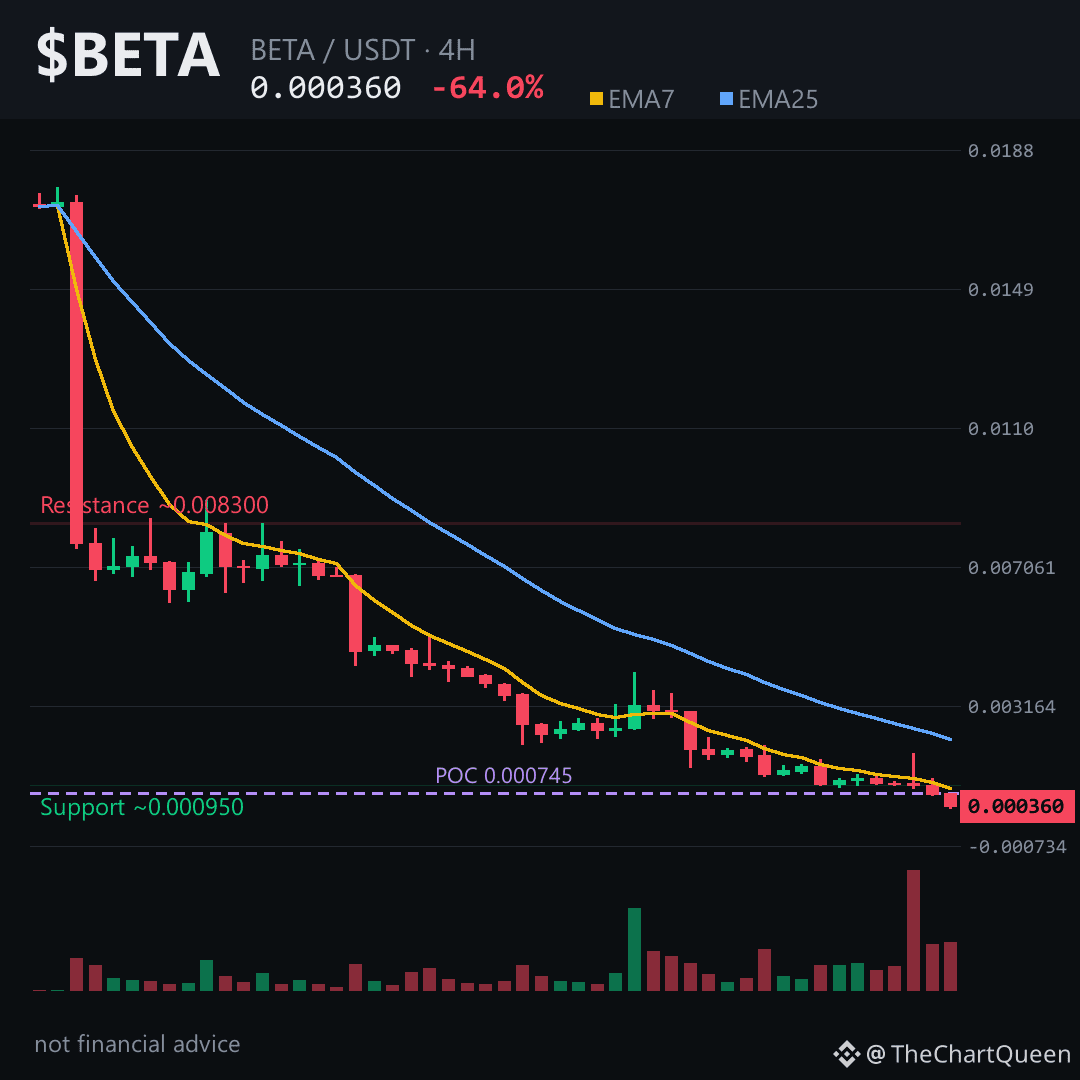
10
Log in to explore more content
Join global crypto users on Binance Square
⚡️ Get latest and useful information about crypto.
💬 Trusted by the world’s largest crypto exchange.
👍 Discover real insights from verified creators.
Email / Phone number
Trending Topics
1
#WhatWillDriveCryptoandStocks’NextRebound?
27,954 views
467 Discussing
2
#Anthropic’s6xIPODemandSignalsPotentialRecordRaise
8,543 views
209 Discussing
3
#HuangExitNvidiaStrategyInFocus
171,811 views
1,532 Discussing
4
#AnthropicRejectsIPODelayValuationinQuestion
792,233 views
5,714 Discussing
5
#HedgeFundsCMEBitcoinNetShortsFall89%
13,678 views
215 Discussing
6
#BitMineReports$6.3BNetLossForFiscal2026
24,259 views
190 Discussing
7
#BitcoinETFOutflowsHit1.6B
0 views
3 Discussing
8
#TradFiForBeginners
566,271 views
3,960 Discussing
9
#SoFiExpandsSoFiUSDStablecoinToPolygon
8,296 views
122 Discussing
10
#TetherGoldXAUTCompletesKPMGAudit
11,851 views
137 Discussing