
#aaveproposesassetlistingframework
aaveproposesassetlistingframework
8,521 views
93 Discussing
Hot
Latest

·
--
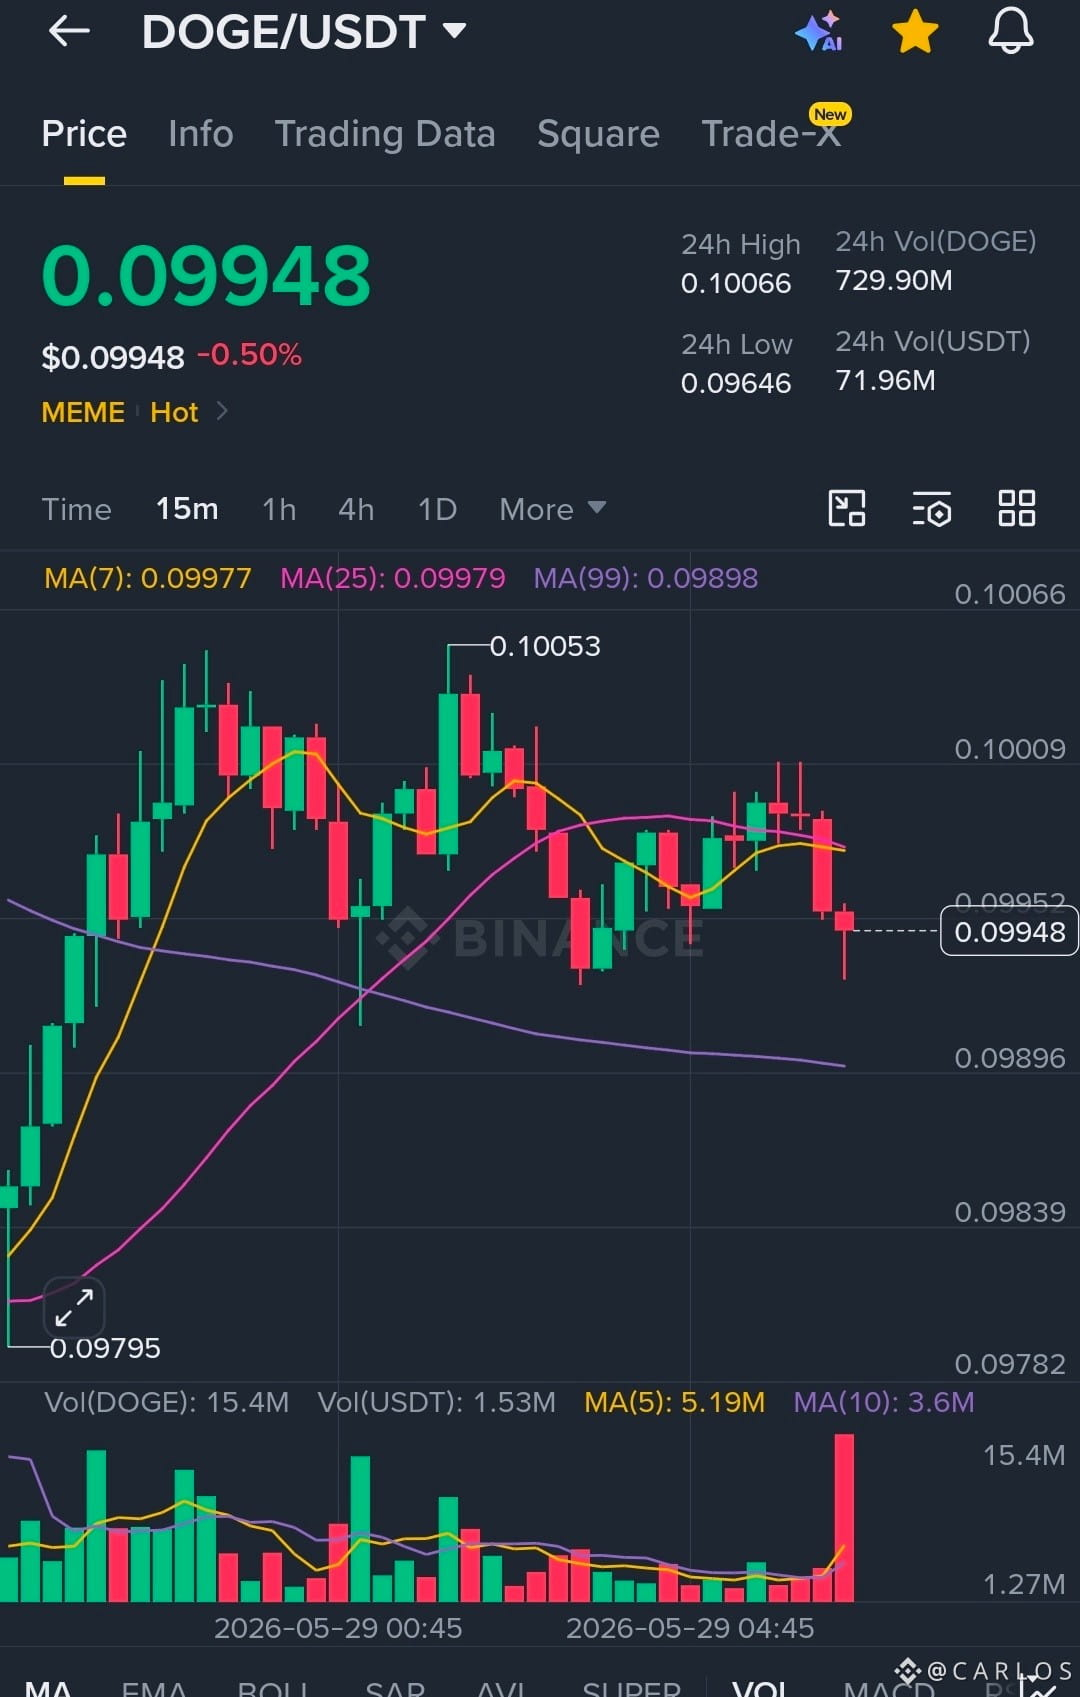
$DOGE is doing what DOGE does best — staying quiet just long enough to make everyone underestimate it.
The chart may look calm, but meme coins have a habit of turning whispers into chaos. One spark and the crowd comes running. 🚀⚡️
{spot}(DOGEUSDT)
#SolanaFuturesOIDown30Percent
#AaveProposesAssetListingFramework
#AIAgentsDisruptExchangeModel
#AsiaLeadsRegulatedCryptoAdoption
#NakamotoCrashes67PercentYTD
$DOGE is doing what DOGE does best — staying quiet just long enough to make everyone underestimate it.
The chart may look calm, but meme coins have a habit of turning whispers into chaos. One spark and the crowd comes running. 🚀⚡️
#SolanaFuturesOIDown30Percent
#AaveProposesAssetListingFramework
#AIAgentsDisruptExchangeModel
#AsiaLeadsRegulatedCryptoAdoption
#NakamotoCrashes67PercentYTD
The chart may look calm, but meme coins have a habit of turning whispers into chaos. One spark and the crowd comes running. 🚀⚡️
#SolanaFuturesOIDown30Percent
#AaveProposesAssetListingFramework
#AIAgentsDisruptExchangeModel
#AsiaLeadsRegulatedCryptoAdoption
#NakamotoCrashes67PercentYTD
194

·
--
$CHIP CHIP Market Latest Analysis 📊
🚀 CHIP Sector Update — May 2026
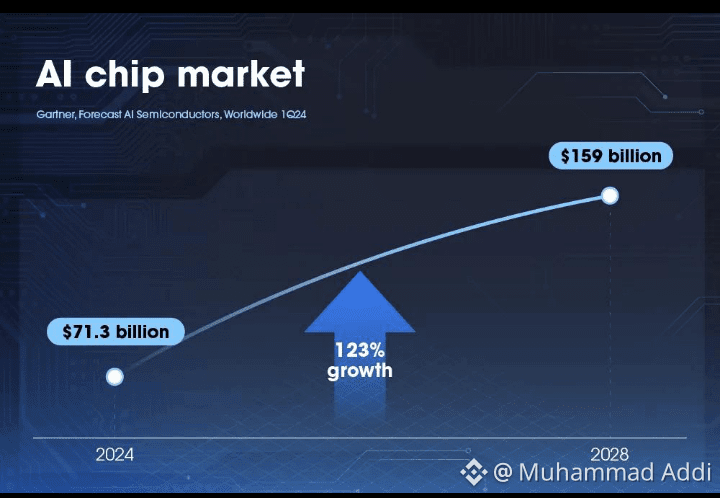
The semiconductor market remains one of the strongest sectors in 2026, driven by explosive AI demand and data-center expansion. Companies linked to AI infrastructure, memory chips, and networking solutions continue to outperform the broader market.
📈 Key Trends: • AI chip demand is still accelerating
• Memory and HBM chip shortages support higher prices
• Networking and custom AI silicon remain hot sectors
• Investors continue rotating into semiconductor leaders
⚠️ Short-Term View: After massive rallies earlier this year, some chip stocks may face temporary volatility and profit-taking. However, the long-term trend remains bullish as AI spending continues to grow globally.
💡 Outlook: As long as AI infrastructure spending stays strong, the chip sector could remain a market leader through 2026.
#AI #Semiconductors #CHIP #NVDA #AMD #AIStocks #TechStocks
Recent reports show AI-driven semiconductor demand is pushing the industry toward record revenue growth in 2026, especially in advanced memory, networking, and custom AI chips. �
Deloitte +2
{spot}(CHIPUSDT)
#SolanaFuturesOIDown30Percent #AaveProposesAssetListingFramework USIranStrikesSinkBitcoinBelow$73000#AIAgentsDisruptExchangeModel #AsiaLeadsRegulatedCryptoAdoption #AprilPCEInflationHits3.8Pct
$CHIP CHIP Market Latest Analysis 📊
🚀 CHIP Sector Update — May 2026
The semiconductor market remains one of the strongest sectors in 2026, driven by explosive AI demand and data-center expansion. Companies linked to AI infrastructure, memory chips, and networking solutions continue to outperform the broader market.
📈 Key Trends: • AI chip demand is still accelerating
• Memory and HBM chip shortages support higher prices
• Networking and custom AI silicon remain hot sectors
• Investors continue rotating into semiconductor leaders
⚠️ Short-Term View: After massive rallies earlier this year, some chip stocks may face temporary volatility and profit-taking. However, the long-term trend remains bullish as AI spending continues to grow globally.
💡 Outlook: As long as AI infrastructure spending stays strong, the chip sector could remain a market leader through 2026.
#AI #Semiconductors #CHIP #NVDA #AMD #AIStocks #TechStocks
Recent reports show AI-driven semiconductor demand is pushing the industry toward record revenue growth in 2026, especially in advanced memory, networking, and custom AI chips. �
Deloitte +2
#SolanaFuturesOIDown30Percent #AaveProposesAssetListingFramework USIranStrikesSinkBitcoinBelow$73000#AIAgentsDisruptExchangeModel #AsiaLeadsRegulatedCryptoAdoption #AprilPCEInflationHits3.8Pct
🚀 CHIP Sector Update — May 2026
The semiconductor market remains one of the strongest sectors in 2026, driven by explosive AI demand and data-center expansion. Companies linked to AI infrastructure, memory chips, and networking solutions continue to outperform the broader market.
📈 Key Trends: • AI chip demand is still accelerating
• Memory and HBM chip shortages support higher prices
• Networking and custom AI silicon remain hot sectors
• Investors continue rotating into semiconductor leaders
⚠️ Short-Term View: After massive rallies earlier this year, some chip stocks may face temporary volatility and profit-taking. However, the long-term trend remains bullish as AI spending continues to grow globally.
💡 Outlook: As long as AI infrastructure spending stays strong, the chip sector could remain a market leader through 2026.
#AI #Semiconductors #CHIP #NVDA #AMD #AIStocks #TechStocks
Recent reports show AI-driven semiconductor demand is pushing the industry toward record revenue growth in 2026, especially in advanced memory, networking, and custom AI chips. �
Deloitte +2
#SolanaFuturesOIDown30Percent #AaveProposesAssetListingFramework USIranStrikesSinkBitcoinBelow$73000#AIAgentsDisruptExchangeModel #AsiaLeadsRegulatedCryptoAdoption #AprilPCEInflationHits3.8Pct
350

·
--
$BNB #GoogleEngineerChargedForPolymarketBets StandardCharteredMaintainsEther$40000Target#AaveProposesAssetListingFramework
$BNB #GoogleEngineerChargedForPolymarketBets StandardCharteredMaintainsEther$40000Target#AaveProposesAssetListingFramework
29

·
--
Bullish
$ZEC saw an aggressive liquidation cascade into support, but price is reacting sharply from the $540 demand zone with strong absorption. Market structure remains bullish unless support breaks decisively.
Long $ZEC
Entry: $543 – $549
Stop Loss: $528
TP1: $565
TP2: $582
TP3: $605
The heavy long liquidation likely swept liquidity beneath local lows before buyers stepped back in. Price action now suggests a potential reversal as momentum stabilizes and volatility compresses. If bulls reclaim higher intraday resistance, continuation toward the next liquidity cluster becomes highly probable. The reaction from support shows institutions are still defending the trend.
Trade $ZEC here 👇
{future}(ZECUSDT)
#GoogleEngineerChargedForPolymarketBets #SolanaFuturesOIDown30Percent StandardCharteredMaintainsEther$40000Target#CFTCSuesRhodeIslandOverPredictionMarkets #AaveProposesAssetListingFramework
$ZEC saw an aggressive liquidation cascade into support, but price is reacting sharply from the $540 demand zone with strong absorption. Market structure remains bullish unless support breaks decisively.
Long $ZEC
Entry: $543 – $549
Stop Loss: $528
TP1: $565
TP2: $582
TP3: $605
The heavy long liquidation likely swept liquidity beneath local lows before buyers stepped back in. Price action now suggests a potential reversal as momentum stabilizes and volatility compresses. If bulls reclaim higher intraday resistance, continuation toward the next liquidity cluster becomes highly probable. The reaction from support shows institutions are still defending the trend.
Trade $ZEC here 👇
#GoogleEngineerChargedForPolymarketBets #SolanaFuturesOIDown30Percent StandardCharteredMaintainsEther$40000Target#CFTCSuesRhodeIslandOverPredictionMarkets #AaveProposesAssetListingFramework
Long $ZEC
Entry: $543 – $549
Stop Loss: $528
TP1: $565
TP2: $582
TP3: $605
The heavy long liquidation likely swept liquidity beneath local lows before buyers stepped back in. Price action now suggests a potential reversal as momentum stabilizes and volatility compresses. If bulls reclaim higher intraday resistance, continuation toward the next liquidity cluster becomes highly probable. The reaction from support shows institutions are still defending the trend.
Trade $ZEC here 👇
#GoogleEngineerChargedForPolymarketBets #SolanaFuturesOIDown30Percent StandardCharteredMaintainsEther$40000Target#CFTCSuesRhodeIslandOverPredictionMarkets #AaveProposesAssetListingFramework
125

·
--
One day I went back and reread about @GeniusOfficial and I suddenly thought: if it actually does what it claims, then most people are probably still looking at it the wrong way.
A lot of traders only focus on APY because that is the easiest number to market. High yield attracts attention quickly. But the more I spent time understanding how GENIUS is structured, the more I felt the interesting part may not be the yield itself. It may be the way the platform is trying to connect routing activity, execution flow and fee sharing into one system.
Most trading platforms today compete by throwing incentives at users for short periods. Liquidity moves around fast because people chase whichever pool offers the highest return that week. The problem is that this rarely creates long term alignment between traders, liquidity providers and the platform itself.
GENIUS feels like it is attempting something different. Instead of treating trading activity as isolated transactions, it seems to treat flow as an economic layer that can continuously generate value across the network. That changes how I look at fee sharing. It is not only about rewards. It is about whether the platform can build sustainable participation from actual trading behavior instead of temporary hype.
The routing side is what made me pay closer attention. In crypto, routing is usually invisible to most users even though it decides how efficiently trades move across liquidity sources. If GENIUS manages to optimize that layer while connecting it to shared economic incentives, then the protocol becomes more than just another interface with charts and leverage.
That is why I think people focusing only on APY may be missing the bigger picture. Yield can attract users for a while, but infrastructure that captures trading flow can create much deeper value over time.
#genius @GeniusOfficial $GENIUS
$BSB $QAIT
#BinanceSquareTalks
#Web3 #AI #AaveProposesAssetListingFramework
One day I went back and reread about @GeniusOfficial and I suddenly thought: if it actually does what it claims, then most people are probably still looking at it the wrong way.
A lot of traders only focus on APY because that is the easiest number to market. High yield attracts attention quickly. But the more I spent time understanding how GENIUS is structured, the more I felt the interesting part may not be the yield itself. It may be the way the platform is trying to connect routing activity, execution flow and fee sharing into one system.
Most trading platforms today compete by throwing incentives at users for short periods. Liquidity moves around fast because people chase whichever pool offers the highest return that week. The problem is that this rarely creates long term alignment between traders, liquidity providers and the platform itself.
GENIUS feels like it is attempting something different. Instead of treating trading activity as isolated transactions, it seems to treat flow as an economic layer that can continuously generate value across the network. That changes how I look at fee sharing. It is not only about rewards. It is about whether the platform can build sustainable participation from actual trading behavior instead of temporary hype.
The routing side is what made me pay closer attention. In crypto, routing is usually invisible to most users even though it decides how efficiently trades move across liquidity sources. If GENIUS manages to optimize that layer while connecting it to shared economic incentives, then the protocol becomes more than just another interface with charts and leverage.
That is why I think people focusing only on APY may be missing the bigger picture. Yield can attract users for a while, but infrastructure that captures trading flow can create much deeper value over time.
#genius @GeniusOfficial $GENIUS
$BSB $QAIT
#BinanceSquareTalks
#Web3 #AI #AaveProposesAssetListingFramework
A lot of traders only focus on APY because that is the easiest number to market. High yield attracts attention quickly. But the more I spent time understanding how GENIUS is structured, the more I felt the interesting part may not be the yield itself. It may be the way the platform is trying to connect routing activity, execution flow and fee sharing into one system.
Most trading platforms today compete by throwing incentives at users for short periods. Liquidity moves around fast because people chase whichever pool offers the highest return that week. The problem is that this rarely creates long term alignment between traders, liquidity providers and the platform itself.
GENIUS feels like it is attempting something different. Instead of treating trading activity as isolated transactions, it seems to treat flow as an economic layer that can continuously generate value across the network. That changes how I look at fee sharing. It is not only about rewards. It is about whether the platform can build sustainable participation from actual trading behavior instead of temporary hype.
The routing side is what made me pay closer attention. In crypto, routing is usually invisible to most users even though it decides how efficiently trades move across liquidity sources. If GENIUS manages to optimize that layer while connecting it to shared economic incentives, then the protocol becomes more than just another interface with charts and leverage.
That is why I think people focusing only on APY may be missing the bigger picture. Yield can attract users for a while, but infrastructure that captures trading flow can create much deeper value over time.
#genius @GeniusOfficial $GENIUS
$BSB $QAIT
#BinanceSquareTalks
#Web3 #AI #AaveProposesAssetListingFramework
BULLISH 🍏🍏🍏
78%
BEARISH 🍎🍎🍎
22%
27 votes • Voting closed
36
1
31
1.3k

·
--
Bullish
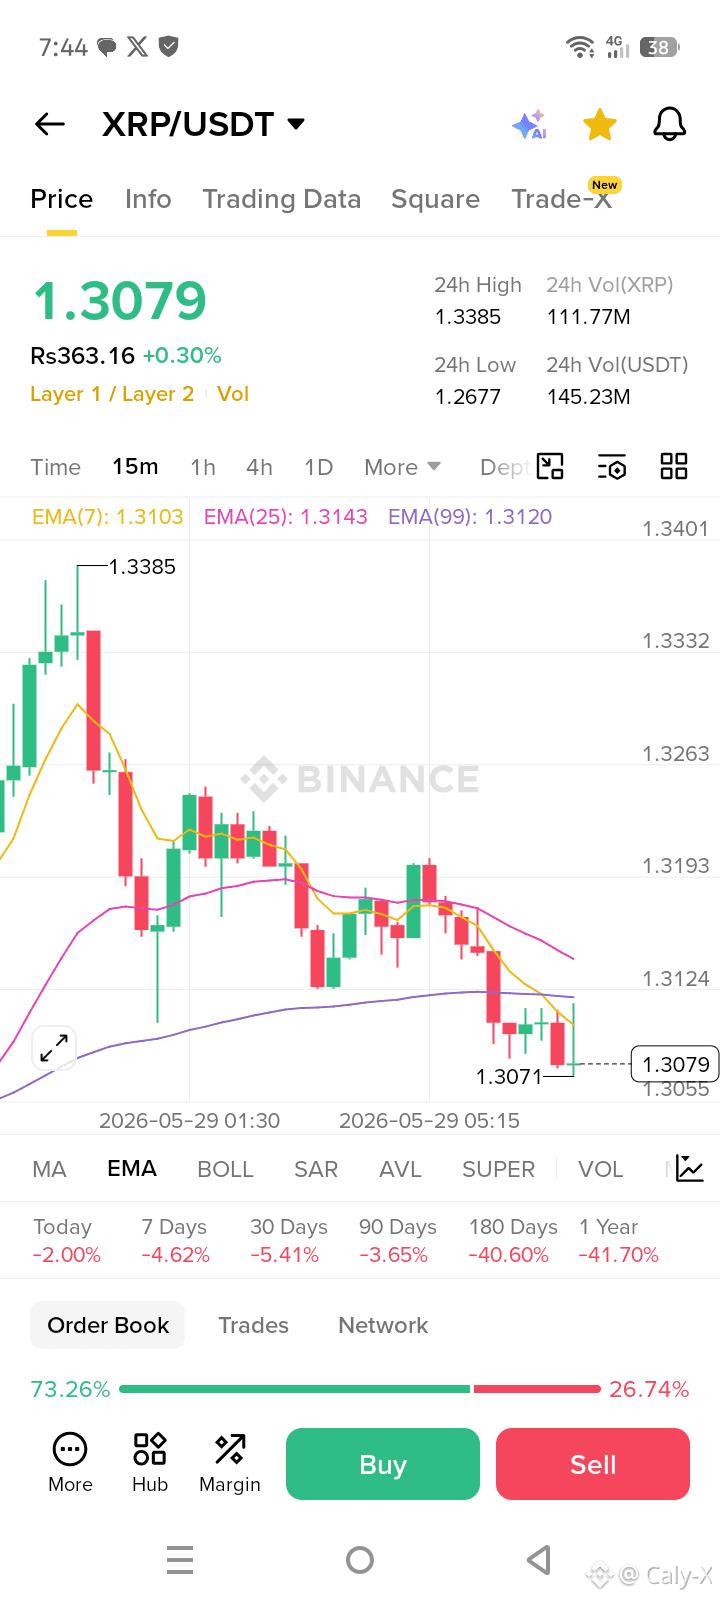
$XRP /USDT on the 15m timeframe is showing short-term bearish pressure right now.
Main observations:
Price is trading below EMA(25) and slightly below EMA(99), which weakens momentum.
EMA(7) is also under EMA(25), confirming short-term downside control.
The chart structure has lower highs and lower lows after rejection from 1.3385.
Buyers defended the 1.3070 area multiple times, so this is an important short-term support zone.
Key levels:
Support: 1.3070 → 1.3050
Stronger support: around 1.3000
Resistance: 1.3120 → 1.3145
Major resistance: 1.3190
The small green candles near the bottom suggest buyers are trying to stabilize price, but there is still no strong reversal confirmation yet.
Possible scenarios:
If XRP reclaims and closes above EMA(25) near 1.3140, a bounce toward 1.3190 is possible.
If 1.3070 breaks with volume, price could quickly move toward 1.3000.
Current momentum:
Short-term: bearish
Medium-term: neutral to weak
Scalping zone: waiting for breakout confirmation
The chart currently looks more like a cooling phase after a sharp rejection rather than a confirmed trend reversal upward.
{spot}(XRPUSDT)
#SolanaFuturesOIDown30Percent #GoogleEngineerChargedForPolymarketBets #ICEExploresHyperliquidCollaboration #CFTCSuesRhodeIslandOverPredictionMarkets #AaveProposesAssetListingFramework
$XRP /USDT on the 15m timeframe is showing short-term bearish pressure right now.
Main observations:
Price is trading below EMA(25) and slightly below EMA(99), which weakens momentum.
EMA(7) is also under EMA(25), confirming short-term downside control.
The chart structure has lower highs and lower lows after rejection from 1.3385.
Buyers defended the 1.3070 area multiple times, so this is an important short-term support zone.
Key levels:
Support: 1.3070 → 1.3050
Stronger support: around 1.3000
Resistance: 1.3120 → 1.3145
Major resistance: 1.3190
The small green candles near the bottom suggest buyers are trying to stabilize price, but there is still no strong reversal confirmation yet.
Possible scenarios:
If XRP reclaims and closes above EMA(25) near 1.3140, a bounce toward 1.3190 is possible.
If 1.3070 breaks with volume, price could quickly move toward 1.3000.
Current momentum:
Short-term: bearish
Medium-term: neutral to weak
Scalping zone: waiting for breakout confirmation
The chart currently looks more like a cooling phase after a sharp rejection rather than a confirmed trend reversal upward.
#SolanaFuturesOIDown30Percent #GoogleEngineerChargedForPolymarketBets #ICEExploresHyperliquidCollaboration #CFTCSuesRhodeIslandOverPredictionMarkets #AaveProposesAssetListingFramework
Main observations:
Price is trading below EMA(25) and slightly below EMA(99), which weakens momentum.
EMA(7) is also under EMA(25), confirming short-term downside control.
The chart structure has lower highs and lower lows after rejection from 1.3385.
Buyers defended the 1.3070 area multiple times, so this is an important short-term support zone.
Key levels:
Support: 1.3070 → 1.3050
Stronger support: around 1.3000
Resistance: 1.3120 → 1.3145
Major resistance: 1.3190
The small green candles near the bottom suggest buyers are trying to stabilize price, but there is still no strong reversal confirmation yet.
Possible scenarios:
If XRP reclaims and closes above EMA(25) near 1.3140, a bounce toward 1.3190 is possible.
If 1.3070 breaks with volume, price could quickly move toward 1.3000.
Current momentum:
Short-term: bearish
Medium-term: neutral to weak
Scalping zone: waiting for breakout confirmation
The chart currently looks more like a cooling phase after a sharp rejection rather than a confirmed trend reversal upward.
#SolanaFuturesOIDown30Percent #GoogleEngineerChargedForPolymarketBets #ICEExploresHyperliquidCollaboration #CFTCSuesRhodeIslandOverPredictionMarkets #AaveProposesAssetListingFramework
122

Cardano is the MOST undervalued top-10 coin in the entire market! ADA holders, your patience is about to PAY OFF! 💰
$ADA
{spot}(ADAUSDT)
🔬 Built on peer-reviewed research. Most decentralized PoS network. Hydra scaling = MILLIONS of TPS possible.
🌍 Real-world use cases in Africa, healthcare, government identity systems.
📊 ADA chart is compressing. Compression = EXPLOSION incoming. Watch the weekly closely!
Slow and steady wins the race. Cardano is built to LAST. 🏆
#ADA #Cardano #IOHK #Bullish #LongTermHODL #BinanceSquare #SolanaFuturesOIDown30Percent #GoogleEngineerChargedForPolymarketBets #ICEExploresHyperliquidCollaboration StandardCharteredMaintainsEther$40000Target#AaveProposesAssetListingFramework
Cardano is the MOST undervalued top-10 coin in the entire market! ADA holders, your patience is about to PAY OFF! 💰
$ADA
🔬 Built on peer-reviewed research. Most decentralized PoS network. Hydra scaling = MILLIONS of TPS possible.
🌍 Real-world use cases in Africa, healthcare, government identity systems.
📊 ADA chart is compressing. Compression = EXPLOSION incoming. Watch the weekly closely!
Slow and steady wins the race. Cardano is built to LAST. 🏆
#ADA #Cardano #IOHK #Bullish #LongTermHODL #BinanceSquare #SolanaFuturesOIDown30Percent #GoogleEngineerChargedForPolymarketBets #ICEExploresHyperliquidCollaboration StandardCharteredMaintainsEther$40000Target#AaveProposesAssetListingFramework
$ADA
🔬 Built on peer-reviewed research. Most decentralized PoS network. Hydra scaling = MILLIONS of TPS possible.
🌍 Real-world use cases in Africa, healthcare, government identity systems.
📊 ADA chart is compressing. Compression = EXPLOSION incoming. Watch the weekly closely!
Slow and steady wins the race. Cardano is built to LAST. 🏆
#ADA #Cardano #IOHK #Bullish #LongTermHODL #BinanceSquare #SolanaFuturesOIDown30Percent #GoogleEngineerChargedForPolymarketBets #ICEExploresHyperliquidCollaboration StandardCharteredMaintainsEther$40000Target#AaveProposesAssetListingFramework
117

·
--
Bearish
$PIPPIN USDT - Trade Setup
SHORT SCENARIO (Win Rate: 86.5%)
Entry: 0.018876 – 0.019068
SL: 0.019891
TP: 0.018283 / 0.017823 / 0.017134
Click here to Trade 👇️
$PIPPIN
{alpha}(CT_501Dfh5DzRgSvvCFDoYc2ciTkMrbDfRKybA4SoFbPmApump)
#AaveProposesAssetListingFramework #AprilPCEInflationHits3.8Pct #NakamotoCrashes67PercentYTD #writetoearn
$PIPPIN USDT - Trade Setup
SHORT SCENARIO (Win Rate: 86.5%)
Entry: 0.018876 – 0.019068
SL: 0.019891
TP: 0.018283 / 0.017823 / 0.017134
Click here to Trade 👇️
$PIPPIN
#AaveProposesAssetListingFramework #AprilPCEInflationHits3.8Pct #NakamotoCrashes67PercentYTD #writetoearn
SHORT SCENARIO (Win Rate: 86.5%)
Entry: 0.018876 – 0.019068
SL: 0.019891
TP: 0.018283 / 0.017823 / 0.017134
Click here to Trade 👇️
$PIPPIN
#AaveProposesAssetListingFramework #AprilPCEInflationHits3.8Pct #NakamotoCrashes67PercentYTD #writetoearn
175
·
--
Bullish
$SEI
Entry: $0.06690 - $0.06740
Stop Loss: $0.06860
TP1: $0.06580
TP2: $0.06490
TP3: $0.06370
SEI swept downside liquidity and failed to reclaim the broken support zone, showing weak buyer commitment. The rejection from local resistance confirms bearish continuation pressure while momentum remains tilted to the downside. Price is consolidating below the VWAP region with fading recovery attempts, which often leads to another impulsive move lower. If volume increases on breakdown, expect liquidations to accelerate toward lower demand levels.
Trade $SEI here 👇
{future}(SEIUSDT)
#AaveProposesAssetListingFramework StandardCharteredMaintainsEther$40000Target#GoogleEngineerChargedForPolymarketBets #SolanaFuturesOIDown30Percent #AsiaLeadsRegulatedCryptoAdoption #AIAgentsDisruptExchangeModel
$SEI
Entry: $0.06690 - $0.06740
Stop Loss: $0.06860
TP1: $0.06580
TP2: $0.06490
TP3: $0.06370
SEI swept downside liquidity and failed to reclaim the broken support zone, showing weak buyer commitment. The rejection from local resistance confirms bearish continuation pressure while momentum remains tilted to the downside. Price is consolidating below the VWAP region with fading recovery attempts, which often leads to another impulsive move lower. If volume increases on breakdown, expect liquidations to accelerate toward lower demand levels.
Trade $SEI here 👇
#AaveProposesAssetListingFramework StandardCharteredMaintainsEther$40000Target#GoogleEngineerChargedForPolymarketBets #SolanaFuturesOIDown30Percent #AsiaLeadsRegulatedCryptoAdoption #AIAgentsDisruptExchangeModel
Entry: $0.06690 - $0.06740
Stop Loss: $0.06860
TP1: $0.06580
TP2: $0.06490
TP3: $0.06370
SEI swept downside liquidity and failed to reclaim the broken support zone, showing weak buyer commitment. The rejection from local resistance confirms bearish continuation pressure while momentum remains tilted to the downside. Price is consolidating below the VWAP region with fading recovery attempts, which often leads to another impulsive move lower. If volume increases on breakdown, expect liquidations to accelerate toward lower demand levels.
Trade $SEI here 👇
#AaveProposesAssetListingFramework StandardCharteredMaintainsEther$40000Target#GoogleEngineerChargedForPolymarketBets #SolanaFuturesOIDown30Percent #AsiaLeadsRegulatedCryptoAdoption #AIAgentsDisruptExchangeModel
226

·
--
Bullish
#AaveProposesAssetListingFramework
$SOL
{future}(SOLUSDT)
Tweet 1/4 🧵
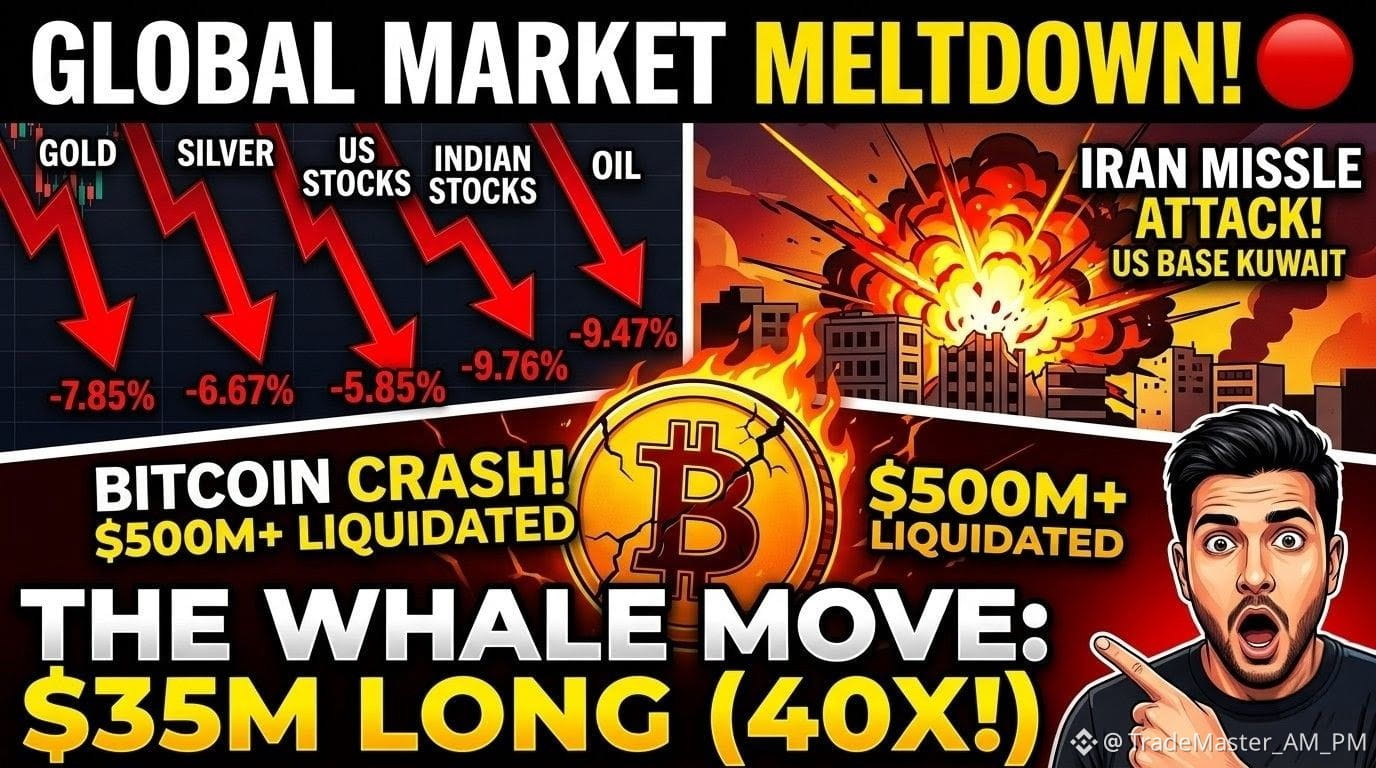
The markets are bleeding. Gold, silver, US stocks, Indian stocks, and even Bitcoin—EVERYTHING is crashing simultaneously. 📉
This isn’t a normal correction. History is being made right now, and the reason behind it is terrifying.
Here is what’s actually happening 👇
Tweet 2/4
💥 The Catalyst: Geopolitical tensions have exploded. Iran reportedly launched major missile attacks on a US military base in Kuwait, signaling a massive escalation in the Middle East.
When war drums beat, the markets panic. Capital is fleeing risky assets at lightning speed.
Tweet 3/4
📉 The Crypto Bloodbath:
Bitcoin plummeted hard, dumping below $75k in just one hour. Over $500 MILLION worth of trader longs got completely liquidated. Absolute forced capitulation.
But here’s the crazy part: BlackRock clients sold $527M in BTC days before this happened. Did they know something we didn't? 🤔
$BTC
{future}(BTCUSDT)
Tweet 4/4
🐋 The Silver Lining:
While retail panics, the whales are moving. An unknown whale just opened a massive $35.6 Million LONG position on Bitcoin with 40x leverage!
Are we at the bottom, or is this a legendary liquidation trap? What are you doing with your portfolio right now? Buying the dip or holding cash? 👇 #Binance #bullish
#AaveProposesAssetListingFramework
$SOL
Tweet 1/4 🧵
The markets are bleeding. Gold, silver, US stocks, Indian stocks, and even Bitcoin—EVERYTHING is crashing simultaneously. 📉
This isn’t a normal correction. History is being made right now, and the reason behind it is terrifying.
Here is what’s actually happening 👇
Tweet 2/4
💥 The Catalyst: Geopolitical tensions have exploded. Iran reportedly launched major missile attacks on a US military base in Kuwait, signaling a massive escalation in the Middle East.
When war drums beat, the markets panic. Capital is fleeing risky assets at lightning speed.
Tweet 3/4
📉 The Crypto Bloodbath:
Bitcoin plummeted hard, dumping below $75k in just one hour. Over $500 MILLION worth of trader longs got completely liquidated. Absolute forced capitulation.
But here’s the crazy part: BlackRock clients sold $527M in BTC days before this happened. Did they know something we didn't? 🤔
$BTC
Tweet 4/4
🐋 The Silver Lining:
While retail panics, the whales are moving. An unknown whale just opened a massive $35.6 Million LONG position on Bitcoin with 40x leverage!
Are we at the bottom, or is this a legendary liquidation trap? What are you doing with your portfolio right now? Buying the dip or holding cash? 👇 #Binance #bullish
$SOL
Tweet 1/4 🧵
The markets are bleeding. Gold, silver, US stocks, Indian stocks, and even Bitcoin—EVERYTHING is crashing simultaneously. 📉
This isn’t a normal correction. History is being made right now, and the reason behind it is terrifying.
Here is what’s actually happening 👇
Tweet 2/4
💥 The Catalyst: Geopolitical tensions have exploded. Iran reportedly launched major missile attacks on a US military base in Kuwait, signaling a massive escalation in the Middle East.
When war drums beat, the markets panic. Capital is fleeing risky assets at lightning speed.
Tweet 3/4
📉 The Crypto Bloodbath:
Bitcoin plummeted hard, dumping below $75k in just one hour. Over $500 MILLION worth of trader longs got completely liquidated. Absolute forced capitulation.
But here’s the crazy part: BlackRock clients sold $527M in BTC days before this happened. Did they know something we didn't? 🤔
$BTC
Tweet 4/4
🐋 The Silver Lining:
While retail panics, the whales are moving. An unknown whale just opened a massive $35.6 Million LONG position on Bitcoin with 40x leverage!
Are we at the bottom, or is this a legendary liquidation trap? What are you doing with your portfolio right now? Buying the dip or holding cash? 👇 #Binance #bullish
1
205

·
--
Bullish
$PRL
{alpha}(560xd20fb09a49a8e75fef536a2dbc68222900287bac)
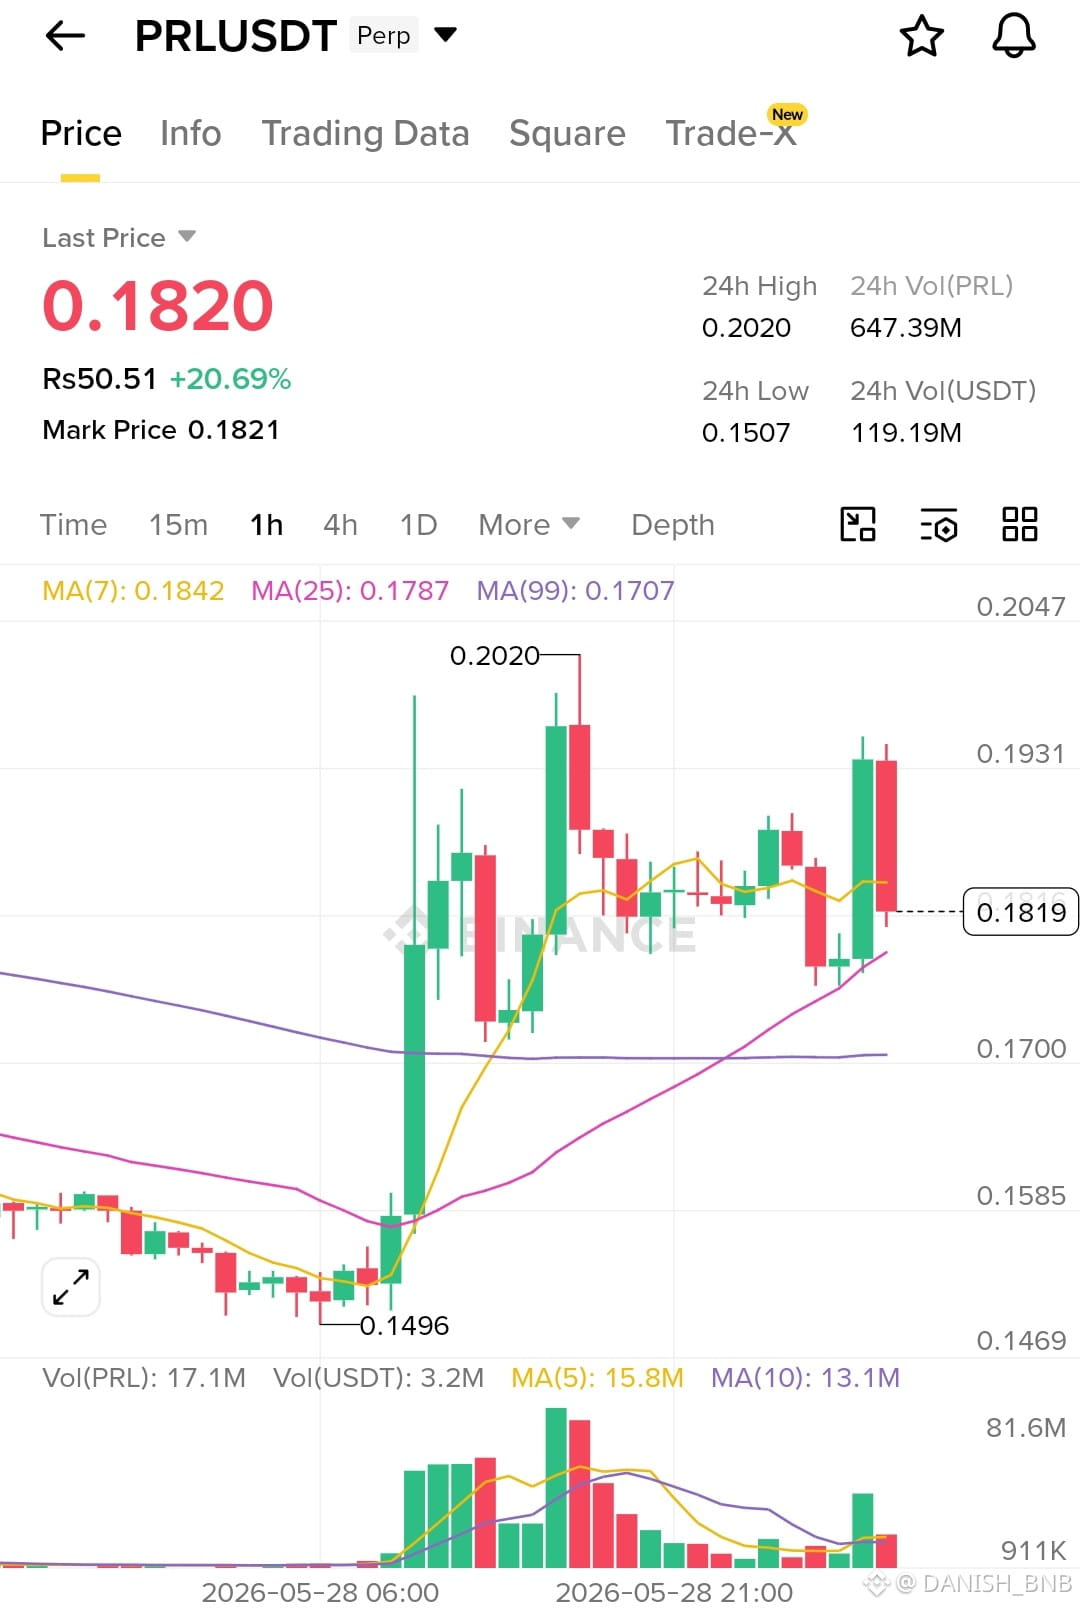
USDT is loading again after a strong breakout and healthy pullback. Price is holding above key moving averages, and if bulls defend this zone, another push toward the highs looks live.
Trade Setup
EP: 0.1800 - 0.1825
TP1: 0.1930
TP2: 0.2020
TP3: 0.2047
SL: 0.1705
#SolanaFuturesOIDown30Percent
#AaveProposesAssetListingFramework
#AIAgentsDisruptExchangeModel
$PRL
USDT is loading again after a strong breakout and healthy pullback. Price is holding above key moving averages, and if bulls defend this zone, another push toward the highs looks live.
Trade Setup
EP: 0.1800 - 0.1825
TP1: 0.1930
TP2: 0.2020
TP3: 0.2047
SL: 0.1705
#SolanaFuturesOIDown30Percent
#AaveProposesAssetListingFramework
#AIAgentsDisruptExchangeModel
USDT is loading again after a strong breakout and healthy pullback. Price is holding above key moving averages, and if bulls defend this zone, another push toward the highs looks live.
Trade Setup
EP: 0.1800 - 0.1825
TP1: 0.1930
TP2: 0.2020
TP3: 0.2047
SL: 0.1705
#SolanaFuturesOIDown30Percent
#AaveProposesAssetListingFramework
#AIAgentsDisruptExchangeModel
218
·
--
Bullish
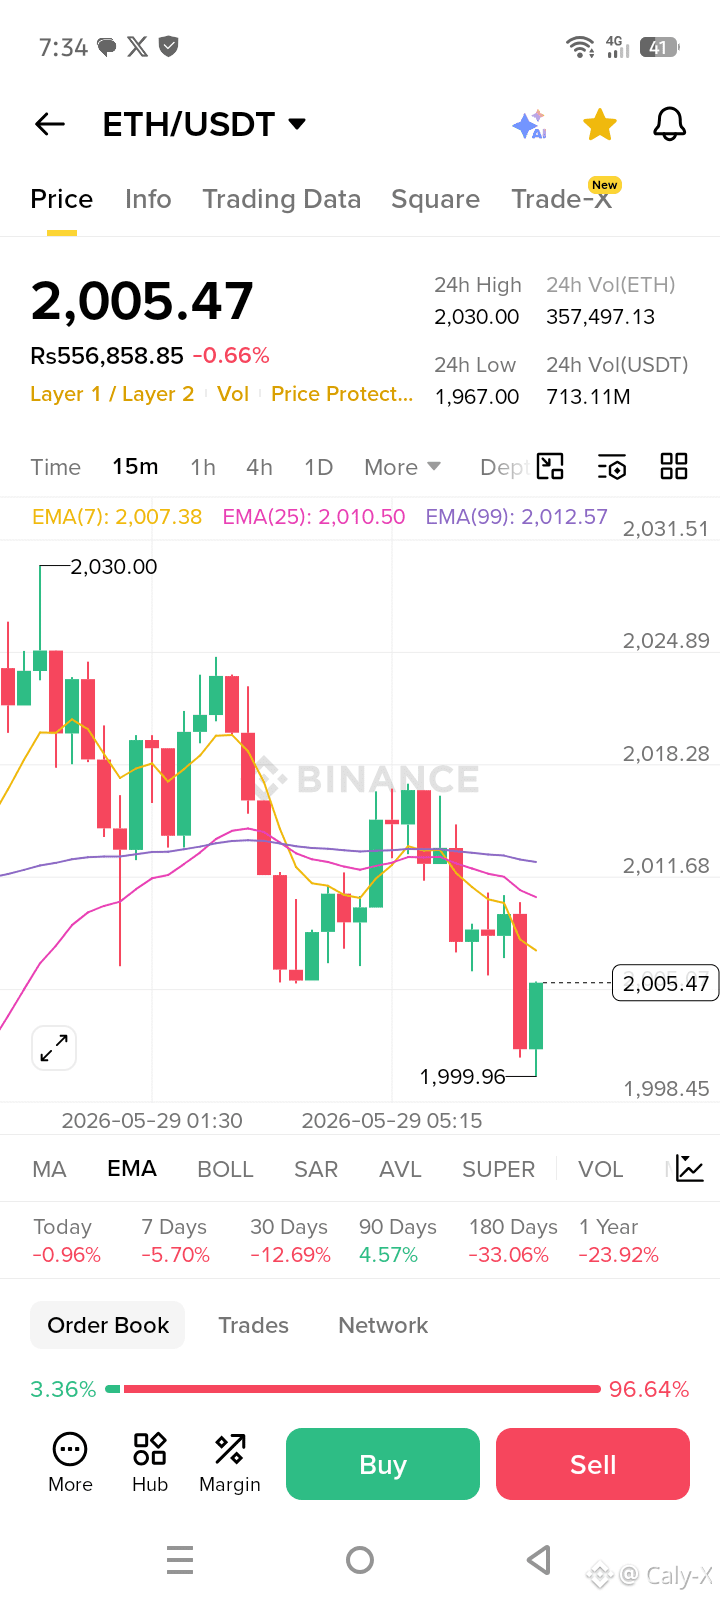
$ETH is showing the same short-term weakness as BTC and BNB on the 15m chart.
Current structure:
EMA 7 = 2007
EMA 25 = 2010
EMA 99 = 2012
Price is trading under all key EMAs, which keeps the short-term trend bearish.
What stands out:
Strong rejection from the 2030 area
Continuous lower highs after the rejection
Sharp sell candle pushed ETH below psychological 2000 briefly
Small recovery candle appeared from 1999.96 support
Important support zones:
2000–1995 immediate support
If sellers continue, next downside area could be 1985–1970
Resistance levels:
2008–2012 first recovery zone
2018–2025 stronger resistance if momentum returns
Market structure right now:
Sellers still have control
Recovery attempts are weak
Momentum remains soft unless ETH reclaims EMA 25 and EMA 99
Key level being defended now:
If ETH stabilizes above that level, a short bounce is possible.
If 2000 breaks cleanly with volume, downside continuation becomes more likely.
{spot}(ETHUSDT)
#SolanaFuturesOIDown30Percent #GoogleEngineerChargedForPolymarketBets #ICEExploresHyperliquidCollaboration #CFTCSuesRhodeIslandOverPredictionMarkets #AaveProposesAssetListingFramework
$ETH is showing the same short-term weakness as BTC and BNB on the 15m chart.
Current structure:
EMA 7 = 2007
EMA 25 = 2010
EMA 99 = 2012
Price is trading under all key EMAs, which keeps the short-term trend bearish.
What stands out:
Strong rejection from the 2030 area
Continuous lower highs after the rejection
Sharp sell candle pushed ETH below psychological 2000 briefly
Small recovery candle appeared from 1999.96 support
Important support zones:
2000–1995 immediate support
If sellers continue, next downside area could be 1985–1970
Resistance levels:
2008–2012 first recovery zone
2018–2025 stronger resistance if momentum returns
Market structure right now:
Sellers still have control
Recovery attempts are weak
Momentum remains soft unless ETH reclaims EMA 25 and EMA 99
Key level being defended now:
If ETH stabilizes above that level, a short bounce is possible.
If 2000 breaks cleanly with volume, downside continuation becomes more likely.
#SolanaFuturesOIDown30Percent #GoogleEngineerChargedForPolymarketBets #ICEExploresHyperliquidCollaboration #CFTCSuesRhodeIslandOverPredictionMarkets #AaveProposesAssetListingFramework
Current structure:
EMA 7 = 2007
EMA 25 = 2010
EMA 99 = 2012
Price is trading under all key EMAs, which keeps the short-term trend bearish.
What stands out:
Strong rejection from the 2030 area
Continuous lower highs after the rejection
Sharp sell candle pushed ETH below psychological 2000 briefly
Small recovery candle appeared from 1999.96 support
Important support zones:
2000–1995 immediate support
If sellers continue, next downside area could be 1985–1970
Resistance levels:
2008–2012 first recovery zone
2018–2025 stronger resistance if momentum returns
Market structure right now:
Sellers still have control
Recovery attempts are weak
Momentum remains soft unless ETH reclaims EMA 25 and EMA 99
Key level being defended now:
If ETH stabilizes above that level, a short bounce is possible.
If 2000 breaks cleanly with volume, downside continuation becomes more likely.
#SolanaFuturesOIDown30Percent #GoogleEngineerChargedForPolymarketBets #ICEExploresHyperliquidCollaboration #CFTCSuesRhodeIslandOverPredictionMarkets #AaveProposesAssetListingFramework
79
·
--
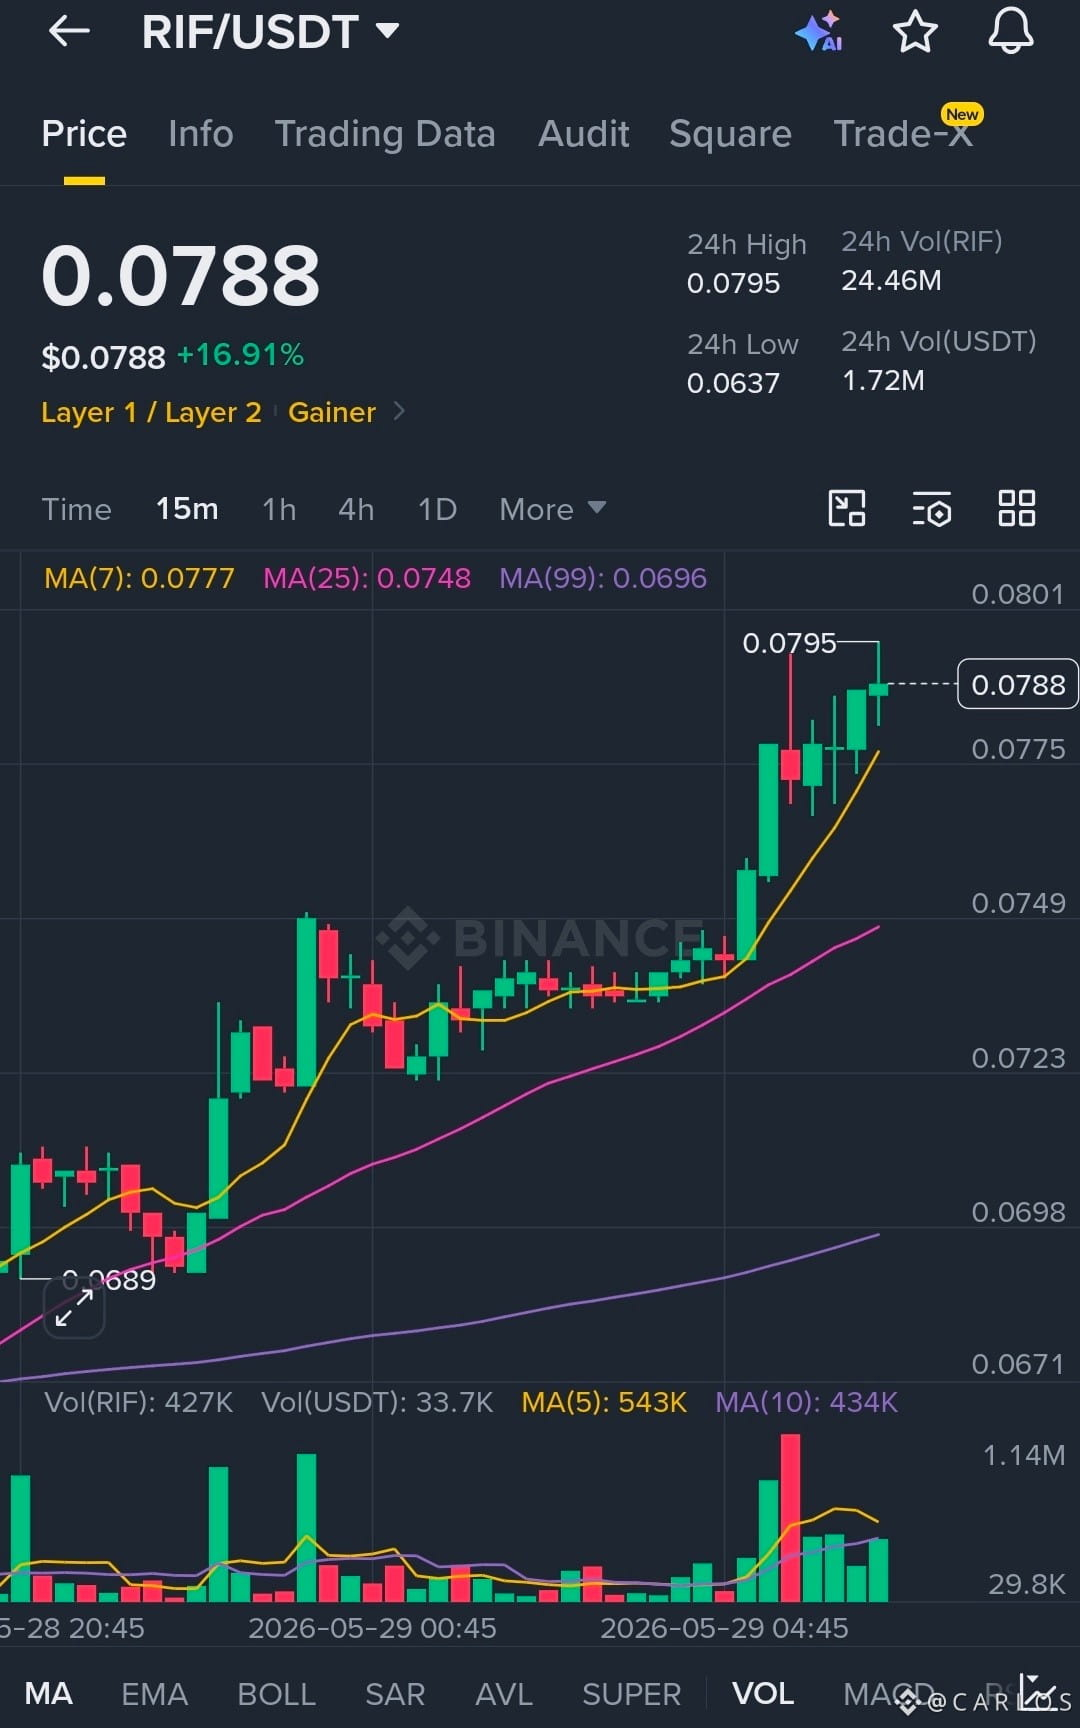
$RIF isn’t knocking on the door anymore — it’s kicking it open.Strong momentum, rising volume, and fresh highs are putting this move on everyone’s radar. If the energy holds, things could get very interesting from here. ⚡️👀
{spot}(RIFUSDT)
#SolanaFuturesOIDown30Percent
#AaveProposesAssetListingFramework
#AIAgentsDisruptExchangeModel
#AsiaLeadsRegulatedCryptoAdoption
#AprilPCEInflationHits3.8Pct
$RIF isn’t knocking on the door anymore — it’s kicking it open.Strong momentum, rising volume, and fresh highs are putting this move on everyone’s radar. If the energy holds, things could get very interesting from here. ⚡️👀
#SolanaFuturesOIDown30Percent
#AaveProposesAssetListingFramework
#AIAgentsDisruptExchangeModel
#AsiaLeadsRegulatedCryptoAdoption
#AprilPCEInflationHits3.8Pct
#SolanaFuturesOIDown30Percent
#AaveProposesAssetListingFramework
#AIAgentsDisruptExchangeModel
#AsiaLeadsRegulatedCryptoAdoption
#AprilPCEInflationHits3.8Pct
1
109

$GUA
{alpha}(560xa5c8e1513b6a08334b479fe4d71f1253259469be)
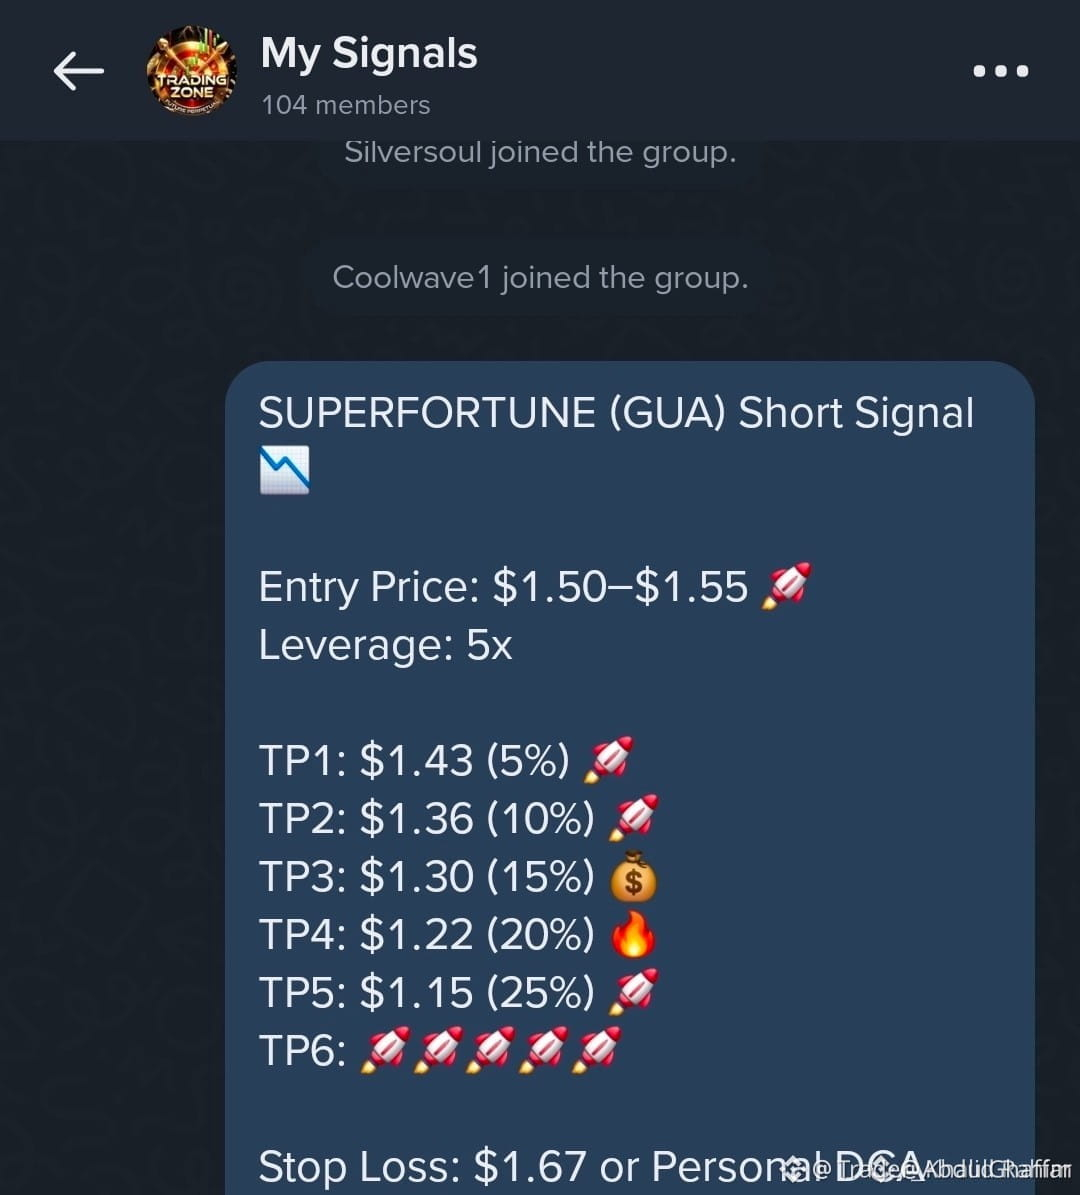
#SolanaFuturesOIDown30Percent #AaveProposesAssetListingFramework USIranStrikesSinkBitcoinBelow$73000#AIAgentsDisruptExchangeModel #AsiaLeadsRegulatedCryptoAdoption #AprilPCEInflationHits3.8Pct GUA is showing signs of accumulation after recent sideways movement, and traders are closely watching for a breakout confirmation. Volume activity has started increasing, which could signal fresh interest from short-term investors.
📈 Key Price Zones:
• Support Area: $0.008 – $0.010
• Resistance Area: $0.015 – $0.018
• Bullish Target: $0.025+ if momentum accelerates
Technical indicators suggest buyers are slowly regaining control, while overall altcoin sentiment is improving across the market. If BTC dominance drops, smaller-cap coins like GUA could see fast upside moves.
⚠️ A breakout above resistance may create strong hype and rapid volatility, so proper risk management is important.
$GUA
#SolanaFuturesOIDown30Percent #AaveProposesAssetListingFramework USIranStrikesSinkBitcoinBelow$73000#AIAgentsDisruptExchangeModel #AsiaLeadsRegulatedCryptoAdoption #AprilPCEInflationHits3.8Pct GUA is showing signs of accumulation after recent sideways movement, and traders are closely watching for a breakout confirmation. Volume activity has started increasing, which could signal fresh interest from short-term investors.
📈 Key Price Zones:
• Support Area: $0.008 – $0.010
• Resistance Area: $0.015 – $0.018
• Bullish Target: $0.025+ if momentum accelerates
Technical indicators suggest buyers are slowly regaining control, while overall altcoin sentiment is improving across the market. If BTC dominance drops, smaller-cap coins like GUA could see fast upside moves.
⚠️ A breakout above resistance may create strong hype and rapid volatility, so proper risk management is important.
#SolanaFuturesOIDown30Percent #AaveProposesAssetListingFramework USIranStrikesSinkBitcoinBelow$73000#AIAgentsDisruptExchangeModel #AsiaLeadsRegulatedCryptoAdoption #AprilPCEInflationHits3.8Pct GUA is showing signs of accumulation after recent sideways movement, and traders are closely watching for a breakout confirmation. Volume activity has started increasing, which could signal fresh interest from short-term investors.
📈 Key Price Zones:
• Support Area: $0.008 – $0.010
• Resistance Area: $0.015 – $0.018
• Bullish Target: $0.025+ if momentum accelerates
Technical indicators suggest buyers are slowly regaining control, while overall altcoin sentiment is improving across the market. If BTC dominance drops, smaller-cap coins like GUA could see fast upside moves.
⚠️ A breakout above resistance may create strong hype and rapid volatility, so proper risk management is important.
160


·
--
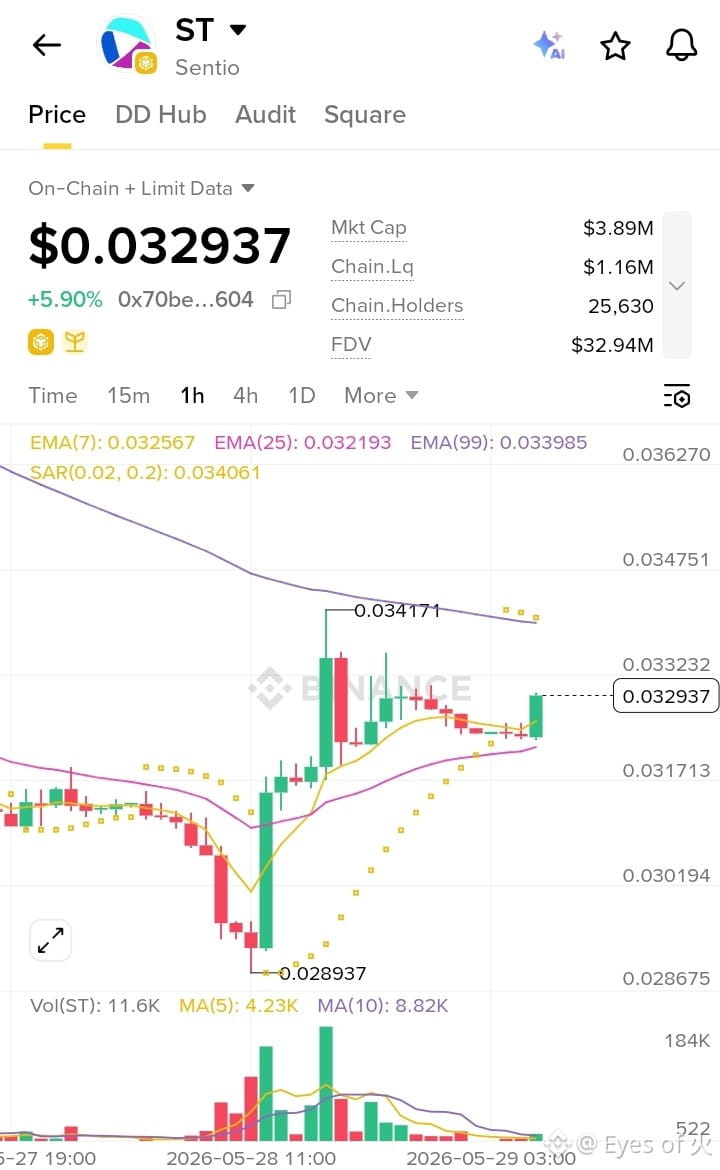
$ST is showing a much calmer structure compared to the aggressive volatility seen across smaller caps lately. After bouncing strongly from the 0.028 zone, price managed to reclaim momentum and slowly build higher lows on the 1H chart. 📈
What stands out is the steady recovery instead of a single unsustainable spike. Buyers appear more controlled here, while volume expansion during the rebound hints at renewed interest entering gradually.
The key level now sits near recent resistance around 0.034. If momentum keeps building and volume follows, this setup could transition from recovery mode into a stronger trend continuation phase. 🚀
#SolanaFuturesOIDown30Percent #AaveProposesAssetListingFramework #PaxosSubsidiarySECBlockchainClearingApproval #AsiaLeadsRegulatedCryptoAdoption #AprilPCEInflationHits3.8Pct
$ST is showing a much calmer structure compared to the aggressive volatility seen across smaller caps lately. After bouncing strongly from the 0.028 zone, price managed to reclaim momentum and slowly build higher lows on the 1H chart. 📈
What stands out is the steady recovery instead of a single unsustainable spike. Buyers appear more controlled here, while volume expansion during the rebound hints at renewed interest entering gradually.
The key level now sits near recent resistance around 0.034. If momentum keeps building and volume follows, this setup could transition from recovery mode into a stronger trend continuation phase. 🚀
#SolanaFuturesOIDown30Percent #AaveProposesAssetListingFramework #PaxosSubsidiarySECBlockchainClearingApproval #AsiaLeadsRegulatedCryptoAdoption #AprilPCEInflationHits3.8Pct
What stands out is the steady recovery instead of a single unsustainable spike. Buyers appear more controlled here, while volume expansion during the rebound hints at renewed interest entering gradually.
The key level now sits near recent resistance around 0.034. If momentum keeps building and volume follows, this setup could transition from recovery mode into a stronger trend continuation phase. 🚀
#SolanaFuturesOIDown30Percent #AaveProposesAssetListingFramework #PaxosSubsidiarySECBlockchainClearingApproval #AsiaLeadsRegulatedCryptoAdoption #AprilPCEInflationHits3.8Pct
1
730

·
--
Bullish
Trade Idea $MEME
{spot}(MEMEUSDT)
Trede now👆👆👆👆👆👆👆👆👆
Entry Point: 0.4330 – 0.4350
Target 1: 0.4410
Target 2: 0.4465
Target 3: 0.4520
Stop Loss: 0.4290
#GoogleEngineerChargedForPolymarketBets #GoogleEngineerChargedForPolymarketBets #SolanaFuturesOIDown30Percent #AaveProposesAssetListingFramework #AsiaLeadsRegulatedCryptoAdoption $BILL
{future}(BILLUSDT)
$FF
{spot}(FFUSDT)
Trade Idea $MEME
Trede now👆👆👆👆👆👆👆👆👆
Entry Point: 0.4330 – 0.4350
Target 1: 0.4410
Target 2: 0.4465
Target 3: 0.4520
Stop Loss: 0.4290
#GoogleEngineerChargedForPolymarketBets #GoogleEngineerChargedForPolymarketBets #SolanaFuturesOIDown30Percent #AaveProposesAssetListingFramework #AsiaLeadsRegulatedCryptoAdoption $BILL
$FF
Trede now👆👆👆👆👆👆👆👆👆
Entry Point: 0.4330 – 0.4350
Target 1: 0.4410
Target 2: 0.4465
Target 3: 0.4520
Stop Loss: 0.4290
#GoogleEngineerChargedForPolymarketBets #GoogleEngineerChargedForPolymarketBets #SolanaFuturesOIDown30Percent #AaveProposesAssetListingFramework #AsiaLeadsRegulatedCryptoAdoption $BILL
$FF
64
·
--
Bullish
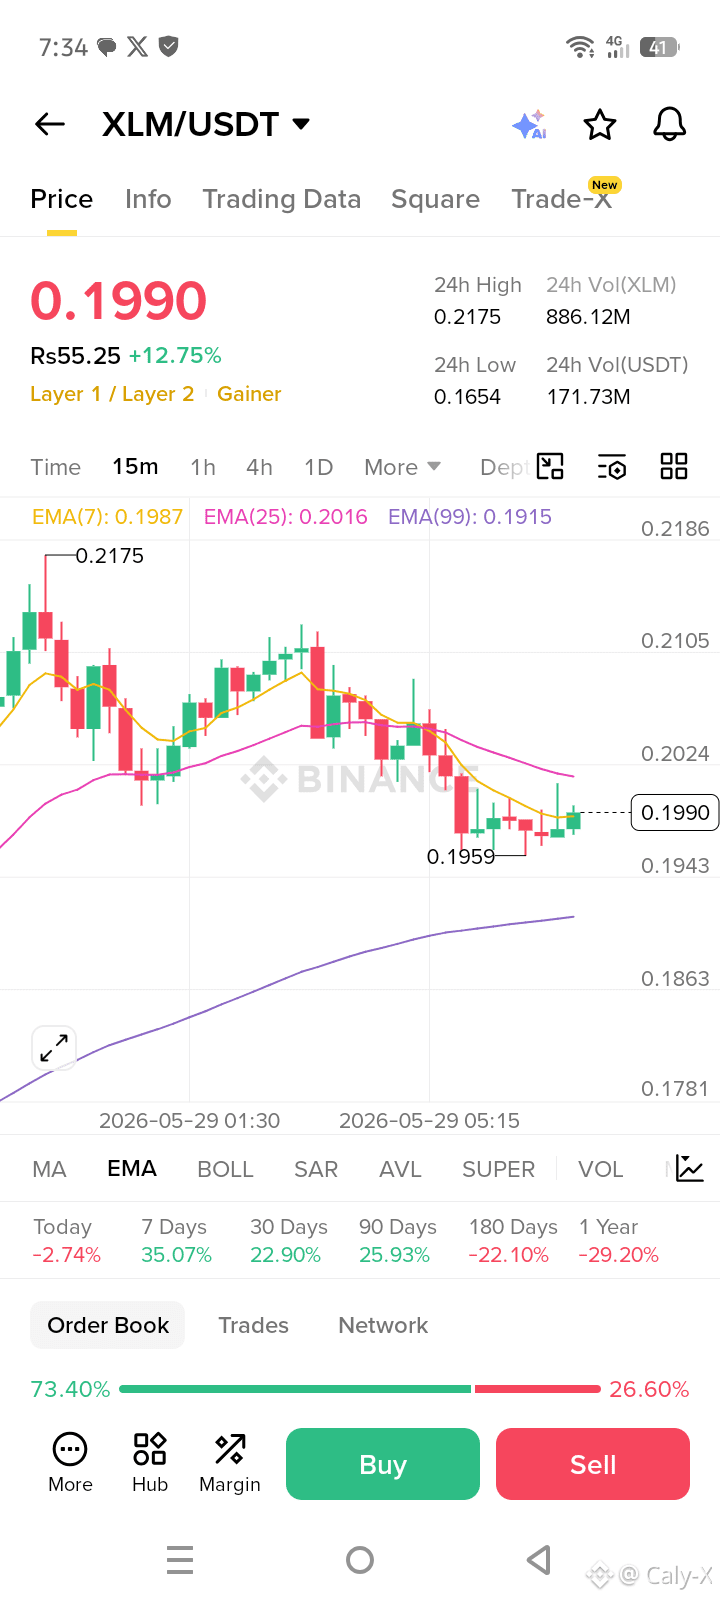
$SOL is slightly different from BTC and ETH here because buyers are still trying to defend the structure, but short-term pressure is still bearish overall on the 15m chart.
Current EMA positioning:
EMA 7 = 82.07
EMA 25 = 82.17
EMA 99 = 82.08
Price is sitting below the EMA cluster, showing momentum weakness after rejection near 83.
What the chart shows:
Multiple failed attempts to hold above 82.30–82.40
Sharp drop toward 81.70 support
Small bounce appeared immediately after the sweep low
Interesting detail: Order book shows stronger visible bid support compared to the other charts, so buyers are still active around this area.
Important support zones:
81.70–81.50 immediate support
If that breaks, next likely move is toward 81.00–80.50
Resistance zones:
82.05–82.20 first resistance
82.40–82.70 stronger recovery area
Current structure:
Short-term bearish
But weaker downside momentum compared to BTC/ETH
Buyers are still attempting to absorb dips
Key level being defended:
If SOL starts reclaiming above the EMA cluster again, it could stabilize faster than the broader market.
If 81.70 fails cleanly, sellers may accelerate the move lower.
{spot}(SOLUSDT)
#SolanaFuturesOIDown30Percent #GoogleEngineerChargedForPolymarketBets #ICEExploresHyperliquidCollaboration #CFTCSuesRhodeIslandOverPredictionMarkets #AaveProposesAssetListingFramework
$SOL is slightly different from BTC and ETH here because buyers are still trying to defend the structure, but short-term pressure is still bearish overall on the 15m chart.
Current EMA positioning:
EMA 7 = 82.07
EMA 25 = 82.17
EMA 99 = 82.08
Price is sitting below the EMA cluster, showing momentum weakness after rejection near 83.
What the chart shows:
Multiple failed attempts to hold above 82.30–82.40
Sharp drop toward 81.70 support
Small bounce appeared immediately after the sweep low
Interesting detail: Order book shows stronger visible bid support compared to the other charts, so buyers are still active around this area.
Important support zones:
81.70–81.50 immediate support
If that breaks, next likely move is toward 81.00–80.50
Resistance zones:
82.05–82.20 first resistance
82.40–82.70 stronger recovery area
Current structure:
Short-term bearish
But weaker downside momentum compared to BTC/ETH
Buyers are still attempting to absorb dips
Key level being defended:
If SOL starts reclaiming above the EMA cluster again, it could stabilize faster than the broader market.
If 81.70 fails cleanly, sellers may accelerate the move lower.
#SolanaFuturesOIDown30Percent #GoogleEngineerChargedForPolymarketBets #ICEExploresHyperliquidCollaboration #CFTCSuesRhodeIslandOverPredictionMarkets #AaveProposesAssetListingFramework
Current EMA positioning:
EMA 7 = 82.07
EMA 25 = 82.17
EMA 99 = 82.08
Price is sitting below the EMA cluster, showing momentum weakness after rejection near 83.
What the chart shows:
Multiple failed attempts to hold above 82.30–82.40
Sharp drop toward 81.70 support
Small bounce appeared immediately after the sweep low
Interesting detail: Order book shows stronger visible bid support compared to the other charts, so buyers are still active around this area.
Important support zones:
81.70–81.50 immediate support
If that breaks, next likely move is toward 81.00–80.50
Resistance zones:
82.05–82.20 first resistance
82.40–82.70 stronger recovery area
Current structure:
Short-term bearish
But weaker downside momentum compared to BTC/ETH
Buyers are still attempting to absorb dips
Key level being defended:
If SOL starts reclaiming above the EMA cluster again, it could stabilize faster than the broader market.
If 81.70 fails cleanly, sellers may accelerate the move lower.
#SolanaFuturesOIDown30Percent #GoogleEngineerChargedForPolymarketBets #ICEExploresHyperliquidCollaboration #CFTCSuesRhodeIslandOverPredictionMarkets #AaveProposesAssetListingFramework
107
·
--
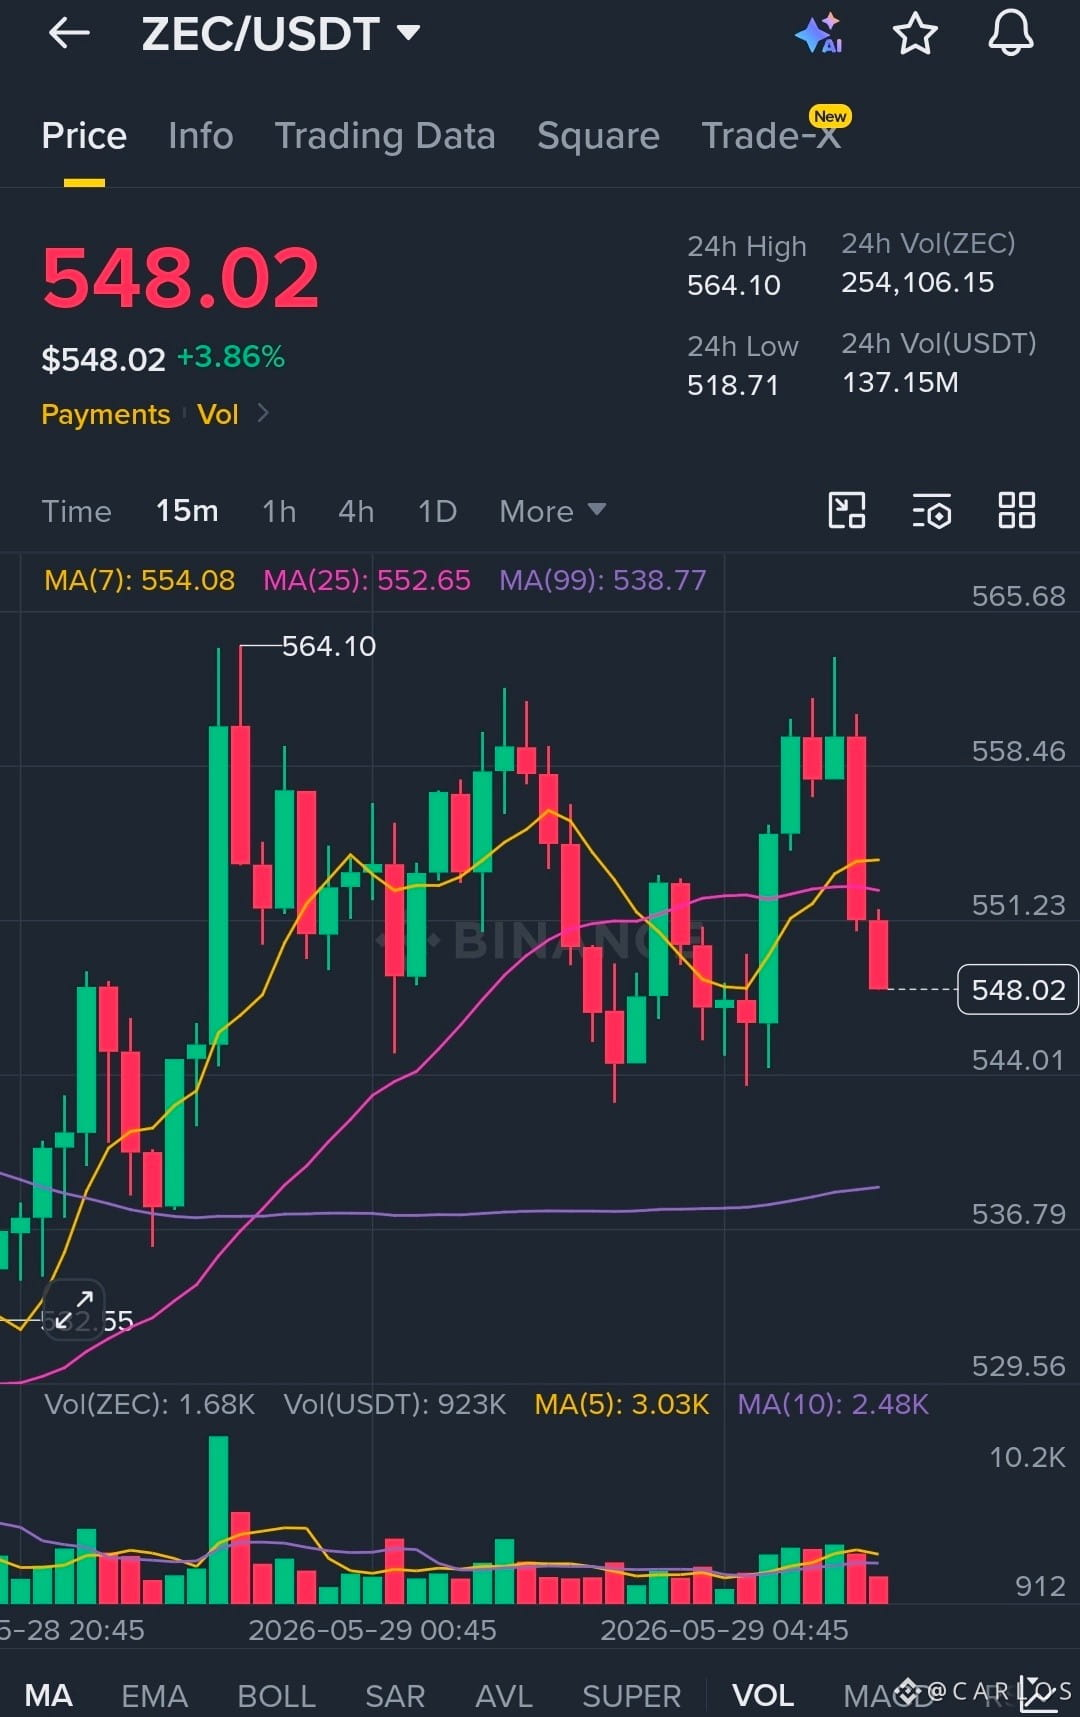
$ZEC just reminded the market it’s far from done.Volatility is back, momentum is building, and every dip is turning heads. The next move could catch the sidelines off guard. 👀🔥
{spot}(ZECUSDT)
#SolanaFuturesOIDown30Percent
#AaveProposesAssetListingFramework
#AIAgentsDisruptExchangeModel
#AsiaLeadsRegulatedCryptoAdoption
#AprilPCEInflationHits3.8Pct
$ZEC just reminded the market it’s far from done.Volatility is back, momentum is building, and every dip is turning heads. The next move could catch the sidelines off guard. 👀🔥
#SolanaFuturesOIDown30Percent
#AaveProposesAssetListingFramework
#AIAgentsDisruptExchangeModel
#AsiaLeadsRegulatedCryptoAdoption
#AprilPCEInflationHits3.8Pct
#SolanaFuturesOIDown30Percent
#AaveProposesAssetListingFramework
#AIAgentsDisruptExchangeModel
#AsiaLeadsRegulatedCryptoAdoption
#AprilPCEInflationHits3.8Pct
310

Log in to explore more content
Join global crypto users on Binance Square
⚡️ Get latest and useful information about crypto.
💬 Trusted by the world’s largest crypto exchange.
👍 Discover real insights from verified creators.
Email / Phone number
Trending Topics
1
#WhoWillSucceedJensenHuangatNvidia?
32,770 views
467 Discussing
2
#WhatWillDriveCryptoandStocks’NextRebound?
339,787 views
2,432 Discussing
3
#USPPIMissMayEaseBTCPressure
153,937 views
1,705 Discussing
4
#TONStrategyReports$23.97MQ3NetLoss
1,107 views
23 Discussing
5
#PolkadotCommunityApprovesNewStrategyWith97%Vote
5,694 views
116 Discussing
6
#dYdXPlansV9.9UpgradeToShiftUSDCToInjective
2,920 views
98 Discussing
7
#TradFiForBeginners
671,497 views
4,363 Discussing
8
#MANTRAPausesUnstakingFor7DaysAfterKeplrSecurityIncident
2,809 views
43 Discussing
9
#BitcoinCoreDisclosesTorTrafficVulnerability
68,539 views
938 Discussing
10
#BitcoinBreaksBelow200WeekMovingAverage
155,553 views
972 Discussing