

The Cryptonomist
19k Posts

The Cryptonomist
 Square Verified+
Report
Block User
0 Following
38.2K+ Followers
22.7K+ Liked
Posts
Article
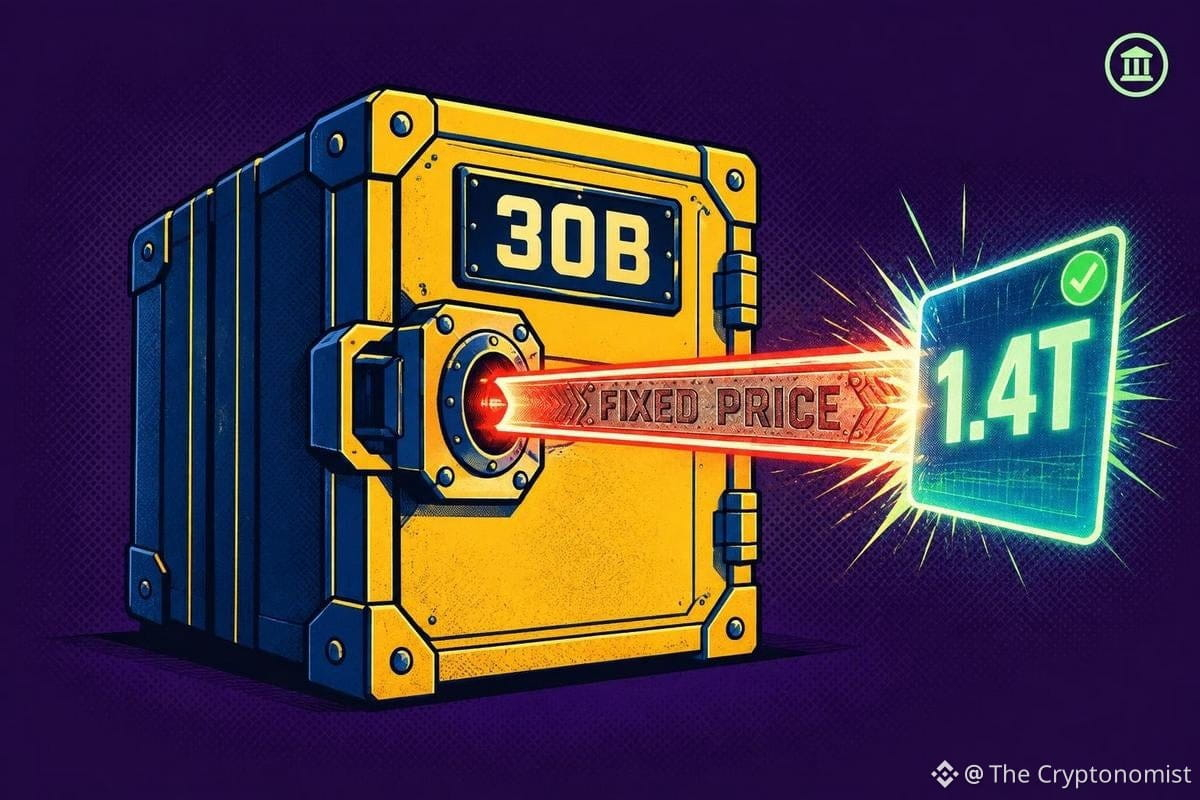
OpenAI’s $30 billion funding round could value it at $1.4 trillionOpenAI is in early discussions with Abu Dhabi’s MGX and the asset manager BlackRock about anchoring a $30 billion funding round, a deal that would value the ChatGPT maker at roughly $1.4 trillion before the new money arrives. No lead investor has been chosen, and OpenAI is said to be offering the round at a price it set itself rather than letting investors negotiate terms.
Key takeaways
MGX, an Abu Dhabi fund, could put in up to $10 billion toward OpenAI’s $30 billion round.
OpenAI is pricing the round itself and has not picked a lead investor.
The implied valuation sits near $1.4 trillion, up from $852 billion in March.
Europe’s AI gigafactory plan shares the $30 billion headline figure but only about €1 billion in public funds is actually committed.
OpenAI has pushed its IPO to 2027 at the earliest, citing AI safety concerns.
OpenAI’s $30 Billion Funding Round Under Negotiation
OpenAI is in talks with UAE-based funds and BlackRock to raise $30 billion. According to TheNextWeb, the round has yet to be finalized and its terms may still change; OpenAI and BlackRock offered no comment, while MGX likewise did not reply to inquiries.
Investor Composition and Contributions
Abu Dhabi’s MGX is discussing a syndicate of UAE funds that together could contribute as much as $10 billion, with BlackRock sitting alongside it in the round, according to Bloomberg’s reporting. This year alone, MGX has pulled in nearly $50 billion and already owns positions in OpenAI, Anthropic, and xAI. Sheikh Tahnoon bin Zayed Al Nahyan serves as the fund’s chairman, with Mubadala and G42 counted among its founding partners.
Fixed Price Valuation and Absence of Lead Investor
What sets this raise apart is structure, not just size. OpenAI is presenting the $30 billion round at a price it has fixed itself, skipping the usual process where a lead investor negotiates valuation terms with the company. That price points to a roughly $1.4 trillion valuation before the new capital lands, a steep jump from the $852 billion figure attached to its last raise.
Context Behind the Raise
This would not be OpenAI’s first large capital injection, and it comes as the company keeps pushing back its public market debut.
Previous Fundraising and IPO Delay
OpenAI last raised $122 billion in March at an $852 billion valuation, a round that was originally expected to be its final private raise before an IPO. That listing, once anticipated for this year, has now been delayed to 2027 at the earliest. TechCrunch reported that CEO Sam Altman has ruled out a 2026 debut to prioritize AI safety work, telling Fortune, “I think it is unacceptable to be taking like a 10% chance of killing everybody by the end of the decade,” in response to warnings from safety researchers. Bloomberg’s reporting described the new fundraising, if it goes through, as a bridge round ahead of that eventual listing.
MGX and BlackRock’s Existing AI Infrastructure Partnership
The pairing of MGX and BlackRock in this round is not incidental. The two already co-run a separate $30 billion infrastructure vehicle alongside Microsoft and Nvidia, giving them an existing working relationship in large-scale AI financing before these latest talks.
Potential Additional Investors
Beyond MGX and BlackRock, the University of California’s endowment has held talks about joining the round, as have existing OpenAI backers Thrive Capital and Andreessen Horowitz.
Comparing OpenAI’s Funding with the EU AI Gigafactory Program
The EU’s AI gigafactory initiative carries the same $30 billion-equivalent headline figure as OpenAI’s private round, but the money behind it looks very different. Only about €1 billion in public funding has actually been committed so far, even though the program was pitched at €30 billion overall, with roughly €10 billion meant to come from the EU and member states and €20 billion from private investors.
EU’s €30 Billion Target vs. Actual Public Commitments
Brussels opened bidding in July for seven AI gigafactories under the €30 billion program. Interest has cooled since then, with the number of interested consortia falling from roughly 70 to ten by June. Deutsche Telekom has asked for demand guarantees before committing, while Telefonica is weighing a smaller stake, according to the reporting referenced by TheNextWeb.
Planned AI Chip Deployment and Facility Timeline
Each planned gigafactory site is designed to house at least 100,000 AI chips. Construction is set to begin in early 2027, with the first facilities expected to start running by mid-2028.
Article produced with the assistance of artificial intelligence and reviewed by the editorial team.
OpenAI’s $30 billion funding round could value it at $1.4 trillion
OpenAI is in early discussions with Abu Dhabi’s MGX and the asset manager BlackRock about anchoring a $30 billion funding round, a deal that would value the ChatGPT maker at roughly $1.4 trillion before the new money arrives. No lead investor has been chosen, and OpenAI is said to be offering the round at a price it set itself rather than letting investors negotiate terms.
Key takeaways
MGX, an Abu Dhabi fund, could put in up to $10 billion toward OpenAI’s $30 billion round.
OpenAI is pricing the round itself and has not picked a lead investor.
The implied valuation sits near $1.4 trillion, up from $852 billion in March.
Europe’s AI gigafactory plan shares the $30 billion headline figure but only about €1 billion in public funds is actually committed.
OpenAI has pushed its IPO to 2027 at the earliest, citing AI safety concerns.
OpenAI’s $30 Billion Funding Round Under Negotiation
OpenAI is in talks with UAE-based funds and BlackRock to raise $30 billion. According to TheNextWeb, the round has yet to be finalized and its terms may still change; OpenAI and BlackRock offered no comment, while MGX likewise did not reply to inquiries.
Investor Composition and Contributions
Abu Dhabi’s MGX is discussing a syndicate of UAE funds that together could contribute as much as $10 billion, with BlackRock sitting alongside it in the round, according to Bloomberg’s reporting. This year alone, MGX has pulled in nearly $50 billion and already owns positions in OpenAI, Anthropic, and xAI. Sheikh Tahnoon bin Zayed Al Nahyan serves as the fund’s chairman, with Mubadala and G42 counted among its founding partners.
Fixed Price Valuation and Absence of Lead Investor
What sets this raise apart is structure, not just size. OpenAI is presenting the $30 billion round at a price it has fixed itself, skipping the usual process where a lead investor negotiates valuation terms with the company. That price points to a roughly $1.4 trillion valuation before the new capital lands, a steep jump from the $852 billion figure attached to its last raise.
Context Behind the Raise
This would not be OpenAI’s first large capital injection, and it comes as the company keeps pushing back its public market debut.
Previous Fundraising and IPO Delay
OpenAI last raised $122 billion in March at an $852 billion valuation, a round that was originally expected to be its final private raise before an IPO. That listing, once anticipated for this year, has now been delayed to 2027 at the earliest. TechCrunch reported that CEO Sam Altman has ruled out a 2026 debut to prioritize AI safety work, telling Fortune, “I think it is unacceptable to be taking like a 10% chance of killing everybody by the end of the decade,” in response to warnings from safety researchers. Bloomberg’s reporting described the new fundraising, if it goes through, as a bridge round ahead of that eventual listing.
MGX and BlackRock’s Existing AI Infrastructure Partnership
The pairing of MGX and BlackRock in this round is not incidental. The two already co-run a separate $30 billion infrastructure vehicle alongside Microsoft and Nvidia, giving them an existing working relationship in large-scale AI financing before these latest talks.
Potential Additional Investors
Beyond MGX and BlackRock, the University of California’s endowment has held talks about joining the round, as have existing OpenAI backers Thrive Capital and Andreessen Horowitz.
Comparing OpenAI’s Funding with the EU AI Gigafactory Program
The EU’s AI gigafactory initiative carries the same $30 billion-equivalent headline figure as OpenAI’s private round, but the money behind it looks very different. Only about €1 billion in public funding has actually been committed so far, even though the program was pitched at €30 billion overall, with roughly €10 billion meant to come from the EU and member states and €20 billion from private investors.
EU’s €30 Billion Target vs. Actual Public Commitments
Brussels opened bidding in July for seven AI gigafactories under the €30 billion program. Interest has cooled since then, with the number of interested consortia falling from roughly 70 to ten by June. Deutsche Telekom has asked for demand guarantees before committing, while Telefonica is weighing a smaller stake, according to the reporting referenced by TheNextWeb.
Planned AI Chip Deployment and Facility Timeline
Each planned gigafactory site is designed to house at least 100,000 AI chips. Construction is set to begin in early 2027, with the first facilities expected to start running by mid-2028.
Article produced with the assistance of artificial intelligence and reviewed by the editorial team.
Key takeaways
MGX, an Abu Dhabi fund, could put in up to $10 billion toward OpenAI’s $30 billion round.
OpenAI is pricing the round itself and has not picked a lead investor.
The implied valuation sits near $1.4 trillion, up from $852 billion in March.
Europe’s AI gigafactory plan shares the $30 billion headline figure but only about €1 billion in public funds is actually committed.
OpenAI has pushed its IPO to 2027 at the earliest, citing AI safety concerns.
OpenAI’s $30 Billion Funding Round Under Negotiation
OpenAI is in talks with UAE-based funds and BlackRock to raise $30 billion. According to TheNextWeb, the round has yet to be finalized and its terms may still change; OpenAI and BlackRock offered no comment, while MGX likewise did not reply to inquiries.
Investor Composition and Contributions
Abu Dhabi’s MGX is discussing a syndicate of UAE funds that together could contribute as much as $10 billion, with BlackRock sitting alongside it in the round, according to Bloomberg’s reporting. This year alone, MGX has pulled in nearly $50 billion and already owns positions in OpenAI, Anthropic, and xAI. Sheikh Tahnoon bin Zayed Al Nahyan serves as the fund’s chairman, with Mubadala and G42 counted among its founding partners.
Fixed Price Valuation and Absence of Lead Investor
What sets this raise apart is structure, not just size. OpenAI is presenting the $30 billion round at a price it has fixed itself, skipping the usual process where a lead investor negotiates valuation terms with the company. That price points to a roughly $1.4 trillion valuation before the new capital lands, a steep jump from the $852 billion figure attached to its last raise.
Context Behind the Raise
This would not be OpenAI’s first large capital injection, and it comes as the company keeps pushing back its public market debut.
Previous Fundraising and IPO Delay
OpenAI last raised $122 billion in March at an $852 billion valuation, a round that was originally expected to be its final private raise before an IPO. That listing, once anticipated for this year, has now been delayed to 2027 at the earliest. TechCrunch reported that CEO Sam Altman has ruled out a 2026 debut to prioritize AI safety work, telling Fortune, “I think it is unacceptable to be taking like a 10% chance of killing everybody by the end of the decade,” in response to warnings from safety researchers. Bloomberg’s reporting described the new fundraising, if it goes through, as a bridge round ahead of that eventual listing.
MGX and BlackRock’s Existing AI Infrastructure Partnership
The pairing of MGX and BlackRock in this round is not incidental. The two already co-run a separate $30 billion infrastructure vehicle alongside Microsoft and Nvidia, giving them an existing working relationship in large-scale AI financing before these latest talks.
Potential Additional Investors
Beyond MGX and BlackRock, the University of California’s endowment has held talks about joining the round, as have existing OpenAI backers Thrive Capital and Andreessen Horowitz.
Comparing OpenAI’s Funding with the EU AI Gigafactory Program
The EU’s AI gigafactory initiative carries the same $30 billion-equivalent headline figure as OpenAI’s private round, but the money behind it looks very different. Only about €1 billion in public funding has actually been committed so far, even though the program was pitched at €30 billion overall, with roughly €10 billion meant to come from the EU and member states and €20 billion from private investors.
EU’s €30 Billion Target vs. Actual Public Commitments
Brussels opened bidding in July for seven AI gigafactories under the €30 billion program. Interest has cooled since then, with the number of interested consortia falling from roughly 70 to ten by June. Deutsche Telekom has asked for demand guarantees before committing, while Telefonica is weighing a smaller stake, according to the reporting referenced by TheNextWeb.
Planned AI Chip Deployment and Facility Timeline
Each planned gigafactory site is designed to house at least 100,000 AI chips. Construction is set to begin in early 2027, with the first facilities expected to start running by mid-2028.
Article produced with the assistance of artificial intelligence and reviewed by the editorial team.
1
48

Article
Merchants on Base network can now accept stablecoin payments at checkoutMerchants running on the Base network can now accept stablecoin payments directly at checkout, after payment processor Yuno rolled out the capability in an integration confirmed on October 5, 2026.
Key takeaways
Yuno now lets merchants on Base accept stablecoin payments at checkout.
The update positions stablecoin checkout as a growing option for everyday commerce.
Yuno already processes multiple digital payment types, including cryptocurrencies.
Stablecoins are gaining traction in emerging markets as a form of dollarization.
Yuno Launches Stablecoin Payments on Base
Yuno’s integration gives merchants on its platform a direct way to accept stablecoin payments through Base, according to a post from Base · blockchain confirming the rollout.
Stablecoin checkout is becoming a more common payment standard for merchants, according to the report, which framed the shift as part of a wider pattern of digital-currency adoption.
Yuno operates as a payment processing platform that already supports several forms of digital payment, including cryptocurrencies, according to Coinfomania. The report also pointed to stablecoins gaining traction in emerging markets, where they are increasingly used as a form of dollarization. As more platforms adopt similar stablecoin payment tools, the report suggested the landscape of digital currency transactions could keep evolving, with wider merchant adoption expected to follow.
Article produced with the assistance of artificial intelligence and reviewed by the editorial team.
Merchants on Base network can now accept stablecoin payments at checkout
Merchants running on the Base network can now accept stablecoin payments directly at checkout, after payment processor Yuno rolled out the capability in an integration confirmed on October 5, 2026.
Key takeaways
Yuno now lets merchants on Base accept stablecoin payments at checkout.
The update positions stablecoin checkout as a growing option for everyday commerce.
Yuno already processes multiple digital payment types, including cryptocurrencies.
Stablecoins are gaining traction in emerging markets as a form of dollarization.
Yuno Launches Stablecoin Payments on Base
Yuno’s integration gives merchants on its platform a direct way to accept stablecoin payments through Base, according to a post from Base · blockchain confirming the rollout.
Stablecoin checkout is becoming a more common payment standard for merchants, according to the report, which framed the shift as part of a wider pattern of digital-currency adoption.
Yuno operates as a payment processing platform that already supports several forms of digital payment, including cryptocurrencies, according to Coinfomania. The report also pointed to stablecoins gaining traction in emerging markets, where they are increasingly used as a form of dollarization. As more platforms adopt similar stablecoin payment tools, the report suggested the landscape of digital currency transactions could keep evolving, with wider merchant adoption expected to follow.
Article produced with the assistance of artificial intelligence and reviewed by the editorial team.
Key takeaways
Yuno now lets merchants on Base accept stablecoin payments at checkout.
The update positions stablecoin checkout as a growing option for everyday commerce.
Yuno already processes multiple digital payment types, including cryptocurrencies.
Stablecoins are gaining traction in emerging markets as a form of dollarization.
Yuno Launches Stablecoin Payments on Base
Yuno’s integration gives merchants on its platform a direct way to accept stablecoin payments through Base, according to a post from Base · blockchain confirming the rollout.
Stablecoin checkout is becoming a more common payment standard for merchants, according to the report, which framed the shift as part of a wider pattern of digital-currency adoption.
Yuno operates as a payment processing platform that already supports several forms of digital payment, including cryptocurrencies, according to Coinfomania. The report also pointed to stablecoins gaining traction in emerging markets, where they are increasingly used as a form of dollarization. As more platforms adopt similar stablecoin payment tools, the report suggested the landscape of digital currency transactions could keep evolving, with wider merchant adoption expected to follow.
Article produced with the assistance of artificial intelligence and reviewed by the editorial team.
30
Article
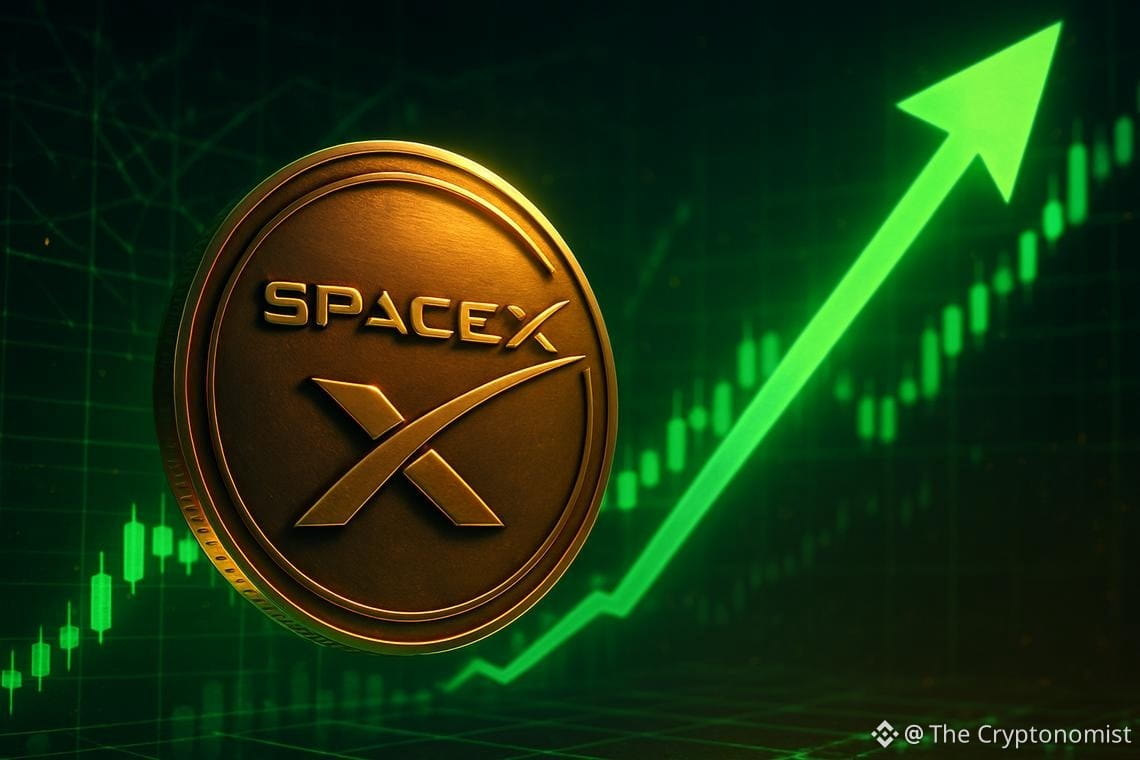
SpaceX stock jumps 5.91% to $168.35 as hourly RSI pushes into overbought territorySpaceX (SPCX) was trading at $168.35 as of 11:06 ET on Monday, October 5, up 5.91% from the prior close of $158.96. The stock opened at $159.12, traded between a low of $158.67 and a high of $168.40, and was last at $168.35, against a previous close of $158.96. The daily, hourly and 15-minute readings all point bullish, though shorter timeframes now show an overbought tape.
SPCX — daily chart with candlesticks, EMA20/EMA50 and volume.
Key takeaways
SpaceX (SPCX) was trading at $168.35 as of 11:06 ET on Monday, up 5.91% from the previous close of $158.96 on October 2.
Daily RSI14 stands at 67.51, below the overbought threshold of 70, while the daily MACD histogram is at 0.96, up from -0.03 on the prior candle.
Hourly RSI14 is at 79.88 and 15-minute RSI14 is at 84, both in overbought territory.
Price trades above the daily upper Bollinger band at $161.64, the hourly upper band at $166.12, and the daily pivot at $156.05.
The next hourly resistance (R1) sits at $170.50; daily support (S1) is at $152.25.
SpaceX Daily Chart: MACD Histogram at 0.96, RSI14 at 67.51
On the daily chart, the structure behind SpaceX stock has shifted clearly higher. The 20-session EMA sits at $150.81, up from $148.96 on the prior candle. Price trades well above both the 20-session average and the 50-session EMA at $147.21. Daily RSI14 has risen to 67.51 from 61.48, which keeps it below the overbought threshold of 70 but close to it.
The daily MACD line is at 3.85 against a signal of 2.89, a positive combination. The histogram has moved to 0.96 from -0.03, marking a bullish cross. The histogram now sits above zero after being below it on the previous candle.
The daily Bollinger setup shows a mid-band at $151.15, an upper band at $161.64 and a lower band at $140.66. The intraday price is running above the upper band. Daily ATR14 is at 7.04, up from 6.83. The daily pivot for the current session, based on the October 2 candle, stands at $156.05. Resistance (R1) is at $162.75 and support (S1) at $152.25. Price is trading above all three, meaning the prior resistance has already been cleared intraday.
Hourly Picture Confirms, With a Caveat
The hourly timeframe reinforces the daily bias. SPCX trades above its 20-hour EMA at $156.61. That average sits above the 50-hour EMA at $153.04 and the 200-hour EMA at $147.05, forming a fully stacked bullish alignment across all three averages.
However, hourly RSI14 has climbed to 79.88 from 79.09, placing it well inside overbought territory. The hourly MACD line reads 3.82 against a signal of 2.33, with the histogram at 1.49, up from 1.23. The reading is positive and confirms the directional push.
The hourly Bollinger bands show a mid-band of $155.00, an upper band of $166.12 and a lower band of $143.88. Price is trading above the upper band here as well. Hourly ATR14 has eased slightly to 2.49 from 2.54. The hourly pivot sits at $164.59, with resistance (R1) at $170.50 and support (S1) at $161.53. Price is above the pivot and below R1, meaning the next hourly level to clear is $170.50.
In short, the hourly chart confirms the daily uptrend but complicates it somewhat. The combination of an overbought RSI14 and a price already outside its upper band suggests the move is extended on this timeframe. The trend direction itself is not in question.
15-Minute Context: Execution Near Stretched Levels
On the 15-minute chart, used here only for timing, the picture is similarly stacked bullish. Price trades above the 20-period EMA at $162.18, which is above the 50-period EMA at $157.98 and the 200-period EMA at $153.11. RSI14 on this timeframe stands at 84, up from 83.01, deep into overbought territory. The MACD line is at 3.15 versus a signal of 2.46, with the histogram at 0.69.
The 15-minute Bollinger bands show a mid-band of $161.27, an upper band of $168.84 and a lower band of $153.70. Price is sitting just below that upper band. There is very little room left before the band itself would need to expand to accommodate further upside. The 15-minute pivot is at $167.32, with resistance (R1) at $168.07 and support (S1) at $166.91. Price is trading above R1, which has already been cleared on this timeframe.
News Flow Around SpaceX
A Seeking Alpha report published before Monday’s session noted that SPCX climbed 7% on Friday amid an AI satellite launch and the Crew-13 ISS mission.
Separately, a Yahoo Finance piece published Sunday compared SpaceX with Rocket Lab. It noted that SPCX closed at $158.96 on October 2 against Rocket Lab’s $73.92. The report observed that despite SpaceX being roughly forty times the size of Rocket Lab and neither company being profitable, the market charges a similar price for both.
A Motley Fool article published Sunday argued that SpaceX stock could close above $200 again before 2028. The stock has closed above that level only once. The view was tied to the possibility of a $10.4 billion quarter by the end of 2027. A separate Motley Fool piece published Saturday discussed the Starship program reaching orbit and argued its revenue-producing potential is too big to ignore. Meanwhile, a Yahoo Finance report published before Monday’s open flagged SpaceX’s upcoming earnings update. It described the update as a point worth watching for long-term investors, without disclosing specific figures.
Bullish Scenario
The bullish case for SpaceX stock rests on the daily trend remaining intact: EMA20 above EMA50, a positive MACD histogram, and RSI14 still below 70 despite the rally. For continuation, the stock would need to clear the 15-minute upper Bollinger band at $168.84, since price is currently just beneath it. On the longer timeframe, clearing the hourly resistance (R1) at $170.50, which sits just above the current price, would also support further upside. A sustained move through both levels, with the hourly and daily RSI14 readings holding below 80 and 70 respectively rather than rolling over, would keep the structure aligned across all three timeframes.
Bearish Scenario
On the other hand, the overbought readings on the hourly (79.88) and 15-minute (84) RSI14 leave room for a pullback even within an intact daily uptrend. The 15-minute pivot at $167.32 is a level to watch on the way down, followed by the 15-minute support (S1) at $166.91. A break below the hourly pivot at $164.59 would be a more meaningful signal, since it would put price back inside the hourly Bollinger band rather than above it. Further down, the daily resistance (R1) at $162.75 and the daily upper Bollinger band at $161.64 mark the zone where the current advance would need to hold. A slip back toward the daily pivot at $156.05 would materially weaken the bullish case built on this session’s gain.
Where SpaceX Stock Stands Now
Overall, SpaceX stock is trading at $168.35 as of 11:06 ET, up 5.91% versus Friday’s close of $158.96. The daily, hourly and 15-minute trends all point in the same direction. The daily picture shows a bullish MACD cross and the EMA20 above the EMA50, while the hourly chart confirms the trend with a fully stacked EMA alignment.
At the same time, RSI14 readings on both the hourly (79.88) and 15-minute (84) charts are deep into overbought territory. Price is trading above the upper Bollinger band on the daily and hourly timeframes, and just below it on the 15-minute chart. Daily ATR14 is at 7.04, up from 6.83. What remains uncertain is whether the next move is a continuation toward the hourly resistance (R1) at $170.50 or a pullback toward the hourly pivot at $164.59 and the daily resistance (R1) at $162.75. Those levels would test whether Monday’s advance has staying power.
FAQ
What is the current trend for SpaceX stock?
SpaceX stock shows a bullish daily trend. The 20-session EMA at $150.81 sits above the 50-session EMA at $147.21, the daily MACD histogram is positive at 0.96, and price at $168.35 trades above all key short-term moving averages.
Is SpaceX stock overbought right now?
On the daily timeframe, RSI14 at 67.51 remains below the 70 overbought threshold. However, hourly RSI14 is at 79.88 and 15-minute RSI14 is at 84, both in overbought territory. Price is also trading above the upper Bollinger band on the daily and hourly charts, and just below it on the 15-minute chart.
What are the key levels to watch for SpaceX stock?
On the upside, hourly resistance (R1) at $170.50 is the next level to clear. On the downside, the hourly pivot at $164.59 and the daily resistance (R1) at $162.75 are the first levels that would test the durability of Monday’s advance.
What news is affecting SpaceX stock?
Recent coverage includes a Seeking Alpha report noting SPCX climbed 7% on Friday, a Yahoo Finance comparison with Rocket Lab published Sunday, and a Yahoo Finance report published before Monday’s open flagging SpaceX’s upcoming earnings update.
Disclaimer: This article is for informational purposes only and does not constitute financial advice, an investment recommendation, or a solicitation to buy or sell any financial instrument. The analysis provided is not indicative of future results. Investing in financial markets carries a high risk of capital loss. Always do your own research (DYOR) and consult a qualified financial advisor before making any decision.
Cryptonomist and the author hold no positions in the financial instruments mentioned and receive no compensation from the companies covered.
Article produced with the assistance of artificial intelligence and reviewed by the editorial team.
SpaceX stock jumps 5.91% to $168.35 as hourly RSI pushes into overbought territory
SpaceX (SPCX) was trading at $168.35 as of 11:06 ET on Monday, October 5, up 5.91% from the prior close of $158.96. The stock opened at $159.12, traded between a low of $158.67 and a high of $168.40, and was last at $168.35, against a previous close of $158.96. The daily, hourly and 15-minute readings all point bullish, though shorter timeframes now show an overbought tape.
SPCX — daily chart with candlesticks, EMA20/EMA50 and volume.
Key takeaways
SpaceX (SPCX) was trading at $168.35 as of 11:06 ET on Monday, up 5.91% from the previous close of $158.96 on October 2.
Daily RSI14 stands at 67.51, below the overbought threshold of 70, while the daily MACD histogram is at 0.96, up from -0.03 on the prior candle.
Hourly RSI14 is at 79.88 and 15-minute RSI14 is at 84, both in overbought territory.
Price trades above the daily upper Bollinger band at $161.64, the hourly upper band at $166.12, and the daily pivot at $156.05.
The next hourly resistance (R1) sits at $170.50; daily support (S1) is at $152.25.
SpaceX Daily Chart: MACD Histogram at 0.96, RSI14 at 67.51
On the daily chart, the structure behind SpaceX stock has shifted clearly higher. The 20-session EMA sits at $150.81, up from $148.96 on the prior candle. Price trades well above both the 20-session average and the 50-session EMA at $147.21. Daily RSI14 has risen to 67.51 from 61.48, which keeps it below the overbought threshold of 70 but close to it.
The daily MACD line is at 3.85 against a signal of 2.89, a positive combination. The histogram has moved to 0.96 from -0.03, marking a bullish cross. The histogram now sits above zero after being below it on the previous candle.
The daily Bollinger setup shows a mid-band at $151.15, an upper band at $161.64 and a lower band at $140.66. The intraday price is running above the upper band. Daily ATR14 is at 7.04, up from 6.83. The daily pivot for the current session, based on the October 2 candle, stands at $156.05. Resistance (R1) is at $162.75 and support (S1) at $152.25. Price is trading above all three, meaning the prior resistance has already been cleared intraday.
Hourly Picture Confirms, With a Caveat
The hourly timeframe reinforces the daily bias. SPCX trades above its 20-hour EMA at $156.61. That average sits above the 50-hour EMA at $153.04 and the 200-hour EMA at $147.05, forming a fully stacked bullish alignment across all three averages.
However, hourly RSI14 has climbed to 79.88 from 79.09, placing it well inside overbought territory. The hourly MACD line reads 3.82 against a signal of 2.33, with the histogram at 1.49, up from 1.23. The reading is positive and confirms the directional push.
The hourly Bollinger bands show a mid-band of $155.00, an upper band of $166.12 and a lower band of $143.88. Price is trading above the upper band here as well. Hourly ATR14 has eased slightly to 2.49 from 2.54. The hourly pivot sits at $164.59, with resistance (R1) at $170.50 and support (S1) at $161.53. Price is above the pivot and below R1, meaning the next hourly level to clear is $170.50.
In short, the hourly chart confirms the daily uptrend but complicates it somewhat. The combination of an overbought RSI14 and a price already outside its upper band suggests the move is extended on this timeframe. The trend direction itself is not in question.
15-Minute Context: Execution Near Stretched Levels
On the 15-minute chart, used here only for timing, the picture is similarly stacked bullish. Price trades above the 20-period EMA at $162.18, which is above the 50-period EMA at $157.98 and the 200-period EMA at $153.11. RSI14 on this timeframe stands at 84, up from 83.01, deep into overbought territory. The MACD line is at 3.15 versus a signal of 2.46, with the histogram at 0.69.
The 15-minute Bollinger bands show a mid-band of $161.27, an upper band of $168.84 and a lower band of $153.70. Price is sitting just below that upper band. There is very little room left before the band itself would need to expand to accommodate further upside. The 15-minute pivot is at $167.32, with resistance (R1) at $168.07 and support (S1) at $166.91. Price is trading above R1, which has already been cleared on this timeframe.
News Flow Around SpaceX
A Seeking Alpha report published before Monday’s session noted that SPCX climbed 7% on Friday amid an AI satellite launch and the Crew-13 ISS mission.
Separately, a Yahoo Finance piece published Sunday compared SpaceX with Rocket Lab. It noted that SPCX closed at $158.96 on October 2 against Rocket Lab’s $73.92. The report observed that despite SpaceX being roughly forty times the size of Rocket Lab and neither company being profitable, the market charges a similar price for both.
A Motley Fool article published Sunday argued that SpaceX stock could close above $200 again before 2028. The stock has closed above that level only once. The view was tied to the possibility of a $10.4 billion quarter by the end of 2027. A separate Motley Fool piece published Saturday discussed the Starship program reaching orbit and argued its revenue-producing potential is too big to ignore. Meanwhile, a Yahoo Finance report published before Monday’s open flagged SpaceX’s upcoming earnings update. It described the update as a point worth watching for long-term investors, without disclosing specific figures.
Bullish Scenario
The bullish case for SpaceX stock rests on the daily trend remaining intact: EMA20 above EMA50, a positive MACD histogram, and RSI14 still below 70 despite the rally. For continuation, the stock would need to clear the 15-minute upper Bollinger band at $168.84, since price is currently just beneath it. On the longer timeframe, clearing the hourly resistance (R1) at $170.50, which sits just above the current price, would also support further upside. A sustained move through both levels, with the hourly and daily RSI14 readings holding below 80 and 70 respectively rather than rolling over, would keep the structure aligned across all three timeframes.
Bearish Scenario
On the other hand, the overbought readings on the hourly (79.88) and 15-minute (84) RSI14 leave room for a pullback even within an intact daily uptrend. The 15-minute pivot at $167.32 is a level to watch on the way down, followed by the 15-minute support (S1) at $166.91. A break below the hourly pivot at $164.59 would be a more meaningful signal, since it would put price back inside the hourly Bollinger band rather than above it. Further down, the daily resistance (R1) at $162.75 and the daily upper Bollinger band at $161.64 mark the zone where the current advance would need to hold. A slip back toward the daily pivot at $156.05 would materially weaken the bullish case built on this session’s gain.
Where SpaceX Stock Stands Now
Overall, SpaceX stock is trading at $168.35 as of 11:06 ET, up 5.91% versus Friday’s close of $158.96. The daily, hourly and 15-minute trends all point in the same direction. The daily picture shows a bullish MACD cross and the EMA20 above the EMA50, while the hourly chart confirms the trend with a fully stacked EMA alignment.
At the same time, RSI14 readings on both the hourly (79.88) and 15-minute (84) charts are deep into overbought territory. Price is trading above the upper Bollinger band on the daily and hourly timeframes, and just below it on the 15-minute chart. Daily ATR14 is at 7.04, up from 6.83. What remains uncertain is whether the next move is a continuation toward the hourly resistance (R1) at $170.50 or a pullback toward the hourly pivot at $164.59 and the daily resistance (R1) at $162.75. Those levels would test whether Monday’s advance has staying power.
FAQ
What is the current trend for SpaceX stock?
SpaceX stock shows a bullish daily trend. The 20-session EMA at $150.81 sits above the 50-session EMA at $147.21, the daily MACD histogram is positive at 0.96, and price at $168.35 trades above all key short-term moving averages.
Is SpaceX stock overbought right now?
On the daily timeframe, RSI14 at 67.51 remains below the 70 overbought threshold. However, hourly RSI14 is at 79.88 and 15-minute RSI14 is at 84, both in overbought territory. Price is also trading above the upper Bollinger band on the daily and hourly charts, and just below it on the 15-minute chart.
What are the key levels to watch for SpaceX stock?
On the upside, hourly resistance (R1) at $170.50 is the next level to clear. On the downside, the hourly pivot at $164.59 and the daily resistance (R1) at $162.75 are the first levels that would test the durability of Monday’s advance.
What news is affecting SpaceX stock?
Recent coverage includes a Seeking Alpha report noting SPCX climbed 7% on Friday, a Yahoo Finance comparison with Rocket Lab published Sunday, and a Yahoo Finance report published before Monday’s open flagging SpaceX’s upcoming earnings update.
Disclaimer: This article is for informational purposes only and does not constitute financial advice, an investment recommendation, or a solicitation to buy or sell any financial instrument. The analysis provided is not indicative of future results. Investing in financial markets carries a high risk of capital loss. Always do your own research (DYOR) and consult a qualified financial advisor before making any decision.
Cryptonomist and the author hold no positions in the financial instruments mentioned and receive no compensation from the companies covered.
Article produced with the assistance of artificial intelligence and reviewed by the editorial team.
SPCX — daily chart with candlesticks, EMA20/EMA50 and volume.
Key takeaways
SpaceX (SPCX) was trading at $168.35 as of 11:06 ET on Monday, up 5.91% from the previous close of $158.96 on October 2.
Daily RSI14 stands at 67.51, below the overbought threshold of 70, while the daily MACD histogram is at 0.96, up from -0.03 on the prior candle.
Hourly RSI14 is at 79.88 and 15-minute RSI14 is at 84, both in overbought territory.
Price trades above the daily upper Bollinger band at $161.64, the hourly upper band at $166.12, and the daily pivot at $156.05.
The next hourly resistance (R1) sits at $170.50; daily support (S1) is at $152.25.
SpaceX Daily Chart: MACD Histogram at 0.96, RSI14 at 67.51
On the daily chart, the structure behind SpaceX stock has shifted clearly higher. The 20-session EMA sits at $150.81, up from $148.96 on the prior candle. Price trades well above both the 20-session average and the 50-session EMA at $147.21. Daily RSI14 has risen to 67.51 from 61.48, which keeps it below the overbought threshold of 70 but close to it.
The daily MACD line is at 3.85 against a signal of 2.89, a positive combination. The histogram has moved to 0.96 from -0.03, marking a bullish cross. The histogram now sits above zero after being below it on the previous candle.
The daily Bollinger setup shows a mid-band at $151.15, an upper band at $161.64 and a lower band at $140.66. The intraday price is running above the upper band. Daily ATR14 is at 7.04, up from 6.83. The daily pivot for the current session, based on the October 2 candle, stands at $156.05. Resistance (R1) is at $162.75 and support (S1) at $152.25. Price is trading above all three, meaning the prior resistance has already been cleared intraday.
Hourly Picture Confirms, With a Caveat
The hourly timeframe reinforces the daily bias. SPCX trades above its 20-hour EMA at $156.61. That average sits above the 50-hour EMA at $153.04 and the 200-hour EMA at $147.05, forming a fully stacked bullish alignment across all three averages.
However, hourly RSI14 has climbed to 79.88 from 79.09, placing it well inside overbought territory. The hourly MACD line reads 3.82 against a signal of 2.33, with the histogram at 1.49, up from 1.23. The reading is positive and confirms the directional push.
The hourly Bollinger bands show a mid-band of $155.00, an upper band of $166.12 and a lower band of $143.88. Price is trading above the upper band here as well. Hourly ATR14 has eased slightly to 2.49 from 2.54. The hourly pivot sits at $164.59, with resistance (R1) at $170.50 and support (S1) at $161.53. Price is above the pivot and below R1, meaning the next hourly level to clear is $170.50.
In short, the hourly chart confirms the daily uptrend but complicates it somewhat. The combination of an overbought RSI14 and a price already outside its upper band suggests the move is extended on this timeframe. The trend direction itself is not in question.
15-Minute Context: Execution Near Stretched Levels
On the 15-minute chart, used here only for timing, the picture is similarly stacked bullish. Price trades above the 20-period EMA at $162.18, which is above the 50-period EMA at $157.98 and the 200-period EMA at $153.11. RSI14 on this timeframe stands at 84, up from 83.01, deep into overbought territory. The MACD line is at 3.15 versus a signal of 2.46, with the histogram at 0.69.
The 15-minute Bollinger bands show a mid-band of $161.27, an upper band of $168.84 and a lower band of $153.70. Price is sitting just below that upper band. There is very little room left before the band itself would need to expand to accommodate further upside. The 15-minute pivot is at $167.32, with resistance (R1) at $168.07 and support (S1) at $166.91. Price is trading above R1, which has already been cleared on this timeframe.
News Flow Around SpaceX
A Seeking Alpha report published before Monday’s session noted that SPCX climbed 7% on Friday amid an AI satellite launch and the Crew-13 ISS mission.
Separately, a Yahoo Finance piece published Sunday compared SpaceX with Rocket Lab. It noted that SPCX closed at $158.96 on October 2 against Rocket Lab’s $73.92. The report observed that despite SpaceX being roughly forty times the size of Rocket Lab and neither company being profitable, the market charges a similar price for both.
A Motley Fool article published Sunday argued that SpaceX stock could close above $200 again before 2028. The stock has closed above that level only once. The view was tied to the possibility of a $10.4 billion quarter by the end of 2027. A separate Motley Fool piece published Saturday discussed the Starship program reaching orbit and argued its revenue-producing potential is too big to ignore. Meanwhile, a Yahoo Finance report published before Monday’s open flagged SpaceX’s upcoming earnings update. It described the update as a point worth watching for long-term investors, without disclosing specific figures.
Bullish Scenario
The bullish case for SpaceX stock rests on the daily trend remaining intact: EMA20 above EMA50, a positive MACD histogram, and RSI14 still below 70 despite the rally. For continuation, the stock would need to clear the 15-minute upper Bollinger band at $168.84, since price is currently just beneath it. On the longer timeframe, clearing the hourly resistance (R1) at $170.50, which sits just above the current price, would also support further upside. A sustained move through both levels, with the hourly and daily RSI14 readings holding below 80 and 70 respectively rather than rolling over, would keep the structure aligned across all three timeframes.
Bearish Scenario
On the other hand, the overbought readings on the hourly (79.88) and 15-minute (84) RSI14 leave room for a pullback even within an intact daily uptrend. The 15-minute pivot at $167.32 is a level to watch on the way down, followed by the 15-minute support (S1) at $166.91. A break below the hourly pivot at $164.59 would be a more meaningful signal, since it would put price back inside the hourly Bollinger band rather than above it. Further down, the daily resistance (R1) at $162.75 and the daily upper Bollinger band at $161.64 mark the zone where the current advance would need to hold. A slip back toward the daily pivot at $156.05 would materially weaken the bullish case built on this session’s gain.
Where SpaceX Stock Stands Now
Overall, SpaceX stock is trading at $168.35 as of 11:06 ET, up 5.91% versus Friday’s close of $158.96. The daily, hourly and 15-minute trends all point in the same direction. The daily picture shows a bullish MACD cross and the EMA20 above the EMA50, while the hourly chart confirms the trend with a fully stacked EMA alignment.
At the same time, RSI14 readings on both the hourly (79.88) and 15-minute (84) charts are deep into overbought territory. Price is trading above the upper Bollinger band on the daily and hourly timeframes, and just below it on the 15-minute chart. Daily ATR14 is at 7.04, up from 6.83. What remains uncertain is whether the next move is a continuation toward the hourly resistance (R1) at $170.50 or a pullback toward the hourly pivot at $164.59 and the daily resistance (R1) at $162.75. Those levels would test whether Monday’s advance has staying power.
FAQ
What is the current trend for SpaceX stock?
SpaceX stock shows a bullish daily trend. The 20-session EMA at $150.81 sits above the 50-session EMA at $147.21, the daily MACD histogram is positive at 0.96, and price at $168.35 trades above all key short-term moving averages.
Is SpaceX stock overbought right now?
On the daily timeframe, RSI14 at 67.51 remains below the 70 overbought threshold. However, hourly RSI14 is at 79.88 and 15-minute RSI14 is at 84, both in overbought territory. Price is also trading above the upper Bollinger band on the daily and hourly charts, and just below it on the 15-minute chart.
What are the key levels to watch for SpaceX stock?
On the upside, hourly resistance (R1) at $170.50 is the next level to clear. On the downside, the hourly pivot at $164.59 and the daily resistance (R1) at $162.75 are the first levels that would test the durability of Monday’s advance.
What news is affecting SpaceX stock?
Recent coverage includes a Seeking Alpha report noting SPCX climbed 7% on Friday, a Yahoo Finance comparison with Rocket Lab published Sunday, and a Yahoo Finance report published before Monday’s open flagging SpaceX’s upcoming earnings update.
Disclaimer: This article is for informational purposes only and does not constitute financial advice, an investment recommendation, or a solicitation to buy or sell any financial instrument. The analysis provided is not indicative of future results. Investing in financial markets carries a high risk of capital loss. Always do your own research (DYOR) and consult a qualified financial advisor before making any decision.
Cryptonomist and the author hold no positions in the financial instruments mentioned and receive no compensation from the companies covered.
Article produced with the assistance of artificial intelligence and reviewed by the editorial team.
200

Article
Solana’s new gold token lets investors trade physical gold on-chainGold just found a new home on the blockchain. Solana has launched DGLD, a tokenized gold product backed by physical gold from Swiss refiner MKS PAMP, giving the network its own entry into the asset-backed token race. The Solana gold token went live on October 5th, 2026, according to Coinfomania, and it arrives with two notable partners already lined up: SwissBorg for distribution and Arrakis Finance for liquidity.
Key takeaways
DGLD is a new tokenized gold asset on Solana, backed by physical gold from MKS PAMP.
SwissBorg’s app now lets its users buy gold directly using the DGLD token.
Arrakis Finance will manage DGLD’s liquidity to help keep trading stable.
The launch targets both retail and institutional interest in Solana’s DeFi ecosystem.
No trading volume figures for DGLD have been reported yet.
Solana Launches DGLD Gold Token Backed by Physical Gold
DGLD is designed to mirror the value of physical gold while living entirely on-chain. The token draws its backing from MKS PAMP, a Swiss refiner, which means every unit is tied to an actual gold reserve.
Tokenization Partnership with Swiss Refiner MKS PAMP
By sourcing its gold from MKS PAMP, Solana is leaning on an established refiner rather than building a custody system from scratch.
DGLD Provides a Blockchain-Based Investment Channel
It’s a digital asset backed by a physical one, which creates a blockchain-native alternative for anyone who wants gold exposure inside a crypto wallet.
Integration with SwissBorg and Liquidity Management via Arrakis Finance
The token’s real-world reach comes from its distribution deal with SwissBorg, which puts gold buying inside an app already used by more than a million people. Pairing that access with Arrakis Finance’s liquidity management is meant to keep DGLD trading smoothly from day one.
SwissBorg App Enables Direct Gold Purchases Using DGLD
SwissBorg users can now purchase gold directly through their app using the DGLD token, according to the report.
Arrakis Finance Could Enhance DGLD Trading Stability
Liquidity for DGLD is managed by Arrakis Finance, a partnership Coinfomania describes as strategic for enhancing trading stability.
Implications for Solana’s DeFi Ecosystem and Investor Appeal
The launch is framed as a strategic expansion for Solana into the asset-backed token space, aimed at drawing in both retail traders and institutional players looking for diversified exposure. Solana’s reputation for high throughput and low transaction costs makes it a practical home for an asset meant to trade frequently and cheaply.
Attracting Retail and Institutional Investors
The broader crypto market is showing mixed signals right now, but the SwissBorg gold investment channel gives DGLD a built-in user base to tap into from the start, rather than relying purely on organic discovery.
Potential Impact on User Engagement and Trading Activity
No specific trading volume data for DGLD is available yet. Adoption metrics and how well Arrakis Finance liquidity support performs in the early days are expected to be the clearest signals of whether the token gains traction on Solana and within SwissBorg’s user base.
Article produced with the assistance of artificial intelligence and reviewed by the editorial team.
Solana’s new gold token lets investors trade physical gold on-chain
Gold just found a new home on the blockchain. Solana has launched DGLD, a tokenized gold product backed by physical gold from Swiss refiner MKS PAMP, giving the network its own entry into the asset-backed token race. The Solana gold token went live on October 5th, 2026, according to Coinfomania, and it arrives with two notable partners already lined up: SwissBorg for distribution and Arrakis Finance for liquidity.
Key takeaways
DGLD is a new tokenized gold asset on Solana, backed by physical gold from MKS PAMP.
SwissBorg’s app now lets its users buy gold directly using the DGLD token.
Arrakis Finance will manage DGLD’s liquidity to help keep trading stable.
The launch targets both retail and institutional interest in Solana’s DeFi ecosystem.
No trading volume figures for DGLD have been reported yet.
Solana Launches DGLD Gold Token Backed by Physical Gold
DGLD is designed to mirror the value of physical gold while living entirely on-chain. The token draws its backing from MKS PAMP, a Swiss refiner, which means every unit is tied to an actual gold reserve.
Tokenization Partnership with Swiss Refiner MKS PAMP
By sourcing its gold from MKS PAMP, Solana is leaning on an established refiner rather than building a custody system from scratch.
DGLD Provides a Blockchain-Based Investment Channel
It’s a digital asset backed by a physical one, which creates a blockchain-native alternative for anyone who wants gold exposure inside a crypto wallet.
Integration with SwissBorg and Liquidity Management via Arrakis Finance
The token’s real-world reach comes from its distribution deal with SwissBorg, which puts gold buying inside an app already used by more than a million people. Pairing that access with Arrakis Finance’s liquidity management is meant to keep DGLD trading smoothly from day one.
SwissBorg App Enables Direct Gold Purchases Using DGLD
SwissBorg users can now purchase gold directly through their app using the DGLD token, according to the report.
Arrakis Finance Could Enhance DGLD Trading Stability
Liquidity for DGLD is managed by Arrakis Finance, a partnership Coinfomania describes as strategic for enhancing trading stability.
Implications for Solana’s DeFi Ecosystem and Investor Appeal
The launch is framed as a strategic expansion for Solana into the asset-backed token space, aimed at drawing in both retail traders and institutional players looking for diversified exposure. Solana’s reputation for high throughput and low transaction costs makes it a practical home for an asset meant to trade frequently and cheaply.
Attracting Retail and Institutional Investors
The broader crypto market is showing mixed signals right now, but the SwissBorg gold investment channel gives DGLD a built-in user base to tap into from the start, rather than relying purely on organic discovery.
Potential Impact on User Engagement and Trading Activity
No specific trading volume data for DGLD is available yet. Adoption metrics and how well Arrakis Finance liquidity support performs in the early days are expected to be the clearest signals of whether the token gains traction on Solana and within SwissBorg’s user base.
Article produced with the assistance of artificial intelligence and reviewed by the editorial team.
Key takeaways
DGLD is a new tokenized gold asset on Solana, backed by physical gold from MKS PAMP.
SwissBorg’s app now lets its users buy gold directly using the DGLD token.
Arrakis Finance will manage DGLD’s liquidity to help keep trading stable.
The launch targets both retail and institutional interest in Solana’s DeFi ecosystem.
No trading volume figures for DGLD have been reported yet.
Solana Launches DGLD Gold Token Backed by Physical Gold
DGLD is designed to mirror the value of physical gold while living entirely on-chain. The token draws its backing from MKS PAMP, a Swiss refiner, which means every unit is tied to an actual gold reserve.
Tokenization Partnership with Swiss Refiner MKS PAMP
By sourcing its gold from MKS PAMP, Solana is leaning on an established refiner rather than building a custody system from scratch.
DGLD Provides a Blockchain-Based Investment Channel
It’s a digital asset backed by a physical one, which creates a blockchain-native alternative for anyone who wants gold exposure inside a crypto wallet.
Integration with SwissBorg and Liquidity Management via Arrakis Finance
The token’s real-world reach comes from its distribution deal with SwissBorg, which puts gold buying inside an app already used by more than a million people. Pairing that access with Arrakis Finance’s liquidity management is meant to keep DGLD trading smoothly from day one.
SwissBorg App Enables Direct Gold Purchases Using DGLD
SwissBorg users can now purchase gold directly through their app using the DGLD token, according to the report.
Arrakis Finance Could Enhance DGLD Trading Stability
Liquidity for DGLD is managed by Arrakis Finance, a partnership Coinfomania describes as strategic for enhancing trading stability.
Implications for Solana’s DeFi Ecosystem and Investor Appeal
The launch is framed as a strategic expansion for Solana into the asset-backed token space, aimed at drawing in both retail traders and institutional players looking for diversified exposure. Solana’s reputation for high throughput and low transaction costs makes it a practical home for an asset meant to trade frequently and cheaply.
Attracting Retail and Institutional Investors
The broader crypto market is showing mixed signals right now, but the SwissBorg gold investment channel gives DGLD a built-in user base to tap into from the start, rather than relying purely on organic discovery.
Potential Impact on User Engagement and Trading Activity
No specific trading volume data for DGLD is available yet. Adoption metrics and how well Arrakis Finance liquidity support performs in the early days are expected to be the clearest signals of whether the token gains traction on Solana and within SwissBorg’s user base.
Article produced with the assistance of artificial intelligence and reviewed by the editorial team.
1
110

Article
Bybit hack investigation links $1B laundering ring to North Korea’s Lazarus GroupA blockchain investigator going by the handle ZachXBT says he infiltrated a Chinese crime syndicate tied to the laundering of more than $1 billion in stolen crypto funds, intelligence that fed directly into the ongoing Bybit hack investigation. The syndicate, according to ZachXBT, moved those funds on behalf of North Korea’s Lazarus Group, and the intel gathered during the infiltration reportedly helped authorities freeze some of the assets stolen from Bybit.
The claim surfaced on October 5, 2026, and was reported by Coinfomania. Bybit is a cryptocurrency exchange best known for derivatives trading, and the disclosure arrives while the exchange is still working through the fallout of its earlier hack.
Key takeaways
ZachXBT says he infiltrated a Chinese syndicate that laundered over $1 billion for the Lazarus Group.
Intel from that infiltration reportedly helped freeze funds stolen from Bybit.
The Lazarus Group’s North Korea ties keep the case tied to wider law enforcement concerns.
ZachXBT Uncovers Crime Syndicate Linked to Bybit Hack
ZachXBT’s infiltration targeted a network accused of laundering well over $1 billion in illicit crypto proceeds. The syndicate’s laundering operation was reportedly run on behalf of North Korea’s Lazarus Group, a connection that places the case inside a much longer pattern of state-linked crypto theft. Coinfomania’s report frames the discovery as a direct line between the syndicate’s money-laundering machinery and the funds taken in the Bybit breach.
Impact of Intel on Freezing Stolen Funds
The intelligence ZachXBT gathered while embedded in the syndicate reportedly helped freeze a portion of the funds stolen during the Bybit hack.
Bybit’s Security Challenges and Market Impact
The outlet noted the case highlights ongoing security challenges across the crypto industry and suggested regulatory scrutiny of exchanges tied to the Lazarus Group’s activity could increase.
Article produced with the assistance of artificial intelligence and reviewed by the editorial team.
Bybit hack investigation links $1B laundering ring to North Korea’s Lazarus Group
A blockchain investigator going by the handle ZachXBT says he infiltrated a Chinese crime syndicate tied to the laundering of more than $1 billion in stolen crypto funds, intelligence that fed directly into the ongoing Bybit hack investigation. The syndicate, according to ZachXBT, moved those funds on behalf of North Korea’s Lazarus Group, and the intel gathered during the infiltration reportedly helped authorities freeze some of the assets stolen from Bybit.
The claim surfaced on October 5, 2026, and was reported by Coinfomania. Bybit is a cryptocurrency exchange best known for derivatives trading, and the disclosure arrives while the exchange is still working through the fallout of its earlier hack.
Key takeaways
ZachXBT says he infiltrated a Chinese syndicate that laundered over $1 billion for the Lazarus Group.
Intel from that infiltration reportedly helped freeze funds stolen from Bybit.
The Lazarus Group’s North Korea ties keep the case tied to wider law enforcement concerns.
ZachXBT Uncovers Crime Syndicate Linked to Bybit Hack
ZachXBT’s infiltration targeted a network accused of laundering well over $1 billion in illicit crypto proceeds. The syndicate’s laundering operation was reportedly run on behalf of North Korea’s Lazarus Group, a connection that places the case inside a much longer pattern of state-linked crypto theft. Coinfomania’s report frames the discovery as a direct line between the syndicate’s money-laundering machinery and the funds taken in the Bybit breach.
Impact of Intel on Freezing Stolen Funds
The intelligence ZachXBT gathered while embedded in the syndicate reportedly helped freeze a portion of the funds stolen during the Bybit hack.
Bybit’s Security Challenges and Market Impact
The outlet noted the case highlights ongoing security challenges across the crypto industry and suggested regulatory scrutiny of exchanges tied to the Lazarus Group’s activity could increase.
Article produced with the assistance of artificial intelligence and reviewed by the editorial team.
The claim surfaced on October 5, 2026, and was reported by Coinfomania. Bybit is a cryptocurrency exchange best known for derivatives trading, and the disclosure arrives while the exchange is still working through the fallout of its earlier hack.
Key takeaways
ZachXBT says he infiltrated a Chinese syndicate that laundered over $1 billion for the Lazarus Group.
Intel from that infiltration reportedly helped freeze funds stolen from Bybit.
The Lazarus Group’s North Korea ties keep the case tied to wider law enforcement concerns.
ZachXBT Uncovers Crime Syndicate Linked to Bybit Hack
ZachXBT’s infiltration targeted a network accused of laundering well over $1 billion in illicit crypto proceeds. The syndicate’s laundering operation was reportedly run on behalf of North Korea’s Lazarus Group, a connection that places the case inside a much longer pattern of state-linked crypto theft. Coinfomania’s report frames the discovery as a direct line between the syndicate’s money-laundering machinery and the funds taken in the Bybit breach.
Impact of Intel on Freezing Stolen Funds
The intelligence ZachXBT gathered while embedded in the syndicate reportedly helped freeze a portion of the funds stolen during the Bybit hack.
Bybit’s Security Challenges and Market Impact
The outlet noted the case highlights ongoing security challenges across the crypto industry and suggested regulatory scrutiny of exchanges tied to the Lazarus Group’s activity could increase.
Article produced with the assistance of artificial intelligence and reviewed by the editorial team.
27

Article
SignSplit’s strategic seed funding hits $400M, valuing startup at $1 billionSignSplit PBC emerged from stealth on October 5, 2026, announcing a $400 million strategic seed round that values the company at $1 billion. The funding, secured with W Group, backs a new kind of infrastructure the company calls the signed-data economy — a system meant to let people and institutions license and get paid for their own data, work and likeness as AI systems increasingly rely on real-world human input.
Key takeaways
SignSplit raised $400 million in a strategic seed round, reaching a $1 billion valuation.
W Group, a fintech ecosystem serving more than 40 million users in 150 countries, is the strategic investor.
The company’s “signed data” concept ties consent, provenance and defined terms to human-generated content.
SignSplit, founded in 2024, targets AI and robotics firms, researchers and digital platforms as customers.
SignSplit’s $400 Million Strategic Seed Round at a $1 Billion Valuation
The SignSplit strategic seed funding combines capital with what the company describes as a multi-year package of strategic resources meant to support its global rollout, according to a press release distributed via PR Newswire. The financing values SignSplit at $1 billion and marks the company’s formal exit from stealth mode.
The round’s strategic investor and partner is W Group, which the release characterizes as a global fintech and technology ecosystem serving more than 40 million users across 150 countries. The company brings together 11 businesses and more than 1,500 team members across 15 locations worldwide, according to its own description in the release.
What “Signed Data” Means for AI and Robotics
SignSplit’s platform is built around a concept the company itself coined: signed data, meaning data, work or likeness that carries clear consent, provenance and defined terms of use. The idea responds to a trend the company highlights — that future AI models, robotics systems and research tools will depend heavily on real-world human knowledge, creativity and experience across fields like healthcare, science and entertainment.
Through the platform, contributors can license their data, skills or likeness and receive compensation, while AI and robotics companies, researchers and other organizations draw on data pools built for their specific needs. SignSplit also built a verification layer designed to let AI systems, social platforms and other digital services recognize signed content and retrieve its provenance, consent terms and usage rights.
“SignSplit provides solutions for a world where the boundary between human experience and technology is becoming increasingly fluid,” said Alessandro Monterosso, Co-Founder and CEO of SignSplit. “As AI reaches further into the real world, human knowledge, creativity, skills and identity will become increasingly connected to how technology evolves and interacts with the world around us.”
W Group’s Strategic Bet on the Data Economy
W Group’s commitment reflects confidence that signed-data infrastructure will become standard across the AI industry, according to the company’s own framing of the deal. Volodymyr Nosov, Founder and President of W Group, said in the release: “We believe that every serious participant in AI and the data economy will come to rely on SignSplit’s infrastructure. The scale of our commitment reflects both how early we believe we are, and how important we believe these solutions are for every industry that relies on human data.”
Founding Team and Company Structure
SignSplit was founded in 2024 and is incorporated as a Delaware Public Benefit Corporation. Glib Denisov, Co-Founder, Executive Chairman and Chief Product Officer, said the team built the company anticipating where AI was headed rather than where it stood at the time. “We saw that the next generation of AI would need more than additional data — it would need higher-quality, real-world data with clear provenance, permission and rights attached to it,” Denisov said.
Alessandro Monterosso serves as Co-Founder and CEO.
Article produced with the assistance of artificial intelligence and reviewed by the editorial team.
SignSplit’s strategic seed funding hits $400M, valuing startup at $1 billion
SignSplit PBC emerged from stealth on October 5, 2026, announcing a $400 million strategic seed round that values the company at $1 billion. The funding, secured with W Group, backs a new kind of infrastructure the company calls the signed-data economy — a system meant to let people and institutions license and get paid for their own data, work and likeness as AI systems increasingly rely on real-world human input.
Key takeaways
SignSplit raised $400 million in a strategic seed round, reaching a $1 billion valuation.
W Group, a fintech ecosystem serving more than 40 million users in 150 countries, is the strategic investor.
The company’s “signed data” concept ties consent, provenance and defined terms to human-generated content.
SignSplit, founded in 2024, targets AI and robotics firms, researchers and digital platforms as customers.
SignSplit’s $400 Million Strategic Seed Round at a $1 Billion Valuation
The SignSplit strategic seed funding combines capital with what the company describes as a multi-year package of strategic resources meant to support its global rollout, according to a press release distributed via PR Newswire. The financing values SignSplit at $1 billion and marks the company’s formal exit from stealth mode.
The round’s strategic investor and partner is W Group, which the release characterizes as a global fintech and technology ecosystem serving more than 40 million users across 150 countries. The company brings together 11 businesses and more than 1,500 team members across 15 locations worldwide, according to its own description in the release.
What “Signed Data” Means for AI and Robotics
SignSplit’s platform is built around a concept the company itself coined: signed data, meaning data, work or likeness that carries clear consent, provenance and defined terms of use. The idea responds to a trend the company highlights — that future AI models, robotics systems and research tools will depend heavily on real-world human knowledge, creativity and experience across fields like healthcare, science and entertainment.
Through the platform, contributors can license their data, skills or likeness and receive compensation, while AI and robotics companies, researchers and other organizations draw on data pools built for their specific needs. SignSplit also built a verification layer designed to let AI systems, social platforms and other digital services recognize signed content and retrieve its provenance, consent terms and usage rights.
“SignSplit provides solutions for a world where the boundary between human experience and technology is becoming increasingly fluid,” said Alessandro Monterosso, Co-Founder and CEO of SignSplit. “As AI reaches further into the real world, human knowledge, creativity, skills and identity will become increasingly connected to how technology evolves and interacts with the world around us.”
W Group’s Strategic Bet on the Data Economy
W Group’s commitment reflects confidence that signed-data infrastructure will become standard across the AI industry, according to the company’s own framing of the deal. Volodymyr Nosov, Founder and President of W Group, said in the release: “We believe that every serious participant in AI and the data economy will come to rely on SignSplit’s infrastructure. The scale of our commitment reflects both how early we believe we are, and how important we believe these solutions are for every industry that relies on human data.”
Founding Team and Company Structure
SignSplit was founded in 2024 and is incorporated as a Delaware Public Benefit Corporation. Glib Denisov, Co-Founder, Executive Chairman and Chief Product Officer, said the team built the company anticipating where AI was headed rather than where it stood at the time. “We saw that the next generation of AI would need more than additional data — it would need higher-quality, real-world data with clear provenance, permission and rights attached to it,” Denisov said.
Alessandro Monterosso serves as Co-Founder and CEO.
Article produced with the assistance of artificial intelligence and reviewed by the editorial team.
Key takeaways
SignSplit raised $400 million in a strategic seed round, reaching a $1 billion valuation.
W Group, a fintech ecosystem serving more than 40 million users in 150 countries, is the strategic investor.
The company’s “signed data” concept ties consent, provenance and defined terms to human-generated content.
SignSplit, founded in 2024, targets AI and robotics firms, researchers and digital platforms as customers.
SignSplit’s $400 Million Strategic Seed Round at a $1 Billion Valuation
The SignSplit strategic seed funding combines capital with what the company describes as a multi-year package of strategic resources meant to support its global rollout, according to a press release distributed via PR Newswire. The financing values SignSplit at $1 billion and marks the company’s formal exit from stealth mode.
The round’s strategic investor and partner is W Group, which the release characterizes as a global fintech and technology ecosystem serving more than 40 million users across 150 countries. The company brings together 11 businesses and more than 1,500 team members across 15 locations worldwide, according to its own description in the release.
What “Signed Data” Means for AI and Robotics
SignSplit’s platform is built around a concept the company itself coined: signed data, meaning data, work or likeness that carries clear consent, provenance and defined terms of use. The idea responds to a trend the company highlights — that future AI models, robotics systems and research tools will depend heavily on real-world human knowledge, creativity and experience across fields like healthcare, science and entertainment.
Through the platform, contributors can license their data, skills or likeness and receive compensation, while AI and robotics companies, researchers and other organizations draw on data pools built for their specific needs. SignSplit also built a verification layer designed to let AI systems, social platforms and other digital services recognize signed content and retrieve its provenance, consent terms and usage rights.
“SignSplit provides solutions for a world where the boundary between human experience and technology is becoming increasingly fluid,” said Alessandro Monterosso, Co-Founder and CEO of SignSplit. “As AI reaches further into the real world, human knowledge, creativity, skills and identity will become increasingly connected to how technology evolves and interacts with the world around us.”
W Group’s Strategic Bet on the Data Economy
W Group’s commitment reflects confidence that signed-data infrastructure will become standard across the AI industry, according to the company’s own framing of the deal. Volodymyr Nosov, Founder and President of W Group, said in the release: “We believe that every serious participant in AI and the data economy will come to rely on SignSplit’s infrastructure. The scale of our commitment reflects both how early we believe we are, and how important we believe these solutions are for every industry that relies on human data.”
Founding Team and Company Structure
SignSplit was founded in 2024 and is incorporated as a Delaware Public Benefit Corporation. Glib Denisov, Co-Founder, Executive Chairman and Chief Product Officer, said the team built the company anticipating where AI was headed rather than where it stood at the time. “We saw that the next generation of AI would need more than additional data — it would need higher-quality, real-world data with clear provenance, permission and rights attached to it,” Denisov said.
Alessandro Monterosso serves as Co-Founder and CEO.
Article produced with the assistance of artificial intelligence and reviewed by the editorial team.
37
Article
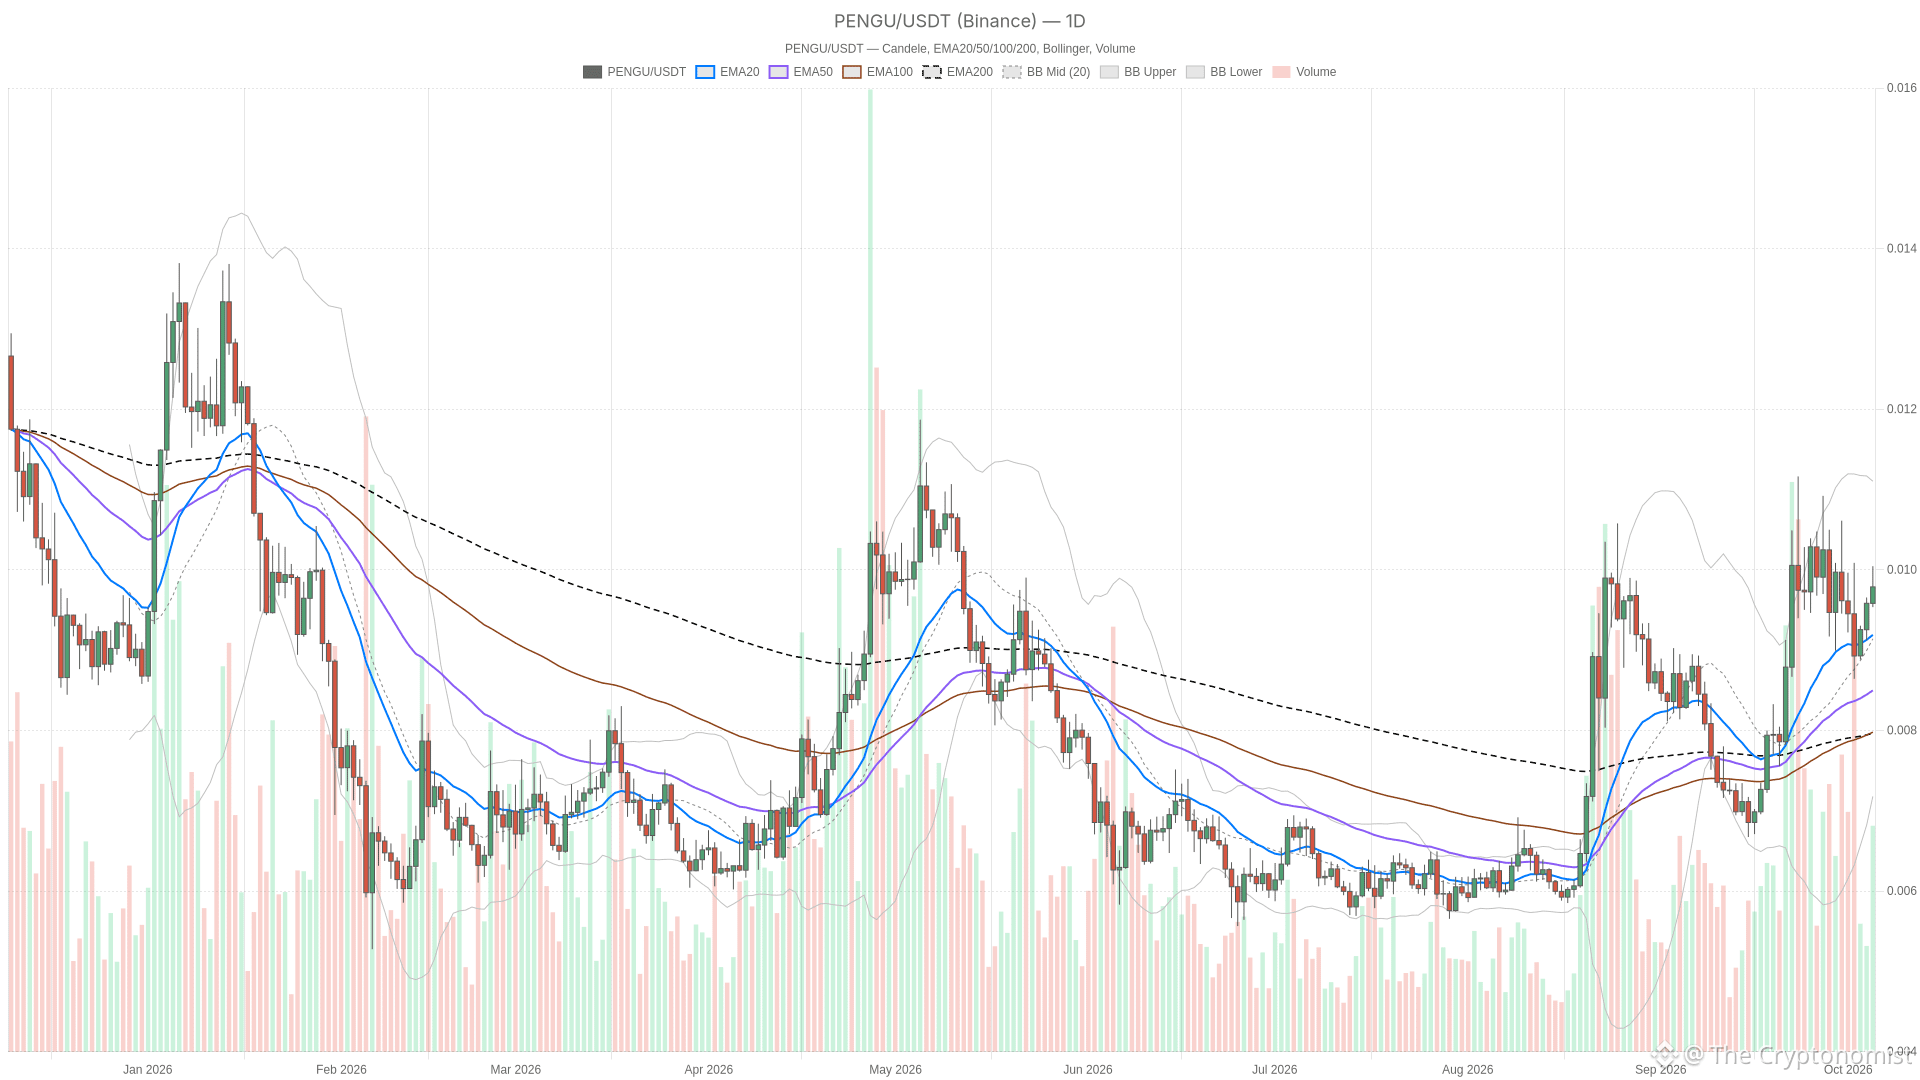
Pengu holds above $0.009785 resistance as hourly momentum turns negativeAs of October 5, 2026, the Pengu price trades at $0.009787 on Binance, just above the daily R1 pivot at $0.009785. That level acted as resistance on the prior close and now faces a test as support — holding above it through the next daily close would confirm genuine trend continuation.
PENGU/USDT — daily chart with candlesticks, EMA20/EMA50 and volume.
Key takeaways
PENGU trades at $0.009787, holding just above the daily R1 pivot at $0.009785
Daily EMA structure remains bullish with price above the EMA20, EMA50, and EMA200 in proper alignment
Daily RSI at 56.5 signals room to run, but the hourly MACD histogram has turned negative
The Fear & Greed Index reads 70 (Greed) while total crypto market cap is down 0.84%
A daily close above $0.009785 would confirm the bullish case; a close below $0.009453 would invalidate it
The tension in this setup is between a daily chart that still looks constructive and shorter-term momentum that’s starting to wobble. On the daily timeframe, price sits above the EMA20, EMA50 and EMA200, with the averages stacked in a textbook bullish order — that’s the dominant structural force right now.
The hourly and 15-minute pictures, however, are messier, with momentum indicators losing conviction even as price grinds sideways to slightly higher. When the bigger trend is intact but the smaller timeframes start dragging their feet, it usually means the market is deciding whether to consolidate before the next leg or quietly roll over.
Pengu price action tests daily R1 as broader market cap dips 0.84%
There’s no PENGU-specific news or DEX flow in the data to point to, so the backdrop here is purely macro. CoinGecko’s figures put total crypto market capitalization at roughly $2.94 trillion, down 0.84% over the past 24 hours, with Bitcoin dominance at 58.79%. That’s a mildly risk-off tone at the index level, even if it’s not dramatic. Meanwhile, the Fear & Greed Index from Alternative.me reads 70, which lands in “Greed” territory — sentiment is leaning optimistic even as the aggregate market cap ticks lower, a contradiction worth keeping in mind when sizing up conviction behind the current PENGU move.
EMA structure stays bullish on daily but the hourly averages aren’t aligned
On the daily chart, price trades above all three EMAs — the 20 at $0.0091273, the 50 at $0.0084456 and the 200 at $0.0079447 — and the order is bullish, meaning the 20 sits above the 50 which sits above the 200. That’s the cleanest bullish structure on the board and the main reason the broader bias still leans constructive.
The hourly tells a slightly different story. Price is also above its EMA20 ($0.0097135), EMA50 ($0.0095327) and EMA200 ($0.0096059), but the EMA order itself is mixed rather than aligned. The averages aren’t stacked the way they are on daily, which points to recent chop rather than a clean trend on that timeframe.
On the 15-minute chart, price is below the EMA20 ($0.0098392) and EMA50 ($0.0097939) but still above the EMA200 ($0.0095451), even though the EMA order there is bullish. In other words, the short-term averages are stacked correctly in theory, but price has slipped beneath the two faster ones — a sign of short-term fatigue inside a still-intact bigger structure.
Daily RSI keeps climbing while the MACD histogram tells a more cautious story
Daily RSI has climbed from 50.7 to 53.7 to 56.5 across the last three completed candles — nowhere near overbought, but clearly gaining ground and consistent with the bullish EMA backdrop. The hourly RSI, at 58.99, has been choppier: 64.8, then 56.5, then 59.0, a mixed sequence that doesn’t give a clean read either way. The 15-minute RSI has been climbing too, from 45.3 to 49.4 to 54.3, suggesting the micro-trend is trying to turn up again after cooling off.
MACD is where the daily picture gets more interesting. The daily histogram is negative and widening — it’s gone from -0.0000115 to -0.0000409 to -0.0000403 over the last three closed candles — which signals that upside momentum has been fading even while price itself keeps grinding higher. That’s a classic case of price and momentum disagreeing, and it’s worth taking seriously rather than dismissing.
On the hourly, the histogram has just crossed into negative territory, flipping from a positive 0.0000064 to -0.00000518 and then -0.00000971, which lines up with the mixed hourly RSI and the non-aligned EMA order. Momentum on that timeframe has genuinely turned down, at least for now. The 15-minute histogram is also negative but narrowing, moving from -0.000012 to -0.00000967 to -0.00000436, pointing to downside pressure fading at the micro level even if it hasn’t flipped positive yet.
Bollinger Bands add context on how stretched price is. On daily, PENGU trades above the band’s mid-point at $0.0089942 but still well below the upper band at $0.011169, so there’s room before any overextension signal kicks in. On the hourly, price sits just above the mid-band at $0.0097259 and below the upper band at $0.010048.
On the 15-minute chart, price has drifted below its mid-band of $0.0098379 and is sitting closer to the lower band at $0.009736, reinforcing the sense of short-term consolidation rather than a clean breakout structure. Daily ATR stands at roughly $0.00086, which relative to the current price represents a sizable potential daily range — a reminder that moves in either direction could be sharp even while the bigger trend holds.
Key levels and how the bull and bear cases split from here
The pivot structure is the clearest way to frame what happens next for PENGU. On daily, R1 sits at $0.009785 — a level price is currently trading just above intraday, even though the prior daily close of $0.009583 was still beneath it. The daily pivot sits lower at $0.009453, daily S1 at $0.009251, and the daily Bollinger upper band caps the chart at $0.011169.
On the hourly, the pivot is at $0.0098157 with R1 at $0.0098753 above it, while hourly S1 sits at $0.0097663 below. Notably, the current hourly price of $0.009781 is trading just under its own pivot, which is the clearest sign of the tension between the still-bullish daily frame and a hesitant hourly one.
Bullish scenario: a daily close above the daily R1 at $0.009785 would confirm the reclaim that’s currently only showing up intraday, and would open the path toward the daily Bollinger upper band at $0.011169. This case is invalidated if the daily candle closes back below the daily pivot at $0.009453, which would expose daily S1 at $0.009251 and undercut the bullish EMA structure that’s currently supporting the broader bias.
Bearish scenario: a daily close back below the daily R1 at $0.009785 would suggest the intraday push above it was a false start, pulling price toward the daily pivot at $0.009453 and potentially daily S1 at $0.009251. That bearish read gets undercut if the hourly candle closes back above the hourly R1 at $0.0098753 — a move that would hint that buyers are absorbing the dip before the daily candle even confirms a breakdown.
Given that daily momentum is already diverging from price even in the bullish scenario, and that the Fear & Greed reading of 70 shows sentiment running hotter than the mixed hourly and 15-minute signals really justify, the most likely false signal here is a quick push through daily R1 that fails to hold by the close. That’s exactly the kind of move that would trap late bulls if the hourly weakness bleeds back into the daily chart.
FAQ
Where does PENGU trade right now?
PENGU trades at $0.009787 on Binance, just above the daily R1 pivot at $0.009785, after the last completed daily candle closed at $0.009583.
Is PENGU overbought or oversold?
No. The daily RSI reads 56.5, the hourly sits at 58.99, and the 15-minute is at 54.34 — none of these are in overbought or oversold territory based on the current readings.
What would confirm a bullish continuation for PENGU?
A daily close above the daily R1 at $0.009785 would confirm the move, with the daily Bollinger upper band at $0.011169 as the next level in view. This is invalidated by a daily close below the daily pivot at $0.009453.
What would confirm a bearish move for PENGU?
A daily close back below the daily R1 at $0.009785 would point toward the daily pivot at $0.009453 and daily S1 at $0.009251.
Disclaimer: This article is for informational purposes only and does not constitute financial advice, an investment recommendation, or a solicitation to buy or sell any financial instrument or cryptocurrency. The analysis provided is not indicative of future results. Investing in crypto assets and financial markets carries a high risk of capital loss. Always do your own research (DYOR) and consult a qualified financial advisor before making any decision.
Article produced with the assistance of artificial intelligence and reviewed by the editorial team.
Pengu holds above $0.009785 resistance as hourly momentum turns negative
As of October 5, 2026, the Pengu price trades at $0.009787 on Binance, just above the daily R1 pivot at $0.009785. That level acted as resistance on the prior close and now faces a test as support — holding above it through the next daily close would confirm genuine trend continuation.
PENGU/USDT — daily chart with candlesticks, EMA20/EMA50 and volume.
Key takeaways
PENGU trades at $0.009787, holding just above the daily R1 pivot at $0.009785
Daily EMA structure remains bullish with price above the EMA20, EMA50, and EMA200 in proper alignment
Daily RSI at 56.5 signals room to run, but the hourly MACD histogram has turned negative
The Fear & Greed Index reads 70 (Greed) while total crypto market cap is down 0.84%
A daily close above $0.009785 would confirm the bullish case; a close below $0.009453 would invalidate it
The tension in this setup is between a daily chart that still looks constructive and shorter-term momentum that’s starting to wobble. On the daily timeframe, price sits above the EMA20, EMA50 and EMA200, with the averages stacked in a textbook bullish order — that’s the dominant structural force right now.
The hourly and 15-minute pictures, however, are messier, with momentum indicators losing conviction even as price grinds sideways to slightly higher. When the bigger trend is intact but the smaller timeframes start dragging their feet, it usually means the market is deciding whether to consolidate before the next leg or quietly roll over.
Pengu price action tests daily R1 as broader market cap dips 0.84%
There’s no PENGU-specific news or DEX flow in the data to point to, so the backdrop here is purely macro. CoinGecko’s figures put total crypto market capitalization at roughly $2.94 trillion, down 0.84% over the past 24 hours, with Bitcoin dominance at 58.79%. That’s a mildly risk-off tone at the index level, even if it’s not dramatic. Meanwhile, the Fear & Greed Index from Alternative.me reads 70, which lands in “Greed” territory — sentiment is leaning optimistic even as the aggregate market cap ticks lower, a contradiction worth keeping in mind when sizing up conviction behind the current PENGU move.
EMA structure stays bullish on daily but the hourly averages aren’t aligned
On the daily chart, price trades above all three EMAs — the 20 at $0.0091273, the 50 at $0.0084456 and the 200 at $0.0079447 — and the order is bullish, meaning the 20 sits above the 50 which sits above the 200. That’s the cleanest bullish structure on the board and the main reason the broader bias still leans constructive.
The hourly tells a slightly different story. Price is also above its EMA20 ($0.0097135), EMA50 ($0.0095327) and EMA200 ($0.0096059), but the EMA order itself is mixed rather than aligned. The averages aren’t stacked the way they are on daily, which points to recent chop rather than a clean trend on that timeframe.
On the 15-minute chart, price is below the EMA20 ($0.0098392) and EMA50 ($0.0097939) but still above the EMA200 ($0.0095451), even though the EMA order there is bullish. In other words, the short-term averages are stacked correctly in theory, but price has slipped beneath the two faster ones — a sign of short-term fatigue inside a still-intact bigger structure.
Daily RSI keeps climbing while the MACD histogram tells a more cautious story
Daily RSI has climbed from 50.7 to 53.7 to 56.5 across the last three completed candles — nowhere near overbought, but clearly gaining ground and consistent with the bullish EMA backdrop. The hourly RSI, at 58.99, has been choppier: 64.8, then 56.5, then 59.0, a mixed sequence that doesn’t give a clean read either way. The 15-minute RSI has been climbing too, from 45.3 to 49.4 to 54.3, suggesting the micro-trend is trying to turn up again after cooling off.
MACD is where the daily picture gets more interesting. The daily histogram is negative and widening — it’s gone from -0.0000115 to -0.0000409 to -0.0000403 over the last three closed candles — which signals that upside momentum has been fading even while price itself keeps grinding higher. That’s a classic case of price and momentum disagreeing, and it’s worth taking seriously rather than dismissing.
On the hourly, the histogram has just crossed into negative territory, flipping from a positive 0.0000064 to -0.00000518 and then -0.00000971, which lines up with the mixed hourly RSI and the non-aligned EMA order. Momentum on that timeframe has genuinely turned down, at least for now. The 15-minute histogram is also negative but narrowing, moving from -0.000012 to -0.00000967 to -0.00000436, pointing to downside pressure fading at the micro level even if it hasn’t flipped positive yet.
Bollinger Bands add context on how stretched price is. On daily, PENGU trades above the band’s mid-point at $0.0089942 but still well below the upper band at $0.011169, so there’s room before any overextension signal kicks in. On the hourly, price sits just above the mid-band at $0.0097259 and below the upper band at $0.010048.
On the 15-minute chart, price has drifted below its mid-band of $0.0098379 and is sitting closer to the lower band at $0.009736, reinforcing the sense of short-term consolidation rather than a clean breakout structure. Daily ATR stands at roughly $0.00086, which relative to the current price represents a sizable potential daily range — a reminder that moves in either direction could be sharp even while the bigger trend holds.
Key levels and how the bull and bear cases split from here
The pivot structure is the clearest way to frame what happens next for PENGU. On daily, R1 sits at $0.009785 — a level price is currently trading just above intraday, even though the prior daily close of $0.009583 was still beneath it. The daily pivot sits lower at $0.009453, daily S1 at $0.009251, and the daily Bollinger upper band caps the chart at $0.011169.
On the hourly, the pivot is at $0.0098157 with R1 at $0.0098753 above it, while hourly S1 sits at $0.0097663 below. Notably, the current hourly price of $0.009781 is trading just under its own pivot, which is the clearest sign of the tension between the still-bullish daily frame and a hesitant hourly one.
Bullish scenario: a daily close above the daily R1 at $0.009785 would confirm the reclaim that’s currently only showing up intraday, and would open the path toward the daily Bollinger upper band at $0.011169. This case is invalidated if the daily candle closes back below the daily pivot at $0.009453, which would expose daily S1 at $0.009251 and undercut the bullish EMA structure that’s currently supporting the broader bias.
Bearish scenario: a daily close back below the daily R1 at $0.009785 would suggest the intraday push above it was a false start, pulling price toward the daily pivot at $0.009453 and potentially daily S1 at $0.009251. That bearish read gets undercut if the hourly candle closes back above the hourly R1 at $0.0098753 — a move that would hint that buyers are absorbing the dip before the daily candle even confirms a breakdown.
Given that daily momentum is already diverging from price even in the bullish scenario, and that the Fear & Greed reading of 70 shows sentiment running hotter than the mixed hourly and 15-minute signals really justify, the most likely false signal here is a quick push through daily R1 that fails to hold by the close. That’s exactly the kind of move that would trap late bulls if the hourly weakness bleeds back into the daily chart.
FAQ
Where does PENGU trade right now?
PENGU trades at $0.009787 on Binance, just above the daily R1 pivot at $0.009785, after the last completed daily candle closed at $0.009583.
Is PENGU overbought or oversold?
No. The daily RSI reads 56.5, the hourly sits at 58.99, and the 15-minute is at 54.34 — none of these are in overbought or oversold territory based on the current readings.
What would confirm a bullish continuation for PENGU?
A daily close above the daily R1 at $0.009785 would confirm the move, with the daily Bollinger upper band at $0.011169 as the next level in view. This is invalidated by a daily close below the daily pivot at $0.009453.
What would confirm a bearish move for PENGU?
A daily close back below the daily R1 at $0.009785 would point toward the daily pivot at $0.009453 and daily S1 at $0.009251.
Disclaimer: This article is for informational purposes only and does not constitute financial advice, an investment recommendation, or a solicitation to buy or sell any financial instrument or cryptocurrency. The analysis provided is not indicative of future results. Investing in crypto assets and financial markets carries a high risk of capital loss. Always do your own research (DYOR) and consult a qualified financial advisor before making any decision.
Article produced with the assistance of artificial intelligence and reviewed by the editorial team.
PENGU/USDT — daily chart with candlesticks, EMA20/EMA50 and volume.
Key takeaways
PENGU trades at $0.009787, holding just above the daily R1 pivot at $0.009785
Daily EMA structure remains bullish with price above the EMA20, EMA50, and EMA200 in proper alignment
Daily RSI at 56.5 signals room to run, but the hourly MACD histogram has turned negative
The Fear & Greed Index reads 70 (Greed) while total crypto market cap is down 0.84%
A daily close above $0.009785 would confirm the bullish case; a close below $0.009453 would invalidate it
The tension in this setup is between a daily chart that still looks constructive and shorter-term momentum that’s starting to wobble. On the daily timeframe, price sits above the EMA20, EMA50 and EMA200, with the averages stacked in a textbook bullish order — that’s the dominant structural force right now.
The hourly and 15-minute pictures, however, are messier, with momentum indicators losing conviction even as price grinds sideways to slightly higher. When the bigger trend is intact but the smaller timeframes start dragging their feet, it usually means the market is deciding whether to consolidate before the next leg or quietly roll over.
Pengu price action tests daily R1 as broader market cap dips 0.84%
There’s no PENGU-specific news or DEX flow in the data to point to, so the backdrop here is purely macro. CoinGecko’s figures put total crypto market capitalization at roughly $2.94 trillion, down 0.84% over the past 24 hours, with Bitcoin dominance at 58.79%. That’s a mildly risk-off tone at the index level, even if it’s not dramatic. Meanwhile, the Fear & Greed Index from Alternative.me reads 70, which lands in “Greed” territory — sentiment is leaning optimistic even as the aggregate market cap ticks lower, a contradiction worth keeping in mind when sizing up conviction behind the current PENGU move.
EMA structure stays bullish on daily but the hourly averages aren’t aligned
On the daily chart, price trades above all three EMAs — the 20 at $0.0091273, the 50 at $0.0084456 and the 200 at $0.0079447 — and the order is bullish, meaning the 20 sits above the 50 which sits above the 200. That’s the cleanest bullish structure on the board and the main reason the broader bias still leans constructive.
The hourly tells a slightly different story. Price is also above its EMA20 ($0.0097135), EMA50 ($0.0095327) and EMA200 ($0.0096059), but the EMA order itself is mixed rather than aligned. The averages aren’t stacked the way they are on daily, which points to recent chop rather than a clean trend on that timeframe.
On the 15-minute chart, price is below the EMA20 ($0.0098392) and EMA50 ($0.0097939) but still above the EMA200 ($0.0095451), even though the EMA order there is bullish. In other words, the short-term averages are stacked correctly in theory, but price has slipped beneath the two faster ones — a sign of short-term fatigue inside a still-intact bigger structure.
Daily RSI keeps climbing while the MACD histogram tells a more cautious story
Daily RSI has climbed from 50.7 to 53.7 to 56.5 across the last three completed candles — nowhere near overbought, but clearly gaining ground and consistent with the bullish EMA backdrop. The hourly RSI, at 58.99, has been choppier: 64.8, then 56.5, then 59.0, a mixed sequence that doesn’t give a clean read either way. The 15-minute RSI has been climbing too, from 45.3 to 49.4 to 54.3, suggesting the micro-trend is trying to turn up again after cooling off.
MACD is where the daily picture gets more interesting. The daily histogram is negative and widening — it’s gone from -0.0000115 to -0.0000409 to -0.0000403 over the last three closed candles — which signals that upside momentum has been fading even while price itself keeps grinding higher. That’s a classic case of price and momentum disagreeing, and it’s worth taking seriously rather than dismissing.
On the hourly, the histogram has just crossed into negative territory, flipping from a positive 0.0000064 to -0.00000518 and then -0.00000971, which lines up with the mixed hourly RSI and the non-aligned EMA order. Momentum on that timeframe has genuinely turned down, at least for now. The 15-minute histogram is also negative but narrowing, moving from -0.000012 to -0.00000967 to -0.00000436, pointing to downside pressure fading at the micro level even if it hasn’t flipped positive yet.
Bollinger Bands add context on how stretched price is. On daily, PENGU trades above the band’s mid-point at $0.0089942 but still well below the upper band at $0.011169, so there’s room before any overextension signal kicks in. On the hourly, price sits just above the mid-band at $0.0097259 and below the upper band at $0.010048.
On the 15-minute chart, price has drifted below its mid-band of $0.0098379 and is sitting closer to the lower band at $0.009736, reinforcing the sense of short-term consolidation rather than a clean breakout structure. Daily ATR stands at roughly $0.00086, which relative to the current price represents a sizable potential daily range — a reminder that moves in either direction could be sharp even while the bigger trend holds.
Key levels and how the bull and bear cases split from here
The pivot structure is the clearest way to frame what happens next for PENGU. On daily, R1 sits at $0.009785 — a level price is currently trading just above intraday, even though the prior daily close of $0.009583 was still beneath it. The daily pivot sits lower at $0.009453, daily S1 at $0.009251, and the daily Bollinger upper band caps the chart at $0.011169.
On the hourly, the pivot is at $0.0098157 with R1 at $0.0098753 above it, while hourly S1 sits at $0.0097663 below. Notably, the current hourly price of $0.009781 is trading just under its own pivot, which is the clearest sign of the tension between the still-bullish daily frame and a hesitant hourly one.
Bullish scenario: a daily close above the daily R1 at $0.009785 would confirm the reclaim that’s currently only showing up intraday, and would open the path toward the daily Bollinger upper band at $0.011169. This case is invalidated if the daily candle closes back below the daily pivot at $0.009453, which would expose daily S1 at $0.009251 and undercut the bullish EMA structure that’s currently supporting the broader bias.
Bearish scenario: a daily close back below the daily R1 at $0.009785 would suggest the intraday push above it was a false start, pulling price toward the daily pivot at $0.009453 and potentially daily S1 at $0.009251. That bearish read gets undercut if the hourly candle closes back above the hourly R1 at $0.0098753 — a move that would hint that buyers are absorbing the dip before the daily candle even confirms a breakdown.
Given that daily momentum is already diverging from price even in the bullish scenario, and that the Fear & Greed reading of 70 shows sentiment running hotter than the mixed hourly and 15-minute signals really justify, the most likely false signal here is a quick push through daily R1 that fails to hold by the close. That’s exactly the kind of move that would trap late bulls if the hourly weakness bleeds back into the daily chart.
FAQ
Where does PENGU trade right now?
PENGU trades at $0.009787 on Binance, just above the daily R1 pivot at $0.009785, after the last completed daily candle closed at $0.009583.
Is PENGU overbought or oversold?
No. The daily RSI reads 56.5, the hourly sits at 58.99, and the 15-minute is at 54.34 — none of these are in overbought or oversold territory based on the current readings.
What would confirm a bullish continuation for PENGU?
A daily close above the daily R1 at $0.009785 would confirm the move, with the daily Bollinger upper band at $0.011169 as the next level in view. This is invalidated by a daily close below the daily pivot at $0.009453.
What would confirm a bearish move for PENGU?
A daily close back below the daily R1 at $0.009785 would point toward the daily pivot at $0.009453 and daily S1 at $0.009251.
Disclaimer: This article is for informational purposes only and does not constitute financial advice, an investment recommendation, or a solicitation to buy or sell any financial instrument or cryptocurrency. The analysis provided is not indicative of future results. Investing in crypto assets and financial markets carries a high risk of capital loss. Always do your own research (DYOR) and consult a qualified financial advisor before making any decision.
Article produced with the assistance of artificial intelligence and reviewed by the editorial team.
152

Article
Solana tokenized equities overtake Robinhood, ending its six-week leadSolana has pulled ahead of Robinhood in weekly trading volume for tokenized equities, ending a six-week stretch in which the trading app held the top spot. The shift, flagged by commentator @SolanaFloor and reported by Coinfomania, marks a notable change in where traders are putting their money when it comes to blockchain-based versions of stocks.
Key takeaways
Solana has overtaken Robinhood in weekly tokenized equity trading volume after six weeks of Robinhood holding the lead.
The swap in rankings points to a change in trader sentiment toward Solana’s platform.
Solana’s low fees and fast processing are cited as reasons the network appeals to tokenized equity trading.
Solana Overtakes Robinhood in Tokenized Equity Volume
For six straight weeks, Robinhood held the top spot in weekly trading volume for tokenized equities. That streak has now broken, with Solana tokenized equities volume surpassing Robinhood’s for the first time since the run began, according to data shared by @SolanaFloor and covered by Coinfomania.
Six-Week Shift in Market Leadership
The reversal is being framed as more than a one-week blip. Robinhood’s six-week hold on the top spot had set an expectation that the trading app would keep leading this corner of the market, but Solana’s climb past it signals a real change in where trading activity is concentrated.
Implications of the Volume Change
The shift in weekly volume is being read as a sign of changing trader sentiment, with more activity and interest flowing toward Solana’s tokenized equities offerings rather than Robinhood’s.
Potential Drivers Behind Solana’s Volume Gain
Two factors are being pointed to as possible explanations for the jump: large-wallet activity and the technical advantages of Solana’s network itself.
Whale Accumulation and Institutional Interest
The increase in volume could reflect whale accumulation and large wallet movements building up on Solana.
Advantages of Solana’s Blockchain for Tokenized Equities
Known for its scalability and low transaction costs, Solana is a high-performance blockchain, qualities that make it a preferred choice for tokenized equity trading. Those technical traits give it an edge over competing platforms when traders are moving large volumes of tokenized stock products.
Market Implications and Future Outlook
The change in leadership between the two platforms touches on more than just a single week’s numbers — it speaks to how traders are weighing their options in the tokenized equity market.
Changing Trader Strategies and Market Confidence
The volume shift signals a change in trader sentiment favoring Solana, suggesting traders may be reassessing where they place confidence as Robinhood faces increasing competition from blockchain networks offering similar products with different cost structures.
Prospects for Increased Liquidity and Trading Activity
If the trend holds, Solana’s growing presence in this space could translate into increased liquidity and trading activity within its ecosystem, giving traders more depth to work with as tokenized equities continue to gain traction.
Article produced with the assistance of artificial intelligence and reviewed by the editorial team.
Solana tokenized equities overtake Robinhood, ending its six-week lead
Solana has pulled ahead of Robinhood in weekly trading volume for tokenized equities, ending a six-week stretch in which the trading app held the top spot. The shift, flagged by commentator @SolanaFloor and reported by Coinfomania, marks a notable change in where traders are putting their money when it comes to blockchain-based versions of stocks.
Key takeaways
Solana has overtaken Robinhood in weekly tokenized equity trading volume after six weeks of Robinhood holding the lead.
The swap in rankings points to a change in trader sentiment toward Solana’s platform.
Solana’s low fees and fast processing are cited as reasons the network appeals to tokenized equity trading.
Solana Overtakes Robinhood in Tokenized Equity Volume
For six straight weeks, Robinhood held the top spot in weekly trading volume for tokenized equities. That streak has now broken, with Solana tokenized equities volume surpassing Robinhood’s for the first time since the run began, according to data shared by @SolanaFloor and covered by Coinfomania.
Six-Week Shift in Market Leadership
The reversal is being framed as more than a one-week blip. Robinhood’s six-week hold on the top spot had set an expectation that the trading app would keep leading this corner of the market, but Solana’s climb past it signals a real change in where trading activity is concentrated.
Implications of the Volume Change
The shift in weekly volume is being read as a sign of changing trader sentiment, with more activity and interest flowing toward Solana’s tokenized equities offerings rather than Robinhood’s.
Potential Drivers Behind Solana’s Volume Gain
Two factors are being pointed to as possible explanations for the jump: large-wallet activity and the technical advantages of Solana’s network itself.
Whale Accumulation and Institutional Interest
The increase in volume could reflect whale accumulation and large wallet movements building up on Solana.
Advantages of Solana’s Blockchain for Tokenized Equities
Known for its scalability and low transaction costs, Solana is a high-performance blockchain, qualities that make it a preferred choice for tokenized equity trading. Those technical traits give it an edge over competing platforms when traders are moving large volumes of tokenized stock products.
Market Implications and Future Outlook
The change in leadership between the two platforms touches on more than just a single week’s numbers — it speaks to how traders are weighing their options in the tokenized equity market.
Changing Trader Strategies and Market Confidence
The volume shift signals a change in trader sentiment favoring Solana, suggesting traders may be reassessing where they place confidence as Robinhood faces increasing competition from blockchain networks offering similar products with different cost structures.
Prospects for Increased Liquidity and Trading Activity
If the trend holds, Solana’s growing presence in this space could translate into increased liquidity and trading activity within its ecosystem, giving traders more depth to work with as tokenized equities continue to gain traction.
Article produced with the assistance of artificial intelligence and reviewed by the editorial team.
Key takeaways
Solana has overtaken Robinhood in weekly tokenized equity trading volume after six weeks of Robinhood holding the lead.
The swap in rankings points to a change in trader sentiment toward Solana’s platform.
Solana’s low fees and fast processing are cited as reasons the network appeals to tokenized equity trading.
Solana Overtakes Robinhood in Tokenized Equity Volume
For six straight weeks, Robinhood held the top spot in weekly trading volume for tokenized equities. That streak has now broken, with Solana tokenized equities volume surpassing Robinhood’s for the first time since the run began, according to data shared by @SolanaFloor and covered by Coinfomania.
Six-Week Shift in Market Leadership
The reversal is being framed as more than a one-week blip. Robinhood’s six-week hold on the top spot had set an expectation that the trading app would keep leading this corner of the market, but Solana’s climb past it signals a real change in where trading activity is concentrated.
Implications of the Volume Change
The shift in weekly volume is being read as a sign of changing trader sentiment, with more activity and interest flowing toward Solana’s tokenized equities offerings rather than Robinhood’s.
Potential Drivers Behind Solana’s Volume Gain
Two factors are being pointed to as possible explanations for the jump: large-wallet activity and the technical advantages of Solana’s network itself.
Whale Accumulation and Institutional Interest
The increase in volume could reflect whale accumulation and large wallet movements building up on Solana.
Advantages of Solana’s Blockchain for Tokenized Equities
Known for its scalability and low transaction costs, Solana is a high-performance blockchain, qualities that make it a preferred choice for tokenized equity trading. Those technical traits give it an edge over competing platforms when traders are moving large volumes of tokenized stock products.
Market Implications and Future Outlook
The change in leadership between the two platforms touches on more than just a single week’s numbers — it speaks to how traders are weighing their options in the tokenized equity market.
Changing Trader Strategies and Market Confidence
The volume shift signals a change in trader sentiment favoring Solana, suggesting traders may be reassessing where they place confidence as Robinhood faces increasing competition from blockchain networks offering similar products with different cost structures.
Prospects for Increased Liquidity and Trading Activity
If the trend holds, Solana’s growing presence in this space could translate into increased liquidity and trading activity within its ecosystem, giving traders more depth to work with as tokenized equities continue to gain traction.
Article produced with the assistance of artificial intelligence and reviewed by the editorial team.
1
1
99

Article
Bank of Thailand warns forex trading risks are highThai regulators are sounding an alarm about currency speculation sold through unlicensed platforms. The Bank of Thailand has issued a public warning highlighting the forex trading risks tied to unregulated operators, saying the activity leaves everyday investors exposed to fraud.
Key takeaways
The Bank of Thailand flagged unregulated FOREX trading as a source of serious financial danger for the public.
No FOREX business has ever received an official license from the central bank.
Currency speculation through online platforms is described as highly exposed to scams and Ponzi-style schemes.
The advisory tells investors to proceed carefully before putting money into any FOREX platform.
Bank of Thailand Warns About FOREX Trading Risks
The central bank’s message is direct: speculating on currency movements through online platforms can wipe out savings fast, and most of the platforms offering it in Thailand operate outside any legal framework. The warning centers on fraud and the high potential for scams targeting investors. The news was reported by Coinfomania.
Nature of FOREX Trading
FOREX trading, as the central bank describes it, means investing or speculating on fluctuations in currency exchange rates, almost always carried out through online trading platforms.
Fraud Risks and Unregulated Market
The core of the warning centers on fraud. The Bank of Thailand points to a high potential for scams and Ponzi schemes hiding inside unregulated FOREX trading risks.
Regulatory Status and Investor Protection
Thailand’s central bank has never licensed a single FOREX business, a fact that effectively puts every platform marketing currency trading services in the country outside the official regulatory perimeter.
No Licensing for FOREX Businesses
Because no licenses have ever been granted, any company advertising FOREX trading services to Thai investors is doing so without the central bank’s approval or supervision.
Purpose of the Warning
The advisory is meant to shield the public from fraudulent activity connected to FOREX trading, reinforcing the Bank of Thailand’s broader role in regulating monetary policy and protecting financial stability.
Advice to Investors
Investors are urged to exercise caution before engaging with any FOREX trading offer, particularly those promoted through unverified online platforms.
Article produced with the assistance of artificial intelligence and reviewed by the editorial team.
Bank of Thailand warns forex trading risks are high
Thai regulators are sounding an alarm about currency speculation sold through unlicensed platforms. The Bank of Thailand has issued a public warning highlighting the forex trading risks tied to unregulated operators, saying the activity leaves everyday investors exposed to fraud.
Key takeaways
The Bank of Thailand flagged unregulated FOREX trading as a source of serious financial danger for the public.
No FOREX business has ever received an official license from the central bank.
Currency speculation through online platforms is described as highly exposed to scams and Ponzi-style schemes.
The advisory tells investors to proceed carefully before putting money into any FOREX platform.
Bank of Thailand Warns About FOREX Trading Risks
The central bank’s message is direct: speculating on currency movements through online platforms can wipe out savings fast, and most of the platforms offering it in Thailand operate outside any legal framework. The warning centers on fraud and the high potential for scams targeting investors. The news was reported by Coinfomania.
Nature of FOREX Trading
FOREX trading, as the central bank describes it, means investing or speculating on fluctuations in currency exchange rates, almost always carried out through online trading platforms.
Fraud Risks and Unregulated Market
The core of the warning centers on fraud. The Bank of Thailand points to a high potential for scams and Ponzi schemes hiding inside unregulated FOREX trading risks.
Regulatory Status and Investor Protection
Thailand’s central bank has never licensed a single FOREX business, a fact that effectively puts every platform marketing currency trading services in the country outside the official regulatory perimeter.
No Licensing for FOREX Businesses
Because no licenses have ever been granted, any company advertising FOREX trading services to Thai investors is doing so without the central bank’s approval or supervision.
Purpose of the Warning
The advisory is meant to shield the public from fraudulent activity connected to FOREX trading, reinforcing the Bank of Thailand’s broader role in regulating monetary policy and protecting financial stability.
Advice to Investors
Investors are urged to exercise caution before engaging with any FOREX trading offer, particularly those promoted through unverified online platforms.
Article produced with the assistance of artificial intelligence and reviewed by the editorial team.
Key takeaways
The Bank of Thailand flagged unregulated FOREX trading as a source of serious financial danger for the public.
No FOREX business has ever received an official license from the central bank.
Currency speculation through online platforms is described as highly exposed to scams and Ponzi-style schemes.
The advisory tells investors to proceed carefully before putting money into any FOREX platform.
Bank of Thailand Warns About FOREX Trading Risks
The central bank’s message is direct: speculating on currency movements through online platforms can wipe out savings fast, and most of the platforms offering it in Thailand operate outside any legal framework. The warning centers on fraud and the high potential for scams targeting investors. The news was reported by Coinfomania.
Nature of FOREX Trading
FOREX trading, as the central bank describes it, means investing or speculating on fluctuations in currency exchange rates, almost always carried out through online trading platforms.
Fraud Risks and Unregulated Market
The core of the warning centers on fraud. The Bank of Thailand points to a high potential for scams and Ponzi schemes hiding inside unregulated FOREX trading risks.
Regulatory Status and Investor Protection
Thailand’s central bank has never licensed a single FOREX business, a fact that effectively puts every platform marketing currency trading services in the country outside the official regulatory perimeter.
No Licensing for FOREX Businesses
Because no licenses have ever been granted, any company advertising FOREX trading services to Thai investors is doing so without the central bank’s approval or supervision.
Purpose of the Warning
The advisory is meant to shield the public from fraudulent activity connected to FOREX trading, reinforcing the Bank of Thailand’s broader role in regulating monetary policy and protecting financial stability.
Advice to Investors
Investors are urged to exercise caution before engaging with any FOREX trading offer, particularly those promoted through unverified online platforms.
Article produced with the assistance of artificial intelligence and reviewed by the editorial team.
44

Article
Strive’s Bitcoin acquisition pushes holdings to 29,462 BTC after $169M buyStrive Holdings has added 2,000 BTC to its balance sheet for roughly $169 million, a purchase that pushes the firm’s total Bitcoin stash to 29,462 BTC and marks one of the more aggressive Strive Bitcoin acquisition moves reported in recent months. The deal, disclosed in a report cited by Coinfomania and credited to WuBlockchain, values the latest tranche at an average price of $84,422 per BTC.
Key takeaways
Strive bought 2,000 BTC for about $169 million at an average cost of $84,422 per coin.
The firm’s Bitcoin treasury now totals 29,462 BTC.
Since August 24, Strive has added 8,106 BTC worth roughly $659.6 million.
SATA supplied 61.5% of the latest capital raise, with warrant exercises adding $56.7 million.
Bitcoin micro-transactions under 0.01 BTC now make up nearly 80% of network activity.
Strive Holdings’ Latest Bitcoin Acquisition
Strive Holdings bought 2,000 BTC for approximately $169 million, a transaction that raised its cryptocurrency portfolio to a new scale. The purchase price averaged $84,422 per coin, according to the figures cited in the report.
With this addition, Strive’s total Bitcoin holdings now stand at 29,462 BTC.
Recent Acquisition Trends and Institutional Interest
Since August 24, the firm has accumulated 8,106 BTC in total, spending around $659.6 million at an average price of $81,374 per coin.
Funding for the latest round came largely from SATA, which contributed 61.5% of the capital raised, while warrant exercises added another $56.7 million toward the institutional Bitcoin investment.
Market Implications and Bitcoin Transaction Dynamics
Large, repeated purchases like Strive’s point to growing institutional confidence in Bitcoin as a long-term holding. Each Strive Bitcoin acquisition adds to a pattern that, according to the report, reflects rising institutional interest in the asset.
At the same time, Bitcoin’s network usage is shifting at the retail level. Bitcoin micro-transactions under 0.01 BTC now make up close to 80% of all network activity, indicating that smaller transfers have grown far more frequent than before. Together, the two trends show institutions accumulating in bulk while everyday network activity skews toward smaller transaction sizes.
Article produced with the assistance of artificial intelligence and reviewed by the editorial team.
Strive’s Bitcoin acquisition pushes holdings to 29,462 BTC after $169M buy
Strive Holdings has added 2,000 BTC to its balance sheet for roughly $169 million, a purchase that pushes the firm’s total Bitcoin stash to 29,462 BTC and marks one of the more aggressive Strive Bitcoin acquisition moves reported in recent months. The deal, disclosed in a report cited by Coinfomania and credited to WuBlockchain, values the latest tranche at an average price of $84,422 per BTC.
Key takeaways
Strive bought 2,000 BTC for about $169 million at an average cost of $84,422 per coin.
The firm’s Bitcoin treasury now totals 29,462 BTC.
Since August 24, Strive has added 8,106 BTC worth roughly $659.6 million.
SATA supplied 61.5% of the latest capital raise, with warrant exercises adding $56.7 million.
Bitcoin micro-transactions under 0.01 BTC now make up nearly 80% of network activity.
Strive Holdings’ Latest Bitcoin Acquisition
Strive Holdings bought 2,000 BTC for approximately $169 million, a transaction that raised its cryptocurrency portfolio to a new scale. The purchase price averaged $84,422 per coin, according to the figures cited in the report.
With this addition, Strive’s total Bitcoin holdings now stand at 29,462 BTC.
Recent Acquisition Trends and Institutional Interest
Since August 24, the firm has accumulated 8,106 BTC in total, spending around $659.6 million at an average price of $81,374 per coin.
Funding for the latest round came largely from SATA, which contributed 61.5% of the capital raised, while warrant exercises added another $56.7 million toward the institutional Bitcoin investment.
Market Implications and Bitcoin Transaction Dynamics
Large, repeated purchases like Strive’s point to growing institutional confidence in Bitcoin as a long-term holding. Each Strive Bitcoin acquisition adds to a pattern that, according to the report, reflects rising institutional interest in the asset.
At the same time, Bitcoin’s network usage is shifting at the retail level. Bitcoin micro-transactions under 0.01 BTC now make up close to 80% of all network activity, indicating that smaller transfers have grown far more frequent than before. Together, the two trends show institutions accumulating in bulk while everyday network activity skews toward smaller transaction sizes.
Article produced with the assistance of artificial intelligence and reviewed by the editorial team.
Key takeaways
Strive bought 2,000 BTC for about $169 million at an average cost of $84,422 per coin.
The firm’s Bitcoin treasury now totals 29,462 BTC.
Since August 24, Strive has added 8,106 BTC worth roughly $659.6 million.
SATA supplied 61.5% of the latest capital raise, with warrant exercises adding $56.7 million.
Bitcoin micro-transactions under 0.01 BTC now make up nearly 80% of network activity.
Strive Holdings’ Latest Bitcoin Acquisition
Strive Holdings bought 2,000 BTC for approximately $169 million, a transaction that raised its cryptocurrency portfolio to a new scale. The purchase price averaged $84,422 per coin, according to the figures cited in the report.
With this addition, Strive’s total Bitcoin holdings now stand at 29,462 BTC.
Recent Acquisition Trends and Institutional Interest
Since August 24, the firm has accumulated 8,106 BTC in total, spending around $659.6 million at an average price of $81,374 per coin.
Funding for the latest round came largely from SATA, which contributed 61.5% of the capital raised, while warrant exercises added another $56.7 million toward the institutional Bitcoin investment.
Market Implications and Bitcoin Transaction Dynamics
Large, repeated purchases like Strive’s point to growing institutional confidence in Bitcoin as a long-term holding. Each Strive Bitcoin acquisition adds to a pattern that, according to the report, reflects rising institutional interest in the asset.
At the same time, Bitcoin’s network usage is shifting at the retail level. Bitcoin micro-transactions under 0.01 BTC now make up close to 80% of all network activity, indicating that smaller transfers have grown far more frequent than before. Together, the two trends show institutions accumulating in bulk while everyday network activity skews toward smaller transaction sizes.
Article produced with the assistance of artificial intelligence and reviewed by the editorial team.
149

Article
BitMine’s Ethereum acquisition hits 6 million ETH, nears 5% supply goalBitMine Immersion Technologies has added another large chunk of Ethereum to its treasury, bringing the company closer than ever to a self-set target of owning 5% of all ETH in circulation. The firm acquired 15,112 ETH over the past week.
Key takeaways
BitMine added 15,112 ETH to its treasury in the past week.
Its total stash now sits at 6,016,414 ETH as of October 4.
That holding equals roughly 4.9% of Ethereum’s full supply.
The company is 99% of the way to its 5% ownership target.
Over 5 million of those tokens are staked.
BitMine’s Weekly Haul Pushes Holdings Past 6 Million ETH
According to WuBlockchain, BitMine said it acquired 15,112 ETH over the past week, lifting its total holdings to 6,016,414 ETH as of October 4.
The 6,016,414 ETH BitMine now holds works out to about 4.9% of Ethereum’s 122.1 million token supply, putting the company 99% of the way toward its stated ETH ownership goal of controlling 5% of all coins in circulation.
BitMine has 5,067,309 ETH staked. Combined with cash, marketable securities and other investments, BitMine’s total portfolio was valued at $17.4 billion.
Article produced with the assistance of artificial intelligence and reviewed by the editorial team.
BitMine’s Ethereum acquisition hits 6 million ETH, nears 5% supply goal
BitMine Immersion Technologies has added another large chunk of Ethereum to its treasury, bringing the company closer than ever to a self-set target of owning 5% of all ETH in circulation. The firm acquired 15,112 ETH over the past week.
Key takeaways
BitMine added 15,112 ETH to its treasury in the past week.
Its total stash now sits at 6,016,414 ETH as of October 4.
That holding equals roughly 4.9% of Ethereum’s full supply.
The company is 99% of the way to its 5% ownership target.
Over 5 million of those tokens are staked.
BitMine’s Weekly Haul Pushes Holdings Past 6 Million ETH
According to WuBlockchain, BitMine said it acquired 15,112 ETH over the past week, lifting its total holdings to 6,016,414 ETH as of October 4.
The 6,016,414 ETH BitMine now holds works out to about 4.9% of Ethereum’s 122.1 million token supply, putting the company 99% of the way toward its stated ETH ownership goal of controlling 5% of all coins in circulation.
BitMine has 5,067,309 ETH staked. Combined with cash, marketable securities and other investments, BitMine’s total portfolio was valued at $17.4 billion.
Article produced with the assistance of artificial intelligence and reviewed by the editorial team.
Key takeaways
BitMine added 15,112 ETH to its treasury in the past week.
Its total stash now sits at 6,016,414 ETH as of October 4.
That holding equals roughly 4.9% of Ethereum’s full supply.
The company is 99% of the way to its 5% ownership target.
Over 5 million of those tokens are staked.
BitMine’s Weekly Haul Pushes Holdings Past 6 Million ETH
According to WuBlockchain, BitMine said it acquired 15,112 ETH over the past week, lifting its total holdings to 6,016,414 ETH as of October 4.
The 6,016,414 ETH BitMine now holds works out to about 4.9% of Ethereum’s 122.1 million token supply, putting the company 99% of the way toward its stated ETH ownership goal of controlling 5% of all coins in circulation.
BitMine has 5,067,309 ETH staked. Combined with cash, marketable securities and other investments, BitMine’s total portfolio was valued at $17.4 billion.
Article produced with the assistance of artificial intelligence and reviewed by the editorial team.
18

Article
Cardano Price Prediction: ADA Tests $0.30 as Bulls Target Higher LevelsCardano is moving toward a key resistance area after a strong recovery from its lower price range. Crypto analyst CryptoPatel has pointed to $0.2887 as an important level for the next price move, with potential targets of $0.50, $1, $2, $3 and $5 if ADA can secure a sustained higher-timeframe close above it.
$ADA COULD BE ENTERING ITS NEXT MACRO EXPANSION!#ADA is showing a major long-term accumulation and breakout structure on the 2W chart.
ADA/USDT is now ~98% UP from our accumulation zone, yet my macro thesis remains unchanged.
$0.2887 → Bullish confirmation
Targets:… pic.twitter.com/fC3xy3hw9o
— Crypto Patel (@CryptoPatel) October 5, 2026
ADA was trading near $0.2722 on the supplied 2-week chart. That puts the token about 98% above the accumulation zone identified by the analyst. The wider chart also shows how ADA has recovered from the deep decline that followed its 2021 peak near $3.10.
ADA Moves Toward the $0.28 Resistance
We took a look at the 4 hour chart, with the price at $0.27225, having risen from the $0.18 level. This movement has been creating higher highs and higher lows since mid September.
ADAs 4H Chart
The next obstacle to be crossed is the resistance area of $0.2750 – $0.2800. ADA has been trading above its 9-period EMA at $0.26273, putting it 3.6% above the moving average.
RSI was at 72.63, putting it above the 70 benchmark, which is generally used for defining overbought situations. It doesn’t necessarily suggest that the upward trend will reverse, but it proves that the buying trend has driven the momentum into high levels. Breaking the 4-hour closing above $0.28 may bring ADA towards $0.30. In case of rejection by sellers of ADA in this region, the first level to pay attention to is the EMA of $0.2627.
Cardano Price Prediction Puts $0.30 in Focus
The daily chart gives ADA another test to clear. Price was around $0.27255, with resistance near $0.30.
ADAs 1D Chart
The 9-day EMA was at $0.25279, leaving ADA about 7.8% above the indicator. The RSI stood at 70.07, showing that the token is also approaching an overbought reading on the daily timeframe.
A daily close above $0.30 would strengthen the bullish setup and put 0.35–0.40 on the radar based on the levels marked on the chart. A rejection could send ADA toward the $0.25 area, which is close to the 9-day EMA. The ascending trendline also places support around $0.21–$0.22.
ADA’s Macro Targets Extend to $5
The bigger prediction comes from the 2-week chart. It shows ADA falling from its 2021 peak near $3.10 into a prolonged accumulation range around $0.10 – $0.20. The chart records a 3,402.85% advance during the previous major bull cycle. It also marks an 89.45% to 96.54% decline from the 2021 peak during the following downturn.
For CryptoPatel, $0.2887 is the key confirmation level. A sustained close above it would put $0.50 and $1 on the nearer target list, followed by $2, $3 and $5.
For now, ADA has three levels to clear: $0.28 on the 4-hour timeframe, $0.30 on the daily chart and $0.2887 on the macro setup. How price reacts around these levels could determine whether the current Cardano price prediction develops into a broader move higher or another test of support.
Cardano Price Prediction: ADA Tests $0.30 as Bulls Target Higher Levels
Cardano is moving toward a key resistance area after a strong recovery from its lower price range. Crypto analyst CryptoPatel has pointed to $0.2887 as an important level for the next price move, with potential targets of $0.50, $1, $2, $3 and $5 if ADA can secure a sustained higher-timeframe close above it.
$ADA COULD BE ENTERING ITS NEXT MACRO EXPANSION!#ADA is showing a major long-term accumulation and breakout structure on the 2W chart.
ADA/USDT is now ~98% UP from our accumulation zone, yet my macro thesis remains unchanged.
$0.2887 → Bullish confirmation
Targets:… pic.twitter.com/fC3xy3hw9o
— Crypto Patel (@CryptoPatel) October 5, 2026
ADA was trading near $0.2722 on the supplied 2-week chart. That puts the token about 98% above the accumulation zone identified by the analyst. The wider chart also shows how ADA has recovered from the deep decline that followed its 2021 peak near $3.10.
ADA Moves Toward the $0.28 Resistance
We took a look at the 4 hour chart, with the price at $0.27225, having risen from the $0.18 level. This movement has been creating higher highs and higher lows since mid September.
ADAs 4H Chart
The next obstacle to be crossed is the resistance area of $0.2750 – $0.2800. ADA has been trading above its 9-period EMA at $0.26273, putting it 3.6% above the moving average.
RSI was at 72.63, putting it above the 70 benchmark, which is generally used for defining overbought situations. It doesn’t necessarily suggest that the upward trend will reverse, but it proves that the buying trend has driven the momentum into high levels. Breaking the 4-hour closing above $0.28 may bring ADA towards $0.30. In case of rejection by sellers of ADA in this region, the first level to pay attention to is the EMA of $0.2627.
Cardano Price Prediction Puts $0.30 in Focus
The daily chart gives ADA another test to clear. Price was around $0.27255, with resistance near $0.30.
ADAs 1D Chart
The 9-day EMA was at $0.25279, leaving ADA about 7.8% above the indicator. The RSI stood at 70.07, showing that the token is also approaching an overbought reading on the daily timeframe.
A daily close above $0.30 would strengthen the bullish setup and put 0.35–0.40 on the radar based on the levels marked on the chart. A rejection could send ADA toward the $0.25 area, which is close to the 9-day EMA. The ascending trendline also places support around $0.21–$0.22.
ADA’s Macro Targets Extend to $5
The bigger prediction comes from the 2-week chart. It shows ADA falling from its 2021 peak near $3.10 into a prolonged accumulation range around $0.10 – $0.20. The chart records a 3,402.85% advance during the previous major bull cycle. It also marks an 89.45% to 96.54% decline from the 2021 peak during the following downturn.
For CryptoPatel, $0.2887 is the key confirmation level. A sustained close above it would put $0.50 and $1 on the nearer target list, followed by $2, $3 and $5.
For now, ADA has three levels to clear: $0.28 on the 4-hour timeframe, $0.30 on the daily chart and $0.2887 on the macro setup. How price reacts around these levels could determine whether the current Cardano price prediction develops into a broader move higher or another test of support.
$ADA COULD BE ENTERING ITS NEXT MACRO EXPANSION!#ADA is showing a major long-term accumulation and breakout structure on the 2W chart.
ADA/USDT is now ~98% UP from our accumulation zone, yet my macro thesis remains unchanged.
$0.2887 → Bullish confirmation
Targets:… pic.twitter.com/fC3xy3hw9o
— Crypto Patel (@CryptoPatel) October 5, 2026
ADA was trading near $0.2722 on the supplied 2-week chart. That puts the token about 98% above the accumulation zone identified by the analyst. The wider chart also shows how ADA has recovered from the deep decline that followed its 2021 peak near $3.10.
ADA Moves Toward the $0.28 Resistance
We took a look at the 4 hour chart, with the price at $0.27225, having risen from the $0.18 level. This movement has been creating higher highs and higher lows since mid September.
ADAs 4H Chart
The next obstacle to be crossed is the resistance area of $0.2750 – $0.2800. ADA has been trading above its 9-period EMA at $0.26273, putting it 3.6% above the moving average.
RSI was at 72.63, putting it above the 70 benchmark, which is generally used for defining overbought situations. It doesn’t necessarily suggest that the upward trend will reverse, but it proves that the buying trend has driven the momentum into high levels. Breaking the 4-hour closing above $0.28 may bring ADA towards $0.30. In case of rejection by sellers of ADA in this region, the first level to pay attention to is the EMA of $0.2627.
Cardano Price Prediction Puts $0.30 in Focus
The daily chart gives ADA another test to clear. Price was around $0.27255, with resistance near $0.30.
ADAs 1D Chart
The 9-day EMA was at $0.25279, leaving ADA about 7.8% above the indicator. The RSI stood at 70.07, showing that the token is also approaching an overbought reading on the daily timeframe.
A daily close above $0.30 would strengthen the bullish setup and put 0.35–0.40 on the radar based on the levels marked on the chart. A rejection could send ADA toward the $0.25 area, which is close to the 9-day EMA. The ascending trendline also places support around $0.21–$0.22.
ADA’s Macro Targets Extend to $5
The bigger prediction comes from the 2-week chart. It shows ADA falling from its 2021 peak near $3.10 into a prolonged accumulation range around $0.10 – $0.20. The chart records a 3,402.85% advance during the previous major bull cycle. It also marks an 89.45% to 96.54% decline from the 2021 peak during the following downturn.
For CryptoPatel, $0.2887 is the key confirmation level. A sustained close above it would put $0.50 and $1 on the nearer target list, followed by $2, $3 and $5.
For now, ADA has three levels to clear: $0.28 on the 4-hour timeframe, $0.30 on the daily chart and $0.2887 on the macro setup. How price reacts around these levels could determine whether the current Cardano price prediction develops into a broader move higher or another test of support.
145
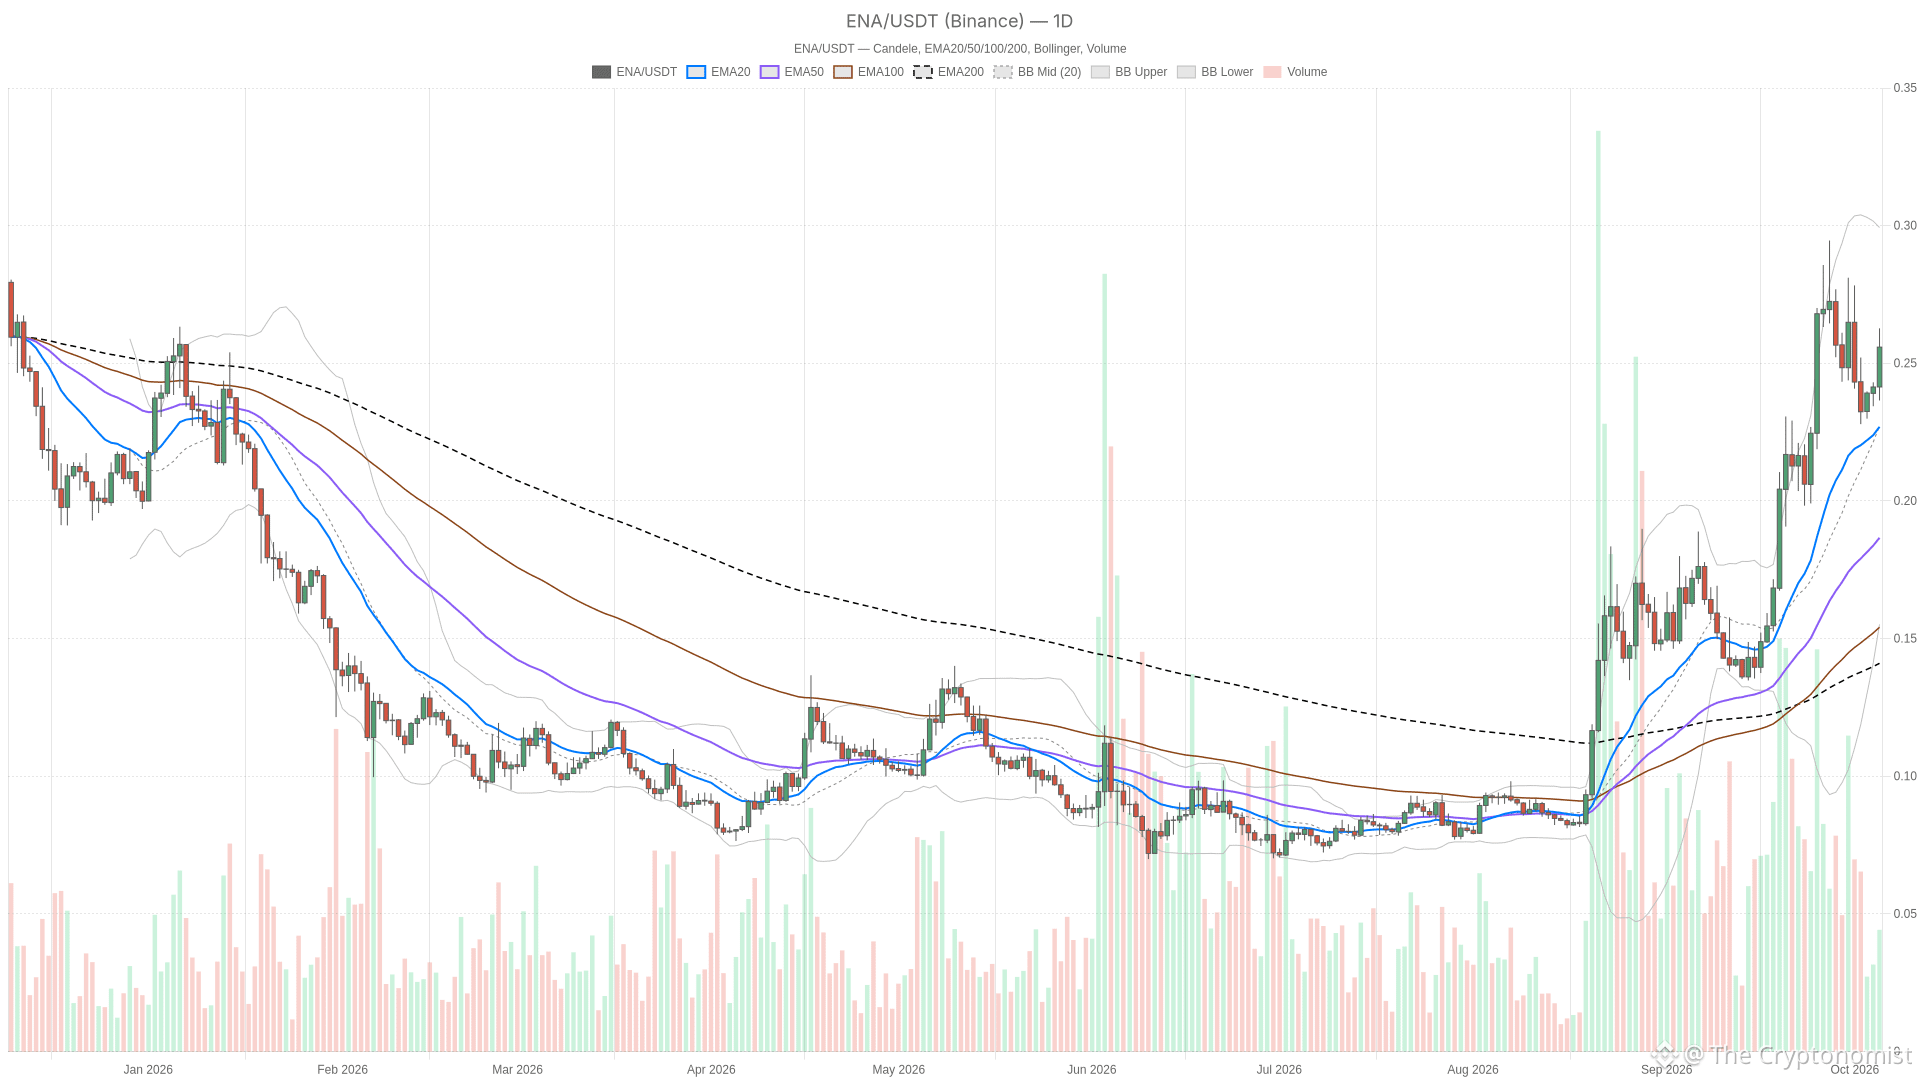
Article
ENA trades at $0.2559 as hourly RSI hits overbought 73.6The crypto market serves up a tense standoff for the Ena price as of October 5, 2026, with the token trading at $0.2559 on Binance, caught between a daily chart that still looks constructively bullish and an hourly tape digesting an overbought move in real time.
ENA/USDT — daily chart with candlesticks, EMA20/EMA50 and volume.
Key takeaways
ENA trades at $0.2559 on Binance while its daily EMAs remain stacked in a textbook bullish order.
Hourly RSI has reached 73.6, signaling overbought conditions that may require consolidation before the next leg.
The daily MACD histogram has turned negative at -0.00228, indicating fading momentum despite the intact trend structure.
Total crypto market capitalization sits near $2.91 trillion, with Bitcoin dominance at 59.22%, creating a mildly pressured backdrop for altcoins.
The Fear & Greed Index reads 70 (Greed), supporting risk appetite but also raising the odds of stretched positioning.
What’s Moving ENA: Market Backdrop and Risk Appetite
The broader crypto market is under mild pressure, with total market capitalization down 2.81% at roughly $2.91 trillion and Bitcoin dominance elevated at 59.22%, yet ENA’s resilience above its daily moving averages stands out against this backdrop. That combination — a market cap pullback alongside still-high Bitcoin dominance — typically means altcoins are absorbing more of the pressure than Bitcoin itself, which makes ENA’s position above its daily EMAs somewhat notable rather than automatic.
The Fear & Greed Index from Alternative.me reads 70, squarely in Greed territory. That is a sentiment backdrop that usually supports risk-taking, but it also raises the odds that positioning is getting a little ahead of itself — which lines up with what the hourly RSI is showing on ENA specifically.
Trend Structure: Daily EMAs Stay Bullish, Hourly Order Turns Mixed
ENA’s daily trend remains structurally bullish with all three major EMAs stacked in proper ascending order, but the hourly chart displays a less organized alignment that complicates the near-term outlook. On the daily chart, ENA trades above its EMA20 ($0.2239), EMA50 ($0.1838) and EMA200 ($0.1399), with the averages stacked in a textbook bullish order — EMA20 above EMA50 above EMA200. The daily regime reads as bullish, and nothing in the moving-average structure contradicts that.
The hourly picture complicates things. Price is still above its EMA20 ($0.2453), EMA50 ($0.2420) and EMA200 ($0.2446), but the order between those averages is not aligned — the EMA20 sits above the EMA200, which in turn sits above the EMA50, so the structure is mixed rather than clean. On the 15-minute chart the averages snap back into bullish order, with the EMA20 at $0.2539, EMA50 at $0.2483 and EMA200 at $0.2419 all below price, which tells you the very short-term trend is intact even as the hourly skeleton looks less organized.
Momentum and Volatility: Hourly RSI Stretches While Daily MACD Rolls Over
The hourly RSI has reached overbought territory at 73.6 and continues climbing, while the daily MACD histogram turns increasingly negative, creating a momentum-versus-structure split that defines the current setup. Daily RSI sits at 60.2, rising over its last three closed readings from 57.8 to 59.6 to 60.2 — momentum building, but nowhere near overbought. The daily MACD tells a different story: the histogram has crossed below the zero line and is losing ground, now at -0.00228 after reading -0.00135 and essentially flat before that.
The hourly RSI is the loudest signal on the board at 73.6, climbing from 62 to 69.6 to 73.6 over its last three closed candles — overbought and still rising. The hourly MACD histogram backs that up, widening on the positive side to +0.00196, which argues bullish momentum was still building into the move that just stalled. On the 15-minute chart, however, RSI is cooling from 68 down to 63 and then 60.7, and the MACD histogram is narrowing to +0.000248 — both consistent with the live pullback from the last closed 15-minute close of $0.2576 to the current level.
Bollinger Bands reinforce the overbought read on the hourly: price is pressing close to the hourly upper band at $0.25677, while on the daily chart there is considerably more room between price and the upper band at $0.30163, with the daily mid-band at $0.22144. Daily ATR14 of $0.0222 points to a market still capable of wide daily swings; hourly ATR14 of $0.0053 is far tighter, as expected for the shorter timeframe.
Key Levels and Scenarios for the Ena Price
Price has already cleared every daily pivot level, leaving the Bollinger upper band at $0.3016 as the next major resistance target, while the $0.2449 confluence zone now acts as the critical support shelf. The daily R1 at $0.2449, the pivot at $0.2396 and S1 at $0.2362 all sit below current price. Notably, that daily R1 at $0.2449 coincides with the hourly EMA200, which turns that zone into a more meaningful support cluster rather than just another isolated number.
On the hourly chart, the setup inverted after the pullback: price is now trading below its own S1 at $0.2562, the hourly Bollinger upper at $0.2568, the hourly pivot at $0.2594 and the hourly R1 at $0.2640 — all of those former reference points now sit above price and act as resistance rather than support. Below current price, the hourly EMA20 at $0.2453, EMA200 at $0.2446, Bollinger mid at $0.2434 and EMA50 at $0.2420 form the nearer support shelf.
The bullish case: a daily close above the Bollinger upper band at $0.3016 would confirm the uptrend has room to extend into fresh highs, something the daily EMA structure already supports. That scenario would be invalidated if price fails to hold the $0.2449 confluence — the daily R1 and hourly EMA200 together — on a daily close, which would point to the daily momentum rollover finally catching up with price.
The bearish case: a daily close below that same $0.2449 confluence level would flag a deeper retracement toward the daily pivot at $0.2396 and daily S1 at $0.2362, essentially unwinding the recent bullish momentum. That bearish read gets invalidated if ENA reclaims the hourly S1 at $0.2562 on an hourly close, which would signal the current pullback was just a reset of an overbought hourly RSI rather than a genuine trend shift. The clearest false signal risk here is treating the hourly overbought reading as an automatic reversal — the daily trend structure has not broken, and the 15-minute chart, while cooling, is still trading above all three of its EMAs.
FAQ
What is ENA’s current price and trend status?
ENA trades at $0.2559 on Binance as of October 5, 2026, after the last completed daily candle closed at $0.2414. The daily regime reads bullish, with price above all three major EMAs stacked in proper ascending order.
Is the daily trend for ENA bullish or bearish?
The daily trend remains structurally bullish, with price above its EMA20 ($0.2239), EMA50 ($0.1838) and EMA200 ($0.1399) in a textbook bullish stacking order, even though the daily MACD histogram has turned negative and is losing ground.
Why does the hourly RSI matter right now?
Hourly RSI sits at 73.6, in overbought territory and still climbing over its last three closed readings, which suggests the recent push may be due for consolidation even as the broader daily trend stays intact.
What would confirm a bullish continuation for ENA?
A daily close above the Bollinger upper band at $0.3016 would support a continuation scenario, while losing the $0.2449 confluence level — where the daily R1 meets the hourly EMA200 — on a daily close would undermine it.
Disclaimer: This article is for informational purposes only and does not constitute financial advice, an investment recommendation, or a solicitation to buy or sell any financial instrument or cryptocurrency. The analysis provided is not indicative of future results. Investing in crypto assets and financial markets carries a high risk of capital loss. Always do your own research (DYOR) and consult a qualified financial advisor before making any decision.
Article produced with the assistance of artificial intelligence and reviewed by the editorial team.
ENA trades at $0.2559 as hourly RSI hits overbought 73.6
The crypto market serves up a tense standoff for the Ena price as of October 5, 2026, with the token trading at $0.2559 on Binance, caught between a daily chart that still looks constructively bullish and an hourly tape digesting an overbought move in real time.
ENA/USDT — daily chart with candlesticks, EMA20/EMA50 and volume.
Key takeaways
ENA trades at $0.2559 on Binance while its daily EMAs remain stacked in a textbook bullish order.
Hourly RSI has reached 73.6, signaling overbought conditions that may require consolidation before the next leg.
The daily MACD histogram has turned negative at -0.00228, indicating fading momentum despite the intact trend structure.
Total crypto market capitalization sits near $2.91 trillion, with Bitcoin dominance at 59.22%, creating a mildly pressured backdrop for altcoins.
The Fear & Greed Index reads 70 (Greed), supporting risk appetite but also raising the odds of stretched positioning.
What’s Moving ENA: Market Backdrop and Risk Appetite
The broader crypto market is under mild pressure, with total market capitalization down 2.81% at roughly $2.91 trillion and Bitcoin dominance elevated at 59.22%, yet ENA’s resilience above its daily moving averages stands out against this backdrop. That combination — a market cap pullback alongside still-high Bitcoin dominance — typically means altcoins are absorbing more of the pressure than Bitcoin itself, which makes ENA’s position above its daily EMAs somewhat notable rather than automatic.
The Fear & Greed Index from Alternative.me reads 70, squarely in Greed territory. That is a sentiment backdrop that usually supports risk-taking, but it also raises the odds that positioning is getting a little ahead of itself — which lines up with what the hourly RSI is showing on ENA specifically.
Trend Structure: Daily EMAs Stay Bullish, Hourly Order Turns Mixed
ENA’s daily trend remains structurally bullish with all three major EMAs stacked in proper ascending order, but the hourly chart displays a less organized alignment that complicates the near-term outlook. On the daily chart, ENA trades above its EMA20 ($0.2239), EMA50 ($0.1838) and EMA200 ($0.1399), with the averages stacked in a textbook bullish order — EMA20 above EMA50 above EMA200. The daily regime reads as bullish, and nothing in the moving-average structure contradicts that.
The hourly picture complicates things. Price is still above its EMA20 ($0.2453), EMA50 ($0.2420) and EMA200 ($0.2446), but the order between those averages is not aligned — the EMA20 sits above the EMA200, which in turn sits above the EMA50, so the structure is mixed rather than clean. On the 15-minute chart the averages snap back into bullish order, with the EMA20 at $0.2539, EMA50 at $0.2483 and EMA200 at $0.2419 all below price, which tells you the very short-term trend is intact even as the hourly skeleton looks less organized.
Momentum and Volatility: Hourly RSI Stretches While Daily MACD Rolls Over
The hourly RSI has reached overbought territory at 73.6 and continues climbing, while the daily MACD histogram turns increasingly negative, creating a momentum-versus-structure split that defines the current setup. Daily RSI sits at 60.2, rising over its last three closed readings from 57.8 to 59.6 to 60.2 — momentum building, but nowhere near overbought. The daily MACD tells a different story: the histogram has crossed below the zero line and is losing ground, now at -0.00228 after reading -0.00135 and essentially flat before that.
The hourly RSI is the loudest signal on the board at 73.6, climbing from 62 to 69.6 to 73.6 over its last three closed candles — overbought and still rising. The hourly MACD histogram backs that up, widening on the positive side to +0.00196, which argues bullish momentum was still building into the move that just stalled. On the 15-minute chart, however, RSI is cooling from 68 down to 63 and then 60.7, and the MACD histogram is narrowing to +0.000248 — both consistent with the live pullback from the last closed 15-minute close of $0.2576 to the current level.
Bollinger Bands reinforce the overbought read on the hourly: price is pressing close to the hourly upper band at $0.25677, while on the daily chart there is considerably more room between price and the upper band at $0.30163, with the daily mid-band at $0.22144. Daily ATR14 of $0.0222 points to a market still capable of wide daily swings; hourly ATR14 of $0.0053 is far tighter, as expected for the shorter timeframe.
Key Levels and Scenarios for the Ena Price
Price has already cleared every daily pivot level, leaving the Bollinger upper band at $0.3016 as the next major resistance target, while the $0.2449 confluence zone now acts as the critical support shelf. The daily R1 at $0.2449, the pivot at $0.2396 and S1 at $0.2362 all sit below current price. Notably, that daily R1 at $0.2449 coincides with the hourly EMA200, which turns that zone into a more meaningful support cluster rather than just another isolated number.
On the hourly chart, the setup inverted after the pullback: price is now trading below its own S1 at $0.2562, the hourly Bollinger upper at $0.2568, the hourly pivot at $0.2594 and the hourly R1 at $0.2640 — all of those former reference points now sit above price and act as resistance rather than support. Below current price, the hourly EMA20 at $0.2453, EMA200 at $0.2446, Bollinger mid at $0.2434 and EMA50 at $0.2420 form the nearer support shelf.
The bullish case: a daily close above the Bollinger upper band at $0.3016 would confirm the uptrend has room to extend into fresh highs, something the daily EMA structure already supports. That scenario would be invalidated if price fails to hold the $0.2449 confluence — the daily R1 and hourly EMA200 together — on a daily close, which would point to the daily momentum rollover finally catching up with price.
The bearish case: a daily close below that same $0.2449 confluence level would flag a deeper retracement toward the daily pivot at $0.2396 and daily S1 at $0.2362, essentially unwinding the recent bullish momentum. That bearish read gets invalidated if ENA reclaims the hourly S1 at $0.2562 on an hourly close, which would signal the current pullback was just a reset of an overbought hourly RSI rather than a genuine trend shift. The clearest false signal risk here is treating the hourly overbought reading as an automatic reversal — the daily trend structure has not broken, and the 15-minute chart, while cooling, is still trading above all three of its EMAs.
FAQ
What is ENA’s current price and trend status?
ENA trades at $0.2559 on Binance as of October 5, 2026, after the last completed daily candle closed at $0.2414. The daily regime reads bullish, with price above all three major EMAs stacked in proper ascending order.
Is the daily trend for ENA bullish or bearish?
The daily trend remains structurally bullish, with price above its EMA20 ($0.2239), EMA50 ($0.1838) and EMA200 ($0.1399) in a textbook bullish stacking order, even though the daily MACD histogram has turned negative and is losing ground.
Why does the hourly RSI matter right now?
Hourly RSI sits at 73.6, in overbought territory and still climbing over its last three closed readings, which suggests the recent push may be due for consolidation even as the broader daily trend stays intact.
What would confirm a bullish continuation for ENA?
A daily close above the Bollinger upper band at $0.3016 would support a continuation scenario, while losing the $0.2449 confluence level — where the daily R1 meets the hourly EMA200 — on a daily close would undermine it.
Disclaimer: This article is for informational purposes only and does not constitute financial advice, an investment recommendation, or a solicitation to buy or sell any financial instrument or cryptocurrency. The analysis provided is not indicative of future results. Investing in crypto assets and financial markets carries a high risk of capital loss. Always do your own research (DYOR) and consult a qualified financial advisor before making any decision.
Article produced with the assistance of artificial intelligence and reviewed by the editorial team.
ENA/USDT — daily chart with candlesticks, EMA20/EMA50 and volume.
Key takeaways
ENA trades at $0.2559 on Binance while its daily EMAs remain stacked in a textbook bullish order.
Hourly RSI has reached 73.6, signaling overbought conditions that may require consolidation before the next leg.
The daily MACD histogram has turned negative at -0.00228, indicating fading momentum despite the intact trend structure.
Total crypto market capitalization sits near $2.91 trillion, with Bitcoin dominance at 59.22%, creating a mildly pressured backdrop for altcoins.
The Fear & Greed Index reads 70 (Greed), supporting risk appetite but also raising the odds of stretched positioning.
What’s Moving ENA: Market Backdrop and Risk Appetite
The broader crypto market is under mild pressure, with total market capitalization down 2.81% at roughly $2.91 trillion and Bitcoin dominance elevated at 59.22%, yet ENA’s resilience above its daily moving averages stands out against this backdrop. That combination — a market cap pullback alongside still-high Bitcoin dominance — typically means altcoins are absorbing more of the pressure than Bitcoin itself, which makes ENA’s position above its daily EMAs somewhat notable rather than automatic.
The Fear & Greed Index from Alternative.me reads 70, squarely in Greed territory. That is a sentiment backdrop that usually supports risk-taking, but it also raises the odds that positioning is getting a little ahead of itself — which lines up with what the hourly RSI is showing on ENA specifically.
Trend Structure: Daily EMAs Stay Bullish, Hourly Order Turns Mixed
ENA’s daily trend remains structurally bullish with all three major EMAs stacked in proper ascending order, but the hourly chart displays a less organized alignment that complicates the near-term outlook. On the daily chart, ENA trades above its EMA20 ($0.2239), EMA50 ($0.1838) and EMA200 ($0.1399), with the averages stacked in a textbook bullish order — EMA20 above EMA50 above EMA200. The daily regime reads as bullish, and nothing in the moving-average structure contradicts that.
The hourly picture complicates things. Price is still above its EMA20 ($0.2453), EMA50 ($0.2420) and EMA200 ($0.2446), but the order between those averages is not aligned — the EMA20 sits above the EMA200, which in turn sits above the EMA50, so the structure is mixed rather than clean. On the 15-minute chart the averages snap back into bullish order, with the EMA20 at $0.2539, EMA50 at $0.2483 and EMA200 at $0.2419 all below price, which tells you the very short-term trend is intact even as the hourly skeleton looks less organized.
Momentum and Volatility: Hourly RSI Stretches While Daily MACD Rolls Over
The hourly RSI has reached overbought territory at 73.6 and continues climbing, while the daily MACD histogram turns increasingly negative, creating a momentum-versus-structure split that defines the current setup. Daily RSI sits at 60.2, rising over its last three closed readings from 57.8 to 59.6 to 60.2 — momentum building, but nowhere near overbought. The daily MACD tells a different story: the histogram has crossed below the zero line and is losing ground, now at -0.00228 after reading -0.00135 and essentially flat before that.
The hourly RSI is the loudest signal on the board at 73.6, climbing from 62 to 69.6 to 73.6 over its last three closed candles — overbought and still rising. The hourly MACD histogram backs that up, widening on the positive side to +0.00196, which argues bullish momentum was still building into the move that just stalled. On the 15-minute chart, however, RSI is cooling from 68 down to 63 and then 60.7, and the MACD histogram is narrowing to +0.000248 — both consistent with the live pullback from the last closed 15-minute close of $0.2576 to the current level.
Bollinger Bands reinforce the overbought read on the hourly: price is pressing close to the hourly upper band at $0.25677, while on the daily chart there is considerably more room between price and the upper band at $0.30163, with the daily mid-band at $0.22144. Daily ATR14 of $0.0222 points to a market still capable of wide daily swings; hourly ATR14 of $0.0053 is far tighter, as expected for the shorter timeframe.
Key Levels and Scenarios for the Ena Price
Price has already cleared every daily pivot level, leaving the Bollinger upper band at $0.3016 as the next major resistance target, while the $0.2449 confluence zone now acts as the critical support shelf. The daily R1 at $0.2449, the pivot at $0.2396 and S1 at $0.2362 all sit below current price. Notably, that daily R1 at $0.2449 coincides with the hourly EMA200, which turns that zone into a more meaningful support cluster rather than just another isolated number.
On the hourly chart, the setup inverted after the pullback: price is now trading below its own S1 at $0.2562, the hourly Bollinger upper at $0.2568, the hourly pivot at $0.2594 and the hourly R1 at $0.2640 — all of those former reference points now sit above price and act as resistance rather than support. Below current price, the hourly EMA20 at $0.2453, EMA200 at $0.2446, Bollinger mid at $0.2434 and EMA50 at $0.2420 form the nearer support shelf.
The bullish case: a daily close above the Bollinger upper band at $0.3016 would confirm the uptrend has room to extend into fresh highs, something the daily EMA structure already supports. That scenario would be invalidated if price fails to hold the $0.2449 confluence — the daily R1 and hourly EMA200 together — on a daily close, which would point to the daily momentum rollover finally catching up with price.
The bearish case: a daily close below that same $0.2449 confluence level would flag a deeper retracement toward the daily pivot at $0.2396 and daily S1 at $0.2362, essentially unwinding the recent bullish momentum. That bearish read gets invalidated if ENA reclaims the hourly S1 at $0.2562 on an hourly close, which would signal the current pullback was just a reset of an overbought hourly RSI rather than a genuine trend shift. The clearest false signal risk here is treating the hourly overbought reading as an automatic reversal — the daily trend structure has not broken, and the 15-minute chart, while cooling, is still trading above all three of its EMAs.
FAQ
What is ENA’s current price and trend status?
ENA trades at $0.2559 on Binance as of October 5, 2026, after the last completed daily candle closed at $0.2414. The daily regime reads bullish, with price above all three major EMAs stacked in proper ascending order.
Is the daily trend for ENA bullish or bearish?
The daily trend remains structurally bullish, with price above its EMA20 ($0.2239), EMA50 ($0.1838) and EMA200 ($0.1399) in a textbook bullish stacking order, even though the daily MACD histogram has turned negative and is losing ground.
Why does the hourly RSI matter right now?
Hourly RSI sits at 73.6, in overbought territory and still climbing over its last three closed readings, which suggests the recent push may be due for consolidation even as the broader daily trend stays intact.
What would confirm a bullish continuation for ENA?
A daily close above the Bollinger upper band at $0.3016 would support a continuation scenario, while losing the $0.2449 confluence level — where the daily R1 meets the hourly EMA200 — on a daily close would undermine it.
Disclaimer: This article is for informational purposes only and does not constitute financial advice, an investment recommendation, or a solicitation to buy or sell any financial instrument or cryptocurrency. The analysis provided is not indicative of future results. Investing in crypto assets and financial markets carries a high risk of capital loss. Always do your own research (DYOR) and consult a qualified financial advisor before making any decision.
Article produced with the assistance of artificial intelligence and reviewed by the editorial team.
410
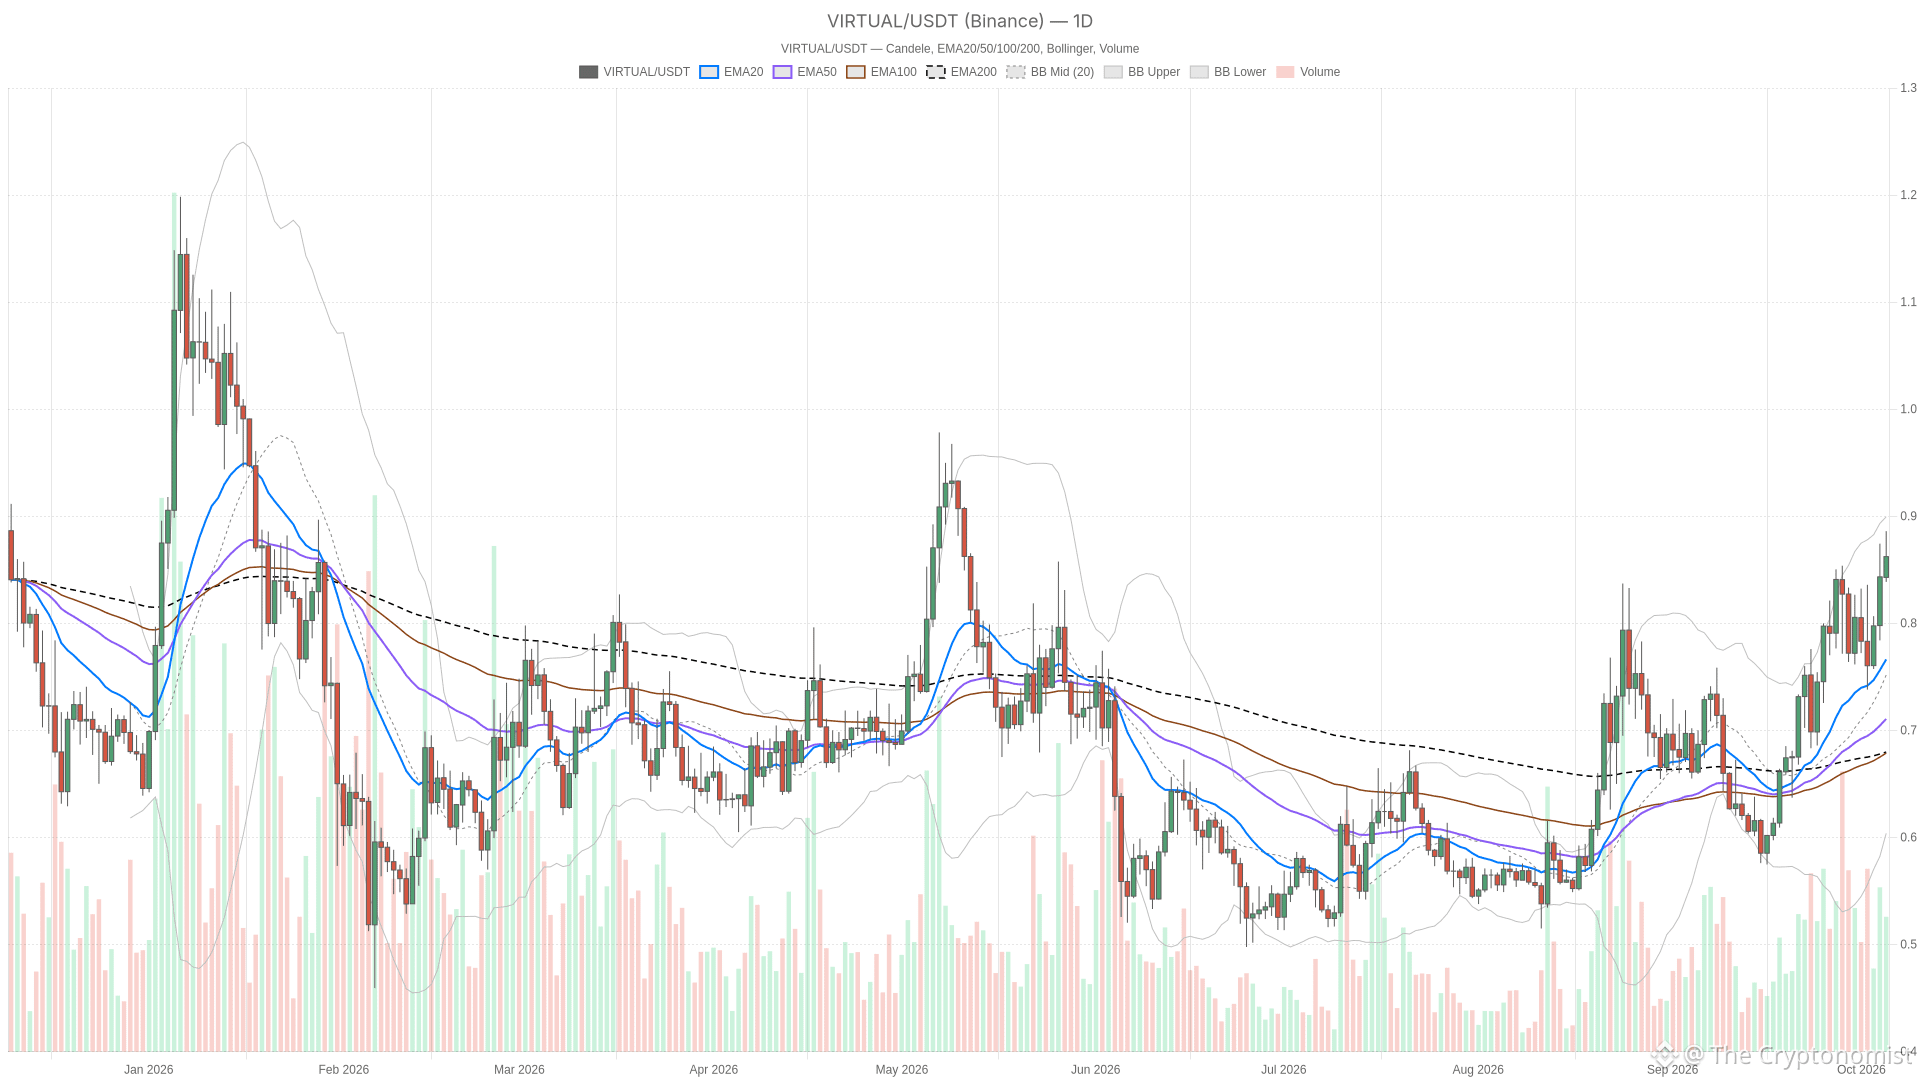
Article
Virtual holds above $0.86 as daily trend stays bullishThe tension between a strong daily trend and cooling hourly momentum defines the current setup as the VIRTUAL price trades at $0.8623 on Binance. VIRTUAL sits comfortably above every major daily moving average after the last completed daily candle closed at $0.8434.
VIRTUAL/USDT — daily chart with candlesticks, EMA20/EMA50 and volume.
Key takeaways
VIRTUAL trades at $0.8623 on Binance, above every major daily moving average after the last completed daily close at $0.8434.
The daily EMA stack — EMA20, EMA50, EMA200 — is in textbook bullish alignment, confirming buyers control the higher timeframe.
Daily RSI has risen to 62.9 while the hourly RSI has cooled from 69.4 to 63.1, highlighting the tension between timeframes.
The hourly MACD histogram has turned negative after crossing below zero, signaling near-term momentum loss despite intact structure.
A daily close above $0.88383 would open the path higher; an hourly close below $0.86023 would confirm near-term weakness.
Broader market cap near $2.91 trillion as BTC dominance sits at 59.2%
Total crypto market capitalization sits near $2.91 trillion with Bitcoin dominance at 59.23%, providing important context for VIRTUAL’s relative strength as the broader market pulls back. Per CoinGecko, the market cap is down 2.74% over the past 24 hours, while Bitcoin dominance holds at 59.23%. The Fear & Greed Index sits at 70 (Alternative.me), in Greed territory, reinforcing that sentiment remains elevated.
That backdrop is worth flagging because the VIRTUAL price is holding its ground — and even extending gains versus its last completed daily close — at a moment when the wider market is pulling back. The divergence points to asset-specific demand rather than a broad risk-on tide, a dynamic worth watching if the overall market mood sours further.
Daily EMA stack stays textbook bullish, but hourly and 15-minute price action diverge
VIRTUAL’s daily EMA structure leaves little room for doubt: price sits above the EMA20 ($0.75622), EMA50 ($0.70452) and EMA200 ($0.67793), with all three averages stacked in textbook bullish order. The hourly chart tells a similar structural story — price remains above its EMA20 ($0.85478), EMA50 ($0.82956) and EMA200 ($0.8005), with the averages again aligned bullishly.
However, structure and momentum are not always in agreement. On the 15-minute chart, price has slipped below both the EMA20 ($0.86936) and EMA50 ($0.86382), even though it remains above the EMA200 ($0.83086) and the short-term EMA order itself is still stacked bullish. In practice, that is a short-term pullback inside a bigger uptrend — the kind of setup where the daily trend is intact but the most recent candles are chopping sideways to lower just beneath it.
Daily RSI rising toward 63 as hourly momentum fades from a higher reading
The daily RSI has climbed over its last three closed readings to 62.9, confirming that momentum on the higher timeframe is building rather than merely coasting, while the hourly RSI tells a different story of fading thrust. The sequence — 54.4, then 58.5, then 62.9 — lines up with the bullish EMA stack. It is approaching overbought territory but has not crossed the 70 threshold, so there is still room before the daily chart would flag itself as stretched.
The hourly RSI, by contrast, has been falling — from 69.4 to 63.1 over its last three closed candles — even though the absolute level is still firmly on the bullish side of neutral. That is the cooling-momentum signal worth paying attention to: price is holding up, but the pace of the advance on the hourly timeframe is losing steam.
Meanwhile, the 15-minute RSI sits around 45.2 and is essentially flat across its last three readings, simply confirming that the shortest timeframe is in a holding pattern rather than trending either way.
MACD tells a matching story. On the daily chart the histogram is positive and widening, which fits with a trend that is still gaining conviction. On the hourly chart, however, the histogram has flipped from positive to negative over its last three readings and has crossed below the zero line — a clear sign that near-term momentum has turned down even while the broader hourly structure stays bullish. Similarly, the 15-minute histogram is negative but flat, offering no fresh directional signal, just confirmation that the shortest-term tape is in limbo.
Volatility context adds more color. The daily Bollinger Bands have VIRTUAL riding close to the upper band at $0.89336, with the mid-band at $0.73786 and the lower band down at $0.58236 — a wide range that reflects how far the daily trend has already stretched. The daily ATR of roughly $0.062 underlines that moves of several cents in either direction are well within normal daily behavior for this asset.
On the hourly chart, meanwhile, price sits between the Bollinger mid ($0.85775) and upper band ($0.88583), with an ATR near $0.0135, while the 15-minute bands have price below the midline ($0.87243) with a much tighter ATR near $0.0068 — consistent with the short-term consolidation already flagged in the RSI and MACD readings.
Key levels: daily R1 at $0.88383 versus hourly support at $0.86023
With VIRTUAL at $0.8623, the nearest overhead resistance on the daily chart sits at the daily R1 ($0.88383) and the daily Bollinger upper band ($0.89336). On the hourly timeframe, resistance builds just above current price at the hourly pivot ($0.86587), the hourly R1 ($0.87083) and the hourly Bollinger upper band ($0.88583).
Below current price, the hourly S1 at $0.86023, the hourly Bollinger mid at $0.85775 and the hourly EMA20 at $0.85478 form the first layer of support, with the hourly EMA50 ($0.82956) and hourly Bollinger lower band ($0.82968) sitting further down. On the daily chart, the daily pivot at $0.83397 is the first real support, followed by the daily S1 at $0.79353 and the daily EMA20 at $0.75622.
The bullish scenario hinges on a daily close above the daily R1 at $0.88383, which would open the path toward the daily Bollinger upper band at $0.89336 and suggest the daily uptrend is absorbing the recent hourly momentum loss without much damage. That case would be invalidated by a daily close back below the daily pivot at $0.83397, which would signal the pullback has gone deeper than a routine hourly cooldown.
Conversely, the bearish scenario centers on an hourly close below the hourly S1 at $0.86023, which would confirm the hourly momentum fade is translating into actual price weakness and could pull VIRTUAL toward the hourly EMA50 at $0.82956. That setup would be invalidated by an hourly close back above the hourly pivot at $0.86587, which would put buyers back in control of the near-term tape and ease the divergence between the daily and hourly readings.
The real risk here is treating the hourly MACD’s move below zero as a trend reversal when the daily chart — and the overall EMA structure across every timeframe — still points bullish. A shallow, short-lived dip that holds above the hourly S1 and the daily pivot would be consistent with normal consolidation inside an intact uptrend, not a change in the broader bias.
FAQ
What is VIRTUAL doing right now?
As of October 5, 2026, VIRTUAL is trading at $0.8623 on Binance, above its last completed daily close of $0.8434 and above every major daily moving average.
Is the daily trend for VIRTUAL bullish or bearish?
The daily regime is bullish, with price above the EMA20, EMA50 and EMA200, a textbook bullish EMA order, a rising RSI near 63, and a MACD histogram that is positive and widening.
Why is the hourly chart showing weaker momentum?
The hourly RSI has fallen from 69.4 to 63.1 over its last three closed readings, and the hourly MACD histogram has turned negative after crossing below zero, even though price remains above all three hourly EMAs.
What are the key levels to watch for VIRTUAL’s next move?
A daily close above the daily R1 at $0.88383 would support a bullish breakout toward $0.89336, while an hourly close below the hourly S1 at $0.86023 would signal further downside toward $0.82956. A daily close below $0.83397 invalidates the bullish case, and an hourly close above $0.86587 invalidates the bearish one.
Disclaimer: This article is for informational purposes only and does not constitute financial advice, an investment recommendation, or a solicitation to buy or sell any financial instrument or cryptocurrency. The analysis provided is not indicative of future results. Investing in crypto assets and financial markets carries a high risk of capital loss. Always do your own research (DYOR) and consult a qualified financial advisor before making any decision.
Article produced with the assistance of artificial intelligence and reviewed by the editorial team.
Virtual holds above $0.86 as daily trend stays bullish
The tension between a strong daily trend and cooling hourly momentum defines the current setup as the VIRTUAL price trades at $0.8623 on Binance. VIRTUAL sits comfortably above every major daily moving average after the last completed daily candle closed at $0.8434.
VIRTUAL/USDT — daily chart with candlesticks, EMA20/EMA50 and volume.
Key takeaways
VIRTUAL trades at $0.8623 on Binance, above every major daily moving average after the last completed daily close at $0.8434.
The daily EMA stack — EMA20, EMA50, EMA200 — is in textbook bullish alignment, confirming buyers control the higher timeframe.
Daily RSI has risen to 62.9 while the hourly RSI has cooled from 69.4 to 63.1, highlighting the tension between timeframes.
The hourly MACD histogram has turned negative after crossing below zero, signaling near-term momentum loss despite intact structure.
A daily close above $0.88383 would open the path higher; an hourly close below $0.86023 would confirm near-term weakness.
Broader market cap near $2.91 trillion as BTC dominance sits at 59.2%
Total crypto market capitalization sits near $2.91 trillion with Bitcoin dominance at 59.23%, providing important context for VIRTUAL’s relative strength as the broader market pulls back. Per CoinGecko, the market cap is down 2.74% over the past 24 hours, while Bitcoin dominance holds at 59.23%. The Fear & Greed Index sits at 70 (Alternative.me), in Greed territory, reinforcing that sentiment remains elevated.
That backdrop is worth flagging because the VIRTUAL price is holding its ground — and even extending gains versus its last completed daily close — at a moment when the wider market is pulling back. The divergence points to asset-specific demand rather than a broad risk-on tide, a dynamic worth watching if the overall market mood sours further.
Daily EMA stack stays textbook bullish, but hourly and 15-minute price action diverge
VIRTUAL’s daily EMA structure leaves little room for doubt: price sits above the EMA20 ($0.75622), EMA50 ($0.70452) and EMA200 ($0.67793), with all three averages stacked in textbook bullish order. The hourly chart tells a similar structural story — price remains above its EMA20 ($0.85478), EMA50 ($0.82956) and EMA200 ($0.8005), with the averages again aligned bullishly.
However, structure and momentum are not always in agreement. On the 15-minute chart, price has slipped below both the EMA20 ($0.86936) and EMA50 ($0.86382), even though it remains above the EMA200 ($0.83086) and the short-term EMA order itself is still stacked bullish. In practice, that is a short-term pullback inside a bigger uptrend — the kind of setup where the daily trend is intact but the most recent candles are chopping sideways to lower just beneath it.
Daily RSI rising toward 63 as hourly momentum fades from a higher reading
The daily RSI has climbed over its last three closed readings to 62.9, confirming that momentum on the higher timeframe is building rather than merely coasting, while the hourly RSI tells a different story of fading thrust. The sequence — 54.4, then 58.5, then 62.9 — lines up with the bullish EMA stack. It is approaching overbought territory but has not crossed the 70 threshold, so there is still room before the daily chart would flag itself as stretched.
The hourly RSI, by contrast, has been falling — from 69.4 to 63.1 over its last three closed candles — even though the absolute level is still firmly on the bullish side of neutral. That is the cooling-momentum signal worth paying attention to: price is holding up, but the pace of the advance on the hourly timeframe is losing steam.
Meanwhile, the 15-minute RSI sits around 45.2 and is essentially flat across its last three readings, simply confirming that the shortest timeframe is in a holding pattern rather than trending either way.
MACD tells a matching story. On the daily chart the histogram is positive and widening, which fits with a trend that is still gaining conviction. On the hourly chart, however, the histogram has flipped from positive to negative over its last three readings and has crossed below the zero line — a clear sign that near-term momentum has turned down even while the broader hourly structure stays bullish. Similarly, the 15-minute histogram is negative but flat, offering no fresh directional signal, just confirmation that the shortest-term tape is in limbo.
Volatility context adds more color. The daily Bollinger Bands have VIRTUAL riding close to the upper band at $0.89336, with the mid-band at $0.73786 and the lower band down at $0.58236 — a wide range that reflects how far the daily trend has already stretched. The daily ATR of roughly $0.062 underlines that moves of several cents in either direction are well within normal daily behavior for this asset.
On the hourly chart, meanwhile, price sits between the Bollinger mid ($0.85775) and upper band ($0.88583), with an ATR near $0.0135, while the 15-minute bands have price below the midline ($0.87243) with a much tighter ATR near $0.0068 — consistent with the short-term consolidation already flagged in the RSI and MACD readings.
Key levels: daily R1 at $0.88383 versus hourly support at $0.86023
With VIRTUAL at $0.8623, the nearest overhead resistance on the daily chart sits at the daily R1 ($0.88383) and the daily Bollinger upper band ($0.89336). On the hourly timeframe, resistance builds just above current price at the hourly pivot ($0.86587), the hourly R1 ($0.87083) and the hourly Bollinger upper band ($0.88583).
Below current price, the hourly S1 at $0.86023, the hourly Bollinger mid at $0.85775 and the hourly EMA20 at $0.85478 form the first layer of support, with the hourly EMA50 ($0.82956) and hourly Bollinger lower band ($0.82968) sitting further down. On the daily chart, the daily pivot at $0.83397 is the first real support, followed by the daily S1 at $0.79353 and the daily EMA20 at $0.75622.
The bullish scenario hinges on a daily close above the daily R1 at $0.88383, which would open the path toward the daily Bollinger upper band at $0.89336 and suggest the daily uptrend is absorbing the recent hourly momentum loss without much damage. That case would be invalidated by a daily close back below the daily pivot at $0.83397, which would signal the pullback has gone deeper than a routine hourly cooldown.
Conversely, the bearish scenario centers on an hourly close below the hourly S1 at $0.86023, which would confirm the hourly momentum fade is translating into actual price weakness and could pull VIRTUAL toward the hourly EMA50 at $0.82956. That setup would be invalidated by an hourly close back above the hourly pivot at $0.86587, which would put buyers back in control of the near-term tape and ease the divergence between the daily and hourly readings.
The real risk here is treating the hourly MACD’s move below zero as a trend reversal when the daily chart — and the overall EMA structure across every timeframe — still points bullish. A shallow, short-lived dip that holds above the hourly S1 and the daily pivot would be consistent with normal consolidation inside an intact uptrend, not a change in the broader bias.
FAQ
What is VIRTUAL doing right now?
As of October 5, 2026, VIRTUAL is trading at $0.8623 on Binance, above its last completed daily close of $0.8434 and above every major daily moving average.
Is the daily trend for VIRTUAL bullish or bearish?
The daily regime is bullish, with price above the EMA20, EMA50 and EMA200, a textbook bullish EMA order, a rising RSI near 63, and a MACD histogram that is positive and widening.
Why is the hourly chart showing weaker momentum?
The hourly RSI has fallen from 69.4 to 63.1 over its last three closed readings, and the hourly MACD histogram has turned negative after crossing below zero, even though price remains above all three hourly EMAs.
What are the key levels to watch for VIRTUAL’s next move?
A daily close above the daily R1 at $0.88383 would support a bullish breakout toward $0.89336, while an hourly close below the hourly S1 at $0.86023 would signal further downside toward $0.82956. A daily close below $0.83397 invalidates the bullish case, and an hourly close above $0.86587 invalidates the bearish one.
Disclaimer: This article is for informational purposes only and does not constitute financial advice, an investment recommendation, or a solicitation to buy or sell any financial instrument or cryptocurrency. The analysis provided is not indicative of future results. Investing in crypto assets and financial markets carries a high risk of capital loss. Always do your own research (DYOR) and consult a qualified financial advisor before making any decision.
Article produced with the assistance of artificial intelligence and reviewed by the editorial team.
VIRTUAL/USDT — daily chart with candlesticks, EMA20/EMA50 and volume.
Key takeaways
VIRTUAL trades at $0.8623 on Binance, above every major daily moving average after the last completed daily close at $0.8434.
The daily EMA stack — EMA20, EMA50, EMA200 — is in textbook bullish alignment, confirming buyers control the higher timeframe.
Daily RSI has risen to 62.9 while the hourly RSI has cooled from 69.4 to 63.1, highlighting the tension between timeframes.
The hourly MACD histogram has turned negative after crossing below zero, signaling near-term momentum loss despite intact structure.
A daily close above $0.88383 would open the path higher; an hourly close below $0.86023 would confirm near-term weakness.
Broader market cap near $2.91 trillion as BTC dominance sits at 59.2%
Total crypto market capitalization sits near $2.91 trillion with Bitcoin dominance at 59.23%, providing important context for VIRTUAL’s relative strength as the broader market pulls back. Per CoinGecko, the market cap is down 2.74% over the past 24 hours, while Bitcoin dominance holds at 59.23%. The Fear & Greed Index sits at 70 (Alternative.me), in Greed territory, reinforcing that sentiment remains elevated.
That backdrop is worth flagging because the VIRTUAL price is holding its ground — and even extending gains versus its last completed daily close — at a moment when the wider market is pulling back. The divergence points to asset-specific demand rather than a broad risk-on tide, a dynamic worth watching if the overall market mood sours further.
Daily EMA stack stays textbook bullish, but hourly and 15-minute price action diverge
VIRTUAL’s daily EMA structure leaves little room for doubt: price sits above the EMA20 ($0.75622), EMA50 ($0.70452) and EMA200 ($0.67793), with all three averages stacked in textbook bullish order. The hourly chart tells a similar structural story — price remains above its EMA20 ($0.85478), EMA50 ($0.82956) and EMA200 ($0.8005), with the averages again aligned bullishly.
However, structure and momentum are not always in agreement. On the 15-minute chart, price has slipped below both the EMA20 ($0.86936) and EMA50 ($0.86382), even though it remains above the EMA200 ($0.83086) and the short-term EMA order itself is still stacked bullish. In practice, that is a short-term pullback inside a bigger uptrend — the kind of setup where the daily trend is intact but the most recent candles are chopping sideways to lower just beneath it.
Daily RSI rising toward 63 as hourly momentum fades from a higher reading
The daily RSI has climbed over its last three closed readings to 62.9, confirming that momentum on the higher timeframe is building rather than merely coasting, while the hourly RSI tells a different story of fading thrust. The sequence — 54.4, then 58.5, then 62.9 — lines up with the bullish EMA stack. It is approaching overbought territory but has not crossed the 70 threshold, so there is still room before the daily chart would flag itself as stretched.
The hourly RSI, by contrast, has been falling — from 69.4 to 63.1 over its last three closed candles — even though the absolute level is still firmly on the bullish side of neutral. That is the cooling-momentum signal worth paying attention to: price is holding up, but the pace of the advance on the hourly timeframe is losing steam.
Meanwhile, the 15-minute RSI sits around 45.2 and is essentially flat across its last three readings, simply confirming that the shortest timeframe is in a holding pattern rather than trending either way.
MACD tells a matching story. On the daily chart the histogram is positive and widening, which fits with a trend that is still gaining conviction. On the hourly chart, however, the histogram has flipped from positive to negative over its last three readings and has crossed below the zero line — a clear sign that near-term momentum has turned down even while the broader hourly structure stays bullish. Similarly, the 15-minute histogram is negative but flat, offering no fresh directional signal, just confirmation that the shortest-term tape is in limbo.
Volatility context adds more color. The daily Bollinger Bands have VIRTUAL riding close to the upper band at $0.89336, with the mid-band at $0.73786 and the lower band down at $0.58236 — a wide range that reflects how far the daily trend has already stretched. The daily ATR of roughly $0.062 underlines that moves of several cents in either direction are well within normal daily behavior for this asset.
On the hourly chart, meanwhile, price sits between the Bollinger mid ($0.85775) and upper band ($0.88583), with an ATR near $0.0135, while the 15-minute bands have price below the midline ($0.87243) with a much tighter ATR near $0.0068 — consistent with the short-term consolidation already flagged in the RSI and MACD readings.
Key levels: daily R1 at $0.88383 versus hourly support at $0.86023
With VIRTUAL at $0.8623, the nearest overhead resistance on the daily chart sits at the daily R1 ($0.88383) and the daily Bollinger upper band ($0.89336). On the hourly timeframe, resistance builds just above current price at the hourly pivot ($0.86587), the hourly R1 ($0.87083) and the hourly Bollinger upper band ($0.88583).
Below current price, the hourly S1 at $0.86023, the hourly Bollinger mid at $0.85775 and the hourly EMA20 at $0.85478 form the first layer of support, with the hourly EMA50 ($0.82956) and hourly Bollinger lower band ($0.82968) sitting further down. On the daily chart, the daily pivot at $0.83397 is the first real support, followed by the daily S1 at $0.79353 and the daily EMA20 at $0.75622.
The bullish scenario hinges on a daily close above the daily R1 at $0.88383, which would open the path toward the daily Bollinger upper band at $0.89336 and suggest the daily uptrend is absorbing the recent hourly momentum loss without much damage. That case would be invalidated by a daily close back below the daily pivot at $0.83397, which would signal the pullback has gone deeper than a routine hourly cooldown.
Conversely, the bearish scenario centers on an hourly close below the hourly S1 at $0.86023, which would confirm the hourly momentum fade is translating into actual price weakness and could pull VIRTUAL toward the hourly EMA50 at $0.82956. That setup would be invalidated by an hourly close back above the hourly pivot at $0.86587, which would put buyers back in control of the near-term tape and ease the divergence between the daily and hourly readings.
The real risk here is treating the hourly MACD’s move below zero as a trend reversal when the daily chart — and the overall EMA structure across every timeframe — still points bullish. A shallow, short-lived dip that holds above the hourly S1 and the daily pivot would be consistent with normal consolidation inside an intact uptrend, not a change in the broader bias.
FAQ
What is VIRTUAL doing right now?
As of October 5, 2026, VIRTUAL is trading at $0.8623 on Binance, above its last completed daily close of $0.8434 and above every major daily moving average.
Is the daily trend for VIRTUAL bullish or bearish?
The daily regime is bullish, with price above the EMA20, EMA50 and EMA200, a textbook bullish EMA order, a rising RSI near 63, and a MACD histogram that is positive and widening.
Why is the hourly chart showing weaker momentum?
The hourly RSI has fallen from 69.4 to 63.1 over its last three closed readings, and the hourly MACD histogram has turned negative after crossing below zero, even though price remains above all three hourly EMAs.
What are the key levels to watch for VIRTUAL’s next move?
A daily close above the daily R1 at $0.88383 would support a bullish breakout toward $0.89336, while an hourly close below the hourly S1 at $0.86023 would signal further downside toward $0.82956. A daily close below $0.83397 invalidates the bullish case, and an hourly close above $0.86587 invalidates the bearish one.
Disclaimer: This article is for informational purposes only and does not constitute financial advice, an investment recommendation, or a solicitation to buy or sell any financial instrument or cryptocurrency. The analysis provided is not indicative of future results. Investing in crypto assets and financial markets carries a high risk of capital loss. Always do your own research (DYOR) and consult a qualified financial advisor before making any decision.
Article produced with the assistance of artificial intelligence and reviewed by the editorial team.
91
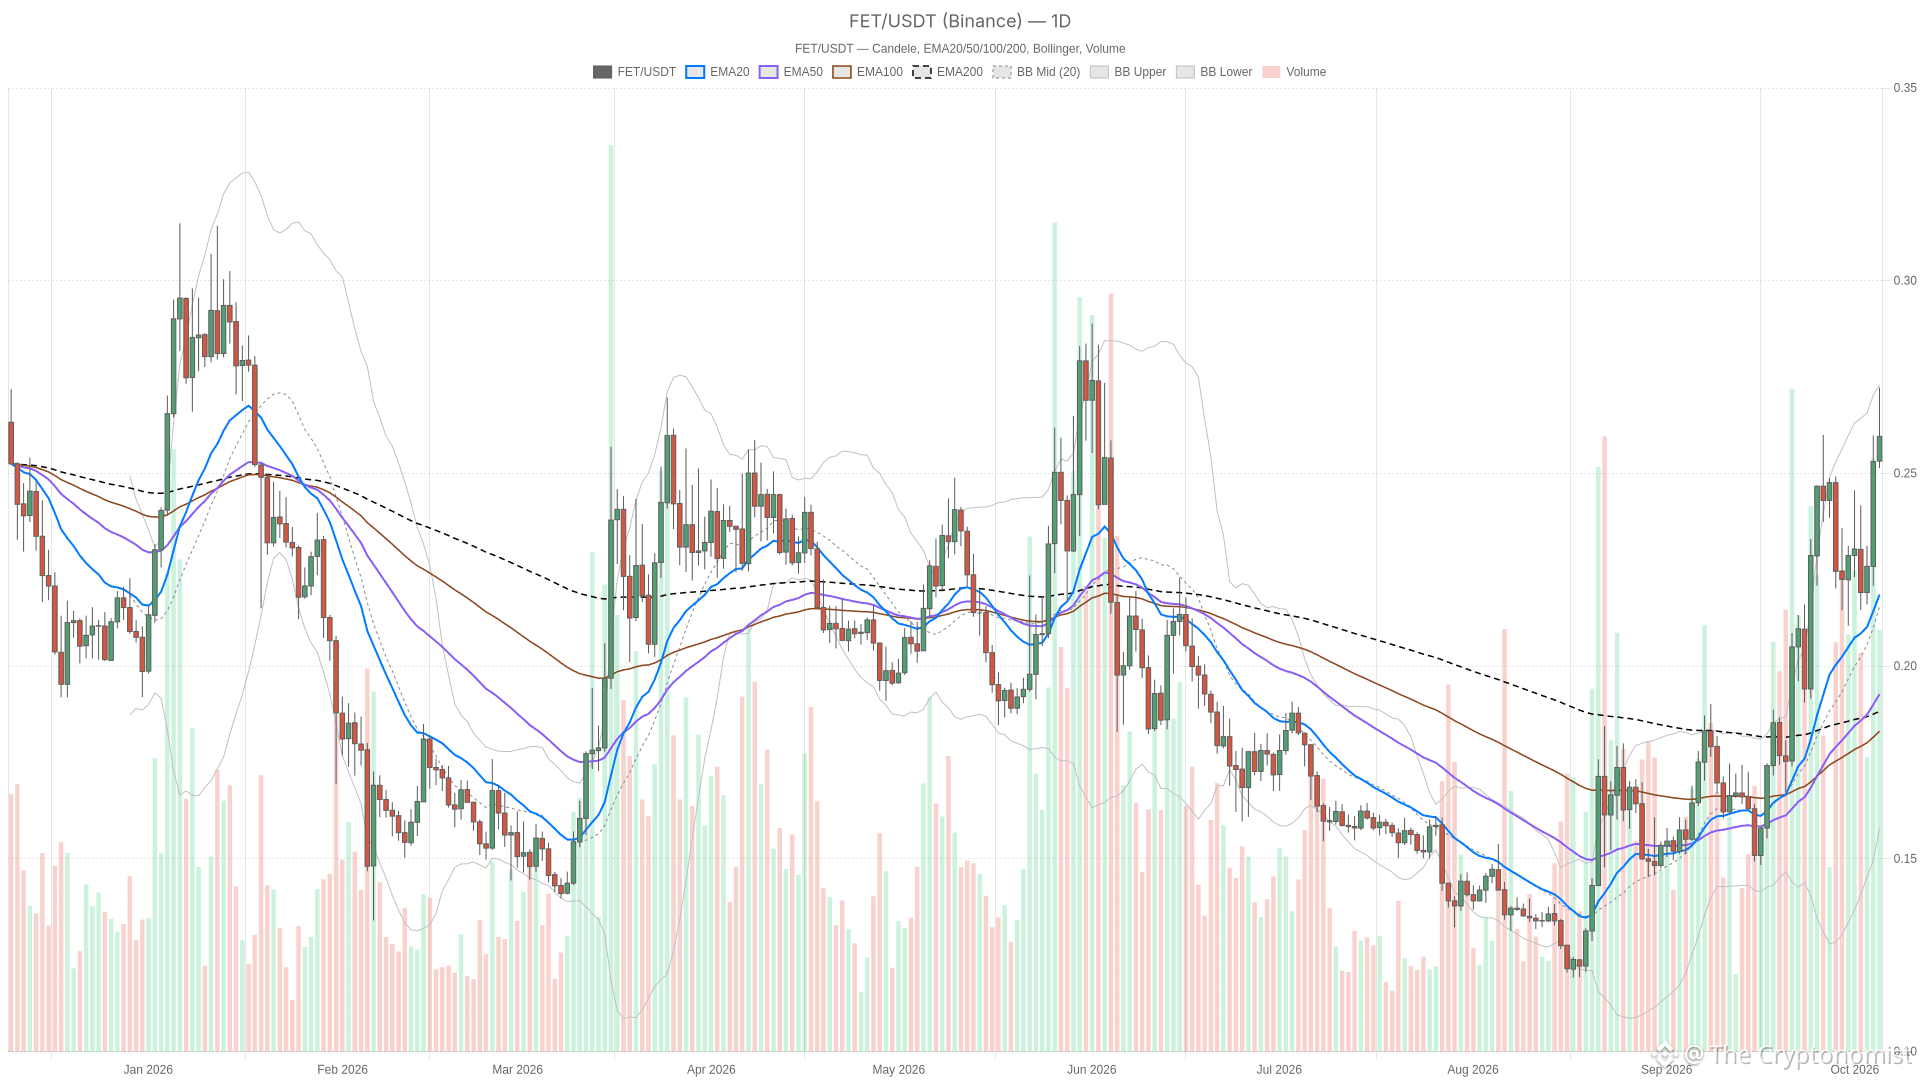
Article
FET stays bullish above $0.2596 as hourly momentum fadesAs of October 5, 2026, the FET price trades at $0.2596 on Binance, above every major daily moving average. The daily trend is unambiguously bullish: RSI is climbing and the MACD histogram just flipped positive. The tension lies in shorter timeframes, where momentum is already cooling while structure holds.
FET/USDT — daily chart with candlesticks, EMA20/EMA50 and volume.
Key takeaways
FET at $0.2596 sits above the daily EMA20, EMA50, and EMA200 in a textbook bullish alignment.
Daily RSI at 67.0 and a newly positive MACD histogram confirm the uptrend, while hourly momentum tells a different story.
Total crypto market cap stands at $2.91 trillion, down 2.74% in 24 hours, with Bitcoin dominance at 59.23%.
A daily close above $0.2684 would open the path toward $0.2703; an hourly close below $0.2593 signals a deepening pullback.
The Fear & Greed Index reads 70, firmly in Greed territory per Alternative.me.
Broader Market Cools While FET Price Pushes Against Resistance
The broader crypto market is contracting even as FET pushes against resistance near $0.2684, with total market capitalization down 2.74% to $2.91 trillion over the past 24 hours.
Total crypto market capitalization sits at $2.91 trillion, down 2.74% over the past 24 hours, according to CoinGecko. Bitcoin dominance is at 59.23%, also per CoinGecko. The Fear & Greed Index, tracked by Alternative.me, reads 70, in Greed territory. That combination — elevated sentiment alongside contracting total capitalization — does not necessarily favor altcoins pushing into resistance, since broader liquidity is not confirming the move. The move looks more like an asset-specific push than something riding a market-wide tailwind.
Daily Structure: EMAs Aligned Bullish, But Not Everywhere
The daily EMA structure is unambiguously bullish, with price above all three major moving averages stacked in textbook order — EMA20 above EMA50 above EMA200.
On the daily chart, price sits above the EMA20 ($0.2142), EMA50 ($0.1900), and EMA200 ($0.1876), with the EMA order confirming the medium-term uptrend without ambiguity. The hourly chart tells the same structural story — price above all three EMAs ($0.2554, $0.2445, $0.2324), with the same bullish stacking.
The 15-minute chart keeps the bullish EMA order too, but price itself is mixed against it. It sits below the 15-minute EMA20 ($0.2616), yet still above the EMA50 ($0.2588) and EMA200 ($0.2444). That is a short-term wobble inside a longer-term uptrend, not a reversal signal on its own. It does mean the very short-term tape is more fragile than the daily chart suggests.
Momentum Diverges: Daily RSI Climbs While Hourly MACD Fades
Daily momentum indicators align with the bullish trend. RSI at 67.0 is climbing and the MACD histogram just turned positive. Hourly indicators, meanwhile, show momentum fading, creating a divergence between timeframes.
Daily RSI sits at 67.0, up from 57.4 and 59.6 over the prior two closed candles — a clear climb, though still short of overbought territory. The daily MACD histogram just crossed from negative to positive, flipping from -0.0003 to +0.00086 across the last three closed candles. This lines up with the bullish regime read.
The hourly chart, meanwhile, breaks from that script. RSI there reads 62.4, but the three-candle sequence (66.9 → 59.8 → 62.4) is mixed rather than trending in either direction. The hourly MACD histogram crossed from positive to negative and is now fading, moving from +0.00022 to -0.00016 to -0.00025 across the last three closed candles. Momentum is losing steam right as price stalls below the hourly pivot.
On the 15-minute chart, the histogram is still negative but narrowing (-0.00062 → -0.00045 → -0.00042). RSI is easing from 53.2 to 51.3 — not a breakdown, just a loss of short-term thrust. Bollinger Bands add context: the daily bands run from $0.1497 to $0.2703 with a mid-band at $0.2100, meaning price is comfortably inside the upper half of its range. Daily ATR stands at roughly $0.0207, a wide band relative to current price that flags moves of a cent or two in either direction as normal noise. The hourly ATR, near $0.0066, is proportionally similar, reinforcing that the recent pullback from $0.2632 to $0.2594 sits well within typical volatility rather than signaling a trend change.
Key Levels: $0.2684 Caps the Upside, $0.2446 Is the Level That Matters on a Drop
Resistance sits at $0.2684 (daily R1), while the critical support cluster lies at $0.2446, where the daily pivot, hourly Bollinger lower band, and hourly EMA50 converge.
The nearest level above current price is the daily R1 at $0.2684, which coincides with the hourly Bollinger upper band at the same value. The daily Bollinger upper band sits at $0.2703. Below price, the hourly S1 at $0.2593 is essentially where the market sits right now, with the hourly pivot at $0.2617 just overhead. Further down, the daily pivot at $0.2446 lines up with both the hourly Bollinger lower band and the hourly EMA50 at the same level. That makes the zone a more meaningful cluster than any single indicator would suggest on its own.
Bullish scenario: a daily close above the daily R1 at $0.2684 would open room toward the daily Bollinger upper band at $0.2703. It would also resolve the current hourly momentum stall in the bulls’ favor. This scenario would be invalidated by a daily close back below the daily pivot at $0.2446. That would undercut the entire short-term structure built since the last completed daily candle.
Bearish scenario: an hourly close below the hourly S1 at $0.2593 — a level price is already brushing against — would signal the hourly pullback is deepening rather than consolidating. That reading would be invalidated by an hourly close back above the hourly pivot at $0.2617. That would put the hourly chart back in line with the still-bullish daily trend.
The real risk is treating the hourly MACD fade as a trend reversal when the daily structure, EMA order, and RSI are still pointing up. The more honest read is that the asset is in a daily uptrend taking a short-term breather. The next few hourly closes around $0.2593–$0.2617 will say more than any single indicator can.
FAQ
What is FET doing right now?
FET trades at $0.2596 on Binance, above its daily EMA20, EMA50 and EMA200, after the last completed daily candle closed at $0.2531.
Is FET’s daily trend bullish or bearish?
The daily regime reads bullish: price sits above all three daily EMAs in a textbook bullish order, daily RSI is at 67.0 and climbing, and the daily MACD histogram just crossed into positive territory.
Why does the hourly chart look weaker than the daily chart?
The hourly MACD histogram has crossed from positive to negative and is fading, and hourly RSI at 62.4 is moving in a mixed pattern rather than trending. Price is also hovering right at the hourly S1 of $0.2593, just under the hourly pivot at $0.2617.
What would confirm a bullish continuation?
A daily close above the daily R1 at $0.2684 would point toward the daily Bollinger upper band at $0.2703, provided it is not immediately followed by a daily close back below the daily pivot at $0.2446.
Disclaimer: This article is for informational purposes only and does not constitute financial advice, an investment recommendation, or a solicitation to buy or sell any financial instrument or cryptocurrency. The analysis provided is not indicative of future results. Investing in crypto assets and financial markets carries a high risk of capital loss. Always do your own research (DYOR) and consult a qualified financial advisor before making any decision.
Article produced with the assistance of artificial intelligence and reviewed by the editorial team.
FET stays bullish above $0.2596 as hourly momentum fades
As of October 5, 2026, the FET price trades at $0.2596 on Binance, above every major daily moving average. The daily trend is unambiguously bullish: RSI is climbing and the MACD histogram just flipped positive. The tension lies in shorter timeframes, where momentum is already cooling while structure holds.
FET/USDT — daily chart with candlesticks, EMA20/EMA50 and volume.
Key takeaways
FET at $0.2596 sits above the daily EMA20, EMA50, and EMA200 in a textbook bullish alignment.
Daily RSI at 67.0 and a newly positive MACD histogram confirm the uptrend, while hourly momentum tells a different story.
Total crypto market cap stands at $2.91 trillion, down 2.74% in 24 hours, with Bitcoin dominance at 59.23%.
A daily close above $0.2684 would open the path toward $0.2703; an hourly close below $0.2593 signals a deepening pullback.
The Fear & Greed Index reads 70, firmly in Greed territory per Alternative.me.
Broader Market Cools While FET Price Pushes Against Resistance
The broader crypto market is contracting even as FET pushes against resistance near $0.2684, with total market capitalization down 2.74% to $2.91 trillion over the past 24 hours.
Total crypto market capitalization sits at $2.91 trillion, down 2.74% over the past 24 hours, according to CoinGecko. Bitcoin dominance is at 59.23%, also per CoinGecko. The Fear & Greed Index, tracked by Alternative.me, reads 70, in Greed territory. That combination — elevated sentiment alongside contracting total capitalization — does not necessarily favor altcoins pushing into resistance, since broader liquidity is not confirming the move. The move looks more like an asset-specific push than something riding a market-wide tailwind.
Daily Structure: EMAs Aligned Bullish, But Not Everywhere
The daily EMA structure is unambiguously bullish, with price above all three major moving averages stacked in textbook order — EMA20 above EMA50 above EMA200.
On the daily chart, price sits above the EMA20 ($0.2142), EMA50 ($0.1900), and EMA200 ($0.1876), with the EMA order confirming the medium-term uptrend without ambiguity. The hourly chart tells the same structural story — price above all three EMAs ($0.2554, $0.2445, $0.2324), with the same bullish stacking.
The 15-minute chart keeps the bullish EMA order too, but price itself is mixed against it. It sits below the 15-minute EMA20 ($0.2616), yet still above the EMA50 ($0.2588) and EMA200 ($0.2444). That is a short-term wobble inside a longer-term uptrend, not a reversal signal on its own. It does mean the very short-term tape is more fragile than the daily chart suggests.
Momentum Diverges: Daily RSI Climbs While Hourly MACD Fades
Daily momentum indicators align with the bullish trend. RSI at 67.0 is climbing and the MACD histogram just turned positive. Hourly indicators, meanwhile, show momentum fading, creating a divergence between timeframes.
Daily RSI sits at 67.0, up from 57.4 and 59.6 over the prior two closed candles — a clear climb, though still short of overbought territory. The daily MACD histogram just crossed from negative to positive, flipping from -0.0003 to +0.00086 across the last three closed candles. This lines up with the bullish regime read.
The hourly chart, meanwhile, breaks from that script. RSI there reads 62.4, but the three-candle sequence (66.9 → 59.8 → 62.4) is mixed rather than trending in either direction. The hourly MACD histogram crossed from positive to negative and is now fading, moving from +0.00022 to -0.00016 to -0.00025 across the last three closed candles. Momentum is losing steam right as price stalls below the hourly pivot.
On the 15-minute chart, the histogram is still negative but narrowing (-0.00062 → -0.00045 → -0.00042). RSI is easing from 53.2 to 51.3 — not a breakdown, just a loss of short-term thrust. Bollinger Bands add context: the daily bands run from $0.1497 to $0.2703 with a mid-band at $0.2100, meaning price is comfortably inside the upper half of its range. Daily ATR stands at roughly $0.0207, a wide band relative to current price that flags moves of a cent or two in either direction as normal noise. The hourly ATR, near $0.0066, is proportionally similar, reinforcing that the recent pullback from $0.2632 to $0.2594 sits well within typical volatility rather than signaling a trend change.
Key Levels: $0.2684 Caps the Upside, $0.2446 Is the Level That Matters on a Drop
Resistance sits at $0.2684 (daily R1), while the critical support cluster lies at $0.2446, where the daily pivot, hourly Bollinger lower band, and hourly EMA50 converge.
The nearest level above current price is the daily R1 at $0.2684, which coincides with the hourly Bollinger upper band at the same value. The daily Bollinger upper band sits at $0.2703. Below price, the hourly S1 at $0.2593 is essentially where the market sits right now, with the hourly pivot at $0.2617 just overhead. Further down, the daily pivot at $0.2446 lines up with both the hourly Bollinger lower band and the hourly EMA50 at the same level. That makes the zone a more meaningful cluster than any single indicator would suggest on its own.
Bullish scenario: a daily close above the daily R1 at $0.2684 would open room toward the daily Bollinger upper band at $0.2703. It would also resolve the current hourly momentum stall in the bulls’ favor. This scenario would be invalidated by a daily close back below the daily pivot at $0.2446. That would undercut the entire short-term structure built since the last completed daily candle.
Bearish scenario: an hourly close below the hourly S1 at $0.2593 — a level price is already brushing against — would signal the hourly pullback is deepening rather than consolidating. That reading would be invalidated by an hourly close back above the hourly pivot at $0.2617. That would put the hourly chart back in line with the still-bullish daily trend.
The real risk is treating the hourly MACD fade as a trend reversal when the daily structure, EMA order, and RSI are still pointing up. The more honest read is that the asset is in a daily uptrend taking a short-term breather. The next few hourly closes around $0.2593–$0.2617 will say more than any single indicator can.
FAQ
What is FET doing right now?
FET trades at $0.2596 on Binance, above its daily EMA20, EMA50 and EMA200, after the last completed daily candle closed at $0.2531.
Is FET’s daily trend bullish or bearish?
The daily regime reads bullish: price sits above all three daily EMAs in a textbook bullish order, daily RSI is at 67.0 and climbing, and the daily MACD histogram just crossed into positive territory.
Why does the hourly chart look weaker than the daily chart?
The hourly MACD histogram has crossed from positive to negative and is fading, and hourly RSI at 62.4 is moving in a mixed pattern rather than trending. Price is also hovering right at the hourly S1 of $0.2593, just under the hourly pivot at $0.2617.
What would confirm a bullish continuation?
A daily close above the daily R1 at $0.2684 would point toward the daily Bollinger upper band at $0.2703, provided it is not immediately followed by a daily close back below the daily pivot at $0.2446.
Disclaimer: This article is for informational purposes only and does not constitute financial advice, an investment recommendation, or a solicitation to buy or sell any financial instrument or cryptocurrency. The analysis provided is not indicative of future results. Investing in crypto assets and financial markets carries a high risk of capital loss. Always do your own research (DYOR) and consult a qualified financial advisor before making any decision.
Article produced with the assistance of artificial intelligence and reviewed by the editorial team.
FET/USDT — daily chart with candlesticks, EMA20/EMA50 and volume.
Key takeaways
FET at $0.2596 sits above the daily EMA20, EMA50, and EMA200 in a textbook bullish alignment.
Daily RSI at 67.0 and a newly positive MACD histogram confirm the uptrend, while hourly momentum tells a different story.
Total crypto market cap stands at $2.91 trillion, down 2.74% in 24 hours, with Bitcoin dominance at 59.23%.
A daily close above $0.2684 would open the path toward $0.2703; an hourly close below $0.2593 signals a deepening pullback.
The Fear & Greed Index reads 70, firmly in Greed territory per Alternative.me.
Broader Market Cools While FET Price Pushes Against Resistance
The broader crypto market is contracting even as FET pushes against resistance near $0.2684, with total market capitalization down 2.74% to $2.91 trillion over the past 24 hours.
Total crypto market capitalization sits at $2.91 trillion, down 2.74% over the past 24 hours, according to CoinGecko. Bitcoin dominance is at 59.23%, also per CoinGecko. The Fear & Greed Index, tracked by Alternative.me, reads 70, in Greed territory. That combination — elevated sentiment alongside contracting total capitalization — does not necessarily favor altcoins pushing into resistance, since broader liquidity is not confirming the move. The move looks more like an asset-specific push than something riding a market-wide tailwind.
Daily Structure: EMAs Aligned Bullish, But Not Everywhere
The daily EMA structure is unambiguously bullish, with price above all three major moving averages stacked in textbook order — EMA20 above EMA50 above EMA200.
On the daily chart, price sits above the EMA20 ($0.2142), EMA50 ($0.1900), and EMA200 ($0.1876), with the EMA order confirming the medium-term uptrend without ambiguity. The hourly chart tells the same structural story — price above all three EMAs ($0.2554, $0.2445, $0.2324), with the same bullish stacking.
The 15-minute chart keeps the bullish EMA order too, but price itself is mixed against it. It sits below the 15-minute EMA20 ($0.2616), yet still above the EMA50 ($0.2588) and EMA200 ($0.2444). That is a short-term wobble inside a longer-term uptrend, not a reversal signal on its own. It does mean the very short-term tape is more fragile than the daily chart suggests.
Momentum Diverges: Daily RSI Climbs While Hourly MACD Fades
Daily momentum indicators align with the bullish trend. RSI at 67.0 is climbing and the MACD histogram just turned positive. Hourly indicators, meanwhile, show momentum fading, creating a divergence between timeframes.
Daily RSI sits at 67.0, up from 57.4 and 59.6 over the prior two closed candles — a clear climb, though still short of overbought territory. The daily MACD histogram just crossed from negative to positive, flipping from -0.0003 to +0.00086 across the last three closed candles. This lines up with the bullish regime read.
The hourly chart, meanwhile, breaks from that script. RSI there reads 62.4, but the three-candle sequence (66.9 → 59.8 → 62.4) is mixed rather than trending in either direction. The hourly MACD histogram crossed from positive to negative and is now fading, moving from +0.00022 to -0.00016 to -0.00025 across the last three closed candles. Momentum is losing steam right as price stalls below the hourly pivot.
On the 15-minute chart, the histogram is still negative but narrowing (-0.00062 → -0.00045 → -0.00042). RSI is easing from 53.2 to 51.3 — not a breakdown, just a loss of short-term thrust. Bollinger Bands add context: the daily bands run from $0.1497 to $0.2703 with a mid-band at $0.2100, meaning price is comfortably inside the upper half of its range. Daily ATR stands at roughly $0.0207, a wide band relative to current price that flags moves of a cent or two in either direction as normal noise. The hourly ATR, near $0.0066, is proportionally similar, reinforcing that the recent pullback from $0.2632 to $0.2594 sits well within typical volatility rather than signaling a trend change.
Key Levels: $0.2684 Caps the Upside, $0.2446 Is the Level That Matters on a Drop
Resistance sits at $0.2684 (daily R1), while the critical support cluster lies at $0.2446, where the daily pivot, hourly Bollinger lower band, and hourly EMA50 converge.
The nearest level above current price is the daily R1 at $0.2684, which coincides with the hourly Bollinger upper band at the same value. The daily Bollinger upper band sits at $0.2703. Below price, the hourly S1 at $0.2593 is essentially where the market sits right now, with the hourly pivot at $0.2617 just overhead. Further down, the daily pivot at $0.2446 lines up with both the hourly Bollinger lower band and the hourly EMA50 at the same level. That makes the zone a more meaningful cluster than any single indicator would suggest on its own.
Bullish scenario: a daily close above the daily R1 at $0.2684 would open room toward the daily Bollinger upper band at $0.2703. It would also resolve the current hourly momentum stall in the bulls’ favor. This scenario would be invalidated by a daily close back below the daily pivot at $0.2446. That would undercut the entire short-term structure built since the last completed daily candle.
Bearish scenario: an hourly close below the hourly S1 at $0.2593 — a level price is already brushing against — would signal the hourly pullback is deepening rather than consolidating. That reading would be invalidated by an hourly close back above the hourly pivot at $0.2617. That would put the hourly chart back in line with the still-bullish daily trend.
The real risk is treating the hourly MACD fade as a trend reversal when the daily structure, EMA order, and RSI are still pointing up. The more honest read is that the asset is in a daily uptrend taking a short-term breather. The next few hourly closes around $0.2593–$0.2617 will say more than any single indicator can.
FAQ
What is FET doing right now?
FET trades at $0.2596 on Binance, above its daily EMA20, EMA50 and EMA200, after the last completed daily candle closed at $0.2531.
Is FET’s daily trend bullish or bearish?
The daily regime reads bullish: price sits above all three daily EMAs in a textbook bullish order, daily RSI is at 67.0 and climbing, and the daily MACD histogram just crossed into positive territory.
Why does the hourly chart look weaker than the daily chart?
The hourly MACD histogram has crossed from positive to negative and is fading, and hourly RSI at 62.4 is moving in a mixed pattern rather than trending. Price is also hovering right at the hourly S1 of $0.2593, just under the hourly pivot at $0.2617.
What would confirm a bullish continuation?
A daily close above the daily R1 at $0.2684 would point toward the daily Bollinger upper band at $0.2703, provided it is not immediately followed by a daily close back below the daily pivot at $0.2446.
Disclaimer: This article is for informational purposes only and does not constitute financial advice, an investment recommendation, or a solicitation to buy or sell any financial instrument or cryptocurrency. The analysis provided is not indicative of future results. Investing in crypto assets and financial markets carries a high risk of capital loss. Always do your own research (DYOR) and consult a qualified financial advisor before making any decision.
Article produced with the assistance of artificial intelligence and reviewed by the editorial team.
194

Article
Energy shock pushes euro inflation to 3.8%, clouding ECB’s monetary policy outlookThe European Central Bank’s monetary policy is being pulled in several directions at once, according to a keynote speech delivered by Philip R. Lane, member of the ECB’s Executive Board, at the ECB Conference on Monetary Policy 2026 in Frankfurt on October 5, 2026. Lane laid out why the central bank is treating this moment as a diagnostic puzzle rather than a simple inflation fight, pointing to an energy shock, shifting fiscal policy, and the uneven arrival of artificial intelligence investment as forces all moving through the euro area economy at the same time.
Key takeaways
Headline euro area inflation hit 3.8% in September 2026, driven almost entirely by an 18.8% jump in energy prices.
Non-energy inflation stayed moderate at 2.3%, but the ECB expects it to rise toward 2.6% in 2027 before easing back.
Fiscal policy added 0.5 percentage points of stimulus in 2026 but is set to tighten by 0.4 points in 2027 and 0.2 points in 2028.
Mortgage lending rates climbed to 3.6% in 2026 from 3.3% at the end of 2025, keeping household borrowing subdued.
Three Criteria Behind ECB’s Monetary Policy Decisions
Lane said the ECB bases its monetary policy calls on three criteria: the inflation outlook and its surrounding risks, the dynamics of underlying inflation, and the strength of monetary transmission through the financial system. Because “no single indicator of underlying inflation provides sufficient guidance,” the ECB tracks a whole battery of measures rather than leaning on one number. Financial conditions get the same treatment, with the ECB Macro-Finance Financial Conditions Index and the ECB-BIG index both used to gauge how tight or loose credit intermediation really is across banks and non-bank lenders.
An Energy Shock Still Driving Euro Area Inflation
The energy supply shock remains the single biggest force pushing prices higher this year. September data put headline inflation at 3.8%, with energy inflation running at 18.8% against non-energy inflation of just 2.3%. That compares with a pre-shock benchmark of 2.1% headline inflation in the fourth quarter of 2025, when energy prices were actually falling. Lane described a “second wave” of the shock since July, with oil, refining margins and gas prices all moving up again, and said that how far and how fast that pass-through reaches non-energy prices will shape the medium-term inflation outlook. The ECB’s September projections see non-energy inflation climbing to an average of 2.6% in 2027, partly on lagged pass-through and a weather-related food price bump, before easing to 2.3% in 2028.
Fiscal Policy and AI Pull in Different Directions
Fiscal policy has been a tailwind this year. After remaining neutral in 2025, the euro area’s fiscal stance shifted toward a 0.5 percentage point loosening in 2026, driven by Germany’s defence and infrastructure outlays alongside the closing phases of the Next Generation EU programme. ECB staff expect that to reverse into tightening of 0.4 points in 2027 and 0.2 points in 2028, trimming growth over the next two years.
AI investment is also lifting activity, showing up in digital services, business investment and exports — AI-related exports grew 6.7% over 2024-2025. But Lane was blunt that the AI impact on the euro area economy is “of a different order” than in the US or East Asia, coming from a much smaller base. He noted that the global AI boom is still pushing up long-term interest rates worldwide, and since Europe’s own AI surge is comparatively small, that global rate increase amounts to a real tightening of financial conditions for the bloc.
Credit Growth Splits Between Firms and Households
Corporate credit growth in 2026 has broadly tracked nominal GDP, leaving the corporate debt-to-GDP ratio around 66%, close to pre-financial-crisis levels. AI-related firms have shown notably stronger credit expansion than comparable companies, with the AI boom accounting for close to one percentage point of aggregate annual credit growth.
Households have had a different experience. Mortgage lending continued to expand at roughly 3.1% annually through August, despite bank interest rates on home loans climbing to 3.6%, up from 3.3% at the close of 2025. Consumer credit grew around 5%, which Lane linked more to liquidity needs among financially stretched households than to confidence.
Article produced with the assistance of artificial intelligence and reviewed by the editorial team.
Energy shock pushes euro inflation to 3.8%, clouding ECB’s monetary policy outlook
The European Central Bank’s monetary policy is being pulled in several directions at once, according to a keynote speech delivered by Philip R. Lane, member of the ECB’s Executive Board, at the ECB Conference on Monetary Policy 2026 in Frankfurt on October 5, 2026. Lane laid out why the central bank is treating this moment as a diagnostic puzzle rather than a simple inflation fight, pointing to an energy shock, shifting fiscal policy, and the uneven arrival of artificial intelligence investment as forces all moving through the euro area economy at the same time.
Key takeaways
Headline euro area inflation hit 3.8% in September 2026, driven almost entirely by an 18.8% jump in energy prices.
Non-energy inflation stayed moderate at 2.3%, but the ECB expects it to rise toward 2.6% in 2027 before easing back.
Fiscal policy added 0.5 percentage points of stimulus in 2026 but is set to tighten by 0.4 points in 2027 and 0.2 points in 2028.
Mortgage lending rates climbed to 3.6% in 2026 from 3.3% at the end of 2025, keeping household borrowing subdued.
Three Criteria Behind ECB’s Monetary Policy Decisions
Lane said the ECB bases its monetary policy calls on three criteria: the inflation outlook and its surrounding risks, the dynamics of underlying inflation, and the strength of monetary transmission through the financial system. Because “no single indicator of underlying inflation provides sufficient guidance,” the ECB tracks a whole battery of measures rather than leaning on one number. Financial conditions get the same treatment, with the ECB Macro-Finance Financial Conditions Index and the ECB-BIG index both used to gauge how tight or loose credit intermediation really is across banks and non-bank lenders.
An Energy Shock Still Driving Euro Area Inflation
The energy supply shock remains the single biggest force pushing prices higher this year. September data put headline inflation at 3.8%, with energy inflation running at 18.8% against non-energy inflation of just 2.3%. That compares with a pre-shock benchmark of 2.1% headline inflation in the fourth quarter of 2025, when energy prices were actually falling. Lane described a “second wave” of the shock since July, with oil, refining margins and gas prices all moving up again, and said that how far and how fast that pass-through reaches non-energy prices will shape the medium-term inflation outlook. The ECB’s September projections see non-energy inflation climbing to an average of 2.6% in 2027, partly on lagged pass-through and a weather-related food price bump, before easing to 2.3% in 2028.
Fiscal Policy and AI Pull in Different Directions
Fiscal policy has been a tailwind this year. After remaining neutral in 2025, the euro area’s fiscal stance shifted toward a 0.5 percentage point loosening in 2026, driven by Germany’s defence and infrastructure outlays alongside the closing phases of the Next Generation EU programme. ECB staff expect that to reverse into tightening of 0.4 points in 2027 and 0.2 points in 2028, trimming growth over the next two years.
AI investment is also lifting activity, showing up in digital services, business investment and exports — AI-related exports grew 6.7% over 2024-2025. But Lane was blunt that the AI impact on the euro area economy is “of a different order” than in the US or East Asia, coming from a much smaller base. He noted that the global AI boom is still pushing up long-term interest rates worldwide, and since Europe’s own AI surge is comparatively small, that global rate increase amounts to a real tightening of financial conditions for the bloc.
Credit Growth Splits Between Firms and Households
Corporate credit growth in 2026 has broadly tracked nominal GDP, leaving the corporate debt-to-GDP ratio around 66%, close to pre-financial-crisis levels. AI-related firms have shown notably stronger credit expansion than comparable companies, with the AI boom accounting for close to one percentage point of aggregate annual credit growth.
Households have had a different experience. Mortgage lending continued to expand at roughly 3.1% annually through August, despite bank interest rates on home loans climbing to 3.6%, up from 3.3% at the close of 2025. Consumer credit grew around 5%, which Lane linked more to liquidity needs among financially stretched households than to confidence.
Article produced with the assistance of artificial intelligence and reviewed by the editorial team.
Key takeaways
Headline euro area inflation hit 3.8% in September 2026, driven almost entirely by an 18.8% jump in energy prices.
Non-energy inflation stayed moderate at 2.3%, but the ECB expects it to rise toward 2.6% in 2027 before easing back.
Fiscal policy added 0.5 percentage points of stimulus in 2026 but is set to tighten by 0.4 points in 2027 and 0.2 points in 2028.
Mortgage lending rates climbed to 3.6% in 2026 from 3.3% at the end of 2025, keeping household borrowing subdued.
Three Criteria Behind ECB’s Monetary Policy Decisions
Lane said the ECB bases its monetary policy calls on three criteria: the inflation outlook and its surrounding risks, the dynamics of underlying inflation, and the strength of monetary transmission through the financial system. Because “no single indicator of underlying inflation provides sufficient guidance,” the ECB tracks a whole battery of measures rather than leaning on one number. Financial conditions get the same treatment, with the ECB Macro-Finance Financial Conditions Index and the ECB-BIG index both used to gauge how tight or loose credit intermediation really is across banks and non-bank lenders.
An Energy Shock Still Driving Euro Area Inflation
The energy supply shock remains the single biggest force pushing prices higher this year. September data put headline inflation at 3.8%, with energy inflation running at 18.8% against non-energy inflation of just 2.3%. That compares with a pre-shock benchmark of 2.1% headline inflation in the fourth quarter of 2025, when energy prices were actually falling. Lane described a “second wave” of the shock since July, with oil, refining margins and gas prices all moving up again, and said that how far and how fast that pass-through reaches non-energy prices will shape the medium-term inflation outlook. The ECB’s September projections see non-energy inflation climbing to an average of 2.6% in 2027, partly on lagged pass-through and a weather-related food price bump, before easing to 2.3% in 2028.
Fiscal Policy and AI Pull in Different Directions
Fiscal policy has been a tailwind this year. After remaining neutral in 2025, the euro area’s fiscal stance shifted toward a 0.5 percentage point loosening in 2026, driven by Germany’s defence and infrastructure outlays alongside the closing phases of the Next Generation EU programme. ECB staff expect that to reverse into tightening of 0.4 points in 2027 and 0.2 points in 2028, trimming growth over the next two years.
AI investment is also lifting activity, showing up in digital services, business investment and exports — AI-related exports grew 6.7% over 2024-2025. But Lane was blunt that the AI impact on the euro area economy is “of a different order” than in the US or East Asia, coming from a much smaller base. He noted that the global AI boom is still pushing up long-term interest rates worldwide, and since Europe’s own AI surge is comparatively small, that global rate increase amounts to a real tightening of financial conditions for the bloc.
Credit Growth Splits Between Firms and Households
Corporate credit growth in 2026 has broadly tracked nominal GDP, leaving the corporate debt-to-GDP ratio around 66%, close to pre-financial-crisis levels. AI-related firms have shown notably stronger credit expansion than comparable companies, with the AI boom accounting for close to one percentage point of aggregate annual credit growth.
Households have had a different experience. Mortgage lending continued to expand at roughly 3.1% annually through August, despite bank interest rates on home loans climbing to 3.6%, up from 3.3% at the close of 2025. Consumer credit grew around 5%, which Lane linked more to liquidity needs among financially stretched households than to confidence.
Article produced with the assistance of artificial intelligence and reviewed by the editorial team.
17

Article
Plume’s tokenized bond vault debuts with Fidelity backing, no trades yetPlume has introduced a new tokenized bond vault called nBND, built primarily around the Fidelity Total Bond ETF (FBND), giving on-chain investors a fresh route into fixed-income markets. The launch on October 5, 2026, brings a diversified bond portfolio onto blockchain rather than limiting tokenized fixed income to short-duration Treasuries or money-market instruments.
Key takeaways
Plume’s nBND vault is tied primarily to the Fidelity Total Bond ETF (FBND).
The product targets diversified bond exposure, not just Treasuries or money-market funds.
nBND currently shows zero trading volume, signaling an early-stage launch.
Fidelity’s involvement lends institutional credibility to the vault.
Plume Launches Tokenized Bond Vault Backed by Fidelity
Plume’s new tokenized bond vault runs on the Fidelity Total Bond ETF as its core backing asset, according to Coinfomania. That choice matters because FBND itself is built to give investors exposure to a broad mix of fixed-income securities, rather than a single bond type or maturity bucket.
Fidelity’s name attached to the underlying asset gives the vault a recognizable foundation for investors evaluating whether to move fixed-income exposure on-chain.
Expanding Fixed-Income Investment Opportunities
nBND is designed to hand on-chain investors access to a diversified fixed-income portfolio that goes beyond what has typically been available in crypto markets. Most tokenized fixed-income products so far have leaned heavily on short-duration Treasuries or money-market assets.
Market Reception and Early Stage Indicators
Right now, the market shows no trading volume for the nBND vault, according to Coinfomania, a sign that the product is still in its earliest phase of adoption. The absence of volume does not say anything definitive about demand; it simply reflects how new the Plume nBND launch is.
Investor Considerations and Disclosure
For investors weighing tokenized fixed-income products, nBND represents one option among a growing set of blockchain-based instruments tied to traditional assets. The vault’s link to Fidelity Total Bond ETF gives it a recognizable anchor, but the product’s performance and liquidity profile will only become clearer as trading activity develops.
This article serves only to inform readers and should not be regarded as financial guidance.
Article produced with the assistance of artificial intelligence and reviewed by the editorial team.
Plume’s tokenized bond vault debuts with Fidelity backing, no trades yet
Plume has introduced a new tokenized bond vault called nBND, built primarily around the Fidelity Total Bond ETF (FBND), giving on-chain investors a fresh route into fixed-income markets. The launch on October 5, 2026, brings a diversified bond portfolio onto blockchain rather than limiting tokenized fixed income to short-duration Treasuries or money-market instruments.
Key takeaways
Plume’s nBND vault is tied primarily to the Fidelity Total Bond ETF (FBND).
The product targets diversified bond exposure, not just Treasuries or money-market funds.
nBND currently shows zero trading volume, signaling an early-stage launch.
Fidelity’s involvement lends institutional credibility to the vault.
Plume Launches Tokenized Bond Vault Backed by Fidelity
Plume’s new tokenized bond vault runs on the Fidelity Total Bond ETF as its core backing asset, according to Coinfomania. That choice matters because FBND itself is built to give investors exposure to a broad mix of fixed-income securities, rather than a single bond type or maturity bucket.
Fidelity’s name attached to the underlying asset gives the vault a recognizable foundation for investors evaluating whether to move fixed-income exposure on-chain.
Expanding Fixed-Income Investment Opportunities
nBND is designed to hand on-chain investors access to a diversified fixed-income portfolio that goes beyond what has typically been available in crypto markets. Most tokenized fixed-income products so far have leaned heavily on short-duration Treasuries or money-market assets.
Market Reception and Early Stage Indicators
Right now, the market shows no trading volume for the nBND vault, according to Coinfomania, a sign that the product is still in its earliest phase of adoption. The absence of volume does not say anything definitive about demand; it simply reflects how new the Plume nBND launch is.
Investor Considerations and Disclosure
For investors weighing tokenized fixed-income products, nBND represents one option among a growing set of blockchain-based instruments tied to traditional assets. The vault’s link to Fidelity Total Bond ETF gives it a recognizable anchor, but the product’s performance and liquidity profile will only become clearer as trading activity develops.
This article serves only to inform readers and should not be regarded as financial guidance.
Article produced with the assistance of artificial intelligence and reviewed by the editorial team.
Key takeaways
Plume’s nBND vault is tied primarily to the Fidelity Total Bond ETF (FBND).
The product targets diversified bond exposure, not just Treasuries or money-market funds.
nBND currently shows zero trading volume, signaling an early-stage launch.
Fidelity’s involvement lends institutional credibility to the vault.
Plume Launches Tokenized Bond Vault Backed by Fidelity
Plume’s new tokenized bond vault runs on the Fidelity Total Bond ETF as its core backing asset, according to Coinfomania. That choice matters because FBND itself is built to give investors exposure to a broad mix of fixed-income securities, rather than a single bond type or maturity bucket.
Fidelity’s name attached to the underlying asset gives the vault a recognizable foundation for investors evaluating whether to move fixed-income exposure on-chain.
Expanding Fixed-Income Investment Opportunities
nBND is designed to hand on-chain investors access to a diversified fixed-income portfolio that goes beyond what has typically been available in crypto markets. Most tokenized fixed-income products so far have leaned heavily on short-duration Treasuries or money-market assets.
Market Reception and Early Stage Indicators
Right now, the market shows no trading volume for the nBND vault, according to Coinfomania, a sign that the product is still in its earliest phase of adoption. The absence of volume does not say anything definitive about demand; it simply reflects how new the Plume nBND launch is.
Investor Considerations and Disclosure
For investors weighing tokenized fixed-income products, nBND represents one option among a growing set of blockchain-based instruments tied to traditional assets. The vault’s link to Fidelity Total Bond ETF gives it a recognizable anchor, but the product’s performance and liquidity profile will only become clearer as trading activity develops.
This article serves only to inform readers and should not be regarded as financial guidance.
Article produced with the assistance of artificial intelligence and reviewed by the editorial team.
PLUME+2.24%
FBNDETF+0.04%
30

Article
Vistra stock closes up 0.19% at $140.02 amid $4B nuclear loan reportVistra stock closed Friday, October 2 at $140.02, up 0.19% from Thursday’s $139.75. The open-to-close change was -1.43%, reflecting intraday weakness. The stock opened at $142.05, traded between a low of $134.79 and a high of $143.02, and closed at $140.02, against a previous close of $139.75. Daily EMAs remain bearishly aligned. Yet hourly and 15-minute charts show firmer momentum — a tension now at the center of Vistra stock’s technical outlook.
VST — daily chart with candlesticks, EMA20/EMA50 and volume.
Key takeaways
Vistra stock closed Friday, October 2 at $140.02, up 0.19% from Thursday’s $139.75, with an open-to-close change of -1.43%.
The daily EMA alignment is fully bearish: price sits below the EMA20 at $140.87, the EMA50 at $144.05, and the EMA200 at $154.04.
Daily RSI14 rose to 46.78 from 46.24 but remains below the neutral 50 mark. The daily MACD histogram crossed above zero to 0.01, up from -0.10.
Hourly RSI14 rose to 56.62 from 52.08, and 15-minute RSI14 rose to 60.24 from 47.40 — both above 50.
Vistra stock closed above the daily pivot at $139.28 and below daily R1 at $143.76. It also closed above the lower daily Bollinger band at $133.50 and below the upper band at $151.20.
According to a Yahoo Finance report published during Friday’s session, Vistra shares trimmed losses. The report said shares were trading down 0.3% at $139.20 after dropping to a session low of $135.79. It tied that weakness to a Bloomberg story stating the Trump administration plans to offer Vistra a roughly $4 billion loan package to upgrade three of its nuclear plants. Two of those plants are in Ohio, and one is in Pennsylvania. Separately, a Seeking Alpha item citing the same Bloomberg report was published after Friday’s close.
Vistra Stock Technical Setup: Daily Trend Still Bearish
The daily chart for Vistra stock remains in a fully bearish alignment, with price trading below all three key exponential moving averages. Price sits below the EMA20 at $140.87. The EMA20 sits below the EMA50 at $144.05, and the EMA50 sits below the EMA200 at $154.04. Daily RSI14 rose to 46.78 from 46.24, but it is still below the neutral 50 mark, which keeps momentum on the soft side.
The daily MACD histogram crossed above zero and now reads 0.01, up from -0.10 in the prior session. That said, both the MACD line at -1.44 and its signal at -1.45 remain below zero. The broader daily trend has therefore not actually turned.
Volatility is edging higher on the daily chart. ATR14 climbed to 4.94 from 4.69, confirming wider daily swings. Price trades below the daily Bollinger mid band at $142.35 and above the lower band at $133.50, putting it in the lower half of that range. For the next session, the daily pivot sits at $139.28, with first resistance (R1) at $143.76 and first support (S1) at $135.53. Friday’s close at $140.02 landed above that pivot and below R1.
Hourly and 15-Minute Momentum Complicate the Picture
Short-term momentum on the hourly and 15-minute charts is firmer than the daily picture, with RSI14 readings above 50 on both timeframes.
Hourly Chart: Neutral but Firming
On the hourly chart, the setup looks neutral rather than bearish. Price sits above the hourly EMA20 at $138.58 and the EMA50 at $138.99. However, it remains below the hourly EMA200 at $140.85. Those three averages remain in ascending order, with the EMA20 below the EMA50 below the EMA200. Hourly RSI14 rose to 56.62 from 52.08, moving above the neutral 50 line. The hourly MACD histogram also crossed above zero and now stands at 0.05, with the line at -0.09 sitting above its signal at -0.14. Hourly ATR14 edged up to 2.27 from 2.21. Price trades between the hourly Bollinger mid band at $138.42 and the upper band at $140.39. For the next session, the hourly pivot sits at $139.32, with R1 at $141.17 and S1 at $138.15.
15-Minute Chart: Bullish Short-Term Tilt
The 15-minute chart leans further toward the bullish side. Price trades above all three 15-minute EMAs. Those averages remain in ascending order — EMA20 at $138.09, EMA50 at $138.30, and EMA200 at $139.06. 15-minute RSI14 rose to 60.24 from 47.40, above 50 but still short of the overbought 70 threshold. The 15-minute MACD line stands at 0.05, above its signal at -0.20, with a histogram of 0.25 — a cleaner bullish setup than on the daily or hourly charts. The 15-minute ATR14 rose to 1.29 from 1.16, and price trades above the 15-minute upper Bollinger band at $139.31. The 15-minute pivot for the next session sits at $139.33, with R1 at $141.16 and S1 at $138.17.
Taken together, the three timeframes disagree. The daily chart keeps Vistra in a bearish structure, the hourly chart is neutral but leaning firmer, and the 15-minute chart shows the clearest short-term bullish tilt. In practice, this reads as an intraday bounce inside a daily downtrend rather than a confirmed reversal.
Bullish Scenario for Vistra Stock
For a bullish reversal to gain credibility, Vistra stock would need to reclaim the daily EMA20 at $140.87 and then clear the R1 resistance zone just above it. The next test would be resistances at $141.16 on the 15-minute chart and $141.17 on the hourly chart. Beyond those levels, the daily pivot’s R1 at $143.76 and the daily EMA50 at $144.05 mark the next hurdles. A move through that zone would need daily RSI14 to clear 50 and the daily MACD line to move back above zero. Together, those would support a shift toward a more constructive daily trend rather than a one-session bounce.
Context from recent coverage adds some texture to that case. A Yahoo Finance report published on Thursday, October 1 noted that Vistra’s price had dropped nearly 30% over the past year. The same report said one Wall Street analyst sees 115% upside from current levels and tied that gap to ERCOT price concerns that management itself had flagged. Separately, a Yahoo Finance comparison published on Wednesday, September 30 argued that Vistra has an edge over Talen, pointing to Vistra’s nuclear scale, diversified generation mix, lower debt-to-capital ratio and stronger ROE. None of this changes the daily chart’s current bearish alignment, but it frames the kind of catalyst bulls would point to if the bounce extends.
Bearish Scenario and What Would Invalidate the Bounce
The bearish case remains intact as long as Vistra stock fails to clear the levels above. A slip back below the hourly S1 at $138.15, or below the 15-minute S1 at $138.17, would suggest the recovery reported by Yahoo Finance is fading. That would reopen the path toward the daily S1 at $135.53 and, beyond it, Friday’s session low of $134.79. Below that zone, the daily chart’s bearish alignment would remain the dominant picture, with price under the EMA20, EMA50 and EMA200. The daily MACD line would also need to stay below zero for the broader trend to stay down.
The nearly 30% one-year decline cited in Thursday’s Yahoo Finance report, together with the ERCOT price concerns that report said management had raised, underscores why caution is still warranted. A single session’s bounce is not, by itself, enough to confirm a trend change. Therefore, the burden of proof still sits with the bulls until the daily chart itself starts to turn.
Where Vistra Stock Stands Now
Vistra stock closed Friday, October 2 at $140.02, above the daily pivot at $139.28 and below the daily R1 at $143.76. It also closed above the lower daily Bollinger band at $133.50 and below the upper band at $151.20. Daily ATR14 at 4.94, alongside rising hourly and 15-minute ATR14 readings of 2.27 and 1.29, points to a market where swings are widening across every timeframe examined. The daily chart still shows a bearish EMA alignment. Meanwhile, the hourly and 15-minute charts show RSI14 above 50 and positive MACD histograms. Overall, what remains uncertain is whether that short-term strength can carry price back through the daily EMA20 and EMA50. It could just as easily fade once the pivot resistances just overhead are tested.
FAQ
What level must Vistra stock reclaim for the bullish case to gain traction?
Vistra stock would first need to reclaim the daily EMA20 at $140.87. Beyond that, resistances sit at $141.16–$141.17 on the 15-minute and hourly charts, followed by the daily R1 at $143.76 and the daily EMA50 at $144.05.
What would signal the intraday bounce has failed?
A move below the hourly S1 at $138.15 or the 15-minute S1 at $138.17 would suggest the recovery is fading. That would reopen the path toward the daily S1 at $135.53 and Friday’s session low of $134.79.
What is the broader daily trend for Vistra stock?
The daily trend remains bearish. Price trades below all three key exponential moving averages — the EMA20 at $140.87, EMA50 at $144.05, and EMA200 at $154.04. Daily RSI14 at 46.78 is below the neutral 50 mark, and the daily MACD line at -1.44 remains below zero.
Disclaimer: This article is for informational purposes only and does not constitute financial advice, an investment recommendation, or a solicitation to buy or sell any financial instrument. The analysis provided is not indicative of future results. Investing in financial markets carries a high risk of capital loss. Always do your own research (DYOR) and consult a qualified financial advisor before making any decision.
Cryptonomist and the author hold no positions in the financial instruments mentioned and receive no compensation from the companies covered.
Article produced with the assistance of artificial intelligence and reviewed by the editorial team.
Vistra stock closes up 0.19% at $140.02 amid $4B nuclear loan report
Vistra stock closed Friday, October 2 at $140.02, up 0.19% from Thursday’s $139.75. The open-to-close change was -1.43%, reflecting intraday weakness. The stock opened at $142.05, traded between a low of $134.79 and a high of $143.02, and closed at $140.02, against a previous close of $139.75. Daily EMAs remain bearishly aligned. Yet hourly and 15-minute charts show firmer momentum — a tension now at the center of Vistra stock’s technical outlook.
VST — daily chart with candlesticks, EMA20/EMA50 and volume.
Key takeaways
Vistra stock closed Friday, October 2 at $140.02, up 0.19% from Thursday’s $139.75, with an open-to-close change of -1.43%.
The daily EMA alignment is fully bearish: price sits below the EMA20 at $140.87, the EMA50 at $144.05, and the EMA200 at $154.04.
Daily RSI14 rose to 46.78 from 46.24 but remains below the neutral 50 mark. The daily MACD histogram crossed above zero to 0.01, up from -0.10.
Hourly RSI14 rose to 56.62 from 52.08, and 15-minute RSI14 rose to 60.24 from 47.40 — both above 50.
Vistra stock closed above the daily pivot at $139.28 and below daily R1 at $143.76. It also closed above the lower daily Bollinger band at $133.50 and below the upper band at $151.20.
According to a Yahoo Finance report published during Friday’s session, Vistra shares trimmed losses. The report said shares were trading down 0.3% at $139.20 after dropping to a session low of $135.79. It tied that weakness to a Bloomberg story stating the Trump administration plans to offer Vistra a roughly $4 billion loan package to upgrade three of its nuclear plants. Two of those plants are in Ohio, and one is in Pennsylvania. Separately, a Seeking Alpha item citing the same Bloomberg report was published after Friday’s close.
Vistra Stock Technical Setup: Daily Trend Still Bearish
The daily chart for Vistra stock remains in a fully bearish alignment, with price trading below all three key exponential moving averages. Price sits below the EMA20 at $140.87. The EMA20 sits below the EMA50 at $144.05, and the EMA50 sits below the EMA200 at $154.04. Daily RSI14 rose to 46.78 from 46.24, but it is still below the neutral 50 mark, which keeps momentum on the soft side.
The daily MACD histogram crossed above zero and now reads 0.01, up from -0.10 in the prior session. That said, both the MACD line at -1.44 and its signal at -1.45 remain below zero. The broader daily trend has therefore not actually turned.
Volatility is edging higher on the daily chart. ATR14 climbed to 4.94 from 4.69, confirming wider daily swings. Price trades below the daily Bollinger mid band at $142.35 and above the lower band at $133.50, putting it in the lower half of that range. For the next session, the daily pivot sits at $139.28, with first resistance (R1) at $143.76 and first support (S1) at $135.53. Friday’s close at $140.02 landed above that pivot and below R1.
Hourly and 15-Minute Momentum Complicate the Picture
Short-term momentum on the hourly and 15-minute charts is firmer than the daily picture, with RSI14 readings above 50 on both timeframes.
Hourly Chart: Neutral but Firming
On the hourly chart, the setup looks neutral rather than bearish. Price sits above the hourly EMA20 at $138.58 and the EMA50 at $138.99. However, it remains below the hourly EMA200 at $140.85. Those three averages remain in ascending order, with the EMA20 below the EMA50 below the EMA200. Hourly RSI14 rose to 56.62 from 52.08, moving above the neutral 50 line. The hourly MACD histogram also crossed above zero and now stands at 0.05, with the line at -0.09 sitting above its signal at -0.14. Hourly ATR14 edged up to 2.27 from 2.21. Price trades between the hourly Bollinger mid band at $138.42 and the upper band at $140.39. For the next session, the hourly pivot sits at $139.32, with R1 at $141.17 and S1 at $138.15.
15-Minute Chart: Bullish Short-Term Tilt
The 15-minute chart leans further toward the bullish side. Price trades above all three 15-minute EMAs. Those averages remain in ascending order — EMA20 at $138.09, EMA50 at $138.30, and EMA200 at $139.06. 15-minute RSI14 rose to 60.24 from 47.40, above 50 but still short of the overbought 70 threshold. The 15-minute MACD line stands at 0.05, above its signal at -0.20, with a histogram of 0.25 — a cleaner bullish setup than on the daily or hourly charts. The 15-minute ATR14 rose to 1.29 from 1.16, and price trades above the 15-minute upper Bollinger band at $139.31. The 15-minute pivot for the next session sits at $139.33, with R1 at $141.16 and S1 at $138.17.
Taken together, the three timeframes disagree. The daily chart keeps Vistra in a bearish structure, the hourly chart is neutral but leaning firmer, and the 15-minute chart shows the clearest short-term bullish tilt. In practice, this reads as an intraday bounce inside a daily downtrend rather than a confirmed reversal.
Bullish Scenario for Vistra Stock
For a bullish reversal to gain credibility, Vistra stock would need to reclaim the daily EMA20 at $140.87 and then clear the R1 resistance zone just above it. The next test would be resistances at $141.16 on the 15-minute chart and $141.17 on the hourly chart. Beyond those levels, the daily pivot’s R1 at $143.76 and the daily EMA50 at $144.05 mark the next hurdles. A move through that zone would need daily RSI14 to clear 50 and the daily MACD line to move back above zero. Together, those would support a shift toward a more constructive daily trend rather than a one-session bounce.
Context from recent coverage adds some texture to that case. A Yahoo Finance report published on Thursday, October 1 noted that Vistra’s price had dropped nearly 30% over the past year. The same report said one Wall Street analyst sees 115% upside from current levels and tied that gap to ERCOT price concerns that management itself had flagged. Separately, a Yahoo Finance comparison published on Wednesday, September 30 argued that Vistra has an edge over Talen, pointing to Vistra’s nuclear scale, diversified generation mix, lower debt-to-capital ratio and stronger ROE. None of this changes the daily chart’s current bearish alignment, but it frames the kind of catalyst bulls would point to if the bounce extends.
Bearish Scenario and What Would Invalidate the Bounce
The bearish case remains intact as long as Vistra stock fails to clear the levels above. A slip back below the hourly S1 at $138.15, or below the 15-minute S1 at $138.17, would suggest the recovery reported by Yahoo Finance is fading. That would reopen the path toward the daily S1 at $135.53 and, beyond it, Friday’s session low of $134.79. Below that zone, the daily chart’s bearish alignment would remain the dominant picture, with price under the EMA20, EMA50 and EMA200. The daily MACD line would also need to stay below zero for the broader trend to stay down.
The nearly 30% one-year decline cited in Thursday’s Yahoo Finance report, together with the ERCOT price concerns that report said management had raised, underscores why caution is still warranted. A single session’s bounce is not, by itself, enough to confirm a trend change. Therefore, the burden of proof still sits with the bulls until the daily chart itself starts to turn.
Where Vistra Stock Stands Now
Vistra stock closed Friday, October 2 at $140.02, above the daily pivot at $139.28 and below the daily R1 at $143.76. It also closed above the lower daily Bollinger band at $133.50 and below the upper band at $151.20. Daily ATR14 at 4.94, alongside rising hourly and 15-minute ATR14 readings of 2.27 and 1.29, points to a market where swings are widening across every timeframe examined. The daily chart still shows a bearish EMA alignment. Meanwhile, the hourly and 15-minute charts show RSI14 above 50 and positive MACD histograms. Overall, what remains uncertain is whether that short-term strength can carry price back through the daily EMA20 and EMA50. It could just as easily fade once the pivot resistances just overhead are tested.
FAQ
What level must Vistra stock reclaim for the bullish case to gain traction?
Vistra stock would first need to reclaim the daily EMA20 at $140.87. Beyond that, resistances sit at $141.16–$141.17 on the 15-minute and hourly charts, followed by the daily R1 at $143.76 and the daily EMA50 at $144.05.
What would signal the intraday bounce has failed?
A move below the hourly S1 at $138.15 or the 15-minute S1 at $138.17 would suggest the recovery is fading. That would reopen the path toward the daily S1 at $135.53 and Friday’s session low of $134.79.
What is the broader daily trend for Vistra stock?
The daily trend remains bearish. Price trades below all three key exponential moving averages — the EMA20 at $140.87, EMA50 at $144.05, and EMA200 at $154.04. Daily RSI14 at 46.78 is below the neutral 50 mark, and the daily MACD line at -1.44 remains below zero.
Disclaimer: This article is for informational purposes only and does not constitute financial advice, an investment recommendation, or a solicitation to buy or sell any financial instrument. The analysis provided is not indicative of future results. Investing in financial markets carries a high risk of capital loss. Always do your own research (DYOR) and consult a qualified financial advisor before making any decision.
Cryptonomist and the author hold no positions in the financial instruments mentioned and receive no compensation from the companies covered.
Article produced with the assistance of artificial intelligence and reviewed by the editorial team.
VST — daily chart with candlesticks, EMA20/EMA50 and volume.
Key takeaways
Vistra stock closed Friday, October 2 at $140.02, up 0.19% from Thursday’s $139.75, with an open-to-close change of -1.43%.
The daily EMA alignment is fully bearish: price sits below the EMA20 at $140.87, the EMA50 at $144.05, and the EMA200 at $154.04.
Daily RSI14 rose to 46.78 from 46.24 but remains below the neutral 50 mark. The daily MACD histogram crossed above zero to 0.01, up from -0.10.
Hourly RSI14 rose to 56.62 from 52.08, and 15-minute RSI14 rose to 60.24 from 47.40 — both above 50.
Vistra stock closed above the daily pivot at $139.28 and below daily R1 at $143.76. It also closed above the lower daily Bollinger band at $133.50 and below the upper band at $151.20.
According to a Yahoo Finance report published during Friday’s session, Vistra shares trimmed losses. The report said shares were trading down 0.3% at $139.20 after dropping to a session low of $135.79. It tied that weakness to a Bloomberg story stating the Trump administration plans to offer Vistra a roughly $4 billion loan package to upgrade three of its nuclear plants. Two of those plants are in Ohio, and one is in Pennsylvania. Separately, a Seeking Alpha item citing the same Bloomberg report was published after Friday’s close.
Vistra Stock Technical Setup: Daily Trend Still Bearish
The daily chart for Vistra stock remains in a fully bearish alignment, with price trading below all three key exponential moving averages. Price sits below the EMA20 at $140.87. The EMA20 sits below the EMA50 at $144.05, and the EMA50 sits below the EMA200 at $154.04. Daily RSI14 rose to 46.78 from 46.24, but it is still below the neutral 50 mark, which keeps momentum on the soft side.
The daily MACD histogram crossed above zero and now reads 0.01, up from -0.10 in the prior session. That said, both the MACD line at -1.44 and its signal at -1.45 remain below zero. The broader daily trend has therefore not actually turned.
Volatility is edging higher on the daily chart. ATR14 climbed to 4.94 from 4.69, confirming wider daily swings. Price trades below the daily Bollinger mid band at $142.35 and above the lower band at $133.50, putting it in the lower half of that range. For the next session, the daily pivot sits at $139.28, with first resistance (R1) at $143.76 and first support (S1) at $135.53. Friday’s close at $140.02 landed above that pivot and below R1.
Hourly and 15-Minute Momentum Complicate the Picture
Short-term momentum on the hourly and 15-minute charts is firmer than the daily picture, with RSI14 readings above 50 on both timeframes.
Hourly Chart: Neutral but Firming
On the hourly chart, the setup looks neutral rather than bearish. Price sits above the hourly EMA20 at $138.58 and the EMA50 at $138.99. However, it remains below the hourly EMA200 at $140.85. Those three averages remain in ascending order, with the EMA20 below the EMA50 below the EMA200. Hourly RSI14 rose to 56.62 from 52.08, moving above the neutral 50 line. The hourly MACD histogram also crossed above zero and now stands at 0.05, with the line at -0.09 sitting above its signal at -0.14. Hourly ATR14 edged up to 2.27 from 2.21. Price trades between the hourly Bollinger mid band at $138.42 and the upper band at $140.39. For the next session, the hourly pivot sits at $139.32, with R1 at $141.17 and S1 at $138.15.
15-Minute Chart: Bullish Short-Term Tilt
The 15-minute chart leans further toward the bullish side. Price trades above all three 15-minute EMAs. Those averages remain in ascending order — EMA20 at $138.09, EMA50 at $138.30, and EMA200 at $139.06. 15-minute RSI14 rose to 60.24 from 47.40, above 50 but still short of the overbought 70 threshold. The 15-minute MACD line stands at 0.05, above its signal at -0.20, with a histogram of 0.25 — a cleaner bullish setup than on the daily or hourly charts. The 15-minute ATR14 rose to 1.29 from 1.16, and price trades above the 15-minute upper Bollinger band at $139.31. The 15-minute pivot for the next session sits at $139.33, with R1 at $141.16 and S1 at $138.17.
Taken together, the three timeframes disagree. The daily chart keeps Vistra in a bearish structure, the hourly chart is neutral but leaning firmer, and the 15-minute chart shows the clearest short-term bullish tilt. In practice, this reads as an intraday bounce inside a daily downtrend rather than a confirmed reversal.
Bullish Scenario for Vistra Stock
For a bullish reversal to gain credibility, Vistra stock would need to reclaim the daily EMA20 at $140.87 and then clear the R1 resistance zone just above it. The next test would be resistances at $141.16 on the 15-minute chart and $141.17 on the hourly chart. Beyond those levels, the daily pivot’s R1 at $143.76 and the daily EMA50 at $144.05 mark the next hurdles. A move through that zone would need daily RSI14 to clear 50 and the daily MACD line to move back above zero. Together, those would support a shift toward a more constructive daily trend rather than a one-session bounce.
Context from recent coverage adds some texture to that case. A Yahoo Finance report published on Thursday, October 1 noted that Vistra’s price had dropped nearly 30% over the past year. The same report said one Wall Street analyst sees 115% upside from current levels and tied that gap to ERCOT price concerns that management itself had flagged. Separately, a Yahoo Finance comparison published on Wednesday, September 30 argued that Vistra has an edge over Talen, pointing to Vistra’s nuclear scale, diversified generation mix, lower debt-to-capital ratio and stronger ROE. None of this changes the daily chart’s current bearish alignment, but it frames the kind of catalyst bulls would point to if the bounce extends.
Bearish Scenario and What Would Invalidate the Bounce
The bearish case remains intact as long as Vistra stock fails to clear the levels above. A slip back below the hourly S1 at $138.15, or below the 15-minute S1 at $138.17, would suggest the recovery reported by Yahoo Finance is fading. That would reopen the path toward the daily S1 at $135.53 and, beyond it, Friday’s session low of $134.79. Below that zone, the daily chart’s bearish alignment would remain the dominant picture, with price under the EMA20, EMA50 and EMA200. The daily MACD line would also need to stay below zero for the broader trend to stay down.
The nearly 30% one-year decline cited in Thursday’s Yahoo Finance report, together with the ERCOT price concerns that report said management had raised, underscores why caution is still warranted. A single session’s bounce is not, by itself, enough to confirm a trend change. Therefore, the burden of proof still sits with the bulls until the daily chart itself starts to turn.
Where Vistra Stock Stands Now
Vistra stock closed Friday, October 2 at $140.02, above the daily pivot at $139.28 and below the daily R1 at $143.76. It also closed above the lower daily Bollinger band at $133.50 and below the upper band at $151.20. Daily ATR14 at 4.94, alongside rising hourly and 15-minute ATR14 readings of 2.27 and 1.29, points to a market where swings are widening across every timeframe examined. The daily chart still shows a bearish EMA alignment. Meanwhile, the hourly and 15-minute charts show RSI14 above 50 and positive MACD histograms. Overall, what remains uncertain is whether that short-term strength can carry price back through the daily EMA20 and EMA50. It could just as easily fade once the pivot resistances just overhead are tested.
FAQ
What level must Vistra stock reclaim for the bullish case to gain traction?
Vistra stock would first need to reclaim the daily EMA20 at $140.87. Beyond that, resistances sit at $141.16–$141.17 on the 15-minute and hourly charts, followed by the daily R1 at $143.76 and the daily EMA50 at $144.05.
What would signal the intraday bounce has failed?
A move below the hourly S1 at $138.15 or the 15-minute S1 at $138.17 would suggest the recovery is fading. That would reopen the path toward the daily S1 at $135.53 and Friday’s session low of $134.79.
What is the broader daily trend for Vistra stock?
The daily trend remains bearish. Price trades below all three key exponential moving averages — the EMA20 at $140.87, EMA50 at $144.05, and EMA200 at $154.04. Daily RSI14 at 46.78 is below the neutral 50 mark, and the daily MACD line at -1.44 remains below zero.
Disclaimer: This article is for informational purposes only and does not constitute financial advice, an investment recommendation, or a solicitation to buy or sell any financial instrument. The analysis provided is not indicative of future results. Investing in financial markets carries a high risk of capital loss. Always do your own research (DYOR) and consult a qualified financial advisor before making any decision.
Cryptonomist and the author hold no positions in the financial instruments mentioned and receive no compensation from the companies covered.
Article produced with the assistance of artificial intelligence and reviewed by the editorial team.
68
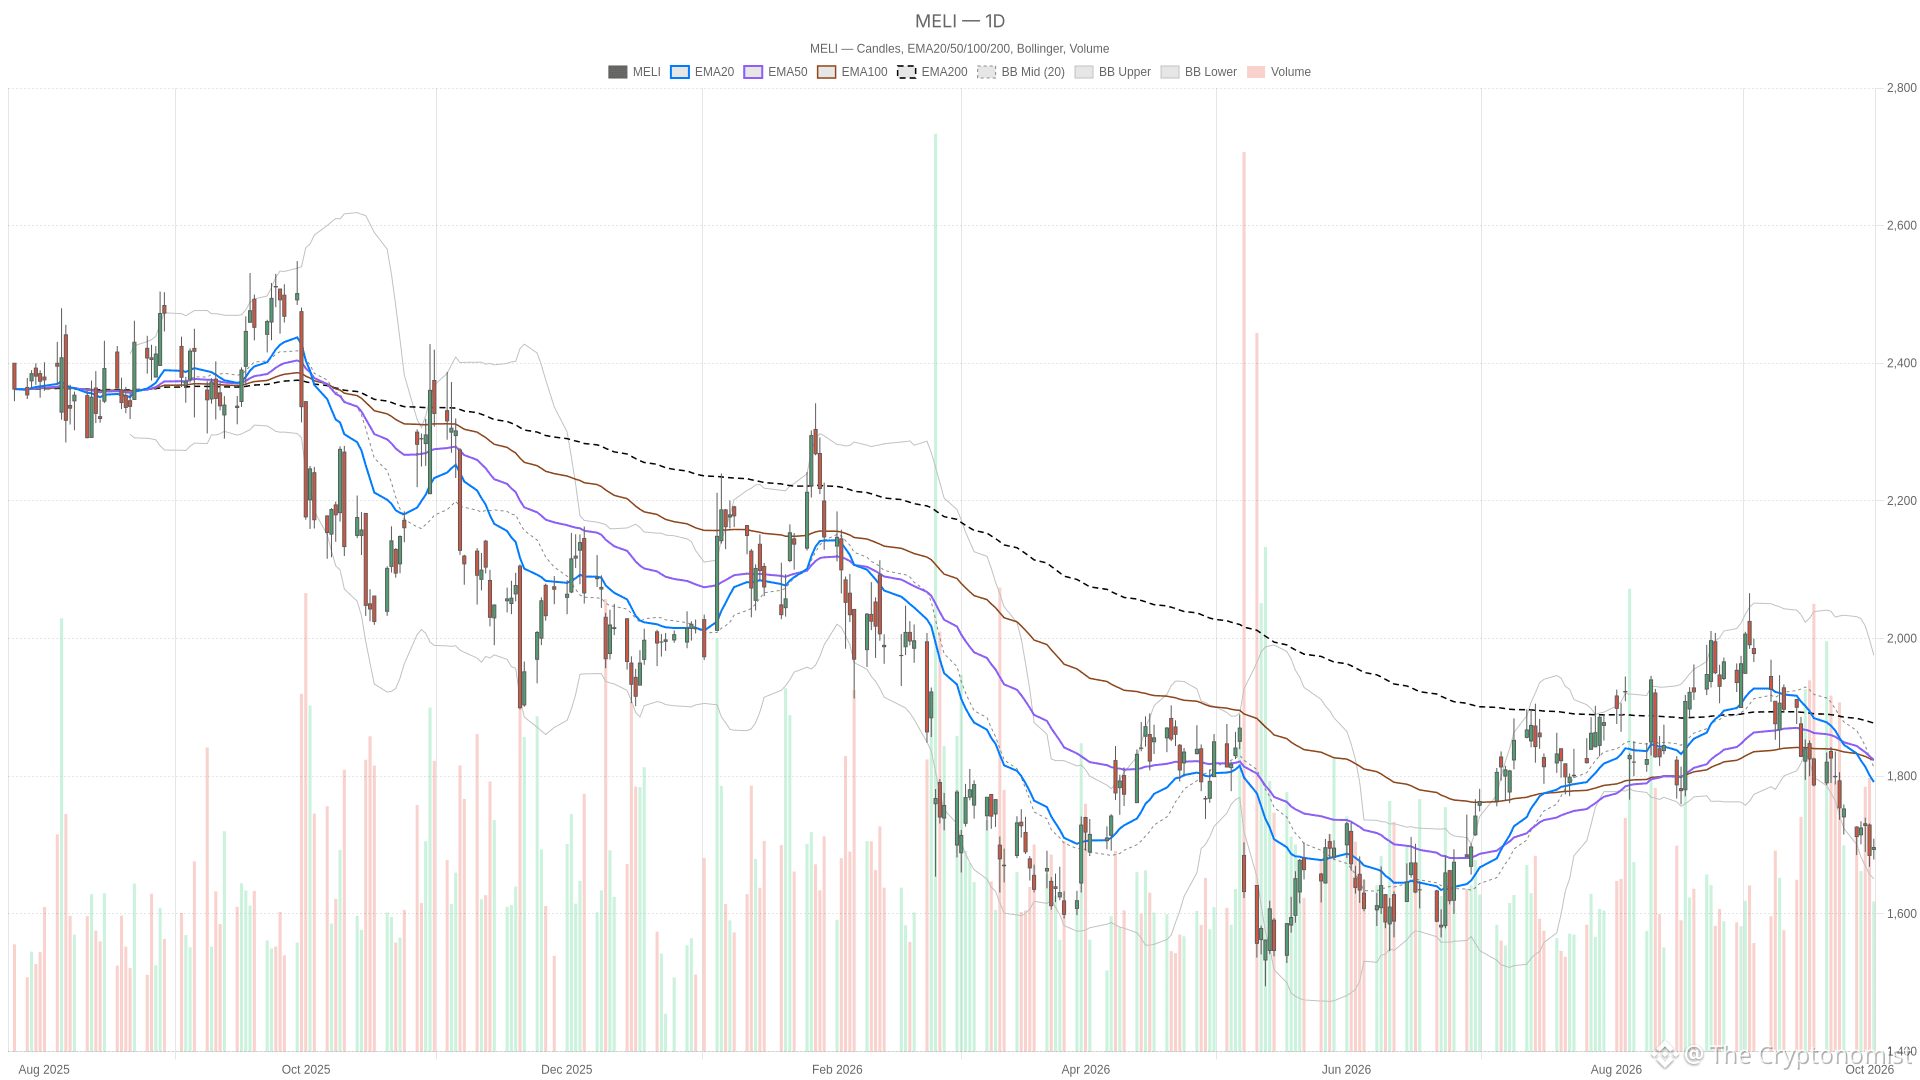
Article
MercadoLibre stock closes up 0.68% at $1,696.56, still below every key moving averageMercadoLibre stock closed at $1,696.56 on Friday, October 2, 2026, gaining 0.68% from the prior session. It opened at $1,693.75, traded between a low of $1,679.02 and a high of $1,709.36, and closed at $1,696.56, against a previous close of $1,685.12. The advance sits inside a daily chart that remains bearish, with price below all major moving averages. The tension now is between that broader downtrend and the readings on the hourly and 15-minute charts.
MELI — daily chart with candlesticks, EMA20/EMA50 and volume.
Key takeaways
MercadoLibre stock closed Friday at $1,696.56, below the daily EMA20 ($1,791.61), EMA50 ($1,823.98), and EMA200 ($1,867.41) in a fully stacked bearish configuration.
Daily RSI14 is 33.49, approaching the 30 oversold threshold; daily MACD histogram is -14.99, with the MACD line at -50.37 below its signal at -35.38.
Hourly RSI14 is 45.85, below the neutral 50; hourly MACD histogram is 1.61, with the MACD line above its signal.
15-minute RSI14 is 57.22, above 50; price closed above the 15m Bollinger upper band at $1,694.46.
Daily pivot stands at $1,694.98, with R1 at $1,710.94 and S1 at $1,680.60.
MercadoLibre Stock: Daily Bias Stays Bearish
MercadoLibre stock trades below all three major daily moving averages in a fully stacked bearish configuration: price under the EMA20, EMA20 under the EMA50, and EMA50 under the EMA200.
Daily Trend Structure
On the daily timeframe, price sits below all three major moving averages. The EMA20 stands at $1,791.61, the EMA50 at $1,823.98, and the EMA200 at $1,867.41. The daily EMA20 itself slipped to $1,791.61 from $1,801.62, confirming that the short-term average is still drifting lower.
Daily Momentum and Volatility
Daily RSI14 rose to 33.49 from 31.35, approaching the 30 oversold threshold. The daily MACD line, at -50.37, remains well below its signal line at -35.38. The histogram is negative at -14.99. However, that histogram did rise from -16.64, though the line-signal relationship stays clearly negative.
Daily ATR14 eased to $55.27 from $57.19, pointing to a modest reduction in daily volatility. The daily Bollinger mid-band is $1,813.33, with the upper band at $1,975.71 and the lower band at $1,650.95. Price sits much closer to the lower band, consistent with the broader downward tilt. For the next session, the daily pivot stands at $1,694.98, with first resistance (R1) at $1,710.94 and first support (S1) at $1,680.60.
Hourly Picture Confirms Structure, Complicates Momentum
The hourly chart mirrors the daily bearish alignment. The H1 EMA20 is at $1,699.69, the EMA50 at $1,726.90, and the EMA200 at $1,812.41. Price sits below all three in the same stacked bearish order seen on the daily chart. In contrast, hourly momentum indicators look less convincingly bearish.
H1 RSI14 climbed to 45.85 from 45.06, still below the neutral 50 line but edging toward it. The H1 MACD line is at -10.89, now above its signal line at -12.50. The histogram rose to 1.61 from 0.90. Notably, the hourly trend structure remains bearish, yet hourly momentum is showing a tentative upward tilt.
Hourly ATR14 eased to $15.44 from $16.06, suggesting volatility compression at this timeframe too. The H1 Bollinger mid-band sits at $1,702.01, with the upper band at $1,742.54 and the lower band at $1,661.48. Price is below the mid-band but notably closer to it than to the lower band. For the next session, the hourly pivot is $1,694.64, with R1 at $1,699.10 and S1 at $1,691.77.
15-Minute Chart Shows Near-Term Buying Pressure
On the 15-minute chart, short-term buying pressure is visible, with price closing above the upper Bollinger band at $1,694.46. The 15m EMA20 is $1,689.40 and the EMA50 is $1,693.64, both below the current price level. The EMA200 at $1,731.34 remains above, creating a mixed arrangement rather than a clean trend.
15m RSI14 rose to 57.22 from 53.39, above the neutral 50 mark. The 15m MACD line, at 0.02, is above its signal at -1.32, with the histogram positive at 1.33, up from 1.01. Meanwhile, 15m ATR14 is flat at $6.35. For the next session, the 15-minute pivot is $1,694.43, with R1 at $1,698.69 and S1 at $1,691.98. Altogether, the 15-minute chart points to active short-term upward pressure layered on top of a daily downtrend that has not yet been broken.
Bullish Scenario for MercadoLibre Stock
A bullish reversal for MercadoLibre stock would require clearing the daily pivot resistance at $1,710.94 on a closing basis. Beyond that, the more meaningful technical test is the daily EMA20 at $1,791.61. Reclaiming it would begin to dismantle the current bearish stacking on the daily chart.
Supporting evidence would include the daily RSI14 pushing back above 50 and the daily MACD histogram turning positive. Both remain on the negative side today. On the hourly timeframe, holding above the H1 pivot at $1,694.64 and then clearing the H1 EMA50 at $1,726.90 would reinforce that shift. The 15-minute chart’s push above its upper Bollinger band, with RSI14 above 50 and a positive MACD histogram, would need to persist. Only then could the short-term strength feed into the higher timeframes.
Bearish Scenario for MercadoLibre Stock
The bearish case retains control as long as MercadoLibre stock stays below the daily EMA20 at $1,791.61, the EMA50, and the EMA200. The hourly S1 at $1,691.77 and the 15-minute S1 at $1,691.98 sit just under current levels and would give way first if short-term buying interest fades.
A break below the daily pivot support at $1,680.60 would be a further concrete sign that the Friday advance has been absorbed. Further downside would bring the daily Bollinger lower band at $1,650.95 into view. A daily RSI14 drop back toward or below 30, combined with the MACD histogram turning more negative, would confirm the broader downtrend is reasserting itself.
News Flow Around MercadoLibre Stock
Five news items surrounded MercadoLibre stock in the days leading into and following Friday’s session. A Yahoo Finance recap of Thursday’s session, published October 1, noted that MercadoLibre shares fell 2.51% that day even as the broader market advanced. Separately, a Bloomberg report published Wednesday, September 30, said Brazil’s health regulator is reviewing MercadoLibre’s plan to build an online marketplace for pharmacies.
On a more constructive note, a Yahoo Finance report published Tuesday, September 29, said MercadoLibre’s credit portfolio surged 75% to $16.4 billion in the second quarter of 2026. The report tied the growth to stronger card issuance and deeper engagement with Mercado Pago.
Two further pieces appeared after Friday’s close, both published on Sunday, October 4. One Yahoo Finance report compared MercadoLibre against Uber Technologies as a 2026 buy candidate, describing MercadoLibre as the steadier grower generating substantial free cash flow at a more modest valuation premium. The other was a first-person contributor piece on Yahoo Finance, in which the author argued they would still buy MercadoLibre stock at its roughly $1,700 share price. Since both items were published after the Friday session, they should be read as weekend commentary rather than as drivers of that session’s price action.
Where MercadoLibre Stock Stands Now
MercadoLibre stock closed Friday at $1,696.56, above the daily pivot at $1,694.98 but well below every major daily moving average, from the EMA20 at $1,791.61 to the EMA200 at $1,867.41. The daily ATR14 is $55.27. Meanwhile, the 15-minute chart’s push above its upper Bollinger band shows short-term buying interest is present, even if not yet confirmed on higher timeframes.
The question now is whether hourly momentum — RSI14 near 45.85 and a positive MACD histogram — can translate into a daily-level shift. If not, the broader bearish alignment across the EMA20, EMA50, and EMA200 may simply absorb this advance. Until the daily pivot resistance at $1,710.94 and, further out, the daily EMA20 are reclaimed, the path of least resistance on the daily chart remains tilted to the downside.
FAQ
What is the daily trend structure for MercadoLibre stock?
MercadoLibre stock trades below all three major daily moving averages — the EMA20 at $1,791.61, the EMA50 at $1,823.98, and the EMA200 at $1,867.41 — in a fully stacked bearish configuration. Daily RSI14 is 33.49, approaching the 30 oversold threshold.
What do the hourly momentum indicators show?
The hourly chart mirrors the daily bearish trend structure, with price below all three H1 EMAs. However, hourly momentum is mixed: H1 RSI14 is 45.85, below the neutral 50, but the H1 MACD histogram is 1.61, with the MACD line now above its signal line.
What pivot levels should traders watch for the next session?
The daily pivot is $1,694.98, with first resistance at $1,710.94 and first support at $1,680.60. On the hourly chart, the pivot is $1,694.64, with R1 at $1,699.10 and S1 at $1,691.77. The 15-minute pivot is $1,694.43, with R1 at $1,698.69 and S1 at $1,691.98.
What recent news items surrounded MercadoLibre stock?
A Yahoo Finance report published Thursday noted MercadoLibre shares fell 2.51% that day. Bloomberg reported Wednesday that Brazil’s health regulator is reviewing the company’s online pharmacy marketplace plan. Yahoo Finance also reported Tuesday that the credit portfolio surged 75% to $16.4 billion in Q2 2026. Two additional Yahoo Finance items were published after Friday’s close on Sunday, October 4.
Disclaimer: This article is for informational purposes only and does not constitute financial advice, an investment recommendation, or a solicitation to buy or sell any financial instrument. The analysis provided is not indicative of future results. Investing in financial markets carries a high risk of capital loss. Always do your own research (DYOR) and consult a qualified financial advisor before making any decision.
Cryptonomist and the author hold no positions in the financial instruments mentioned and receive no compensation from the companies covered.
Article produced with the assistance of artificial intelligence and reviewed by the editorial team.
MercadoLibre stock closes up 0.68% at $1,696.56, still below every key moving average
MercadoLibre stock closed at $1,696.56 on Friday, October 2, 2026, gaining 0.68% from the prior session. It opened at $1,693.75, traded between a low of $1,679.02 and a high of $1,709.36, and closed at $1,696.56, against a previous close of $1,685.12. The advance sits inside a daily chart that remains bearish, with price below all major moving averages. The tension now is between that broader downtrend and the readings on the hourly and 15-minute charts.
MELI — daily chart with candlesticks, EMA20/EMA50 and volume.
Key takeaways
MercadoLibre stock closed Friday at $1,696.56, below the daily EMA20 ($1,791.61), EMA50 ($1,823.98), and EMA200 ($1,867.41) in a fully stacked bearish configuration.
Daily RSI14 is 33.49, approaching the 30 oversold threshold; daily MACD histogram is -14.99, with the MACD line at -50.37 below its signal at -35.38.
Hourly RSI14 is 45.85, below the neutral 50; hourly MACD histogram is 1.61, with the MACD line above its signal.
15-minute RSI14 is 57.22, above 50; price closed above the 15m Bollinger upper band at $1,694.46.
Daily pivot stands at $1,694.98, with R1 at $1,710.94 and S1 at $1,680.60.
MercadoLibre Stock: Daily Bias Stays Bearish
MercadoLibre stock trades below all three major daily moving averages in a fully stacked bearish configuration: price under the EMA20, EMA20 under the EMA50, and EMA50 under the EMA200.
Daily Trend Structure
On the daily timeframe, price sits below all three major moving averages. The EMA20 stands at $1,791.61, the EMA50 at $1,823.98, and the EMA200 at $1,867.41. The daily EMA20 itself slipped to $1,791.61 from $1,801.62, confirming that the short-term average is still drifting lower.
Daily Momentum and Volatility
Daily RSI14 rose to 33.49 from 31.35, approaching the 30 oversold threshold. The daily MACD line, at -50.37, remains well below its signal line at -35.38. The histogram is negative at -14.99. However, that histogram did rise from -16.64, though the line-signal relationship stays clearly negative.
Daily ATR14 eased to $55.27 from $57.19, pointing to a modest reduction in daily volatility. The daily Bollinger mid-band is $1,813.33, with the upper band at $1,975.71 and the lower band at $1,650.95. Price sits much closer to the lower band, consistent with the broader downward tilt. For the next session, the daily pivot stands at $1,694.98, with first resistance (R1) at $1,710.94 and first support (S1) at $1,680.60.
Hourly Picture Confirms Structure, Complicates Momentum
The hourly chart mirrors the daily bearish alignment. The H1 EMA20 is at $1,699.69, the EMA50 at $1,726.90, and the EMA200 at $1,812.41. Price sits below all three in the same stacked bearish order seen on the daily chart. In contrast, hourly momentum indicators look less convincingly bearish.
H1 RSI14 climbed to 45.85 from 45.06, still below the neutral 50 line but edging toward it. The H1 MACD line is at -10.89, now above its signal line at -12.50. The histogram rose to 1.61 from 0.90. Notably, the hourly trend structure remains bearish, yet hourly momentum is showing a tentative upward tilt.
Hourly ATR14 eased to $15.44 from $16.06, suggesting volatility compression at this timeframe too. The H1 Bollinger mid-band sits at $1,702.01, with the upper band at $1,742.54 and the lower band at $1,661.48. Price is below the mid-band but notably closer to it than to the lower band. For the next session, the hourly pivot is $1,694.64, with R1 at $1,699.10 and S1 at $1,691.77.
15-Minute Chart Shows Near-Term Buying Pressure
On the 15-minute chart, short-term buying pressure is visible, with price closing above the upper Bollinger band at $1,694.46. The 15m EMA20 is $1,689.40 and the EMA50 is $1,693.64, both below the current price level. The EMA200 at $1,731.34 remains above, creating a mixed arrangement rather than a clean trend.
15m RSI14 rose to 57.22 from 53.39, above the neutral 50 mark. The 15m MACD line, at 0.02, is above its signal at -1.32, with the histogram positive at 1.33, up from 1.01. Meanwhile, 15m ATR14 is flat at $6.35. For the next session, the 15-minute pivot is $1,694.43, with R1 at $1,698.69 and S1 at $1,691.98. Altogether, the 15-minute chart points to active short-term upward pressure layered on top of a daily downtrend that has not yet been broken.
Bullish Scenario for MercadoLibre Stock
A bullish reversal for MercadoLibre stock would require clearing the daily pivot resistance at $1,710.94 on a closing basis. Beyond that, the more meaningful technical test is the daily EMA20 at $1,791.61. Reclaiming it would begin to dismantle the current bearish stacking on the daily chart.
Supporting evidence would include the daily RSI14 pushing back above 50 and the daily MACD histogram turning positive. Both remain on the negative side today. On the hourly timeframe, holding above the H1 pivot at $1,694.64 and then clearing the H1 EMA50 at $1,726.90 would reinforce that shift. The 15-minute chart’s push above its upper Bollinger band, with RSI14 above 50 and a positive MACD histogram, would need to persist. Only then could the short-term strength feed into the higher timeframes.
Bearish Scenario for MercadoLibre Stock
The bearish case retains control as long as MercadoLibre stock stays below the daily EMA20 at $1,791.61, the EMA50, and the EMA200. The hourly S1 at $1,691.77 and the 15-minute S1 at $1,691.98 sit just under current levels and would give way first if short-term buying interest fades.
A break below the daily pivot support at $1,680.60 would be a further concrete sign that the Friday advance has been absorbed. Further downside would bring the daily Bollinger lower band at $1,650.95 into view. A daily RSI14 drop back toward or below 30, combined with the MACD histogram turning more negative, would confirm the broader downtrend is reasserting itself.
News Flow Around MercadoLibre Stock
Five news items surrounded MercadoLibre stock in the days leading into and following Friday’s session. A Yahoo Finance recap of Thursday’s session, published October 1, noted that MercadoLibre shares fell 2.51% that day even as the broader market advanced. Separately, a Bloomberg report published Wednesday, September 30, said Brazil’s health regulator is reviewing MercadoLibre’s plan to build an online marketplace for pharmacies.
On a more constructive note, a Yahoo Finance report published Tuesday, September 29, said MercadoLibre’s credit portfolio surged 75% to $16.4 billion in the second quarter of 2026. The report tied the growth to stronger card issuance and deeper engagement with Mercado Pago.
Two further pieces appeared after Friday’s close, both published on Sunday, October 4. One Yahoo Finance report compared MercadoLibre against Uber Technologies as a 2026 buy candidate, describing MercadoLibre as the steadier grower generating substantial free cash flow at a more modest valuation premium. The other was a first-person contributor piece on Yahoo Finance, in which the author argued they would still buy MercadoLibre stock at its roughly $1,700 share price. Since both items were published after the Friday session, they should be read as weekend commentary rather than as drivers of that session’s price action.
Where MercadoLibre Stock Stands Now
MercadoLibre stock closed Friday at $1,696.56, above the daily pivot at $1,694.98 but well below every major daily moving average, from the EMA20 at $1,791.61 to the EMA200 at $1,867.41. The daily ATR14 is $55.27. Meanwhile, the 15-minute chart’s push above its upper Bollinger band shows short-term buying interest is present, even if not yet confirmed on higher timeframes.
The question now is whether hourly momentum — RSI14 near 45.85 and a positive MACD histogram — can translate into a daily-level shift. If not, the broader bearish alignment across the EMA20, EMA50, and EMA200 may simply absorb this advance. Until the daily pivot resistance at $1,710.94 and, further out, the daily EMA20 are reclaimed, the path of least resistance on the daily chart remains tilted to the downside.
FAQ
What is the daily trend structure for MercadoLibre stock?
MercadoLibre stock trades below all three major daily moving averages — the EMA20 at $1,791.61, the EMA50 at $1,823.98, and the EMA200 at $1,867.41 — in a fully stacked bearish configuration. Daily RSI14 is 33.49, approaching the 30 oversold threshold.
What do the hourly momentum indicators show?
The hourly chart mirrors the daily bearish trend structure, with price below all three H1 EMAs. However, hourly momentum is mixed: H1 RSI14 is 45.85, below the neutral 50, but the H1 MACD histogram is 1.61, with the MACD line now above its signal line.
What pivot levels should traders watch for the next session?
The daily pivot is $1,694.98, with first resistance at $1,710.94 and first support at $1,680.60. On the hourly chart, the pivot is $1,694.64, with R1 at $1,699.10 and S1 at $1,691.77. The 15-minute pivot is $1,694.43, with R1 at $1,698.69 and S1 at $1,691.98.
What recent news items surrounded MercadoLibre stock?
A Yahoo Finance report published Thursday noted MercadoLibre shares fell 2.51% that day. Bloomberg reported Wednesday that Brazil’s health regulator is reviewing the company’s online pharmacy marketplace plan. Yahoo Finance also reported Tuesday that the credit portfolio surged 75% to $16.4 billion in Q2 2026. Two additional Yahoo Finance items were published after Friday’s close on Sunday, October 4.
Disclaimer: This article is for informational purposes only and does not constitute financial advice, an investment recommendation, or a solicitation to buy or sell any financial instrument. The analysis provided is not indicative of future results. Investing in financial markets carries a high risk of capital loss. Always do your own research (DYOR) and consult a qualified financial advisor before making any decision.
Cryptonomist and the author hold no positions in the financial instruments mentioned and receive no compensation from the companies covered.
Article produced with the assistance of artificial intelligence and reviewed by the editorial team.
MELI — daily chart with candlesticks, EMA20/EMA50 and volume.
Key takeaways
MercadoLibre stock closed Friday at $1,696.56, below the daily EMA20 ($1,791.61), EMA50 ($1,823.98), and EMA200 ($1,867.41) in a fully stacked bearish configuration.
Daily RSI14 is 33.49, approaching the 30 oversold threshold; daily MACD histogram is -14.99, with the MACD line at -50.37 below its signal at -35.38.
Hourly RSI14 is 45.85, below the neutral 50; hourly MACD histogram is 1.61, with the MACD line above its signal.
15-minute RSI14 is 57.22, above 50; price closed above the 15m Bollinger upper band at $1,694.46.
Daily pivot stands at $1,694.98, with R1 at $1,710.94 and S1 at $1,680.60.
MercadoLibre Stock: Daily Bias Stays Bearish
MercadoLibre stock trades below all three major daily moving averages in a fully stacked bearish configuration: price under the EMA20, EMA20 under the EMA50, and EMA50 under the EMA200.
Daily Trend Structure
On the daily timeframe, price sits below all three major moving averages. The EMA20 stands at $1,791.61, the EMA50 at $1,823.98, and the EMA200 at $1,867.41. The daily EMA20 itself slipped to $1,791.61 from $1,801.62, confirming that the short-term average is still drifting lower.
Daily Momentum and Volatility
Daily RSI14 rose to 33.49 from 31.35, approaching the 30 oversold threshold. The daily MACD line, at -50.37, remains well below its signal line at -35.38. The histogram is negative at -14.99. However, that histogram did rise from -16.64, though the line-signal relationship stays clearly negative.
Daily ATR14 eased to $55.27 from $57.19, pointing to a modest reduction in daily volatility. The daily Bollinger mid-band is $1,813.33, with the upper band at $1,975.71 and the lower band at $1,650.95. Price sits much closer to the lower band, consistent with the broader downward tilt. For the next session, the daily pivot stands at $1,694.98, with first resistance (R1) at $1,710.94 and first support (S1) at $1,680.60.
Hourly Picture Confirms Structure, Complicates Momentum
The hourly chart mirrors the daily bearish alignment. The H1 EMA20 is at $1,699.69, the EMA50 at $1,726.90, and the EMA200 at $1,812.41. Price sits below all three in the same stacked bearish order seen on the daily chart. In contrast, hourly momentum indicators look less convincingly bearish.
H1 RSI14 climbed to 45.85 from 45.06, still below the neutral 50 line but edging toward it. The H1 MACD line is at -10.89, now above its signal line at -12.50. The histogram rose to 1.61 from 0.90. Notably, the hourly trend structure remains bearish, yet hourly momentum is showing a tentative upward tilt.
Hourly ATR14 eased to $15.44 from $16.06, suggesting volatility compression at this timeframe too. The H1 Bollinger mid-band sits at $1,702.01, with the upper band at $1,742.54 and the lower band at $1,661.48. Price is below the mid-band but notably closer to it than to the lower band. For the next session, the hourly pivot is $1,694.64, with R1 at $1,699.10 and S1 at $1,691.77.
15-Minute Chart Shows Near-Term Buying Pressure
On the 15-minute chart, short-term buying pressure is visible, with price closing above the upper Bollinger band at $1,694.46. The 15m EMA20 is $1,689.40 and the EMA50 is $1,693.64, both below the current price level. The EMA200 at $1,731.34 remains above, creating a mixed arrangement rather than a clean trend.
15m RSI14 rose to 57.22 from 53.39, above the neutral 50 mark. The 15m MACD line, at 0.02, is above its signal at -1.32, with the histogram positive at 1.33, up from 1.01. Meanwhile, 15m ATR14 is flat at $6.35. For the next session, the 15-minute pivot is $1,694.43, with R1 at $1,698.69 and S1 at $1,691.98. Altogether, the 15-minute chart points to active short-term upward pressure layered on top of a daily downtrend that has not yet been broken.
Bullish Scenario for MercadoLibre Stock
A bullish reversal for MercadoLibre stock would require clearing the daily pivot resistance at $1,710.94 on a closing basis. Beyond that, the more meaningful technical test is the daily EMA20 at $1,791.61. Reclaiming it would begin to dismantle the current bearish stacking on the daily chart.
Supporting evidence would include the daily RSI14 pushing back above 50 and the daily MACD histogram turning positive. Both remain on the negative side today. On the hourly timeframe, holding above the H1 pivot at $1,694.64 and then clearing the H1 EMA50 at $1,726.90 would reinforce that shift. The 15-minute chart’s push above its upper Bollinger band, with RSI14 above 50 and a positive MACD histogram, would need to persist. Only then could the short-term strength feed into the higher timeframes.
Bearish Scenario for MercadoLibre Stock
The bearish case retains control as long as MercadoLibre stock stays below the daily EMA20 at $1,791.61, the EMA50, and the EMA200. The hourly S1 at $1,691.77 and the 15-minute S1 at $1,691.98 sit just under current levels and would give way first if short-term buying interest fades.
A break below the daily pivot support at $1,680.60 would be a further concrete sign that the Friday advance has been absorbed. Further downside would bring the daily Bollinger lower band at $1,650.95 into view. A daily RSI14 drop back toward or below 30, combined with the MACD histogram turning more negative, would confirm the broader downtrend is reasserting itself.
News Flow Around MercadoLibre Stock
Five news items surrounded MercadoLibre stock in the days leading into and following Friday’s session. A Yahoo Finance recap of Thursday’s session, published October 1, noted that MercadoLibre shares fell 2.51% that day even as the broader market advanced. Separately, a Bloomberg report published Wednesday, September 30, said Brazil’s health regulator is reviewing MercadoLibre’s plan to build an online marketplace for pharmacies.
On a more constructive note, a Yahoo Finance report published Tuesday, September 29, said MercadoLibre’s credit portfolio surged 75% to $16.4 billion in the second quarter of 2026. The report tied the growth to stronger card issuance and deeper engagement with Mercado Pago.
Two further pieces appeared after Friday’s close, both published on Sunday, October 4. One Yahoo Finance report compared MercadoLibre against Uber Technologies as a 2026 buy candidate, describing MercadoLibre as the steadier grower generating substantial free cash flow at a more modest valuation premium. The other was a first-person contributor piece on Yahoo Finance, in which the author argued they would still buy MercadoLibre stock at its roughly $1,700 share price. Since both items were published after the Friday session, they should be read as weekend commentary rather than as drivers of that session’s price action.
Where MercadoLibre Stock Stands Now
MercadoLibre stock closed Friday at $1,696.56, above the daily pivot at $1,694.98 but well below every major daily moving average, from the EMA20 at $1,791.61 to the EMA200 at $1,867.41. The daily ATR14 is $55.27. Meanwhile, the 15-minute chart’s push above its upper Bollinger band shows short-term buying interest is present, even if not yet confirmed on higher timeframes.
The question now is whether hourly momentum — RSI14 near 45.85 and a positive MACD histogram — can translate into a daily-level shift. If not, the broader bearish alignment across the EMA20, EMA50, and EMA200 may simply absorb this advance. Until the daily pivot resistance at $1,710.94 and, further out, the daily EMA20 are reclaimed, the path of least resistance on the daily chart remains tilted to the downside.
FAQ
What is the daily trend structure for MercadoLibre stock?
MercadoLibre stock trades below all three major daily moving averages — the EMA20 at $1,791.61, the EMA50 at $1,823.98, and the EMA200 at $1,867.41 — in a fully stacked bearish configuration. Daily RSI14 is 33.49, approaching the 30 oversold threshold.
What do the hourly momentum indicators show?
The hourly chart mirrors the daily bearish trend structure, with price below all three H1 EMAs. However, hourly momentum is mixed: H1 RSI14 is 45.85, below the neutral 50, but the H1 MACD histogram is 1.61, with the MACD line now above its signal line.
What pivot levels should traders watch for the next session?
The daily pivot is $1,694.98, with first resistance at $1,710.94 and first support at $1,680.60. On the hourly chart, the pivot is $1,694.64, with R1 at $1,699.10 and S1 at $1,691.77. The 15-minute pivot is $1,694.43, with R1 at $1,698.69 and S1 at $1,691.98.
What recent news items surrounded MercadoLibre stock?
A Yahoo Finance report published Thursday noted MercadoLibre shares fell 2.51% that day. Bloomberg reported Wednesday that Brazil’s health regulator is reviewing the company’s online pharmacy marketplace plan. Yahoo Finance also reported Tuesday that the credit portfolio surged 75% to $16.4 billion in Q2 2026. Two additional Yahoo Finance items were published after Friday’s close on Sunday, October 4.
Disclaimer: This article is for informational purposes only and does not constitute financial advice, an investment recommendation, or a solicitation to buy or sell any financial instrument. The analysis provided is not indicative of future results. Investing in financial markets carries a high risk of capital loss. Always do your own research (DYOR) and consult a qualified financial advisor before making any decision.
Cryptonomist and the author hold no positions in the financial instruments mentioned and receive no compensation from the companies covered.
Article produced with the assistance of artificial intelligence and reviewed by the editorial team.
13

Article
Hyperliquid’s USDC reserve funding sends $14.58M to HYPE buybacksHyperliquid has started drawing on a new revenue stream to support HYPE token buybacks after receiving its first USDC reserve funding payment of $14.58 million under the AQAv2 framework.
Key takeaways
Hyperliquid collected an initial $14.58 million USDC payment tied to the AQAv2 framework.
The payment covers a 30-day period and opens a funding channel beyond trading fees.
About 90% of cost-adjusted reserve yield on USDC supply flows to the protocol.
That yield is routed through the Assistance Fund, which buys HYPE tokens.
First payment routed through the Assistance Fund
According to a post published on X by WuBlockchain, the transfer marks the first time Hyperliquid has tapped USDC reserve funding as a dedicated source for HYPE buybacks, instead of relying only on trading fee revenue. The AQAv2 framework directs about 90% of the cost-adjusted yield earned from USDC reserve supply back to the protocol.
That shared yield is then routed to the Assistance Fund, the mechanism responsible for purchasing HYPE on the open market. The initial payment, confirmed at $14.58 million, covered a 30-day period, per the same post.
Crypto Briefing, which also reported on the payment, said the AQAv2 protocol was activated in August 2026 and is designed to direct eligible USDC reserve yield into buybacks on a recurring basis.
The arrangement ties HYPE buybacks to USDC reserves held within Hyperliquid’s ecosystem, giving the protocol a funding stream separate from its trading fee income.
Article produced with the assistance of artificial intelligence and reviewed by the editorial team.
Hyperliquid’s USDC reserve funding sends $14.58M to HYPE buybacks
Hyperliquid has started drawing on a new revenue stream to support HYPE token buybacks after receiving its first USDC reserve funding payment of $14.58 million under the AQAv2 framework.
Key takeaways
Hyperliquid collected an initial $14.58 million USDC payment tied to the AQAv2 framework.
The payment covers a 30-day period and opens a funding channel beyond trading fees.
About 90% of cost-adjusted reserve yield on USDC supply flows to the protocol.
That yield is routed through the Assistance Fund, which buys HYPE tokens.
First payment routed through the Assistance Fund
According to a post published on X by WuBlockchain, the transfer marks the first time Hyperliquid has tapped USDC reserve funding as a dedicated source for HYPE buybacks, instead of relying only on trading fee revenue. The AQAv2 framework directs about 90% of the cost-adjusted yield earned from USDC reserve supply back to the protocol.
That shared yield is then routed to the Assistance Fund, the mechanism responsible for purchasing HYPE on the open market. The initial payment, confirmed at $14.58 million, covered a 30-day period, per the same post.
Crypto Briefing, which also reported on the payment, said the AQAv2 protocol was activated in August 2026 and is designed to direct eligible USDC reserve yield into buybacks on a recurring basis.
The arrangement ties HYPE buybacks to USDC reserves held within Hyperliquid’s ecosystem, giving the protocol a funding stream separate from its trading fee income.
Article produced with the assistance of artificial intelligence and reviewed by the editorial team.
Key takeaways
Hyperliquid collected an initial $14.58 million USDC payment tied to the AQAv2 framework.
The payment covers a 30-day period and opens a funding channel beyond trading fees.
About 90% of cost-adjusted reserve yield on USDC supply flows to the protocol.
That yield is routed through the Assistance Fund, which buys HYPE tokens.
First payment routed through the Assistance Fund
According to a post published on X by WuBlockchain, the transfer marks the first time Hyperliquid has tapped USDC reserve funding as a dedicated source for HYPE buybacks, instead of relying only on trading fee revenue. The AQAv2 framework directs about 90% of the cost-adjusted yield earned from USDC reserve supply back to the protocol.
That shared yield is then routed to the Assistance Fund, the mechanism responsible for purchasing HYPE on the open market. The initial payment, confirmed at $14.58 million, covered a 30-day period, per the same post.
Crypto Briefing, which also reported on the payment, said the AQAv2 protocol was activated in August 2026 and is designed to direct eligible USDC reserve yield into buybacks on a recurring basis.
The arrangement ties HYPE buybacks to USDC reserves held within Hyperliquid’s ecosystem, giving the protocol a funding stream separate from its trading fee income.
Article produced with the assistance of artificial intelligence and reviewed by the editorial team.
16
Log in to explore more content
Join global crypto users on Binance Square
⚡️ Get latest and useful information about crypto.
💬 Trusted by the world’s largest crypto exchange.
👍 Discover real insights from verified creators.
Email / Phone number
Trending Topics
ADAGains10%Above$0.27
15,337 views
181 Discussing
$ADA is making a strong move today jumping over 10 percent to around 027 and breaking into a new 90 day high
Trading volume has also surged above 1 billion showing strong market activity
The move comes as $ADA continues its recovery from the June lows while its recent technical structure has turned more bullish
The 027 to 028 zone is now the key area to watch A sustained breakout could open the door toward higher resistance levels
But after such a sharp daily move volatility could remain high
#ADAGains10%Above$0.27 #crypto #ADA #Cardano #crypto #Write2Earn
AbdullahAbid_7
·0 Likes
·381 views
ETHUp70%InQ3ButLiquidityFalls
167,049 views
1,071 Discussing
EthStakingExitQueueHits2026High
57,741 views
767 Discussing