

Cryptic Tanveer
540 Posts

Cryptic Tanveer
Report
Block User
🤑 Latest Crypto News 🌐 || 🔝 Market Analysis🔎 || 💲Premium Trade Signal 💸|| 📃 Contant Creator
Occasional Trader
8.1 Years
21 Following
82 Followers
237 Liked
Posts
All
Quotes
When a chart prints a high technical score alongside rising volume, ignoring the momentum is usually a costly mistake.
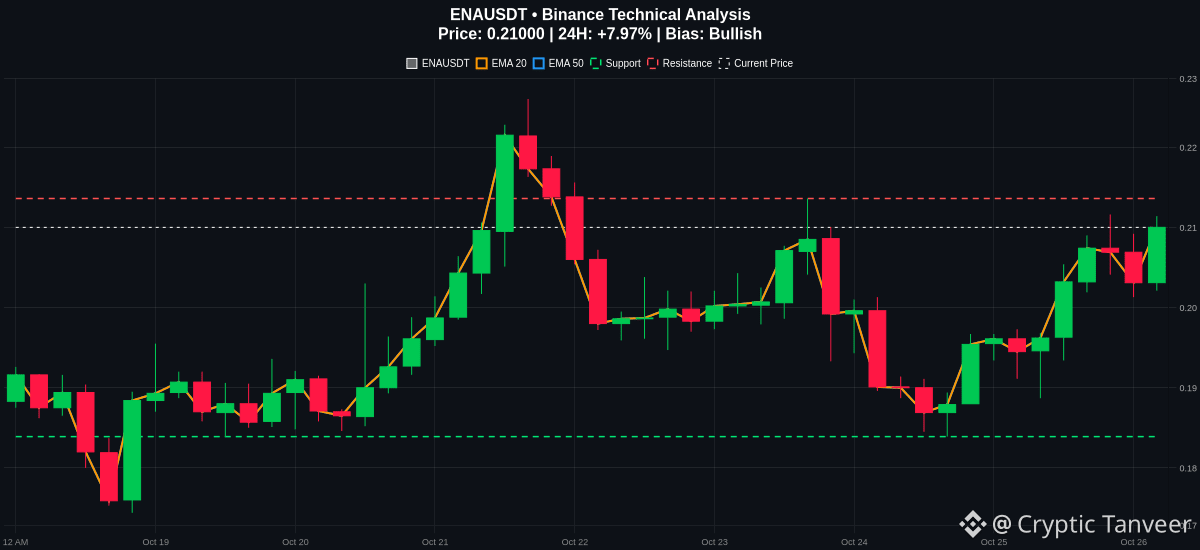
$ENA is currently trading at 0.21, marking a solid 7.96% gain over the last 24 hours. This push is backed by a clean bullish EMA structure where the EMA20 at 0.2003 sits just above the EMA50 at 0.2003, showing steady trend alignment rather than a random spike.
The MACD is printing at 0.0017 against a signal line of 0.0002, pointing to active upside pressure. Meanwhile, the RSI sits at 60.91. This reflects healthy buying strength without screaming extreme overextension just yet, though keeping an eye on local reactions is wise.
Immediate resistance sits overhead at 0.2136. If bulls manage to clear this zone, further upside could unfold. On the flip side, support rests near 0.1839, which serves as a key invalidation level to watch if the trend reverses.
Always manage your risk carefully as conditions can shift quickly.
Are you looking for a breakout above resistance or waiting for a dip?
#ENA #CryptoTrading #TechnicalAnalysis
Follow me for more update 📈
When a chart prints a high technical score alongside rising volume, ignoring the momentum is usually a costly mistake.
$ENA is currently trading at 0.21, marking a solid 7.96% gain over the last 24 hours. This push is backed by a clean bullish EMA structure where the EMA20 at 0.2003 sits just above the EMA50 at 0.2003, showing steady trend alignment rather than a random spike.
The MACD is printing at 0.0017 against a signal line of 0.0002, pointing to active upside pressure. Meanwhile, the RSI sits at 60.91. This reflects healthy buying strength without screaming extreme overextension just yet, though keeping an eye on local reactions is wise.
Immediate resistance sits overhead at 0.2136. If bulls manage to clear this zone, further upside could unfold. On the flip side, support rests near 0.1839, which serves as a key invalidation level to watch if the trend reverses.
Always manage your risk carefully as conditions can shift quickly.
Are you looking for a breakout above resistance or waiting for a dip?
#ENA #CryptoTrading #TechnicalAnalysis
Follow me for more update 📈
$ENA is currently trading at 0.21, marking a solid 7.96% gain over the last 24 hours. This push is backed by a clean bullish EMA structure where the EMA20 at 0.2003 sits just above the EMA50 at 0.2003, showing steady trend alignment rather than a random spike.
The MACD is printing at 0.0017 against a signal line of 0.0002, pointing to active upside pressure. Meanwhile, the RSI sits at 60.91. This reflects healthy buying strength without screaming extreme overextension just yet, though keeping an eye on local reactions is wise.
Immediate resistance sits overhead at 0.2136. If bulls manage to clear this zone, further upside could unfold. On the flip side, support rests near 0.1839, which serves as a key invalidation level to watch if the trend reverses.
Always manage your risk carefully as conditions can shift quickly.
Are you looking for a breakout above resistance or waiting for a dip?
#ENA #CryptoTrading #TechnicalAnalysis
Follow me for more update 📈
75
Wondering why $ZEC is holding its ground? The current upward path may continue because the underlying technical structure is quietly aligning for more upside. 📈
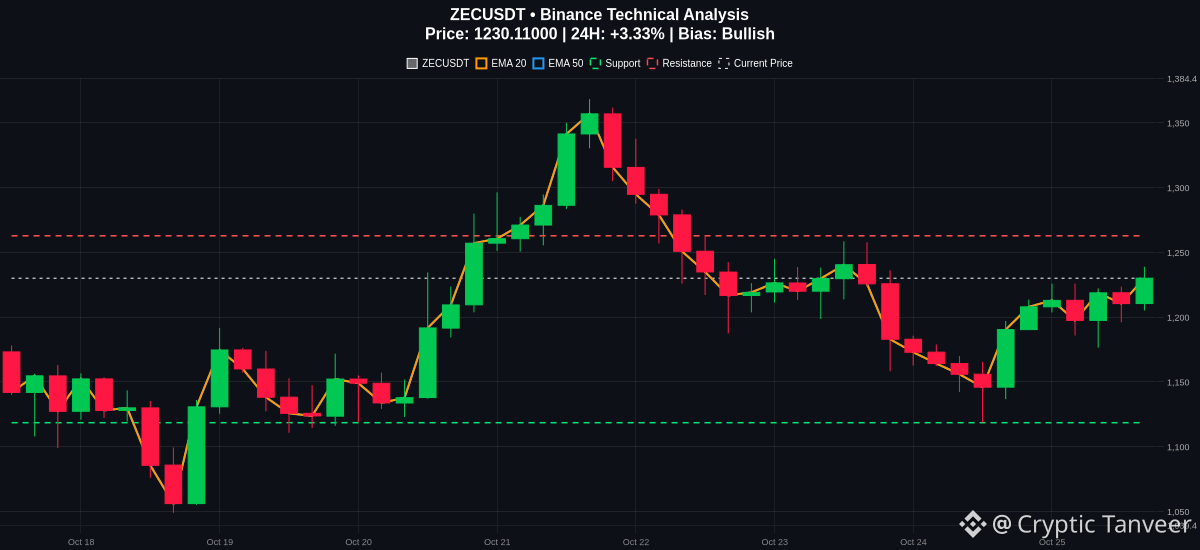
Taking a look at the $ZECUSDT chart, the price is currently sitting at 1230.11, up 3.33% over the last 24 hours.
The technical setup shows healthy momentum. Price is trading above both the EMA20 at 1208.61 and the EMA50 at 1207.89, confirming that the short-term moving average structure is supporting the current trend.
Adding to this, the MACD line at -1.77 has crossed above the MACD signal line at -4.13, pointing to strengthening bullish momentum rather than exhaustion. Meanwhile, the RSI sits at a balanced 54.65, leaving plenty of room for movement before reaching elevated conditions.
Immediate resistance sits at 1262.84, while key support is marked at 1118.55. As long as price action respects these structural boundaries, the trend remains favored to the upside. However, always manage your risk in case of a sudden shift.
Are you currently holding ZEC or waiting for a retest near support? Let me know your plan below.
#ZEC #CryptoTrading #TechnicalAnalysis
Follow me for more update 🔔
Wondering why $ZEC is holding its ground? The current upward path may continue because the underlying technical structure is quietly aligning for more upside. 📈
Taking a look at the $ZECUSDT chart, the price is currently sitting at 1230.11, up 3.33% over the last 24 hours.
The technical setup shows healthy momentum. Price is trading above both the EMA20 at 1208.61 and the EMA50 at 1207.89, confirming that the short-term moving average structure is supporting the current trend.
Adding to this, the MACD line at -1.77 has crossed above the MACD signal line at -4.13, pointing to strengthening bullish momentum rather than exhaustion. Meanwhile, the RSI sits at a balanced 54.65, leaving plenty of room for movement before reaching elevated conditions.
Immediate resistance sits at 1262.84, while key support is marked at 1118.55. As long as price action respects these structural boundaries, the trend remains favored to the upside. However, always manage your risk in case of a sudden shift.
Are you currently holding ZEC or waiting for a retest near support? Let me know your plan below.
#ZEC #CryptoTrading #TechnicalAnalysis
Follow me for more update 🔔
Taking a look at the $ZECUSDT chart, the price is currently sitting at 1230.11, up 3.33% over the last 24 hours.
The technical setup shows healthy momentum. Price is trading above both the EMA20 at 1208.61 and the EMA50 at 1207.89, confirming that the short-term moving average structure is supporting the current trend.
Adding to this, the MACD line at -1.77 has crossed above the MACD signal line at -4.13, pointing to strengthening bullish momentum rather than exhaustion. Meanwhile, the RSI sits at a balanced 54.65, leaving plenty of room for movement before reaching elevated conditions.
Immediate resistance sits at 1262.84, while key support is marked at 1118.55. As long as price action respects these structural boundaries, the trend remains favored to the upside. However, always manage your risk in case of a sudden shift.
Are you currently holding ZEC or waiting for a retest near support? Let me know your plan below.
#ZEC #CryptoTrading #TechnicalAnalysis
Follow me for more update 🔔
231
$ZEC is holding firm above both the 20 and 50 period EMAs, signaling underlying stability in the current market structure.
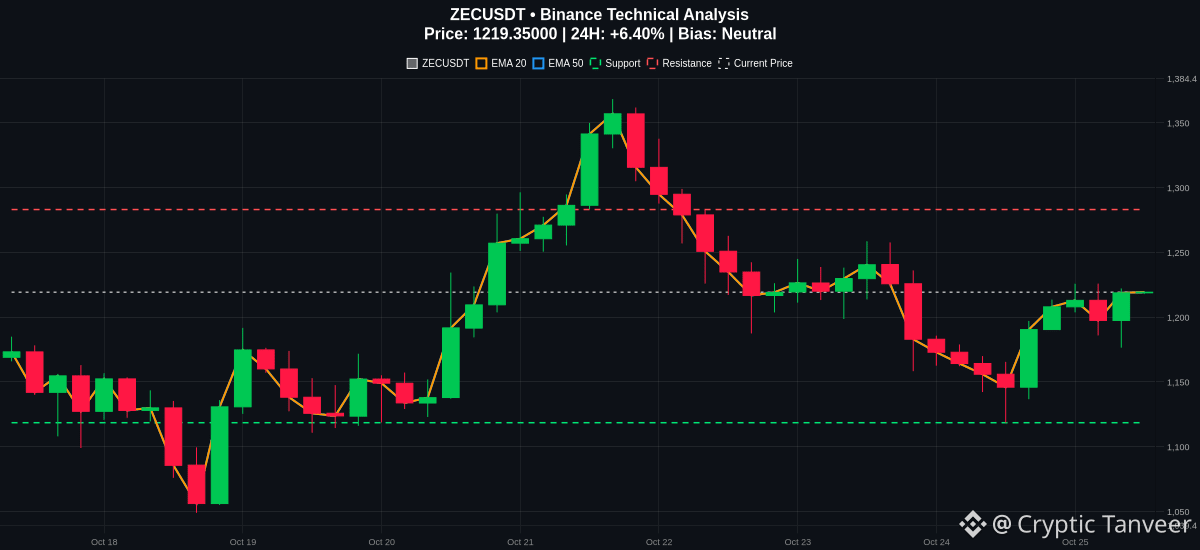
Price is currently trading at 1219.35, reflecting a 6.40% gain over the past 24 hours.
Looking at the indicators, the RSI sits at a neutral 52.62, showing plenty of room for movement without immediate overextension risks. Meanwhile, the MACD shows a slight bullish crossover with the MACD line at -3.53 above the signal line at -4.56, pointing to a potential shift in momentum.
Key levels to watch on the chart include immediate resistance around 1283.13, while downside risk is supported near 1118.55. A break below the EMA clusters around 1207 could invalidate this setup and invite short-term weakness.
Manage your risk carefully as market conditions can shift quickly.
Are you looking for a breakout above resistance or a retest of support first?
#ZEC #CryptoTrading #TechnicalAnalysis
Follow me for more update 🔔
$ZEC is holding firm above both the 20 and 50 period EMAs, signaling underlying stability in the current market structure.
Price is currently trading at 1219.35, reflecting a 6.40% gain over the past 24 hours.
Looking at the indicators, the RSI sits at a neutral 52.62, showing plenty of room for movement without immediate overextension risks. Meanwhile, the MACD shows a slight bullish crossover with the MACD line at -3.53 above the signal line at -4.56, pointing to a potential shift in momentum.
Key levels to watch on the chart include immediate resistance around 1283.13, while downside risk is supported near 1118.55. A break below the EMA clusters around 1207 could invalidate this setup and invite short-term weakness.
Manage your risk carefully as market conditions can shift quickly.
Are you looking for a breakout above resistance or a retest of support first?
#ZEC #CryptoTrading #TechnicalAnalysis
Follow me for more update 🔔
Price is currently trading at 1219.35, reflecting a 6.40% gain over the past 24 hours.
Looking at the indicators, the RSI sits at a neutral 52.62, showing plenty of room for movement without immediate overextension risks. Meanwhile, the MACD shows a slight bullish crossover with the MACD line at -3.53 above the signal line at -4.56, pointing to a potential shift in momentum.
Key levels to watch on the chart include immediate resistance around 1283.13, while downside risk is supported near 1118.55. A break below the EMA clusters around 1207 could invalidate this setup and invite short-term weakness.
Manage your risk carefully as market conditions can shift quickly.
Are you looking for a breakout above resistance or a retest of support first?
#ZEC #CryptoTrading #TechnicalAnalysis
Follow me for more update 🔔
170
Is $BMTUSDT quietly setting up for a major test of its upper boundary? 📈
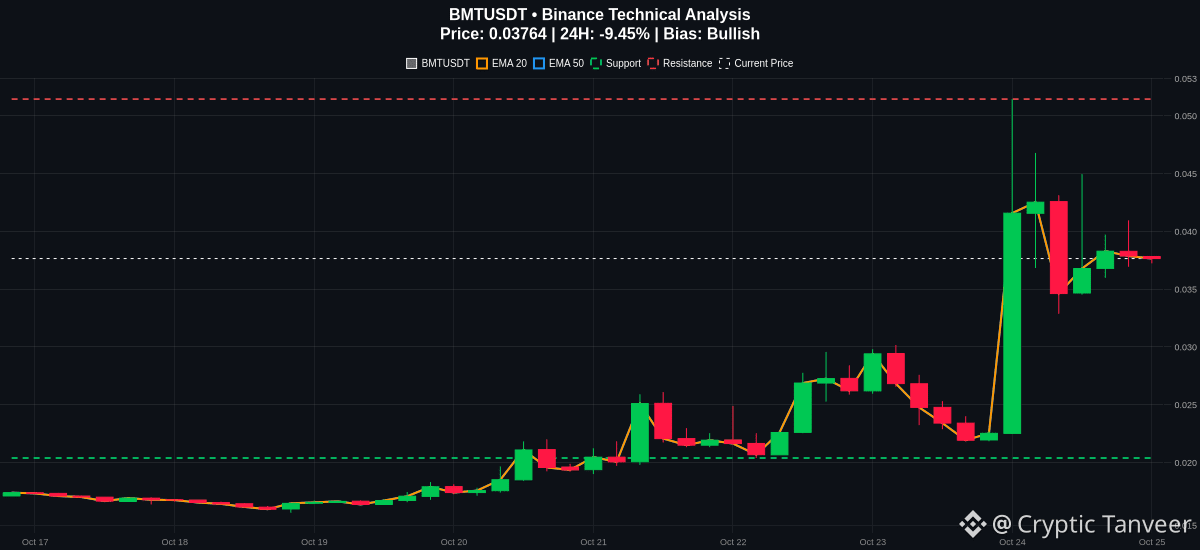
The price currently sits at 0.03764 despite a 24-hour cooling of -9.45%, maintaining a higher low structure above the key EMAs.
Looking at the technical structure, the price is holding well above the EMA20 at 0.03069 and the EMA50 at 0.02520, keeping the broader bullish trend intact.
Momentum indicators show the MACD at 0.00464 trading above its signal line at 0.00375, reflecting ongoing underlying strength. Meanwhile, the RSI sits at 64.06, showing strong bullish momentum without extreme overextension.
Watch for a potential push toward the major resistance level at 0.05144 if buyers step back in. On the downside, crucial support rests near 0.02038, which serves as the primary invalidation level for this setup.
Manage your risk carefully as markets remain unpredictable.
Are you positioning ahead of this resistance test or waiting for confirmation?
#BMT #CryptoTrading #TechnicalAnalysis
Follow me for more updates 🔔
Is $BMTUSDT quietly setting up for a major test of its upper boundary? 📈
The price currently sits at 0.03764 despite a 24-hour cooling of -9.45%, maintaining a higher low structure above the key EMAs.
Looking at the technical structure, the price is holding well above the EMA20 at 0.03069 and the EMA50 at 0.02520, keeping the broader bullish trend intact.
Momentum indicators show the MACD at 0.00464 trading above its signal line at 0.00375, reflecting ongoing underlying strength. Meanwhile, the RSI sits at 64.06, showing strong bullish momentum without extreme overextension.
Watch for a potential push toward the major resistance level at 0.05144 if buyers step back in. On the downside, crucial support rests near 0.02038, which serves as the primary invalidation level for this setup.
Manage your risk carefully as markets remain unpredictable.
Are you positioning ahead of this resistance test or waiting for confirmation?
#BMT #CryptoTrading #TechnicalAnalysis
Follow me for more updates 🔔
The price currently sits at 0.03764 despite a 24-hour cooling of -9.45%, maintaining a higher low structure above the key EMAs.
Looking at the technical structure, the price is holding well above the EMA20 at 0.03069 and the EMA50 at 0.02520, keeping the broader bullish trend intact.
Momentum indicators show the MACD at 0.00464 trading above its signal line at 0.00375, reflecting ongoing underlying strength. Meanwhile, the RSI sits at 64.06, showing strong bullish momentum without extreme overextension.
Watch for a potential push toward the major resistance level at 0.05144 if buyers step back in. On the downside, crucial support rests near 0.02038, which serves as the primary invalidation level for this setup.
Manage your risk carefully as markets remain unpredictable.
Are you positioning ahead of this resistance test or waiting for confirmation?
#BMT #CryptoTrading #TechnicalAnalysis
Follow me for more updates 🔔
131
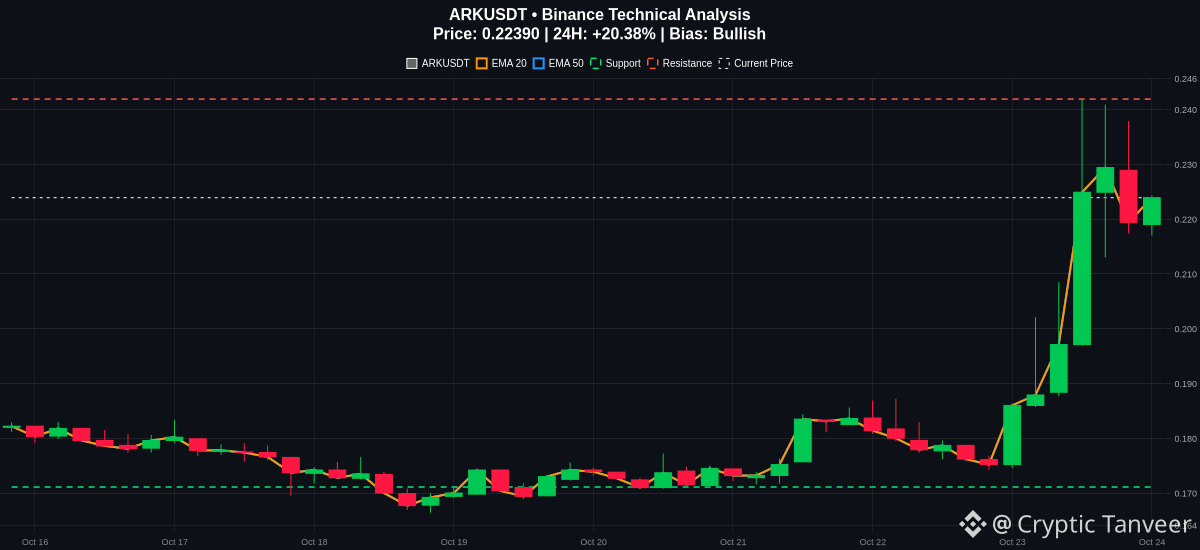
Is $ARKUSDT about to make a major move through the barrier? 🚀
ARK is currently trading at 0.2239, showing a strong 20.37% gain over the last 24 hours. The price is now pressing directly against a key resistance level at 0.2419, and the chart structure is looking quite interesting.
The technical setup shows a solid bullish trend. Price is holding comfortably above both the EMA20 at 0.1949 and the EMA50 at 0.1881, while the MACD line at 0.0113 remains well above the signal line at 0.0061, pointing to active upside momentum.
Meanwhile, the RSI sits at 74.88. While this reflects elevated and overbought conditions, it is not an automatic sell signal in a strong trend, though it does suggest keeping an eye out for potential pullback risks if the price gets too far extended from the moving averages.
If momentum cools off, immediate support rests at 0.1711, which serves as a logical invalidation level for this setup. Watch how price reacts around the 0.2419 resistance before making any moves.
Are you expecting a clean break above resistance or a rejection here? Let me know your plan below.
#ARK #CryptoTrading #TechnicalAnalysis
Follow me for more updates 📈
Is $ARKUSDT about to make a major move through the barrier? 🚀
ARK is currently trading at 0.2239, showing a strong 20.37% gain over the last 24 hours. The price is now pressing directly against a key resistance level at 0.2419, and the chart structure is looking quite interesting.
The technical setup shows a solid bullish trend. Price is holding comfortably above both the EMA20 at 0.1949 and the EMA50 at 0.1881, while the MACD line at 0.0113 remains well above the signal line at 0.0061, pointing to active upside momentum.
Meanwhile, the RSI sits at 74.88. While this reflects elevated and overbought conditions, it is not an automatic sell signal in a strong trend, though it does suggest keeping an eye out for potential pullback risks if the price gets too far extended from the moving averages.
If momentum cools off, immediate support rests at 0.1711, which serves as a logical invalidation level for this setup. Watch how price reacts around the 0.2419 resistance before making any moves.
Are you expecting a clean break above resistance or a rejection here? Let me know your plan below.
#ARK #CryptoTrading #TechnicalAnalysis
Follow me for more updates 📈
ARK is currently trading at 0.2239, showing a strong 20.37% gain over the last 24 hours. The price is now pressing directly against a key resistance level at 0.2419, and the chart structure is looking quite interesting.
The technical setup shows a solid bullish trend. Price is holding comfortably above both the EMA20 at 0.1949 and the EMA50 at 0.1881, while the MACD line at 0.0113 remains well above the signal line at 0.0061, pointing to active upside momentum.
Meanwhile, the RSI sits at 74.88. While this reflects elevated and overbought conditions, it is not an automatic sell signal in a strong trend, though it does suggest keeping an eye out for potential pullback risks if the price gets too far extended from the moving averages.
If momentum cools off, immediate support rests at 0.1711, which serves as a logical invalidation level for this setup. Watch how price reacts around the 0.2419 resistance before making any moves.
Are you expecting a clean break above resistance or a rejection here? Let me know your plan below.
#ARK #CryptoTrading #TechnicalAnalysis
Follow me for more updates 📈
113
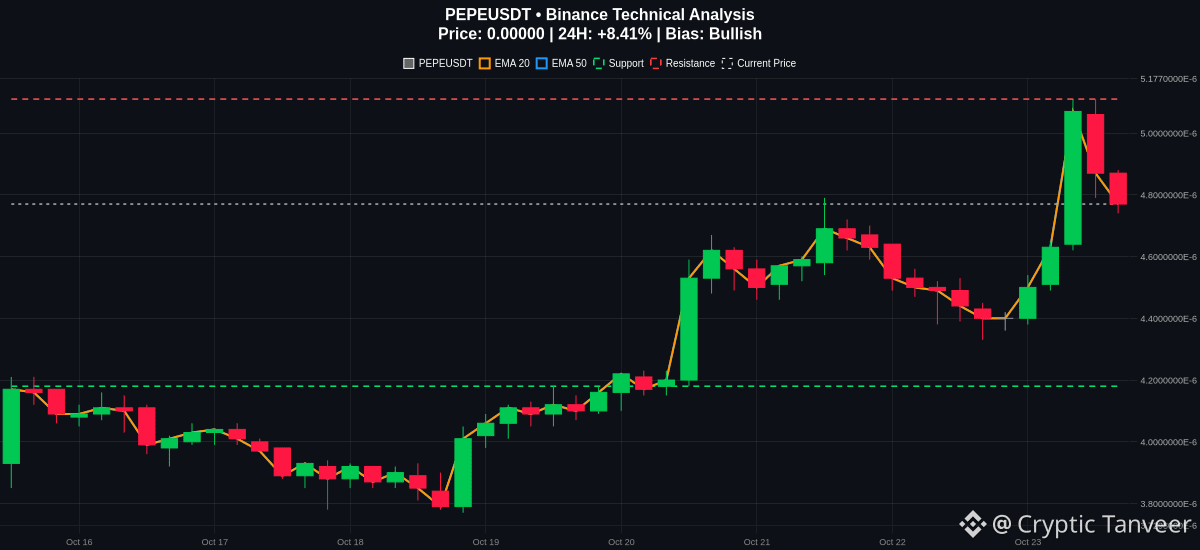
Is $PEPE quietly setting up for something big right now? 👀
Price is currently trading at 0.00000477, up 8.40% over the last 24 hours, and it is steadily pushing toward a crucial structural barrier.
Here is what the technical setup looks like. The overall trend structure remains bullish with the price holding comfortably above both the EMA20 at 0.00000456 and the EMA50 at 0.00000435. Momentum is also supporting the buyers as the MACD line sits above the signal line, while the RSI reads a healthy 60.78, showing strength without being dangerously overheated.
Key levels to watch:
Resistance: 0.00000511
Support: 0.00000418
If the price manages to break and sustain above the 0.00000511 resistance level, it could open the door for further upside continuation. However, always manage your risk. A drop back below the 0.00000418 support level would invalidate this setup and suggest a shift in market structure.
Trading involves risk and nothing is guaranteed in these markets.
Are you expecting a clean breakout here or a rejection at resistance? Let me know your plan below.
#PEPE #CryptoTrading #TechnicalAnalysis
Follow me for more update 📈
Is $PEPE quietly setting up for something big right now? 👀
Price is currently trading at 0.00000477, up 8.40% over the last 24 hours, and it is steadily pushing toward a crucial structural barrier.
Here is what the technical setup looks like. The overall trend structure remains bullish with the price holding comfortably above both the EMA20 at 0.00000456 and the EMA50 at 0.00000435. Momentum is also supporting the buyers as the MACD line sits above the signal line, while the RSI reads a healthy 60.78, showing strength without being dangerously overheated.
Key levels to watch:
Resistance: 0.00000511
Support: 0.00000418
If the price manages to break and sustain above the 0.00000511 resistance level, it could open the door for further upside continuation. However, always manage your risk. A drop back below the 0.00000418 support level would invalidate this setup and suggest a shift in market structure.
Trading involves risk and nothing is guaranteed in these markets.
Are you expecting a clean breakout here or a rejection at resistance? Let me know your plan below.
#PEPE #CryptoTrading #TechnicalAnalysis
Follow me for more update 📈
Price is currently trading at 0.00000477, up 8.40% over the last 24 hours, and it is steadily pushing toward a crucial structural barrier.
Here is what the technical setup looks like. The overall trend structure remains bullish with the price holding comfortably above both the EMA20 at 0.00000456 and the EMA50 at 0.00000435. Momentum is also supporting the buyers as the MACD line sits above the signal line, while the RSI reads a healthy 60.78, showing strength without being dangerously overheated.
Key levels to watch:
Resistance: 0.00000511
Support: 0.00000418
If the price manages to break and sustain above the 0.00000511 resistance level, it could open the door for further upside continuation. However, always manage your risk. A drop back below the 0.00000418 support level would invalidate this setup and suggest a shift in market structure.
Trading involves risk and nothing is guaranteed in these markets.
Are you expecting a clean breakout here or a rejection at resistance? Let me know your plan below.
#PEPE #CryptoTrading #TechnicalAnalysis
Follow me for more update 📈
1
171
Disputed
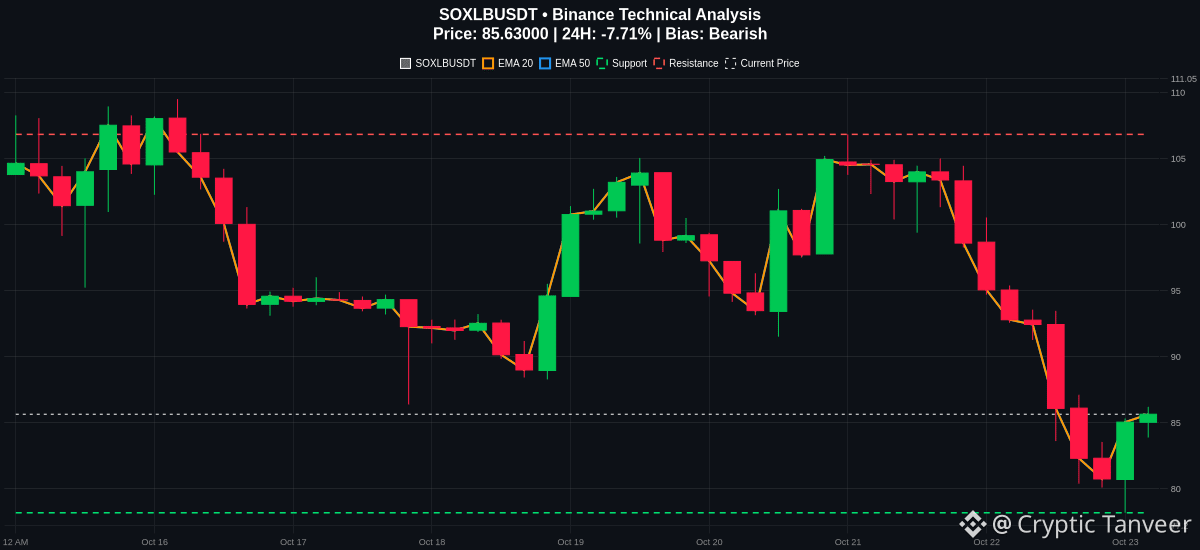
$SOXL breaking below its key moving averages signals a strong shift in short-term market structure as price trades down 7.70% to 85.63.
The current technical setup shows clear downward pressure. Price sits well below both the EMA20 at 92.92 and the EMA50 at 101.40, reflecting an active bearish trend across intermediate timeframes.
Momentum indicators align with this structure. The MACD line at -4.34 is trading below its signal line at -2.79, confirming ongoing negative momentum without immediate signs of a bullish crossover.
Meanwhile, the RSI rests at 36.31. While this approaches oversold territory, it indicates sustained selling pressure rather than an automatic reversal signal.
Key levels to watch include immediate support at 78.17, while resistance stands near 106.81. A failure to hold the support zone could invite further downside risk, whereas reclaiming the EMA20 is necessary to stabilize the structure.
Manage your risk accordingly as market conditions evolve. How are you positioning around these support levels?
#SOXL #CryptoAnalysis #TradingSetup
Follow me for more update 📈
$SOXL breaking below its key moving averages signals a strong shift in short-term market structure as price trades down 7.70% to 85.63.
The current technical setup shows clear downward pressure. Price sits well below both the EMA20 at 92.92 and the EMA50 at 101.40, reflecting an active bearish trend across intermediate timeframes.
Momentum indicators align with this structure. The MACD line at -4.34 is trading below its signal line at -2.79, confirming ongoing negative momentum without immediate signs of a bullish crossover.
Meanwhile, the RSI rests at 36.31. While this approaches oversold territory, it indicates sustained selling pressure rather than an automatic reversal signal.
Key levels to watch include immediate support at 78.17, while resistance stands near 106.81. A failure to hold the support zone could invite further downside risk, whereas reclaiming the EMA20 is necessary to stabilize the structure.
Manage your risk accordingly as market conditions evolve. How are you positioning around these support levels?
#SOXL #CryptoAnalysis #TradingSetup
Follow me for more update 📈
The current technical setup shows clear downward pressure. Price sits well below both the EMA20 at 92.92 and the EMA50 at 101.40, reflecting an active bearish trend across intermediate timeframes.
Momentum indicators align with this structure. The MACD line at -4.34 is trading below its signal line at -2.79, confirming ongoing negative momentum without immediate signs of a bullish crossover.
Meanwhile, the RSI rests at 36.31. While this approaches oversold territory, it indicates sustained selling pressure rather than an automatic reversal signal.
Key levels to watch include immediate support at 78.17, while resistance stands near 106.81. A failure to hold the support zone could invite further downside risk, whereas reclaiming the EMA20 is necessary to stabilize the structure.
Manage your risk accordingly as market conditions evolve. How are you positioning around these support levels?
#SOXL #CryptoAnalysis #TradingSetup
Follow me for more update 📈
624
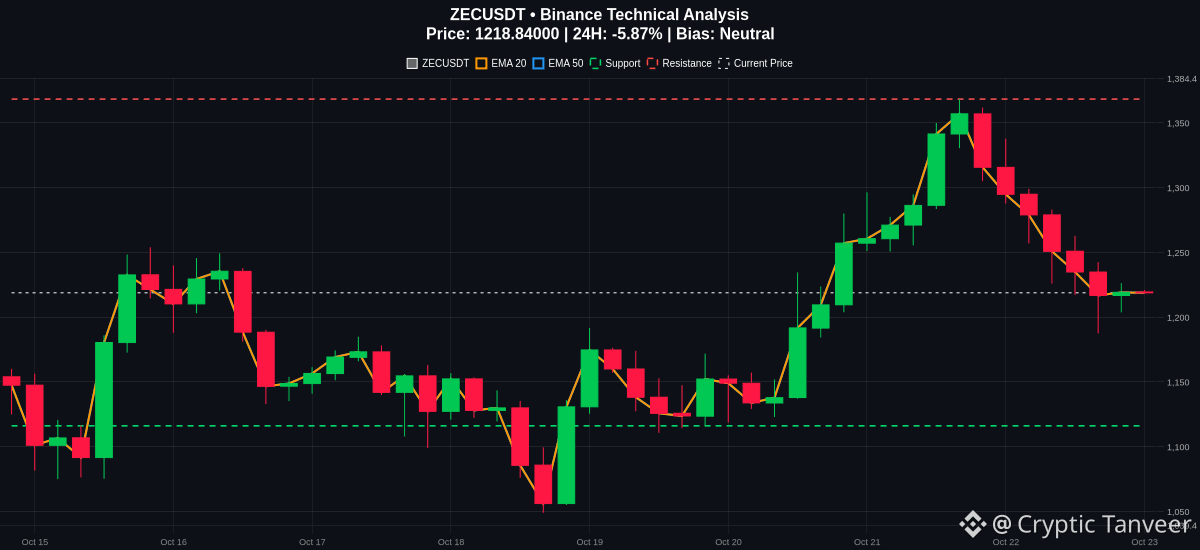
$ZEC tests a crucial inflection point as price trades right between the short-term moving averages. 📉
Current structure shows $ZEC at 1218.84, down 5.87% over the past 24 hours. The market is showing a neutral technical setup with a score of 48, balancing near-term consolidation with shifting momentum.
On the indicator front, the RSI sits at a neutral 48.61, indicating a lack of strong directional bias right now. Meanwhile, the MACD line at 17.01 is currently printing below the signal line at 26.18, suggesting fading short-term bullish momentum that warrants caution.
Key levels to watch:
Resistance sits higher up at 1368.40.
Support is located down at 1116.13.
Price is currently hovering right around the EMA20 at 1234.76 and just above the EMA50 at 1214.16. A sustained break below the EMA50 could signal increased downside pressure toward support, while reclaiming the EMA20 may attract fresh buyers. Always manage your risk accordingly.
Are you expecting ZEC to hold the EMA50 support, or do you think a deeper retest is coming? 📊
#ZEC #CryptoTrading #TechnicalAnalysis
Follow me for more update 🔔
$ZEC tests a crucial inflection point as price trades right between the short-term moving averages. 📉
Current structure shows $ZEC at 1218.84, down 5.87% over the past 24 hours. The market is showing a neutral technical setup with a score of 48, balancing near-term consolidation with shifting momentum.
On the indicator front, the RSI sits at a neutral 48.61, indicating a lack of strong directional bias right now. Meanwhile, the MACD line at 17.01 is currently printing below the signal line at 26.18, suggesting fading short-term bullish momentum that warrants caution.
Key levels to watch:
Resistance sits higher up at 1368.40.
Support is located down at 1116.13.
Price is currently hovering right around the EMA20 at 1234.76 and just above the EMA50 at 1214.16. A sustained break below the EMA50 could signal increased downside pressure toward support, while reclaiming the EMA20 may attract fresh buyers. Always manage your risk accordingly.
Are you expecting ZEC to hold the EMA50 support, or do you think a deeper retest is coming? 📊
#ZEC #CryptoTrading #TechnicalAnalysis
Follow me for more update 🔔
Current structure shows $ZEC at 1218.84, down 5.87% over the past 24 hours. The market is showing a neutral technical setup with a score of 48, balancing near-term consolidation with shifting momentum.
On the indicator front, the RSI sits at a neutral 48.61, indicating a lack of strong directional bias right now. Meanwhile, the MACD line at 17.01 is currently printing below the signal line at 26.18, suggesting fading short-term bullish momentum that warrants caution.
Key levels to watch:
Resistance sits higher up at 1368.40.
Support is located down at 1116.13.
Price is currently hovering right around the EMA20 at 1234.76 and just above the EMA50 at 1214.16. A sustained break below the EMA50 could signal increased downside pressure toward support, while reclaiming the EMA20 may attract fresh buyers. Always manage your risk accordingly.
Are you expecting ZEC to hold the EMA50 support, or do you think a deeper retest is coming? 📊
#ZEC #CryptoTrading #TechnicalAnalysis
Follow me for more update 🔔
268
Strong upward momentum often persists when multiple technical indicators align to reinforce the dominant direction. $NEAR
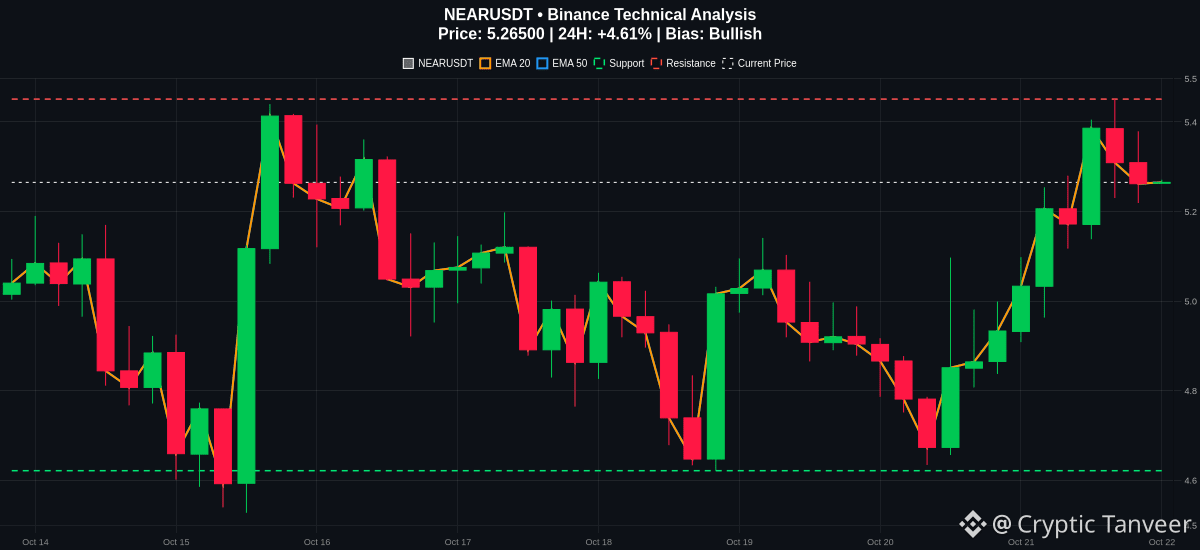
Taking a closer look at the NEARUSDT chart, the price is currently holding at 5.265 with a solid 24 hour gain of 4.61%. The structure shows clean trend continuation support.
The EMA20 at 5.077 sits comfortably above the EMA50 at 5.046, maintaining a classic bullish alignment. Meanwhile, the MACD line at 0.076 is tracking well above the signal line at 0.025, confirming that buying momentum remains active without showing signs of immediate exhaustion.
With an RSI reading of 58.81, the market has plenty of room to move before hitting elevated or overbought conditions.
Immediate resistance is mapped near 5.451, while support is established down at 4.621. As long as price action respects the key EMA structure, the current trend could have room to develop further. Traders should always monitor risk closely, keeping an invalidation level in mind if the price breaks below local support.
Are you looking to trade this continuation or waiting for a deeper pullback first? Drop your thoughts below.
#NEAR #CryptoTrading #TechnicalAnalysis
Follow me for more update 📊
Strong upward momentum often persists when multiple technical indicators align to reinforce the dominant direction. $NEAR
Taking a closer look at the NEARUSDT chart, the price is currently holding at 5.265 with a solid 24 hour gain of 4.61%. The structure shows clean trend continuation support.
The EMA20 at 5.077 sits comfortably above the EMA50 at 5.046, maintaining a classic bullish alignment. Meanwhile, the MACD line at 0.076 is tracking well above the signal line at 0.025, confirming that buying momentum remains active without showing signs of immediate exhaustion.
With an RSI reading of 58.81, the market has plenty of room to move before hitting elevated or overbought conditions.
Immediate resistance is mapped near 5.451, while support is established down at 4.621. As long as price action respects the key EMA structure, the current trend could have room to develop further. Traders should always monitor risk closely, keeping an invalidation level in mind if the price breaks below local support.
Are you looking to trade this continuation or waiting for a deeper pullback first? Drop your thoughts below.
#NEAR #CryptoTrading #TechnicalAnalysis
Follow me for more update 📊
Taking a closer look at the NEARUSDT chart, the price is currently holding at 5.265 with a solid 24 hour gain of 4.61%. The structure shows clean trend continuation support.
The EMA20 at 5.077 sits comfortably above the EMA50 at 5.046, maintaining a classic bullish alignment. Meanwhile, the MACD line at 0.076 is tracking well above the signal line at 0.025, confirming that buying momentum remains active without showing signs of immediate exhaustion.
With an RSI reading of 58.81, the market has plenty of room to move before hitting elevated or overbought conditions.
Immediate resistance is mapped near 5.451, while support is established down at 4.621. As long as price action respects the key EMA structure, the current trend could have room to develop further. Traders should always monitor risk closely, keeping an invalidation level in mind if the price breaks below local support.
Are you looking to trade this continuation or waiting for a deeper pullback first? Drop your thoughts below.
#NEAR #CryptoTrading #TechnicalAnalysis
Follow me for more update 📊
142
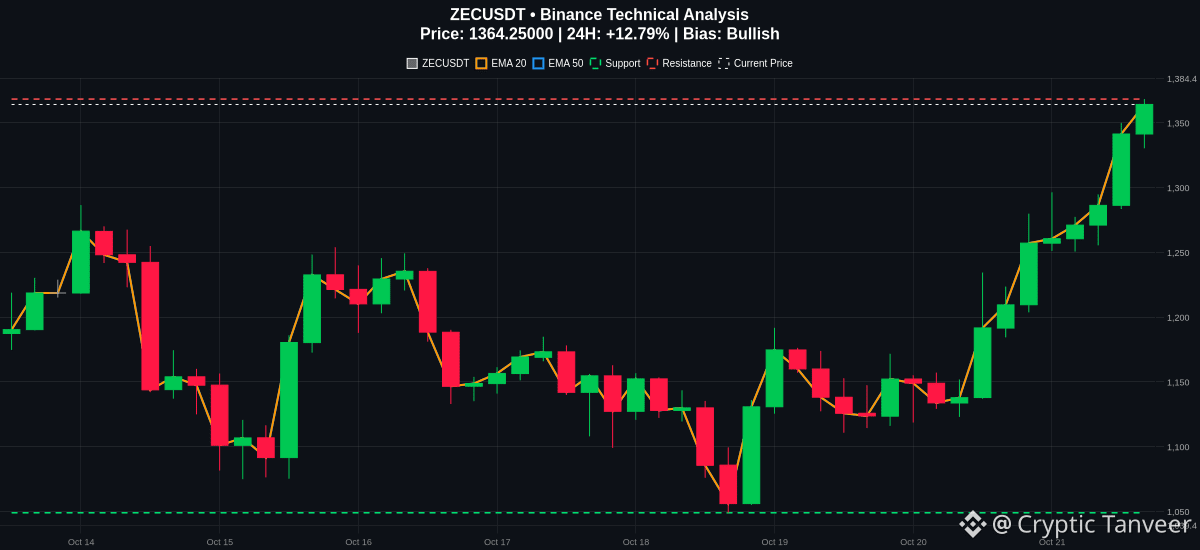
When a chart prints a 12.79 percent daily surge alongside a clean EMA stack, ZECUSDT deserves a spot on your radar. 🚀
Let us break down the technical setup behind the current price of 1364.25.
The trend is currently supported by a clearly bullish EMA structure. The EMA20 at 1221.40 sits comfortably above the EMA50 at 1201.51, confirming ongoing trend strength. Meanwhile, the MACD line at 42.38 is trading well above the signal line at 18.66, reflecting strong underlying buying momentum.
Price is currently testing immediate resistance near 1368.4. While momentum remains robust, the RSI is currently reading at 74.75. This indicates elevated or overbought conditions rather than an automatic sell signal, though it does suggest keeping an eye out for potential short-term consolidation or pullback risk due to the distance from the EMA20.
On the downside, key support sits at 1049.01. A drop below this level would invalidate the current bullish momentum structure. Manage your risk carefully as markets remain unpredictable.
Are you looking for a breakout above 1368.4 or waiting for a retest of the moving averages? Let me know your plan below. 👇
#ZEC #CryptoTrading #TechnicalAnalysis
Follow me for more update 📈
When a chart prints a 12.79 percent daily surge alongside a clean EMA stack, ZECUSDT deserves a spot on your radar. 🚀
Let us break down the technical setup behind the current price of 1364.25.
The trend is currently supported by a clearly bullish EMA structure. The EMA20 at 1221.40 sits comfortably above the EMA50 at 1201.51, confirming ongoing trend strength. Meanwhile, the MACD line at 42.38 is trading well above the signal line at 18.66, reflecting strong underlying buying momentum.
Price is currently testing immediate resistance near 1368.4. While momentum remains robust, the RSI is currently reading at 74.75. This indicates elevated or overbought conditions rather than an automatic sell signal, though it does suggest keeping an eye out for potential short-term consolidation or pullback risk due to the distance from the EMA20.
On the downside, key support sits at 1049.01. A drop below this level would invalidate the current bullish momentum structure. Manage your risk carefully as markets remain unpredictable.
Are you looking for a breakout above 1368.4 or waiting for a retest of the moving averages? Let me know your plan below. 👇
#ZEC #CryptoTrading #TechnicalAnalysis
Follow me for more update 📈
Let us break down the technical setup behind the current price of 1364.25.
The trend is currently supported by a clearly bullish EMA structure. The EMA20 at 1221.40 sits comfortably above the EMA50 at 1201.51, confirming ongoing trend strength. Meanwhile, the MACD line at 42.38 is trading well above the signal line at 18.66, reflecting strong underlying buying momentum.
Price is currently testing immediate resistance near 1368.4. While momentum remains robust, the RSI is currently reading at 74.75. This indicates elevated or overbought conditions rather than an automatic sell signal, though it does suggest keeping an eye out for potential short-term consolidation or pullback risk due to the distance from the EMA20.
On the downside, key support sits at 1049.01. A drop below this level would invalidate the current bullish momentum structure. Manage your risk carefully as markets remain unpredictable.
Are you looking for a breakout above 1368.4 or waiting for a retest of the moving averages? Let me know your plan below. 👇
#ZEC #CryptoTrading #TechnicalAnalysis
Follow me for more update 📈
37
When momentum accelerates this sharply, ignoring the charts is an expensive mistake. 🚀
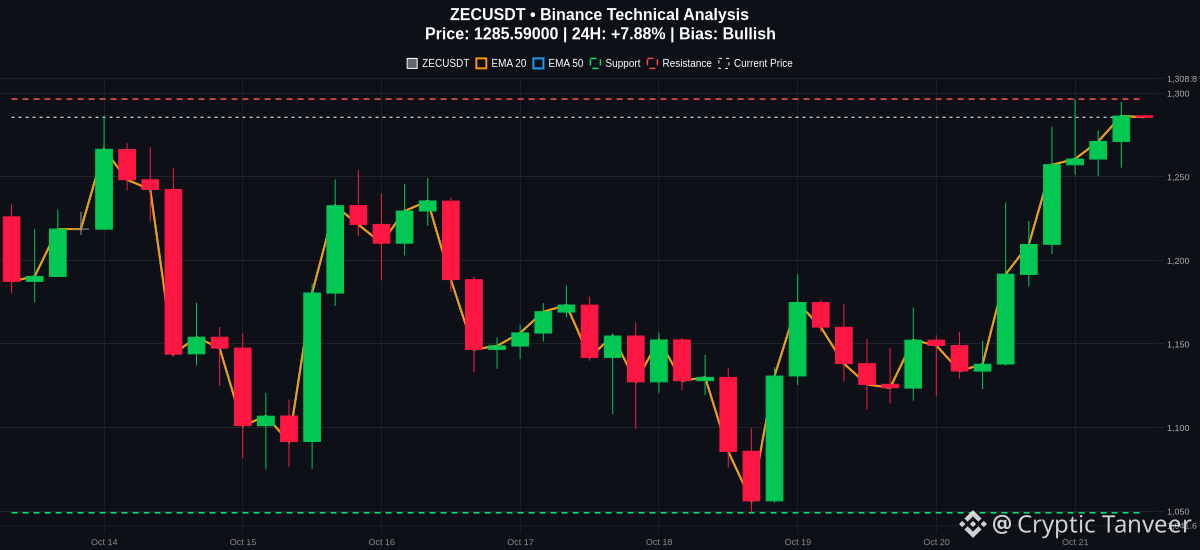
ZECUSDT is currently trading at 1285.59, posting a solid 7.87% gain over the past 24 hours. This push is closely backed by a distinctly bullish EMA structure, with the EMA20 at 1201.04 sitting comfortably above the EMA50 at 1192.63.
The technical setup shows strong ongoing participation. MACD is printing at 29.92 above its signal line at 11.84, confirming expanding upside momentum. Meanwhile, the RSI sits at 67.51, reflecting strong buying pressure without entering extreme overbought extremes just yet.
Immediate overhead resistance stands at 1296.45, a key level to watch for potential consolidation or a breakout attempt. On the downside, support is established at 1049.01, which serves as a crucial reference for trend health.
While the current trend favors the bulls, strong extension away from the EMA20 introduces potential pullback risk if momentum cools. A drop below the key support area would invalidate the immediate bullish setup. Manage your risk accordingly and trade what you see, not what you hope for. 📉📈
Are you looking for a clean breakout above 1296.45, or waiting for a retest closer to the moving averages?
#ZEC #CryptoTrading #TechnicalAnalysis
Follow me for more update 🔔
When momentum accelerates this sharply, ignoring the charts is an expensive mistake. 🚀
ZECUSDT is currently trading at 1285.59, posting a solid 7.87% gain over the past 24 hours. This push is closely backed by a distinctly bullish EMA structure, with the EMA20 at 1201.04 sitting comfortably above the EMA50 at 1192.63.
The technical setup shows strong ongoing participation. MACD is printing at 29.92 above its signal line at 11.84, confirming expanding upside momentum. Meanwhile, the RSI sits at 67.51, reflecting strong buying pressure without entering extreme overbought extremes just yet.
Immediate overhead resistance stands at 1296.45, a key level to watch for potential consolidation or a breakout attempt. On the downside, support is established at 1049.01, which serves as a crucial reference for trend health.
While the current trend favors the bulls, strong extension away from the EMA20 introduces potential pullback risk if momentum cools. A drop below the key support area would invalidate the immediate bullish setup. Manage your risk accordingly and trade what you see, not what you hope for. 📉📈
Are you looking for a clean breakout above 1296.45, or waiting for a retest closer to the moving averages?
#ZEC #CryptoTrading #TechnicalAnalysis
Follow me for more update 🔔
ZECUSDT is currently trading at 1285.59, posting a solid 7.87% gain over the past 24 hours. This push is closely backed by a distinctly bullish EMA structure, with the EMA20 at 1201.04 sitting comfortably above the EMA50 at 1192.63.
The technical setup shows strong ongoing participation. MACD is printing at 29.92 above its signal line at 11.84, confirming expanding upside momentum. Meanwhile, the RSI sits at 67.51, reflecting strong buying pressure without entering extreme overbought extremes just yet.
Immediate overhead resistance stands at 1296.45, a key level to watch for potential consolidation or a breakout attempt. On the downside, support is established at 1049.01, which serves as a crucial reference for trend health.
While the current trend favors the bulls, strong extension away from the EMA20 introduces potential pullback risk if momentum cools. A drop below the key support area would invalidate the immediate bullish setup. Manage your risk accordingly and trade what you see, not what you hope for. 📉📈
Are you looking for a clean breakout above 1296.45, or waiting for a retest closer to the moving averages?
#ZEC #CryptoTrading #TechnicalAnalysis
Follow me for more update 🔔
151
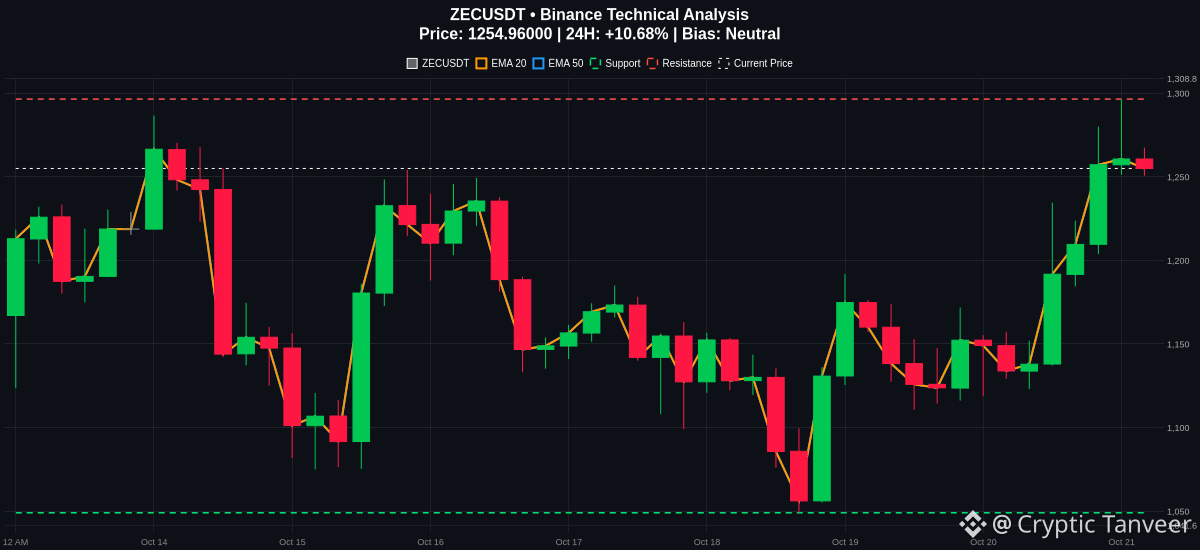
$ZEC is holding strong above its key moving averages with a 10.68% gain, trading near 1254.96.
Let's look at the current market structure. The technical score sits at 84, driven by positive momentum across the board. The price is currently well above both the EMA20 at 1180.69 and the EMA50 at 1184.34, showing a clear short-term upward trend.
On the momentum side, the RSI prints at 63.64. This indicates healthy buying pressure without entering extreme overbought territory yet. Meanwhile, the MACD line at 19.25 is trading above the signal line at 2.41, confirming that bullish momentum remains active for now.
Immediate resistance stands at 1296.45. If the current trend continues, price could test this boundary. On the downside, important support is located around 1049.01. A drop below the EMA lines and this support zone would invalidate the current bullish setup.
Always manage your risk carefully as market conditions can shift quickly.
Are you looking for a breakout above resistance or waiting for a pullback to support first?
#ZEC #CryptoAnalysis #TradingSetup
Follow me for more update 📈
$ZEC is holding strong above its key moving averages with a 10.68% gain, trading near 1254.96.
Let's look at the current market structure. The technical score sits at 84, driven by positive momentum across the board. The price is currently well above both the EMA20 at 1180.69 and the EMA50 at 1184.34, showing a clear short-term upward trend.
On the momentum side, the RSI prints at 63.64. This indicates healthy buying pressure without entering extreme overbought territory yet. Meanwhile, the MACD line at 19.25 is trading above the signal line at 2.41, confirming that bullish momentum remains active for now.
Immediate resistance stands at 1296.45. If the current trend continues, price could test this boundary. On the downside, important support is located around 1049.01. A drop below the EMA lines and this support zone would invalidate the current bullish setup.
Always manage your risk carefully as market conditions can shift quickly.
Are you looking for a breakout above resistance or waiting for a pullback to support first?
#ZEC #CryptoAnalysis #TradingSetup
Follow me for more update 📈
Let's look at the current market structure. The technical score sits at 84, driven by positive momentum across the board. The price is currently well above both the EMA20 at 1180.69 and the EMA50 at 1184.34, showing a clear short-term upward trend.
On the momentum side, the RSI prints at 63.64. This indicates healthy buying pressure without entering extreme overbought territory yet. Meanwhile, the MACD line at 19.25 is trading above the signal line at 2.41, confirming that bullish momentum remains active for now.
Immediate resistance stands at 1296.45. If the current trend continues, price could test this boundary. On the downside, important support is located around 1049.01. A drop below the EMA lines and this support zone would invalidate the current bullish setup.
Always manage your risk carefully as market conditions can shift quickly.
Are you looking for a breakout above resistance or waiting for a pullback to support first?
#ZEC #CryptoAnalysis #TradingSetup
Follow me for more update 📈
55
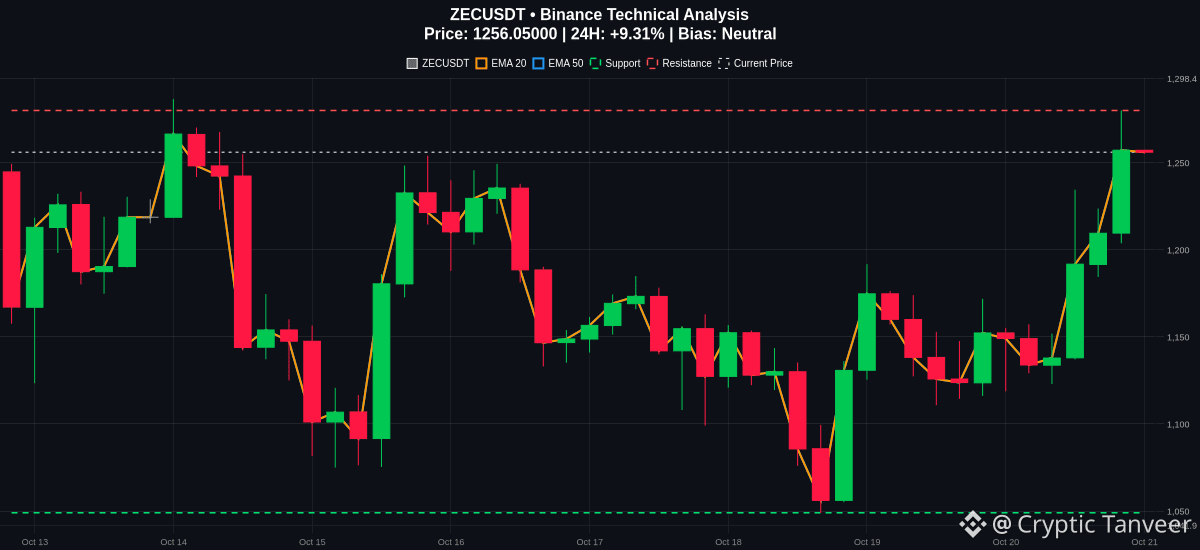
$ZEC is holding strong above its short-term moving averages with a solid 9.31% daily gain, currently trading at 1256.05. 📈
Taking a look at the current market structure, price action remains supported by the EMA20 at 1172.44 and EMA50 at 1181.12. With the MACD showing positive momentum at 14.47 above its signal line, buyers are maintaining control of the trend.
However, the RSI is sitting at 64.23, approaching elevated territory. While this reflects strong buying pressure, we want to watch for potential consolidation before any continuation toward the key overhead resistance at 1280.
On the downside, initial support rests at 1049.01. A drop below this level would invalidate the current bullish setup and suggest a deeper retracement. Remember, market conditions can shift quickly, so manage your risk accordingly.
Are you looking for a breakout above resistance or waiting for a dip to support? 👇
#ZEC #CryptoTrading #TechnicalAnalysis
Follow me for more update 🔔
$ZEC is holding strong above its short-term moving averages with a solid 9.31% daily gain, currently trading at 1256.05. 📈
Taking a look at the current market structure, price action remains supported by the EMA20 at 1172.44 and EMA50 at 1181.12. With the MACD showing positive momentum at 14.47 above its signal line, buyers are maintaining control of the trend.
However, the RSI is sitting at 64.23, approaching elevated territory. While this reflects strong buying pressure, we want to watch for potential consolidation before any continuation toward the key overhead resistance at 1280.
On the downside, initial support rests at 1049.01. A drop below this level would invalidate the current bullish setup and suggest a deeper retracement. Remember, market conditions can shift quickly, so manage your risk accordingly.
Are you looking for a breakout above resistance or waiting for a dip to support? 👇
#ZEC #CryptoTrading #TechnicalAnalysis
Follow me for more update 🔔
Taking a look at the current market structure, price action remains supported by the EMA20 at 1172.44 and EMA50 at 1181.12. With the MACD showing positive momentum at 14.47 above its signal line, buyers are maintaining control of the trend.
However, the RSI is sitting at 64.23, approaching elevated territory. While this reflects strong buying pressure, we want to watch for potential consolidation before any continuation toward the key overhead resistance at 1280.
On the downside, initial support rests at 1049.01. A drop below this level would invalidate the current bullish setup and suggest a deeper retracement. Remember, market conditions can shift quickly, so manage your risk accordingly.
Are you looking for a breakout above resistance or waiting for a dip to support? 👇
#ZEC #CryptoTrading #TechnicalAnalysis
Follow me for more update 🔔
363
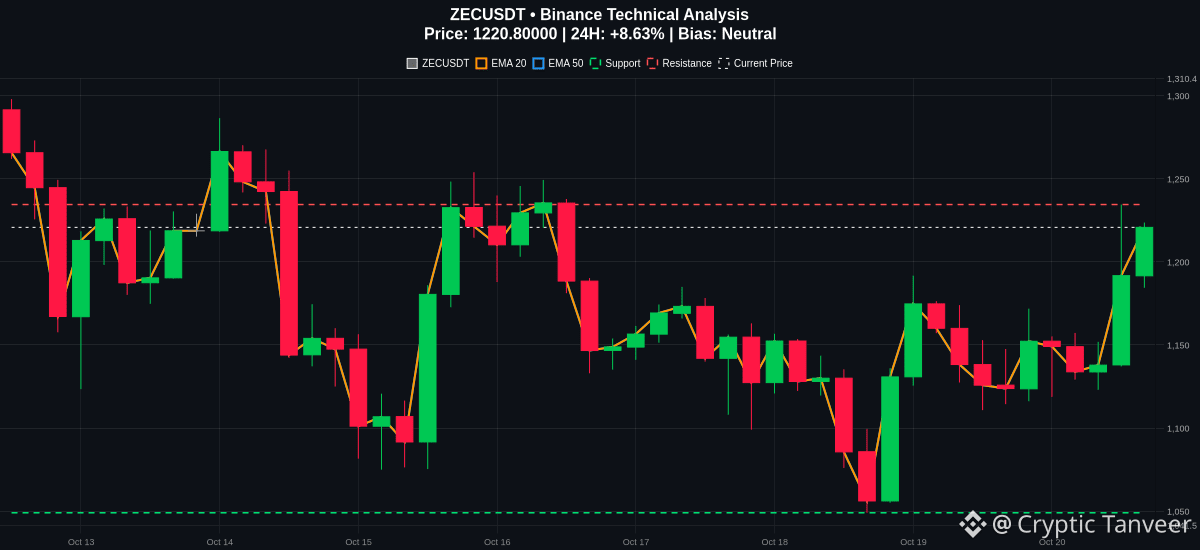
MACD bullish crossover on $ZECUSDT signals shifting momentum as price trades at 1220.8, up 8.63% over the past 24 hours. 📈
Looking at the current market structure, price is holding firmly above both the EMA20 at 1154.86 and the EMA50 at 1175.47. This positioning shows active short-term strength.
The MACD line has crossed above the signal line at 1.31 versus -9.25, confirming expanding upside momentum. Meanwhile, the RSI sits at a healthy 60.20. This indicates strong buyer interest without signaling extreme overextension just yet.
Key levels to monitor include immediate resistance around 1234.52, where price could face selling pressure. On the downside, support is established near 1049.01.
If momentum holds and buyers push past resistance, further upside could unfold. However, a failure to break higher might lead to a retest of the moving averages. Risk management remains essential at these levels.
Are you looking to long the breakout or waiting for a dip near the support level? 👇
#ZEC #CryptoTrading #TechnicalAnalysis
Follow me for more update 🔔
MACD bullish crossover on $ZECUSDT signals shifting momentum as price trades at 1220.8, up 8.63% over the past 24 hours. 📈
Looking at the current market structure, price is holding firmly above both the EMA20 at 1154.86 and the EMA50 at 1175.47. This positioning shows active short-term strength.
The MACD line has crossed above the signal line at 1.31 versus -9.25, confirming expanding upside momentum. Meanwhile, the RSI sits at a healthy 60.20. This indicates strong buyer interest without signaling extreme overextension just yet.
Key levels to monitor include immediate resistance around 1234.52, where price could face selling pressure. On the downside, support is established near 1049.01.
If momentum holds and buyers push past resistance, further upside could unfold. However, a failure to break higher might lead to a retest of the moving averages. Risk management remains essential at these levels.
Are you looking to long the breakout or waiting for a dip near the support level? 👇
#ZEC #CryptoTrading #TechnicalAnalysis
Follow me for more update 🔔
Looking at the current market structure, price is holding firmly above both the EMA20 at 1154.86 and the EMA50 at 1175.47. This positioning shows active short-term strength.
The MACD line has crossed above the signal line at 1.31 versus -9.25, confirming expanding upside momentum. Meanwhile, the RSI sits at a healthy 60.20. This indicates strong buyer interest without signaling extreme overextension just yet.
Key levels to monitor include immediate resistance around 1234.52, where price could face selling pressure. On the downside, support is established near 1049.01.
If momentum holds and buyers push past resistance, further upside could unfold. However, a failure to break higher might lead to a retest of the moving averages. Risk management remains essential at these levels.
Are you looking to long the breakout or waiting for a dip near the support level? 👇
#ZEC #CryptoTrading #TechnicalAnalysis
Follow me for more update 🔔
214
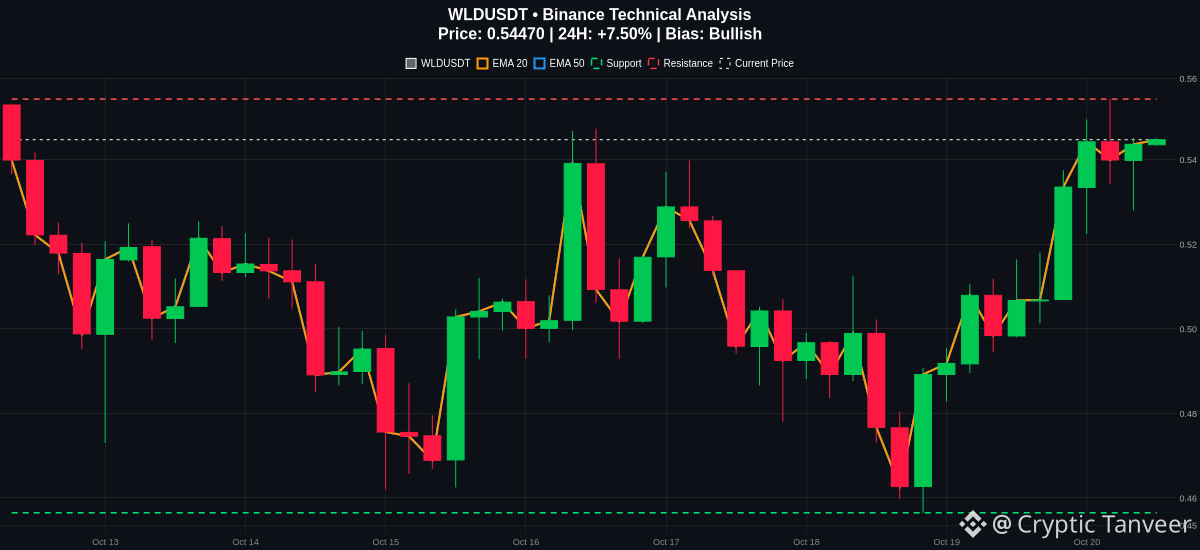
When price action commands this much attention, it is time to look closely at the underlying structure powering the move on $WLD .
Trading at 0.5447 with a solid 7.50 percent gain over the last 24 hours, WLDUSDT is showing real strength that deserves a spot on your radar.
The technical setup reveals a clear bullish EMA structure. Price is holding comfortably above both the EMA20 at 0.5160 and the EMA50 at 0.5139, confirming that buyers are maintaining short-term control.
Momentum indicators support this view. The MACD is positive at 0.0091 and sitting above its signal line at 0.0027, indicating steady upward pressure. Meanwhile, the RSI reads 61.68, reflecting healthy buying momentum without reaching extreme overbought territory just yet.
Looking at the map, immediate resistance waits overhead at 0.5543. If momentum slows or buyers take a breather, watch for potential pullbacks toward the support level down at 0.4565, which serves as a key invalidation zone for this bullish continuation setup.
Always manage your risk carefully as market conditions can shift quickly.
Are you looking for a breakout above resistance or waiting for a dip to support first?
#WLD #BinanceSquare #CryptoTrading
Follow me for more update 📈
When price action commands this much attention, it is time to look closely at the underlying structure powering the move on $WLD .
Trading at 0.5447 with a solid 7.50 percent gain over the last 24 hours, WLDUSDT is showing real strength that deserves a spot on your radar.
The technical setup reveals a clear bullish EMA structure. Price is holding comfortably above both the EMA20 at 0.5160 and the EMA50 at 0.5139, confirming that buyers are maintaining short-term control.
Momentum indicators support this view. The MACD is positive at 0.0091 and sitting above its signal line at 0.0027, indicating steady upward pressure. Meanwhile, the RSI reads 61.68, reflecting healthy buying momentum without reaching extreme overbought territory just yet.
Looking at the map, immediate resistance waits overhead at 0.5543. If momentum slows or buyers take a breather, watch for potential pullbacks toward the support level down at 0.4565, which serves as a key invalidation zone for this bullish continuation setup.
Always manage your risk carefully as market conditions can shift quickly.
Are you looking for a breakout above resistance or waiting for a dip to support first?
#WLD #BinanceSquare #CryptoTrading
Follow me for more update 📈
Trading at 0.5447 with a solid 7.50 percent gain over the last 24 hours, WLDUSDT is showing real strength that deserves a spot on your radar.
The technical setup reveals a clear bullish EMA structure. Price is holding comfortably above both the EMA20 at 0.5160 and the EMA50 at 0.5139, confirming that buyers are maintaining short-term control.
Momentum indicators support this view. The MACD is positive at 0.0091 and sitting above its signal line at 0.0027, indicating steady upward pressure. Meanwhile, the RSI reads 61.68, reflecting healthy buying momentum without reaching extreme overbought territory just yet.
Looking at the map, immediate resistance waits overhead at 0.5543. If momentum slows or buyers take a breather, watch for potential pullbacks toward the support level down at 0.4565, which serves as a key invalidation zone for this bullish continuation setup.
Always manage your risk carefully as market conditions can shift quickly.
Are you looking for a breakout above resistance or waiting for a dip to support first?
#WLD #BinanceSquare #CryptoTrading
Follow me for more update 📈
109
😂 Crypto investors have TWO personalities!
📈 $BTC +2%: “I'm a financial genius!” 🚀 📉 BTC -1%: “It's over. I'm selling everything!” 💀
Be honest… which version are you today? 😂👇
#BinanceSquare #CryptoMeme
#Bitcoin #CryptoCommunity #BTC
😂 Crypto investors have TWO personalities!
📈 $BTC +2%: “I'm a financial genius!” 🚀 📉 BTC -1%: “It's over. I'm selling everything!” 💀
Be honest… which version are you today? 😂👇
#BinanceSquare #CryptoMeme
#Bitcoin #CryptoCommunity #BTC
📈 $BTC +2%: “I'm a financial genius!” 🚀 📉 BTC -1%: “It's over. I'm selling everything!” 💀
Be honest… which version are you today? 😂👇
#BinanceSquare #CryptoMeme
#Bitcoin #CryptoCommunity #BTC

46
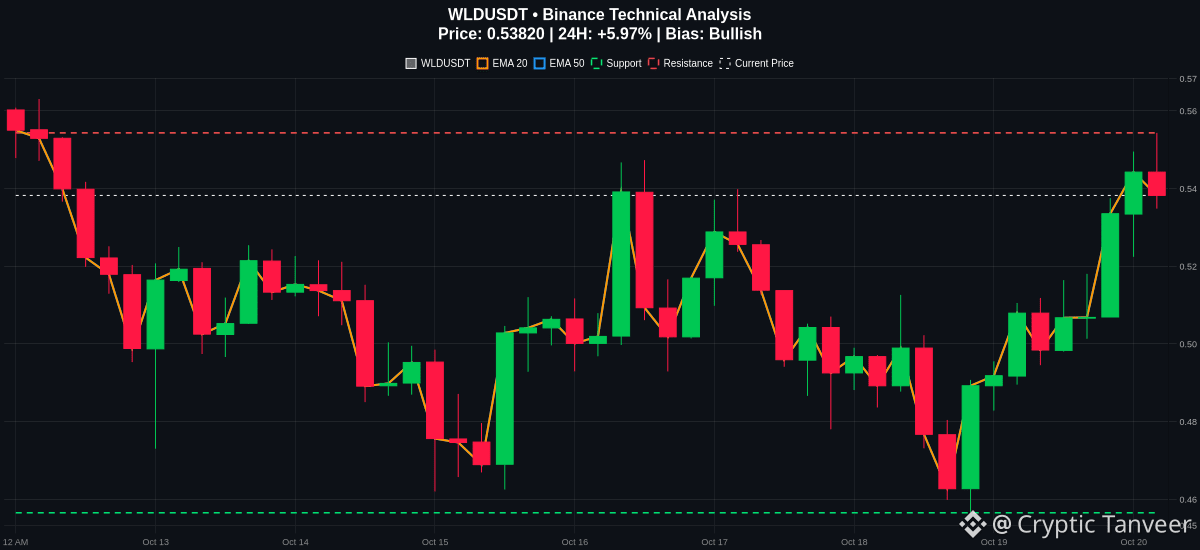
$WLD is printing a clear bullish crossover on the MACD alongside a strong 5.96 percent daily gain, pushing the price to 0.5382.
Let us break down the current market structure for WLDUSDT. The price is currently trading comfortably above both the EMA20 at 0.5096 and the EMA50 at 0.5117, confirming short term bullish momentum.
The RSI sits at 59.79, indicating healthy upward momentum without signaling extreme overbought conditions just yet. A technical score of 81 points to a solid setup, but we still need to watch key boundaries.
Immediate resistance stands at 0.5543. If buyers can clear this zone, further upside could unfold. On the downside, crucial support rests at 0.4565. A daily close below this support level would invalidate the current bullish structure.
Manage your risk carefully as market conditions can shift quickly.
Are you looking for a breakout above resistance or waiting for a retest of support first?
#WLD #CryptoAnalysis #TechnicalSetup
Follow me for more updates 📈
$WLD is printing a clear bullish crossover on the MACD alongside a strong 5.96 percent daily gain, pushing the price to 0.5382.
Let us break down the current market structure for WLDUSDT. The price is currently trading comfortably above both the EMA20 at 0.5096 and the EMA50 at 0.5117, confirming short term bullish momentum.
The RSI sits at 59.79, indicating healthy upward momentum without signaling extreme overbought conditions just yet. A technical score of 81 points to a solid setup, but we still need to watch key boundaries.
Immediate resistance stands at 0.5543. If buyers can clear this zone, further upside could unfold. On the downside, crucial support rests at 0.4565. A daily close below this support level would invalidate the current bullish structure.
Manage your risk carefully as market conditions can shift quickly.
Are you looking for a breakout above resistance or waiting for a retest of support first?
#WLD #CryptoAnalysis #TechnicalSetup
Follow me for more updates 📈
Let us break down the current market structure for WLDUSDT. The price is currently trading comfortably above both the EMA20 at 0.5096 and the EMA50 at 0.5117, confirming short term bullish momentum.
The RSI sits at 59.79, indicating healthy upward momentum without signaling extreme overbought conditions just yet. A technical score of 81 points to a solid setup, but we still need to watch key boundaries.
Immediate resistance stands at 0.5543. If buyers can clear this zone, further upside could unfold. On the downside, crucial support rests at 0.4565. A daily close below this support level would invalidate the current bullish structure.
Manage your risk carefully as market conditions can shift quickly.
Are you looking for a breakout above resistance or waiting for a retest of support first?
#WLD #CryptoAnalysis #TechnicalSetup
Follow me for more updates 📈
130
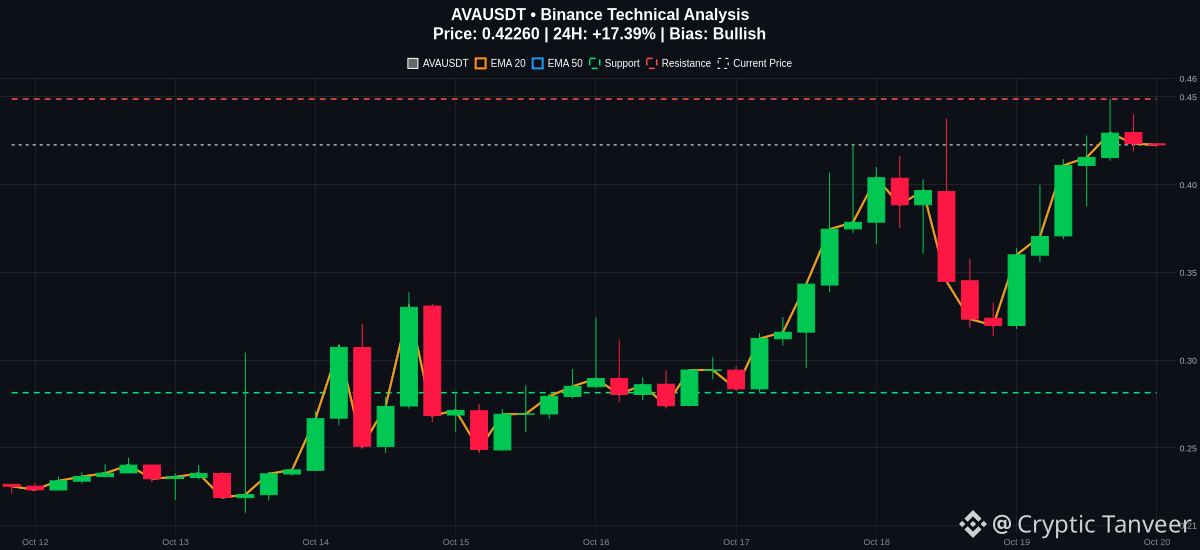
Is $AVA ready to shatter its ceiling, or is a rejection loading right here? 🚀
$AVA is making serious moves, currently trading at 0.4226 with a strong 24-hour gain of over 17%. The technical structure looks firmly bullish as price presses toward immediate overhead resistance at 0.4487.
Looking at the indicators, momentum remains in favor of the buyers. The MACD line at 0.0339 sits comfortably above the signal line at 0.0294, while price continues to hold well above both the EMA20 (0.3687) and EMA50 (0.3214). Meanwhile, the RSI rests at 66.43, showing solid upside momentum without flashing extreme overextension just yet.
If bulls can force a decisive break and daily close above 0.4487, we could see an acceleration toward higher levels. However, markets rarely move in straight lines. Traders should keep a close eye on the 0.2815 support zone as the primary invalidation level if the bullish structure fails to hold. Manage your risk carefully.
Are you positioning for a breakout above resistance or waiting for a retest? Drop your strategy below 👇
#AVA #CryptoTrading #TechnicalAnalysis
Follow me for more update 📈
Is $AVA ready to shatter its ceiling, or is a rejection loading right here? 🚀
$AVA is making serious moves, currently trading at 0.4226 with a strong 24-hour gain of over 17%. The technical structure looks firmly bullish as price presses toward immediate overhead resistance at 0.4487.
Looking at the indicators, momentum remains in favor of the buyers. The MACD line at 0.0339 sits comfortably above the signal line at 0.0294, while price continues to hold well above both the EMA20 (0.3687) and EMA50 (0.3214). Meanwhile, the RSI rests at 66.43, showing solid upside momentum without flashing extreme overextension just yet.
If bulls can force a decisive break and daily close above 0.4487, we could see an acceleration toward higher levels. However, markets rarely move in straight lines. Traders should keep a close eye on the 0.2815 support zone as the primary invalidation level if the bullish structure fails to hold. Manage your risk carefully.
Are you positioning for a breakout above resistance or waiting for a retest? Drop your strategy below 👇
#AVA #CryptoTrading #TechnicalAnalysis
Follow me for more update 📈
$AVA is making serious moves, currently trading at 0.4226 with a strong 24-hour gain of over 17%. The technical structure looks firmly bullish as price presses toward immediate overhead resistance at 0.4487.
Looking at the indicators, momentum remains in favor of the buyers. The MACD line at 0.0339 sits comfortably above the signal line at 0.0294, while price continues to hold well above both the EMA20 (0.3687) and EMA50 (0.3214). Meanwhile, the RSI rests at 66.43, showing solid upside momentum without flashing extreme overextension just yet.
If bulls can force a decisive break and daily close above 0.4487, we could see an acceleration toward higher levels. However, markets rarely move in straight lines. Traders should keep a close eye on the 0.2815 support zone as the primary invalidation level if the bullish structure fails to hold. Manage your risk carefully.
Are you positioning for a breakout above resistance or waiting for a retest? Drop your strategy below 👇
#AVA #CryptoTrading #TechnicalAnalysis
Follow me for more update 📈
74
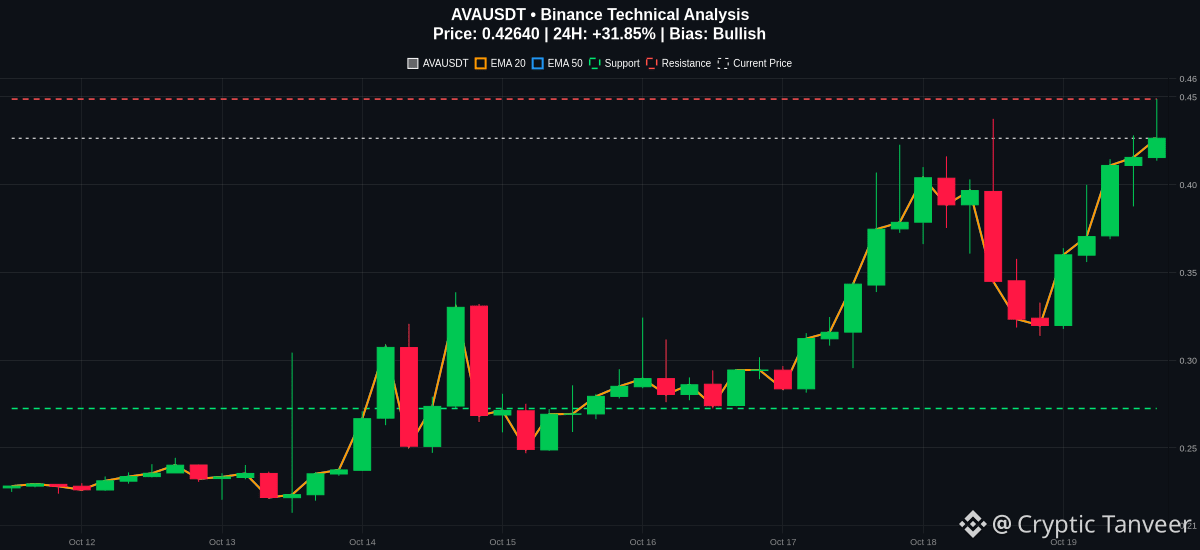
Is $AVA ready to shatter its ceiling, or is a rejection loading right here? 📊
#AVAUSDT is currently trading at 0.4264, racking up an impressive 31.8% gain over the last 24 hours. The price is now knocking directly on the door of immediate resistance at 0.4487 while maintaining a strong bullish trend structure.
Looking at the moving averages, the price sits well above both the EMA20 at 0.3564 and the EMA50 at 0.3129, confirming solid upward momentum. Meanwhile, the MACD line at 0.0316 is above the signal line at 0.0270, showing active buying pressure. The RSI is hovering near 67.98, indicating strong momentum without hitting extreme overbought levels just yet.
However, because the price is extended above the short-term EMA20, we must keep a close eye on potential pullback risks if the resistance holds firm.
For risk management, a daily close below the key support level at 0.2725 would invalidate this bullish setup. Trade smart and manage your risk accordingly.
Are you placing a breakout buy order above resistance, or waiting for a dip? Let me know your plan below. 👇
#CryptoTrading #BinanceSquare #TechnicalAnalysis
Follow me for more update 📈
Is $AVA ready to shatter its ceiling, or is a rejection loading right here? 📊
#AVAUSDT is currently trading at 0.4264, racking up an impressive 31.8% gain over the last 24 hours. The price is now knocking directly on the door of immediate resistance at 0.4487 while maintaining a strong bullish trend structure.
Looking at the moving averages, the price sits well above both the EMA20 at 0.3564 and the EMA50 at 0.3129, confirming solid upward momentum. Meanwhile, the MACD line at 0.0316 is above the signal line at 0.0270, showing active buying pressure. The RSI is hovering near 67.98, indicating strong momentum without hitting extreme overbought levels just yet.
However, because the price is extended above the short-term EMA20, we must keep a close eye on potential pullback risks if the resistance holds firm.
For risk management, a daily close below the key support level at 0.2725 would invalidate this bullish setup. Trade smart and manage your risk accordingly.
Are you placing a breakout buy order above resistance, or waiting for a dip? Let me know your plan below. 👇
#CryptoTrading #BinanceSquare #TechnicalAnalysis
Follow me for more update 📈
#AVAUSDT is currently trading at 0.4264, racking up an impressive 31.8% gain over the last 24 hours. The price is now knocking directly on the door of immediate resistance at 0.4487 while maintaining a strong bullish trend structure.
Looking at the moving averages, the price sits well above both the EMA20 at 0.3564 and the EMA50 at 0.3129, confirming solid upward momentum. Meanwhile, the MACD line at 0.0316 is above the signal line at 0.0270, showing active buying pressure. The RSI is hovering near 67.98, indicating strong momentum without hitting extreme overbought levels just yet.
However, because the price is extended above the short-term EMA20, we must keep a close eye on potential pullback risks if the resistance holds firm.
For risk management, a daily close below the key support level at 0.2725 would invalidate this bullish setup. Trade smart and manage your risk accordingly.
Are you placing a breakout buy order above resistance, or waiting for a dip? Let me know your plan below. 👇
#CryptoTrading #BinanceSquare #TechnicalAnalysis
Follow me for more update 📈
113
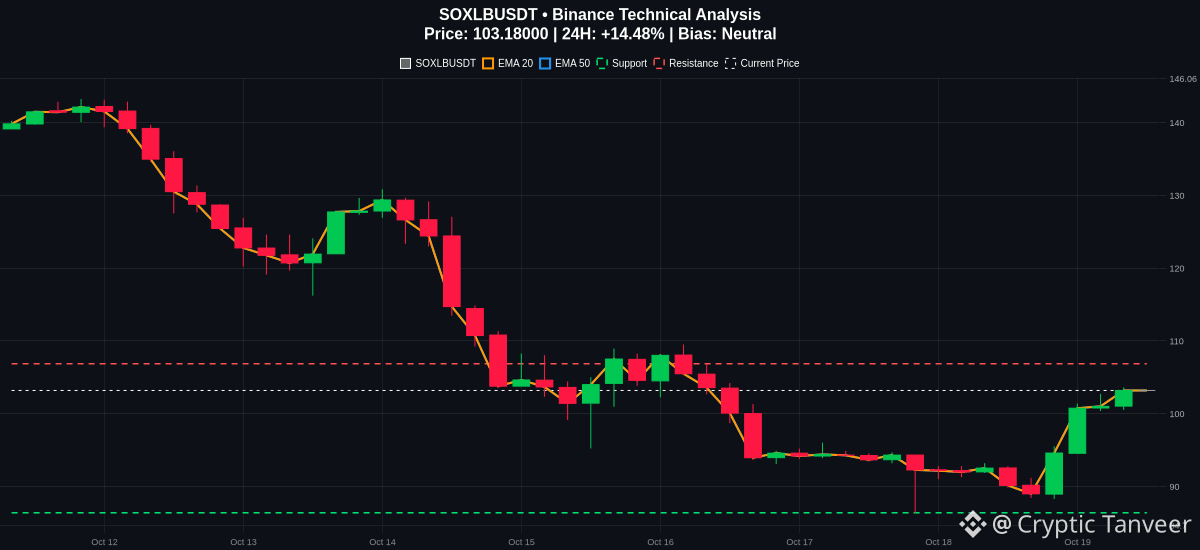
$SOXLBUSDT is pushing higher with a strong 14.48 percent gain, currently trading at 103.18 while reclaiming key moving average structure.
The current setup shows price holding above the EMA20 at 98.92, which points to short term bullish momentum. However, the broader trend still requires caution as the price remains below the EMA50 sitting at 110.82, and the MACD line at -2.92 is still recovering beneath the signal line at -5.41.
RSI is currently neutral at 53.83, meaning the asset is neither overbought nor oversold, leaving room for movement in either direction.
Immediate resistance is marked at 106.85, while support rests lower at 86.37. A daily close below the invalidation risk level around the EMA20 could suggest a potential pullback toward deeper support.
Manage your risk accordingly as markets remain volatile.
Are you expecting a breakout past 106.85 or a retest of lower supports first?
#SOXL #CryptoAnalysis #TechnicalSetup
Follow me for more update 📈
$SOXLBUSDT is pushing higher with a strong 14.48 percent gain, currently trading at 103.18 while reclaiming key moving average structure.
The current setup shows price holding above the EMA20 at 98.92, which points to short term bullish momentum. However, the broader trend still requires caution as the price remains below the EMA50 sitting at 110.82, and the MACD line at -2.92 is still recovering beneath the signal line at -5.41.
RSI is currently neutral at 53.83, meaning the asset is neither overbought nor oversold, leaving room for movement in either direction.
Immediate resistance is marked at 106.85, while support rests lower at 86.37. A daily close below the invalidation risk level around the EMA20 could suggest a potential pullback toward deeper support.
Manage your risk accordingly as markets remain volatile.
Are you expecting a breakout past 106.85 or a retest of lower supports first?
#SOXL #CryptoAnalysis #TechnicalSetup
Follow me for more update 📈
The current setup shows price holding above the EMA20 at 98.92, which points to short term bullish momentum. However, the broader trend still requires caution as the price remains below the EMA50 sitting at 110.82, and the MACD line at -2.92 is still recovering beneath the signal line at -5.41.
RSI is currently neutral at 53.83, meaning the asset is neither overbought nor oversold, leaving room for movement in either direction.
Immediate resistance is marked at 106.85, while support rests lower at 86.37. A daily close below the invalidation risk level around the EMA20 could suggest a potential pullback toward deeper support.
Manage your risk accordingly as markets remain volatile.
Are you expecting a breakout past 106.85 or a retest of lower supports first?
#SOXL #CryptoAnalysis #TechnicalSetup
Follow me for more update 📈
84
Log in to explore more content
Join global crypto users on Binance Square
⚡️ Get latest and useful information about crypto.
💬 Trusted by the world’s largest crypto exchange.
👍 Discover real insights from verified creators.
Email / Phone number
Trending Topics
BinancePick
2.5M views
136,756 Discussing
Join #EarningsSeason: Predict Earnings on Binance Pick, Share Your Take on Binance Square!
Binance Square Official
·398 Likes
·336.6k views
EarningsSeason
4.9M views
23,779 Discussing
ElectrumWalletBugLetRogueServersStealFunds
1,035 views
85 Discussing