
Tanalysis92
38 Posts

Tanalysis92
Hi Everyone I am Analysis Pro. Power full analysis and power full signal 🚦🚥
Open Trade
Frequent Trader
8.2 Years
1 Following
50 Followers
18 Liked
Posts
Portfolio
All
Quotes


Abdullah _Fahim
·
--
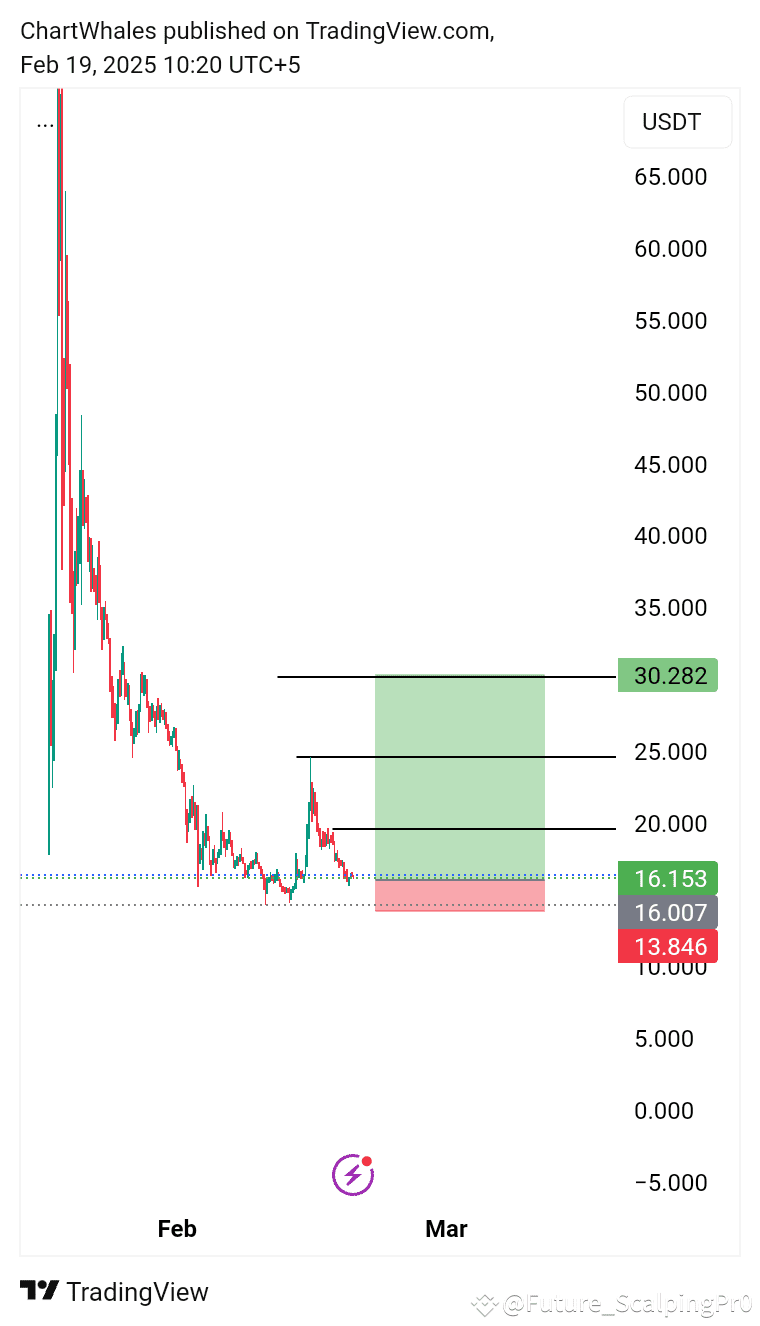
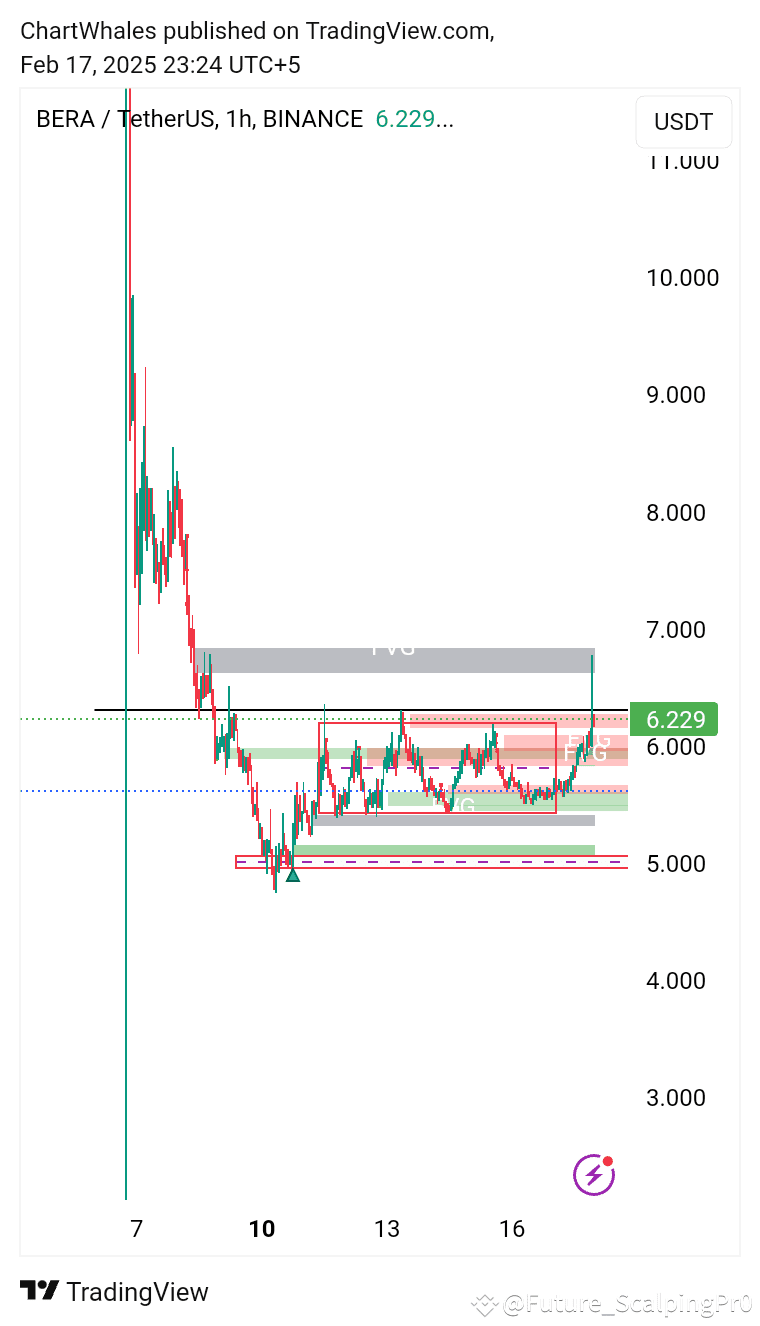
BullishBuy trump on 18.5 and take a long trade and set profit on 19.2.It will take only 2-3 hours and you will earn very much.
Tanalysis92
·
--
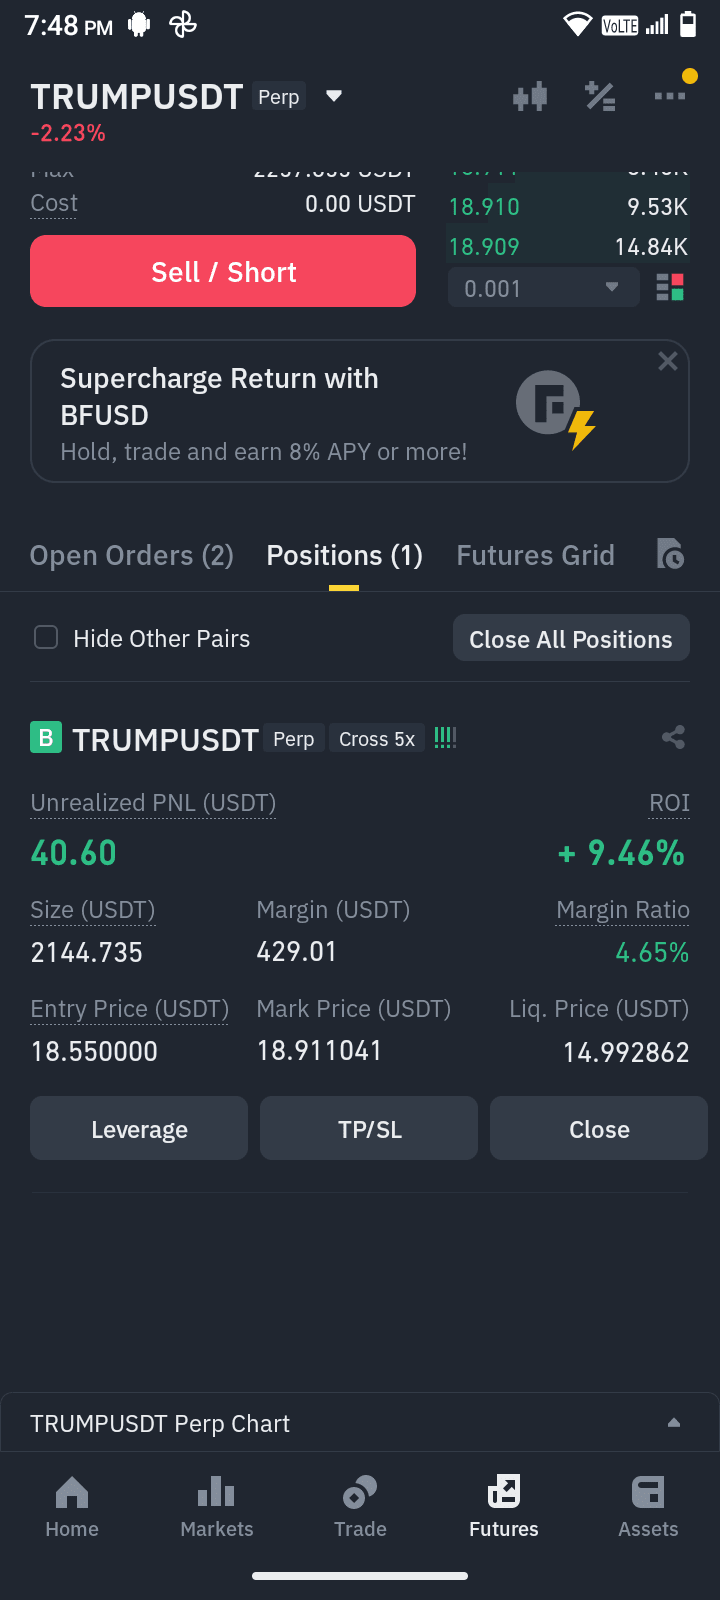
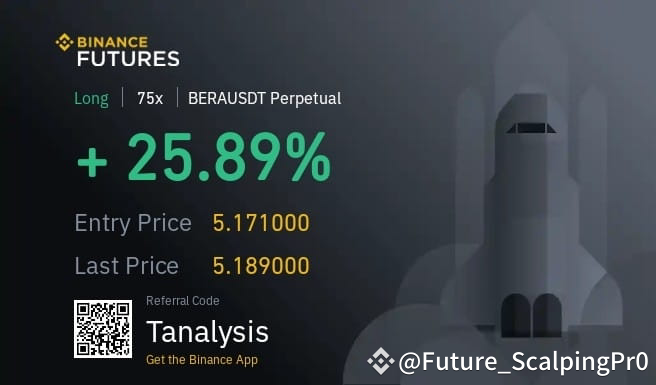
BullishBera usdt
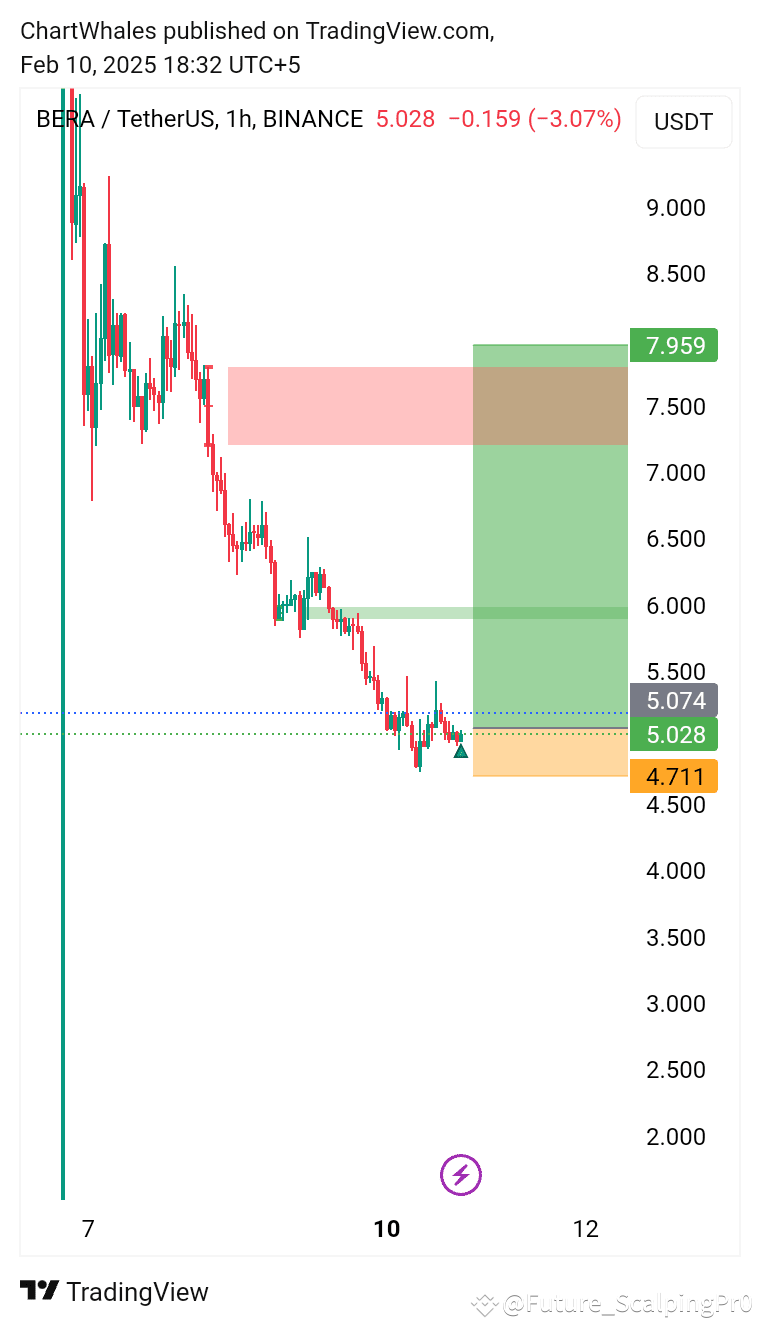
This chart represents a trade setup for BERA/USDT on Binance with a 1-hour timeframe. The analysis suggests a long position with the following key levels:
Entry Zone: Around 5.028 USDT
Stop-Loss (SL): 4.711 USDT (marked in orange)
Take-Profit (TP): 7.959 USDT (marked in green)
Analysis & Trade Suggestion:
1. Risk-Reward Ratio: The setup shows a favorable risk-reward ratio, as the target is significantly higher than the stop-loss.
2. Support & Resistance:
The current price is near 5.028, which could be acting as a support level.
Resistance is observed around 6.0, and a major resistance at 7.959 (take-profit level).
3. Trend Consideration: The price has been in a downtrend but appears to be consolidating near support, potentially signaling a reversal.
Long Strategy Suggestion:
Entry: Around 5.028 USDT
Stop-Loss: 4.711 USDT (to minimize downside risk)
Take-Profit: 7.959 USDT
Confirmation: Look for bullish signals like volume increase, trendline breakout, or bullish candlestick patterns before entering.
Would you like a deeper technical analysis, such as moving averages, RSI, or Fibonacci levels?
This chart represents a trade setup for BERA/USDT on Binance with a 1-hour timeframe. The analysis suggests a long position with the following key levels:
Entry Zone: Around 5.028 USDT
Stop-Loss (SL): 4.711 USDT (marked in orange)
Take-Profit (TP): 7.959 USDT (marked in green)
Analysis & Trade Suggestion:
1. Risk-Reward Ratio: The setup shows a favorable risk-reward ratio, as the target is significantly higher than the stop-loss.
2. Support & Resistance:
The current price is near 5.028, which could be acting as a support level.
Resistance is observed around 6.0, and a major resistance at 7.959 (take-profit level).
3. Trend Consideration: The price has been in a downtrend but appears to be consolidating near support, potentially signaling a reversal.
Long Strategy Suggestion:
Entry: Around 5.028 USDT
Stop-Loss: 4.711 USDT (to minimize downside risk)
Take-Profit: 7.959 USDT
Confirmation: Look for bullish signals like volume increase, trendline breakout, or bullish candlestick patterns before entering.
Would you like a deeper technical analysis, such as moving averages, RSI, or Fibonacci levels?
Quoted content has been removed


Trisha_Saha
·
--
BTC/USDT - H1 - Head & Shoulder Pattern💪🦾
$BTC
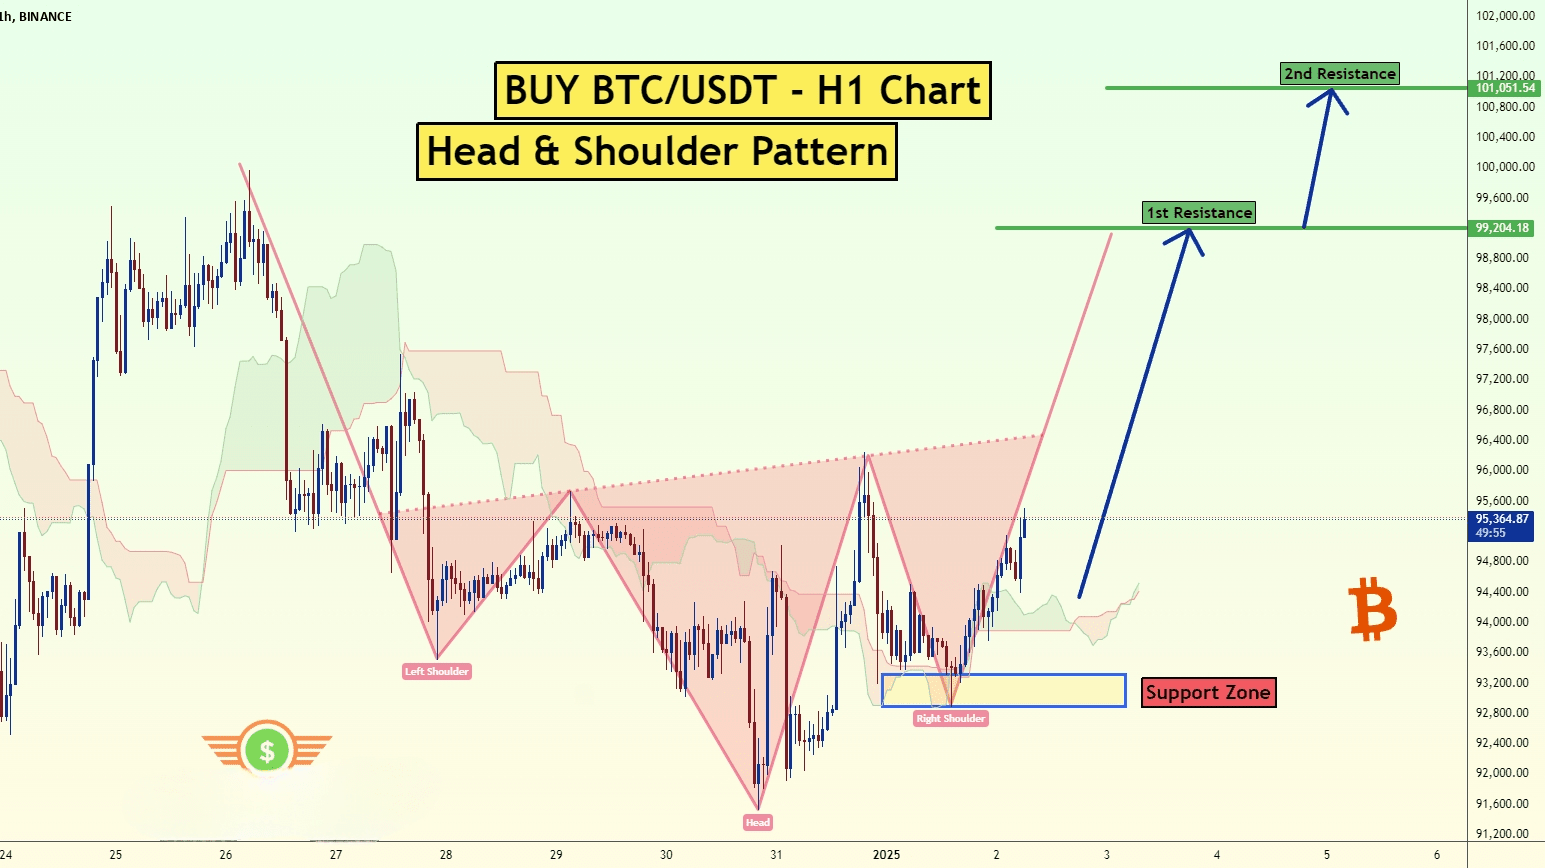
The BTC/USDT pair on the H1 timeframe presents a potential Buying opportunity due to a recent downward breakout from a well-defined H&S pattern. This suggests a shift in momentum towards the upside in the coming Hours.
Key Points:
Buy Entry: Consider entering a Long position around close to the breakout level. This offers an entry point near the perceived shift in momentum.
Target Levels:
1st Support – 99204
2nd Support – 101.051
Your likes and comments are incredibly motivating and will encourage me to share more analysis with you.
Best Regards,
Thank you.
#BTCRebounds95K #USStateBuysBTC #XRPBackInTop3 #BitcoinInSwissReserves #BinanceAlphaAlert
The BTC/USDT pair on the H1 timeframe presents a potential Buying opportunity due to a recent downward breakout from a well-defined H&S pattern. This suggests a shift in momentum towards the upside in the coming Hours.
Key Points:
Buy Entry: Consider entering a Long position around close to the breakout level. This offers an entry point near the perceived shift in momentum.
Target Levels:
1st Support – 99204
2nd Support – 101.051
Your likes and comments are incredibly motivating and will encourage me to share more analysis with you.
Best Regards,
Thank you.
#BTCRebounds95K #USStateBuysBTC #XRPBackInTop3 #BitcoinInSwissReserves #BinanceAlphaAlert

Professor_Rk
·
--
BTC Warning: Break $95K, and It’s Straight to $85K!
🚨 Bitcoin Analysis: Why BTC is Dumping and What’s Next?
Hey traders,
$BTC #BTC☀
Bitcoin is making wild moves, and it’s no joke. We’re seeing BTC test critical levels, and a lot of liquidations are happening across the board. Let’s break it all down with the chart analysis you need and actionable insights so you don’t get wrecked.
BTC Chart Breakdown
🔵 Channel Boundaries:
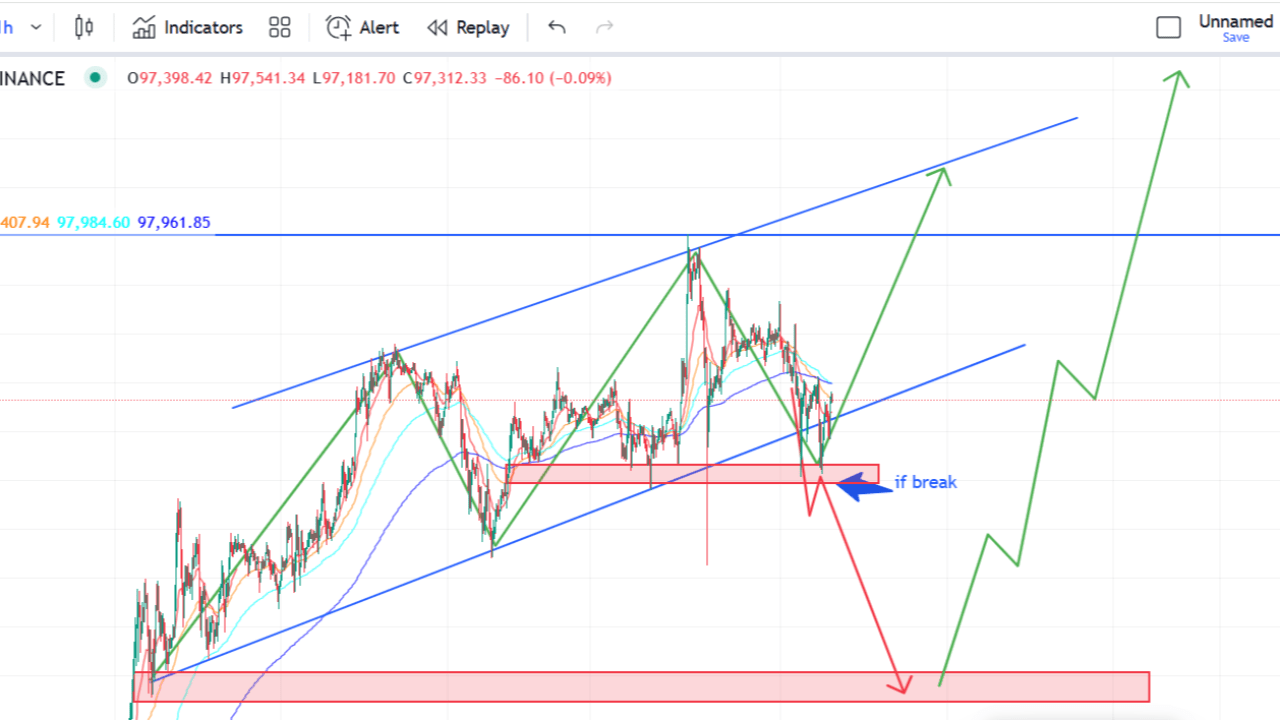
Bitcoin is trading in an ascending channel (marked in blue). The price is currently bouncing between these lines.
🔴 Bearish Danger Zone:
If BTC fails to hold the $95,000 zone, we might see a nasty drop to the red support block at $85,000.Breaking this level could trigger more panic selling.
🟢 Bullish Recovery Path;
On the flip side, if BTC bounces and holds support near $97,000, we can expect a retest of $104,000-$105,000. That’s where we’ll see some major resistance.
Why is BTC Dropping?
1️⃣ Leverage Liquidations:
Over-leveraged traders are getting wiped out. When BTC dips, it triggers stop-losses and liquidations, creating a domino effect.
2️⃣ Whale Manipulation:
Whales are taking advantage of the hype and retail FOMO. They’re pushing prices down to shake out weak hands and buying back at lower levels.
3️⃣ Macro Concerns:
Economic uncertainty and global markets are putting pressure on crypto. When confidence drops, even BTC isn’t safe from sell-offs.
What’s Next? (Scenarios)
🚩 Bearish Case:
If BTC breaks below the red support zone at $95,000, it’s game over for the short term. Expect a drop to $85,000, where major buyers might step in.
🚨 If Support Breaks Further:
If BTC loses the $85,000 support, things could get ugly. The next strong support is far below, possibly near $75,000 or lower. A break like this would signal a larger trend reversal, so tread carefully. This could create a massive panic in the market, with more liquidations and selling pressure driving the price down fast.
🚀 Bullish Case:
If BTC bounces off the current level and moves above $104,000, the bulls will gain momentum. Breaking out of the ascending channel could take us to new highs.
How to Trade This?
1️⃣ Be Patient:
Don’t rush. Wait for a clear signal, either a bounce or a breakdown.
2️⃣ Key Levels to Watch:
Support: $95K, $85K, $75KResistance: $104K, $110K
3️⃣ Risk Management:
Keep your stop-loss tight. Only risk what you’re willing to lose.Avoid high leverage in this volatile market.
My Opinion on BTC Right Now
This is a shakeout. Whales are cleaning the market of weak hands, and they’re targeting stop losses. My advice? Hold your positions or wait for clear levels before entering trades. If BTC drops to $85K, it’s a buying opportunity. If it bounces here, we’re heading for a retest of $104K+. But remember, if $85K breaks, we could see major panic selling—stay cautious!
PLEASE TAKE RISK MANAGMENT
Final Thoughts
The market is tough, but this is where smart traders win. Stick to your plan, manage your risk, and don’t panic. BTC is still in play, and the big moves are coming. Stay sharp, fam, and let’s ride this wave together! 🚀
$BTC #Write2Earn!
Hey traders,
$BTC #BTC☀
Bitcoin is making wild moves, and it’s no joke. We’re seeing BTC test critical levels, and a lot of liquidations are happening across the board. Let’s break it all down with the chart analysis you need and actionable insights so you don’t get wrecked.
BTC Chart Breakdown
🔵 Channel Boundaries:
Bitcoin is trading in an ascending channel (marked in blue). The price is currently bouncing between these lines.
🔴 Bearish Danger Zone:
If BTC fails to hold the $95,000 zone, we might see a nasty drop to the red support block at $85,000.Breaking this level could trigger more panic selling.
🟢 Bullish Recovery Path;
On the flip side, if BTC bounces and holds support near $97,000, we can expect a retest of $104,000-$105,000. That’s where we’ll see some major resistance.
Why is BTC Dropping?
1️⃣ Leverage Liquidations:
Over-leveraged traders are getting wiped out. When BTC dips, it triggers stop-losses and liquidations, creating a domino effect.
2️⃣ Whale Manipulation:
Whales are taking advantage of the hype and retail FOMO. They’re pushing prices down to shake out weak hands and buying back at lower levels.
3️⃣ Macro Concerns:
Economic uncertainty and global markets are putting pressure on crypto. When confidence drops, even BTC isn’t safe from sell-offs.
What’s Next? (Scenarios)
🚩 Bearish Case:
If BTC breaks below the red support zone at $95,000, it’s game over for the short term. Expect a drop to $85,000, where major buyers might step in.
🚨 If Support Breaks Further:
If BTC loses the $85,000 support, things could get ugly. The next strong support is far below, possibly near $75,000 or lower. A break like this would signal a larger trend reversal, so tread carefully. This could create a massive panic in the market, with more liquidations and selling pressure driving the price down fast.
🚀 Bullish Case:
If BTC bounces off the current level and moves above $104,000, the bulls will gain momentum. Breaking out of the ascending channel could take us to new highs.
How to Trade This?
1️⃣ Be Patient:
Don’t rush. Wait for a clear signal, either a bounce or a breakdown.
2️⃣ Key Levels to Watch:
Support: $95K, $85K, $75KResistance: $104K, $110K
3️⃣ Risk Management:
Keep your stop-loss tight. Only risk what you’re willing to lose.Avoid high leverage in this volatile market.
My Opinion on BTC Right Now
This is a shakeout. Whales are cleaning the market of weak hands, and they’re targeting stop losses. My advice? Hold your positions or wait for clear levels before entering trades. If BTC drops to $85K, it’s a buying opportunity. If it bounces here, we’re heading for a retest of $104K+. But remember, if $85K breaks, we could see major panic selling—stay cautious!
PLEASE TAKE RISK MANAGMENT
Final Thoughts
The market is tough, but this is where smart traders win. Stick to your plan, manage your risk, and don’t panic. BTC is still in play, and the big moves are coming. Stay sharp, fam, and let’s ride this wave together! 🚀
$BTC #Write2Earn!


Log in to explore more content