
Bin brief
39 Posts

Bin brief
Report
Block User
💥spot trader 💥free signals💥sol holder💥frequent trader💥learning trading 💥small steps big goals
Frequent Trader
10 Months
12 Following
8 Followers
50 Liked
Posts
·
--
Bearish
🟢 $SOL short Trade Signal
SOL Price: $110
🔹 Entry: $109.5–110.5
🎯 TP1: $107
🎯 TP2: $104
🎯 TP3: $100
🛑 SL: $116
$SOL
Leverage: 10x max
🟢 $SOL short Trade Signal
SOL Price: $110
🔹 Entry: $109.5–110.5
🎯 TP1: $107
🎯 TP2: $104
🎯 TP3: $100
🛑 SL: $116
$SOL
Leverage: 10x max
SOL Price: $110
🔹 Entry: $109.5–110.5
🎯 TP1: $107
🎯 TP2: $104
🎯 TP3: $100
🛑 SL: $116
$SOL
Leverage: 10x max
67
·
--
⚡ $SOL is heating up!
🚀 Momentum rising
👀 Whales watching
📈 Next move could be BIG!
SOL $300+ loading? 🔥
#SOL #Solana #Crypto #BinanceSquare
⚡ $SOL is heating up!
🚀 Momentum rising
👀 Whales watching
📈 Next move could be BIG!
SOL $300+ loading? 🔥
#SOL #Solana #Crypto #BinanceSquare
🚀 Momentum rising
👀 Whales watching
📈 Next move could be BIG!
SOL $300+ loading? 🔥
#SOL #Solana #Crypto #BinanceSquare
6
·
--
Bullish
Guys Buy long now $SOL with 15x leverage in futures...
Entry Zone: $112.00–$115.00
TP 1: $118.00
TP 2: $122.00
TP 3: $127.00
TP 4: $135.00
SL: $100.50 #BTCBreaks80K #EarnFreeCrypto2024 #viralpost #SolanaUSTD #BinanceSquareTalks $GOOGL.US
Guys Buy long now $SOL with 15x leverage in futures...
Entry Zone: $112.00–$115.00
TP 1: $118.00
TP 2: $122.00
TP 3: $127.00
TP 4: $135.00
SL: $100.50 #BTCBreaks80K #EarnFreeCrypto2024 #viralpost #SolanaUSTD #BinanceSquareTalks $GOOGL.US
Entry Zone: $112.00–$115.00
TP 1: $118.00
TP 2: $122.00
TP 3: $127.00
TP 4: $135.00
SL: $100.50 #BTCBreaks80K #EarnFreeCrypto2024 #viralpost #SolanaUSTD #BinanceSquareTalks $GOOGL.US
77
·
--
$SOL Breakout Setup Looks Ready to Trigger
Trade Setup (Long):
Entry: $80.40 – $80.80
Stop Loss: $79.80
TP1: $82.00
TP2: $83.50
TP3: $85.00
$SOL Breakout Setup Looks Ready to Trigger
Trade Setup (Long):
Entry: $80.40 – $80.80
Stop Loss: $79.80
TP1: $82.00
TP2: $83.50
TP3: $85.00
Trade Setup (Long):
Entry: $80.40 – $80.80
Stop Loss: $79.80
TP1: $82.00
TP2: $83.50
TP3: $85.00
80
·
--
!attention!
sol breakout confirmed
TP1$83
TP2$88
TP3$92
!attention!
sol breakout confirmed
TP1$83
TP2$88
TP3$92
sol breakout confirmed
TP1$83
TP2$88
TP3$92
110
·
--
Bearish
$SOL Rejection From Resistance, Downside Pressure Building
Short Trade
Entry: 73.85 & 74.10
SL: 75.90
TP1: 73.20
TP2: 72.20
TP3: 71.66
$SOL has failed to reclaim the 74.20 & 75.00 resistance zone and is now consolidating beneath a key supply area, suggesting buyers are losing momentum. Repeated rejection from higher levels, combined with lower highs on the 1H chart, keeps the short-term bias tilted to the downside. As long as price remains below 74.20, the probability favors a continuation toward 73.20, followed by 72.20 and potentially 71.66.
#GoldHoldsDeclineb
$NVDAB #BinanceSquareTalks #SolanaUSTD #TradingSignals #BullishMay $MSFTB
$SOL Rejection From Resistance, Downside Pressure Building
Short Trade
Entry: 73.85 & 74.10
SL: 75.90
TP1: 73.20
TP2: 72.20
TP3: 71.66
$SOL has failed to reclaim the 74.20 & 75.00 resistance zone and is now consolidating beneath a key supply area, suggesting buyers are losing momentum. Repeated rejection from higher levels, combined with lower highs on the 1H chart, keeps the short-term bias tilted to the downside. As long as price remains below 74.20, the probability favors a continuation toward 73.20, followed by 72.20 and potentially 71.66.
#GoldHoldsDeclineb
$NVDAB #BinanceSquareTalks #SolanaUSTD #TradingSignals #BullishMay $MSFTB
Short Trade
Entry: 73.85 & 74.10
SL: 75.90
TP1: 73.20
TP2: 72.20
TP3: 71.66
$SOL has failed to reclaim the 74.20 & 75.00 resistance zone and is now consolidating beneath a key supply area, suggesting buyers are losing momentum. Repeated rejection from higher levels, combined with lower highs on the 1H chart, keeps the short-term bias tilted to the downside. As long as price remains below 74.20, the probability favors a continuation toward 73.20, followed by 72.20 and potentially 71.66.
#GoldHoldsDeclineb
$NVDAB #BinanceSquareTalks #SolanaUSTD #TradingSignals #BullishMay $MSFTB
88
·
--
#opg $OPG If you're referring to OpenGradient (OPG), it is listed on Binance Spot. Trading pairs include OPG/USDT, OPG/USDC, and OPG/TRY, and Binance classifies it with a Seed Tag, which indicates it may have higher volatility and risk.#BinanceSquareFamily #cryoto #RewardsHub #viralpost $BTC
#opg $OPG If you're referring to OpenGradient (OPG), it is listed on Binance Spot. Trading pairs include OPG/USDT, OPG/USDC, and OPG/TRY, and Binance classifies it with a Seed Tag, which indicates it may have higher volatility and risk.#BinanceSquareFamily #cryoto #RewardsHub #viralpost $BTC
5
121
·
--
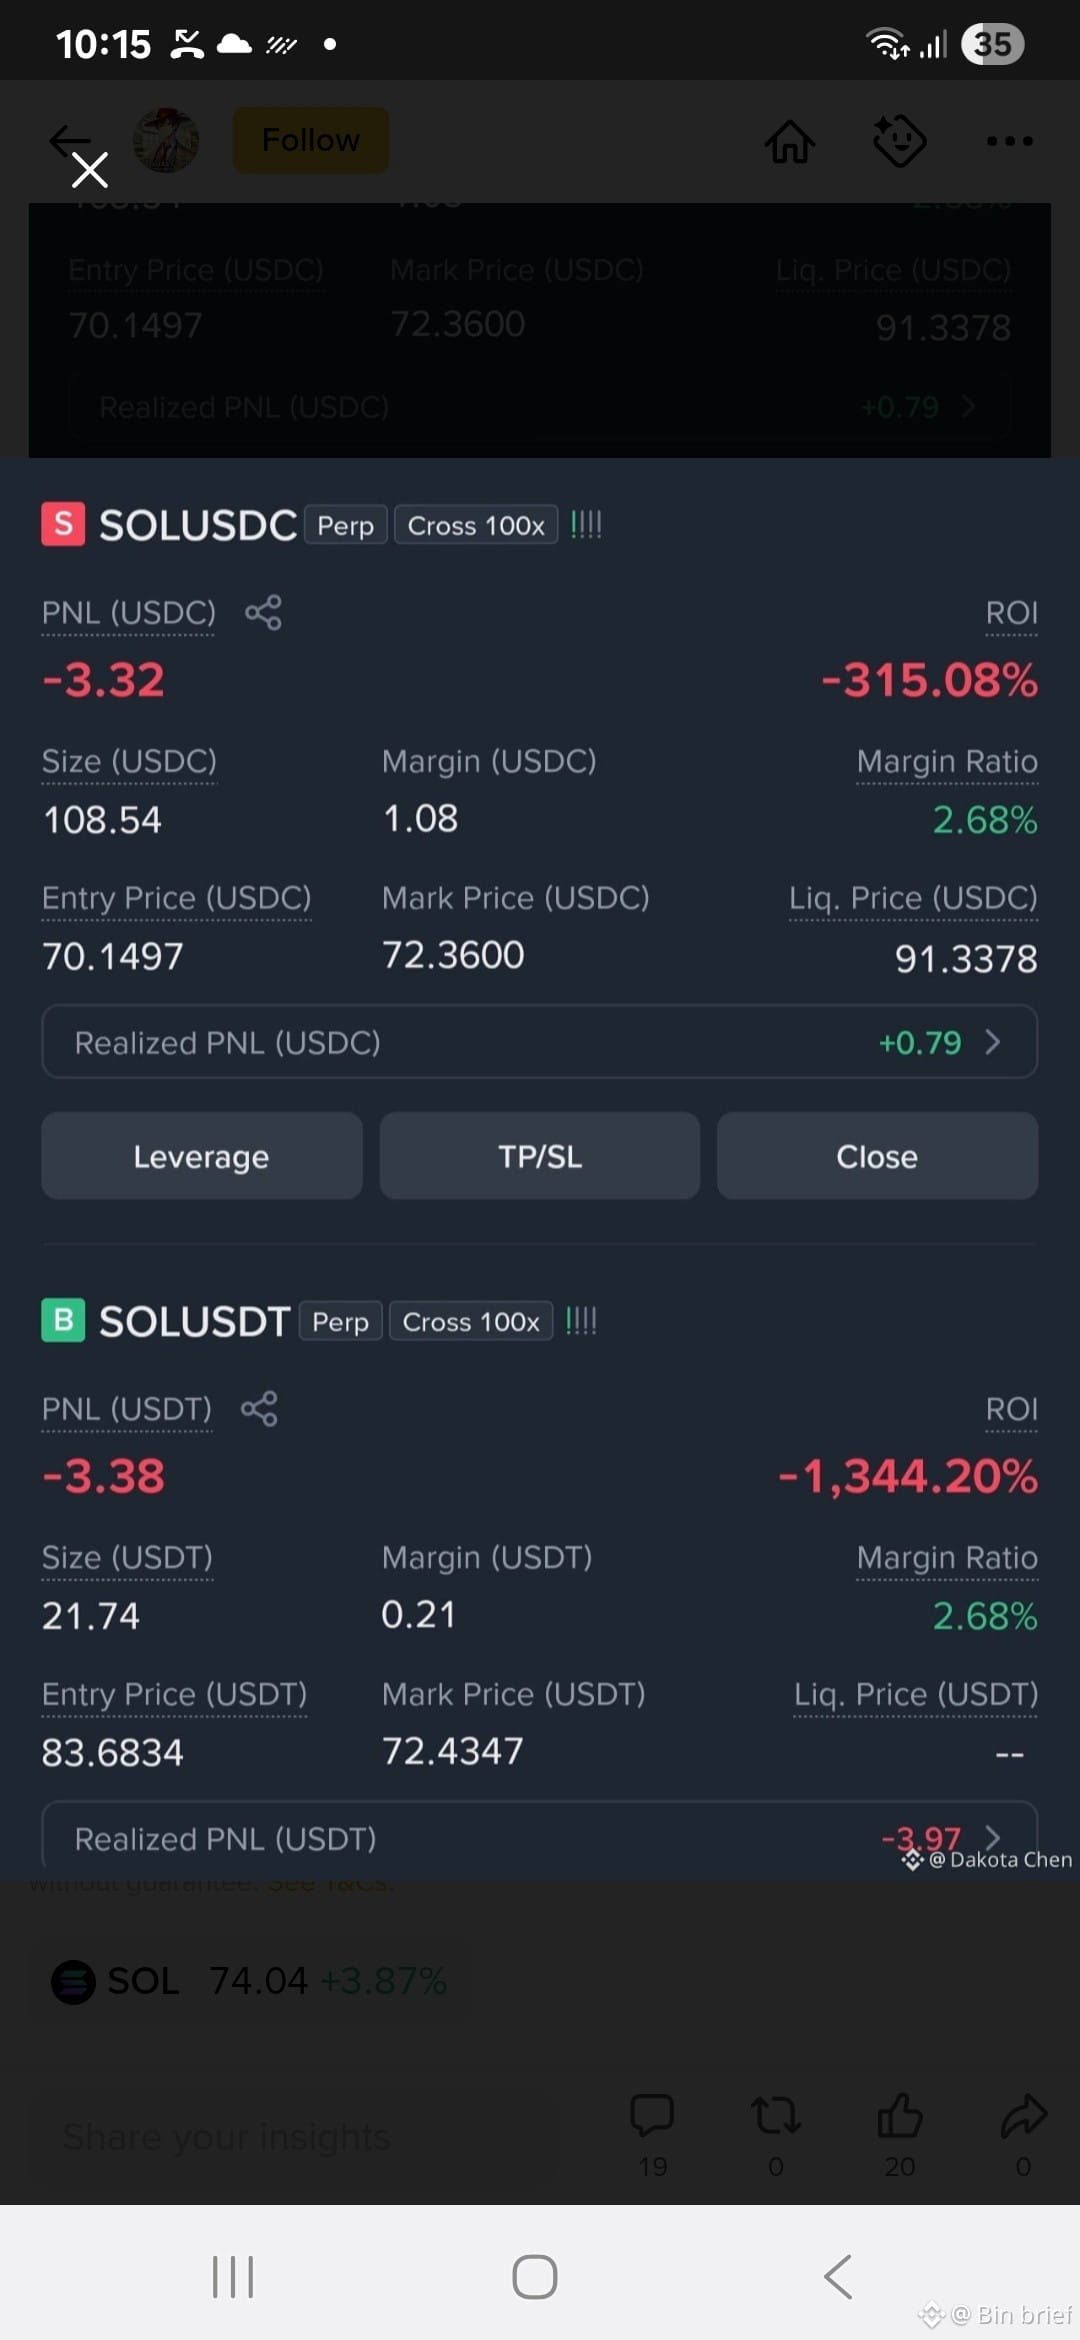
$SOL $85..... or...... $65 ? 🤔✍️
We'll have to wait and see.👌
When the price reached $85, I immediately closed both positions.🫣
$SOL $85..... or...... $65 ? 🤔✍️
We'll have to wait and see.👌
When the price reached $85, I immediately closed both positions.🫣
We'll have to wait and see.👌
When the price reached $85, I immediately closed both positions.🫣
99
·
--
Bullish
$SOL i am holding sol coin for long time inshallah it goes to 100 as soon as possible #cryptouniverseofficial #views #Rewards. #ProfitPotential #Binance $BTC
$SOL i am holding sol coin for long time inshallah it goes to 100 as soon as possible #cryptouniverseofficial #views #Rewards. #ProfitPotential #Binance $BTC
1
109
·
--
●Bullish: Consider buying only after a clear breakout above resistance with strong volume.
●Bearish: If support breaks, wait for the next support area instead of buying immediately.
●Neutral: If price stays inside the range, it's often better to wait than to guess the direction.#SUI🔥 #Binance #crypto #trading #viralpost $BTC
●Bullish: Consider buying only after a clear breakout above resistance with strong volume.
●Bearish: If support breaks, wait for the next support area instead of buying immediately.
●Neutral: If price stays inside the range, it's often better to wait than to guess the direction.#SUI🔥 #Binance #crypto #trading #viralpost $BTC
●Bearish: If support breaks, wait for the next support area instead of buying immediately.
●Neutral: If price stays inside the range, it's often better to wait than to guess the direction.#SUI🔥 #Binance #crypto #trading #viralpost $BTC
116
·
--
Current market analysis suggests:
SOL is trading around $71–72.
Short-term technical indicators are slightly bearish to neutral, with price near a support area.
changelly.com +1
If buyers hold support, a small rebound is possible. If support breaks, SOL could move lower before recovering.
changelly.com +1
If you're trading today, watch:
Support: around $70–71
Resistance: around $73–75
changelly.com +1$BTC #Binance #CryptoTrends2024 #Solana #BTC☀ #TradingSignals
Current market analysis suggests:
SOL is trading around $71–72.
Short-term technical indicators are slightly bearish to neutral, with price near a support area.
changelly.com +1
If buyers hold support, a small rebound is possible. If support breaks, SOL could move lower before recovering.
changelly.com +1
If you're trading today, watch:
Support: around $70–71
Resistance: around $73–75
changelly.com +1$BTC #Binance #CryptoTrends2024 #Solana #BTC☀ #TradingSignals
SOL is trading around $71–72.
Short-term technical indicators are slightly bearish to neutral, with price near a support area.
changelly.com +1
If buyers hold support, a small rebound is possible. If support breaks, SOL could move lower before recovering.
changelly.com +1
If you're trading today, watch:
Support: around $70–71
Resistance: around $73–75
changelly.com +1$BTC #Binance #CryptoTrends2024 #Solana #BTC☀ #TradingSignals
120
·
--
Bullish
$SOL inshallah sol is going for bullish trend so as fast as loght buy sol
$SOL inshallah sol is going for bullish trend so as fast as loght buy sol
2
138
·
--

Article
sui directionIf by “direction of SUI today on Binance” you mean the short-term price trend, the market currently looks slightly bullish to neutral, but not strongly trending. Recent data shows SUI trading around $0.75–$0.76, up modestly over the last 24 hours, with a 24-hour range of roughly $0.74–$0.77. �#Sui #BTC #binance #crypto #viralpost #bullish $BTC
{spot}(BTCUSDT)
sui direction
If by “direction of SUI today on Binance” you mean the short-term price trend, the market currently looks slightly bullish to neutral, but not strongly trending. Recent data shows SUI trading around $0.75–$0.76, up modestly over the last 24 hours, with a 24-hour range of roughly $0.74–$0.77. �#Sui #BTC #binance #crypto #viralpost #bullish $BTC
1
128
·
--
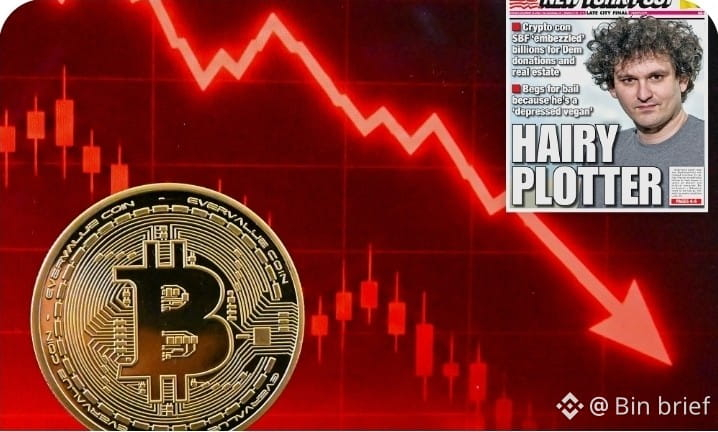
Right now, Bitcoin is trading between about 59,000 and 63,000 dollars, its lowest since late 2024. Technical indicators show a strong sell signal, and a big factor is over 300 million dollars in outflows from Bitcoin ETFs. If it drops below 59,000, the downside could accelerate, while resistance is around 70,000 to 74,000 dollars. So, overall, it’s a turbulent moment for Bitcoin$BTC #Binance ##crypto #Viralmyfeed #BitcoinETFs #TradingSignals $BTC
Right now, Bitcoin is trading between about 59,000 and 63,000 dollars, its lowest since late 2024. Technical indicators show a strong sell signal, and a big factor is over 300 million dollars in outflows from Bitcoin ETFs. If it drops below 59,000, the downside could accelerate, while resistance is around 70,000 to 74,000 dollars. So, overall, it’s a turbulent moment for Bitcoin$BTC #Binance ##crypto #Viralmyfeed #BitcoinETFs #TradingSignals $BTC
1
87
·
--
Bearish
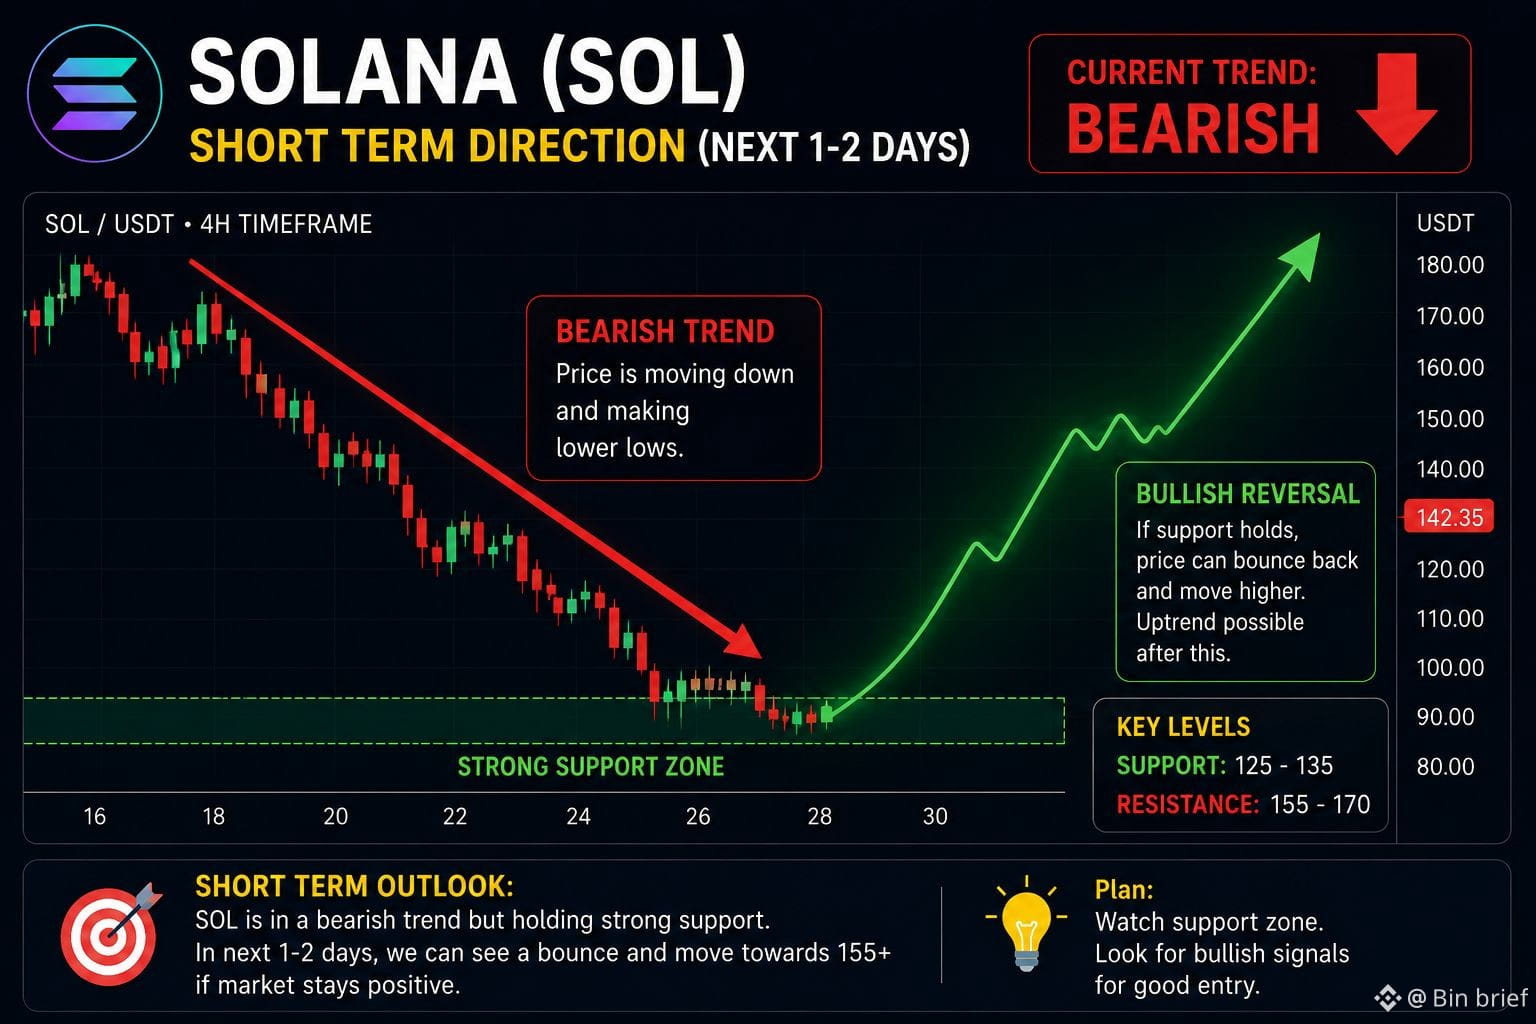
●Bias: Slightly bearish / sideways
●Bullish signal: A move above nearby resistance could trigger a short-term upward push.
●Bearish signal: A break below recent support could lead to further downside pressure.$BTC #solana #Binance #crypto #signaladvisor #viralpost $BTC
●Bias: Slightly bearish / sideways
●Bullish signal: A move above nearby resistance could trigger a short-term upward push.
●Bearish signal: A break below recent support could lead to further downside pressure.$BTC #solana #Binance #crypto #signaladvisor #viralpost $BTC
●Bullish signal: A move above nearby resistance could trigger a short-term upward push.
●Bearish signal: A break below recent support could lead to further downside pressure.$BTC #solana #Binance #crypto #signaladvisor #viralpost $BTC
1
89
·
--
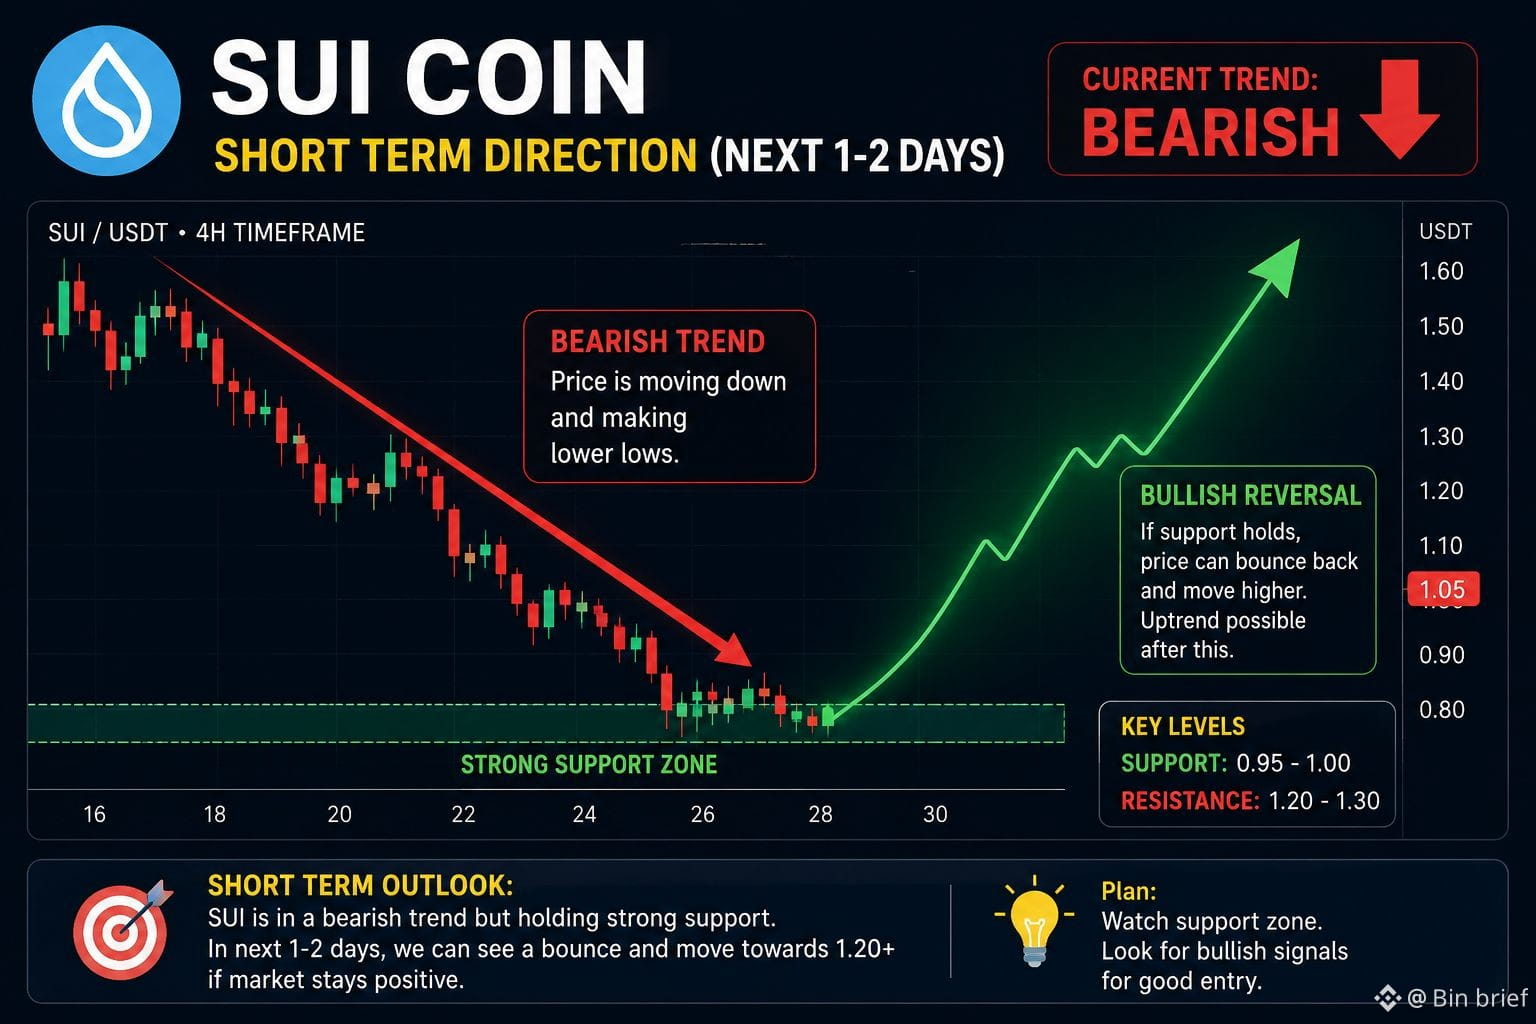
In the next one to two days, SUI coin shows a neutral to slightly upward trend. After a small dip, it’s starting to stabilize, and we might see a bounce in buying momentum. Keep an eye on market updates—if the broader crypto market improves, SUI could rise. Stay tuned for more updates and signals!"#Binance #crypto #SUI🔥 #sui #trading
In the next one to two days, SUI coin shows a neutral to slightly upward trend. After a small dip, it’s starting to stabilize, and we might see a bounce in buying momentum. Keep an eye on market updates—if the broader crypto market improves, SUI could rise. Stay tuned for more updates and signals!"#Binance #crypto #SUI🔥 #sui #trading
1
185
·
--
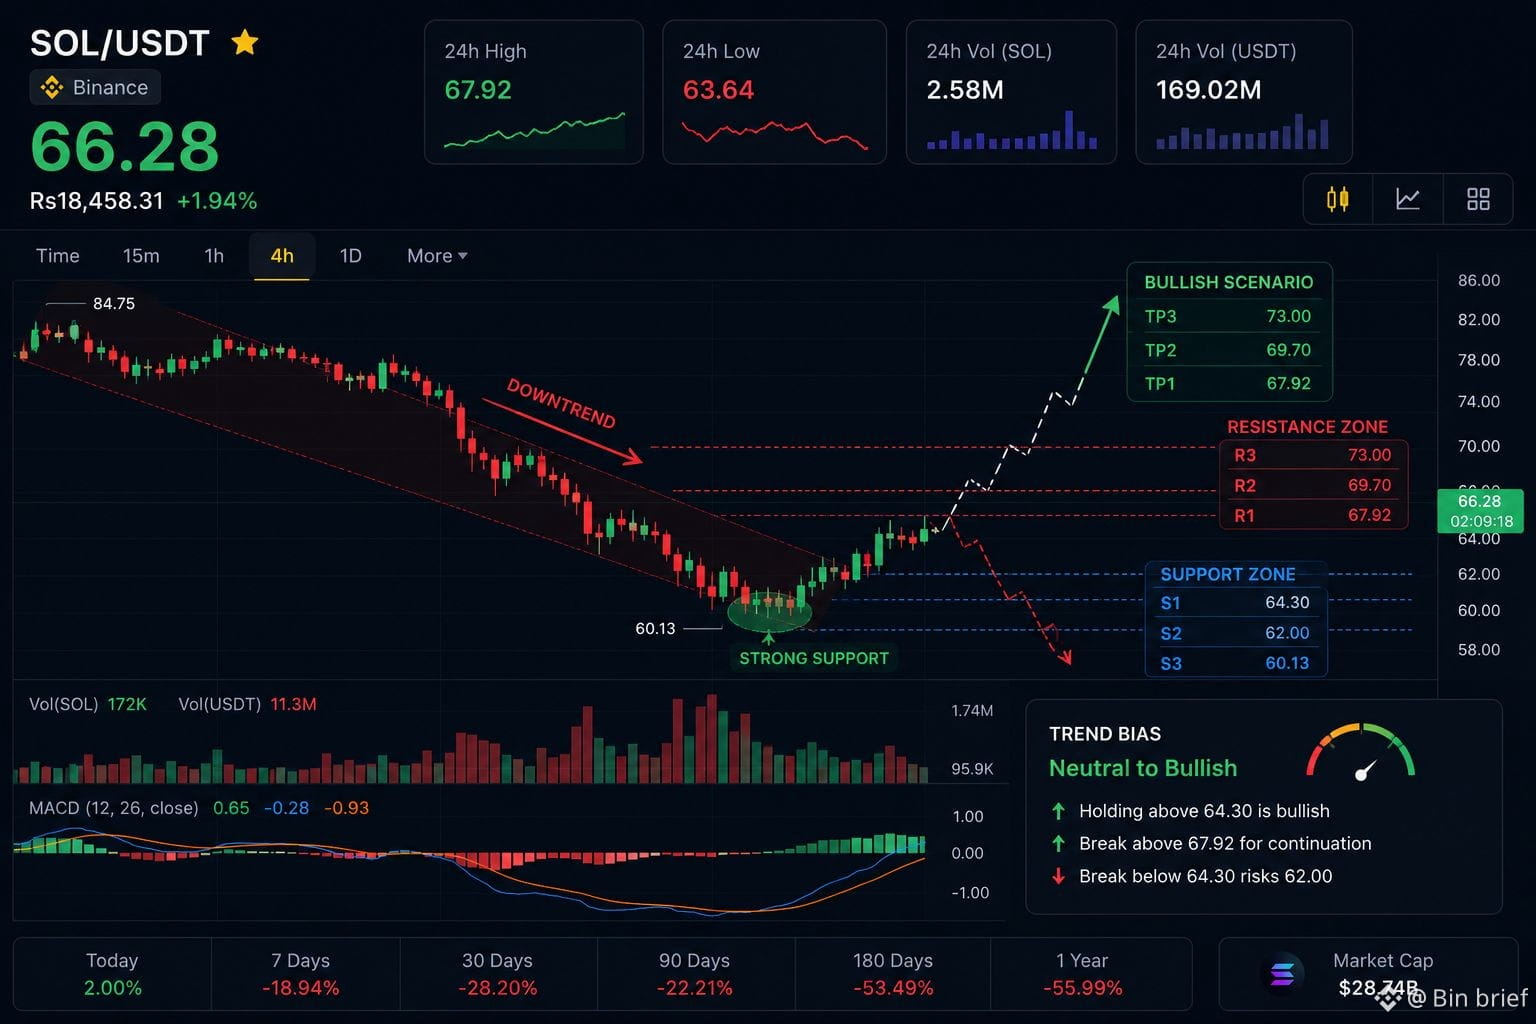
●#solana #crypto Bullish: Break and hold above 67.9 → could test 69–70.
●Neutral: Trades between 64 and 68 for several candles.
●Bearish: Falls below 64 → risk of revisiting 62 and possibly 60.$BTC #Binance #viralpost
●#solana #crypto Bullish: Break and hold above 67.9 → could test 69–70.
●Neutral: Trades between 64 and 68 for several candles.
●Bearish: Falls below 64 → risk of revisiting 62 and possibly 60.$BTC #Binance #viralpost
●Neutral: Trades between 64 and 68 for several candles.
●Bearish: Falls below 64 → risk of revisiting 62 and possibly 60.$BTC #Binance #viralpost
3
179
·
--
The SOL/USDT pair is trading at 63.56 USDT on the 4-hour timeframe. The chart shows a strong downward trend, with the price falling from around 86 USDT to a recent low of 60.13 USDT. Although there has been a small recovery from the low, the overall market trend remains bearish. Increased selling volume during the decline indicates strong selling pressure. Key support lies near 60 USDT, while resistance is around 65 USDT and 68–70 USDT. In the short term, SOL may continue its rebound if it stays above support, but a break below 60 USDT could lead to further losses. Overall, the market is showing a minor bounce within a broader downtrend.#crypto #solana
The SOL/USDT pair is trading at 63.56 USDT on the 4-hour timeframe. The chart shows a strong downward trend, with the price falling from around 86 USDT to a recent low of 60.13 USDT. Although there has been a small recovery from the low, the overall market trend remains bearish. Increased selling volume during the decline indicates strong selling pressure. Key support lies near 60 USDT, while resistance is around 65 USDT and 68–70 USDT. In the short term, SOL may continue its rebound if it stays above support, but a break below 60 USDT could lead to further losses. Overall, the market is showing a minor bounce within a broader downtrend.#crypto #solana
3
209
Log in to explore more content
Join global crypto users on Binance Square
⚡️ Get latest and useful information about crypto.
💬 Trusted by the world’s largest crypto exchange.
👍 Discover real insights from verified creators.
Email / Phone number
Trending Topics
IsAnthropic’s$1.5TMarketCapJustified?
11,000 views
88 Discussing
Anthropic Set to Open at $105 in Record Nasdaq Debut
Binance News
·12 Likes
·15.2k views
BTCRemainsUnderPressureAfterHawkishFOMCMinutes
245,927 views
2,103 Discussing
NvidiaBoardReportedlySplitOverHuang’sReturn
119,708 views
1,139 Discussing